Article

Topographically Controlled Marangoni-Rayleigh-Bénard Convection in Liquid Metals

Department of Mechanical and Aerospace Engineering, University of Strathclyde, James Weir Building, 75 Montrose Street, Glasgow G1 1XJ, UK
*
Author to whom correspondence should be addressed.
Fluids 2021, 6(12), 447; https://doi.org/10.3390/fluids6120447
Submission received: 11 November 2021 / Revised: 29 November 2021 / Accepted: 6 December 2021 / Published: 10 December 2021
(This article belongs to the Collection Challenges and Advances in Heat and Mass Transfer)

Abstract

:
Convection induced in a layer of liquid with a top free surface by a distribution of heating elements at the bottom can be seen as a variant of standard Marangoni–Rayleigh–Bénard Convection where in place of a flat boundary at constant temperature delimiting the system from below, the underlying thermal inhomogeneity reflects the existence of a topography. In the present work, this problem is investigated numerically through solution of the governing equations for mass, momentum and energy in their complete, three-dimensional time-dependent and non-linear form. Emphasis is given to a class of liquids for which thermal diffusion is expected to dominate over viscous effects (liquid metals). Fixing the Rayleigh and Marangoni number to 104 and 5 × 10³, respectively, the sensitivity of the problem to the geometrical, kinematic and thermal boundary conditions is investigated parametrically by changing: the number and spacing of heating elements, their vertical extension, the nature of the lateral boundary (solid walls or periodic boundary) and the thermal behavior of the portions of bottom wall between adjoining elements (assumed to be either adiabatic or at the same temperature of the hot blocks). It is shown that, like the parent phenomena, this type of thermal flow is extremely sensitive to the specific conditions considered. The topography can be used to exert a control on the emerging flow in terms of temporal response and patterning behavior.

1. Introduction

Before being solid, many materials pass through a liquid state and the properties that they display in the final solid state often depend on the convective phenomena that are established in their liquid state. This concept applies to a variety of manufacturing and materials science applications. Whilst there are a plethora of materials that are of industrial relevance and importance due to the related technological applications and impact on world’s societies, silicon and other semiconductor materials have attracted a significant increasing interest especially during the late 20th and early 21st century. This interest partly stems from the abundance of these materials (especially silicon) on the surface of our planet. However, it also originates from some of the remarkable physical properties that these substances display, through which over the last 50 years specific technological applications have been enabled (leading to what nowadays is often referred to as the ‘silicon age’).
Single crystals of these substances are of great importance in the electrical and opto-electronic industries due to their ‘purity’. A single crystal, often also referred to as a mono-crystalline material is a pure crystal lattice. The purity of these mono-crystalline materials is essential in electronics applications as the purer the material, the better its performances will be. Vice versa, for the use of semiconductors in microprocessors, which operate on the quantum scale, the presence structural or chemical defects in the crystal lattice can prevent these materials from reaching the expected targets in terms of electronic performances.
These simple arguments explain why the convective processes that dictate the crystalline evolution of these substances have become a subject of great interest from both the engineering and physics standpoints. Convection within the melt can deeply influence microstructure formation in solidifying materials through its intrinsic transportation mechanisms of heat, mass and momentum and related studies show no obvious sign of reaching a limit yet. Given the difficulties in observing directly semiconductor melts and liquid metals due to their opacity, most of such studies are being based on alternate methods such as theoretical analysis and numerical simulations (see, e.g., Kaddeche et al. [1] and references therein). By virtue of them, it has been clarified that the branch of convection known as natural (buoyancy) convection, which is driven by gravity as a result of thermally induced density inhomogeneities in the liquid, plays a crucial role in such dynamics.
Landmark fundamental studies on the behavior of buoyancy convection in liquid metals date back to 1981 when this subject was investigated given its relevance to other (natural) problems such as the motion of liquid iron in Earth’s core and the ensuing generation of a magnetic field. Considering a physical domain as simple as an infinite layer of liquid metal uniformly heated at the bottom and cooled at the top, Busse and Clever [2], Clever and Busse [3,4,5] revealed that Rayleigh-Bénard (RB) convection in such systems is initially steady and then it undergoes bifurcation to an oscillatory flow as the Rayleigh number is increased. It was shown that the instability leads to the emergence of waves that travel in the fluid along a horizontal direction. These waves were also found numerically by McLaughlin and Orszag [6], Meneguzzi et al. [7], Thual [8] and Lappa [9]. It has been shown that superposition of these waves can also produce peculiar states known as ‘standing waves’, i.e., solutions where the disturbances do not travel in the fluid, but grow and shrink in time at fixed spatial positions.
Another line of inquiry has originated from the realization that if the fluid is not delimited by a solid wall at the top, i.e., it displays a free liquid-gas interface (which is often the case in most of the technological processes used for the production of the aforementioned single crystals, [10]), another source of convection is represented by surface tension and related gradients. Surface tension of many liquids (including semiconductor melts and liquid metals) depends on temperature. If the fluid is subjected to a temperature difference, this results in fluid motion, generally referred to as Marangoni-Bénard (MB) convection when the fluid is uniformly heated at the bottom. Unlike RB flow, which typically manifests in the form of parallel rolls extended in the horizontal direction (playing the role of substrate for the propagation of the aforementioned waves when a certain temperature difference is exceeded), Marangoni-Bénard convection is known for its ability to produce patterns with the hexagonal symmetry. In the case of liquid metals, these hexagonal cells are featured by rising currents along their boundary and a central column of descending fluid (a structure known as an “inverted hexagon” to distinguish it from the companion case in which these cells form in oils and display fluid rising at the center, see, e.g., Thess and Bestehorn [11]; Parmentier et al. [12]; Boeck and Thess [13]). On increasing the related characteristic (Marangoni) number, this topology can be taken over by different patterns, such as stationary two-dimensional rolls either with the roll axes parallel to the short domain boundary or in two different oblique orientations. Time-dependent solutions are also possible, namely three-dimensional (3D) travelling waves.
All of these phenomena can have a detrimental impact on the quality and purity of the crystalline materials discussed before. That is why, in general, attempts are made to control these flows and the related hierarchy of bifurcations through magnetic fields or other methods such as the application of vibrations ([14,15] and all references therein).
Most surprisingly, despite all these valuable studies, very few pieces of literature have appeared where an attempt has been made to ‘control’ these forms of convection through alteration of their ‘boundary conditions’, i.e., by using containers with walls that display a given topography and/or a structured thermal inhomogeneity. The problem of planform selection in such conditions has long been a theoretical puzzle.
As a first step in this direction, the present study is devoted to the numerical investigation (in the framework of DNS, i.e., direct numerical simulation) of hybrid buoyancy-Marangoni convection in a layer of liquid metal cooled at the top by an adjoining gas phase and heated at the bottom by a discrete distribution of heating elements (cubic blocks). The main objective is an understanding of the relationships existing between the imposed thermal forcing and the properties of the emerging flow.

2. Mathematical Model

2.1. The Geometry

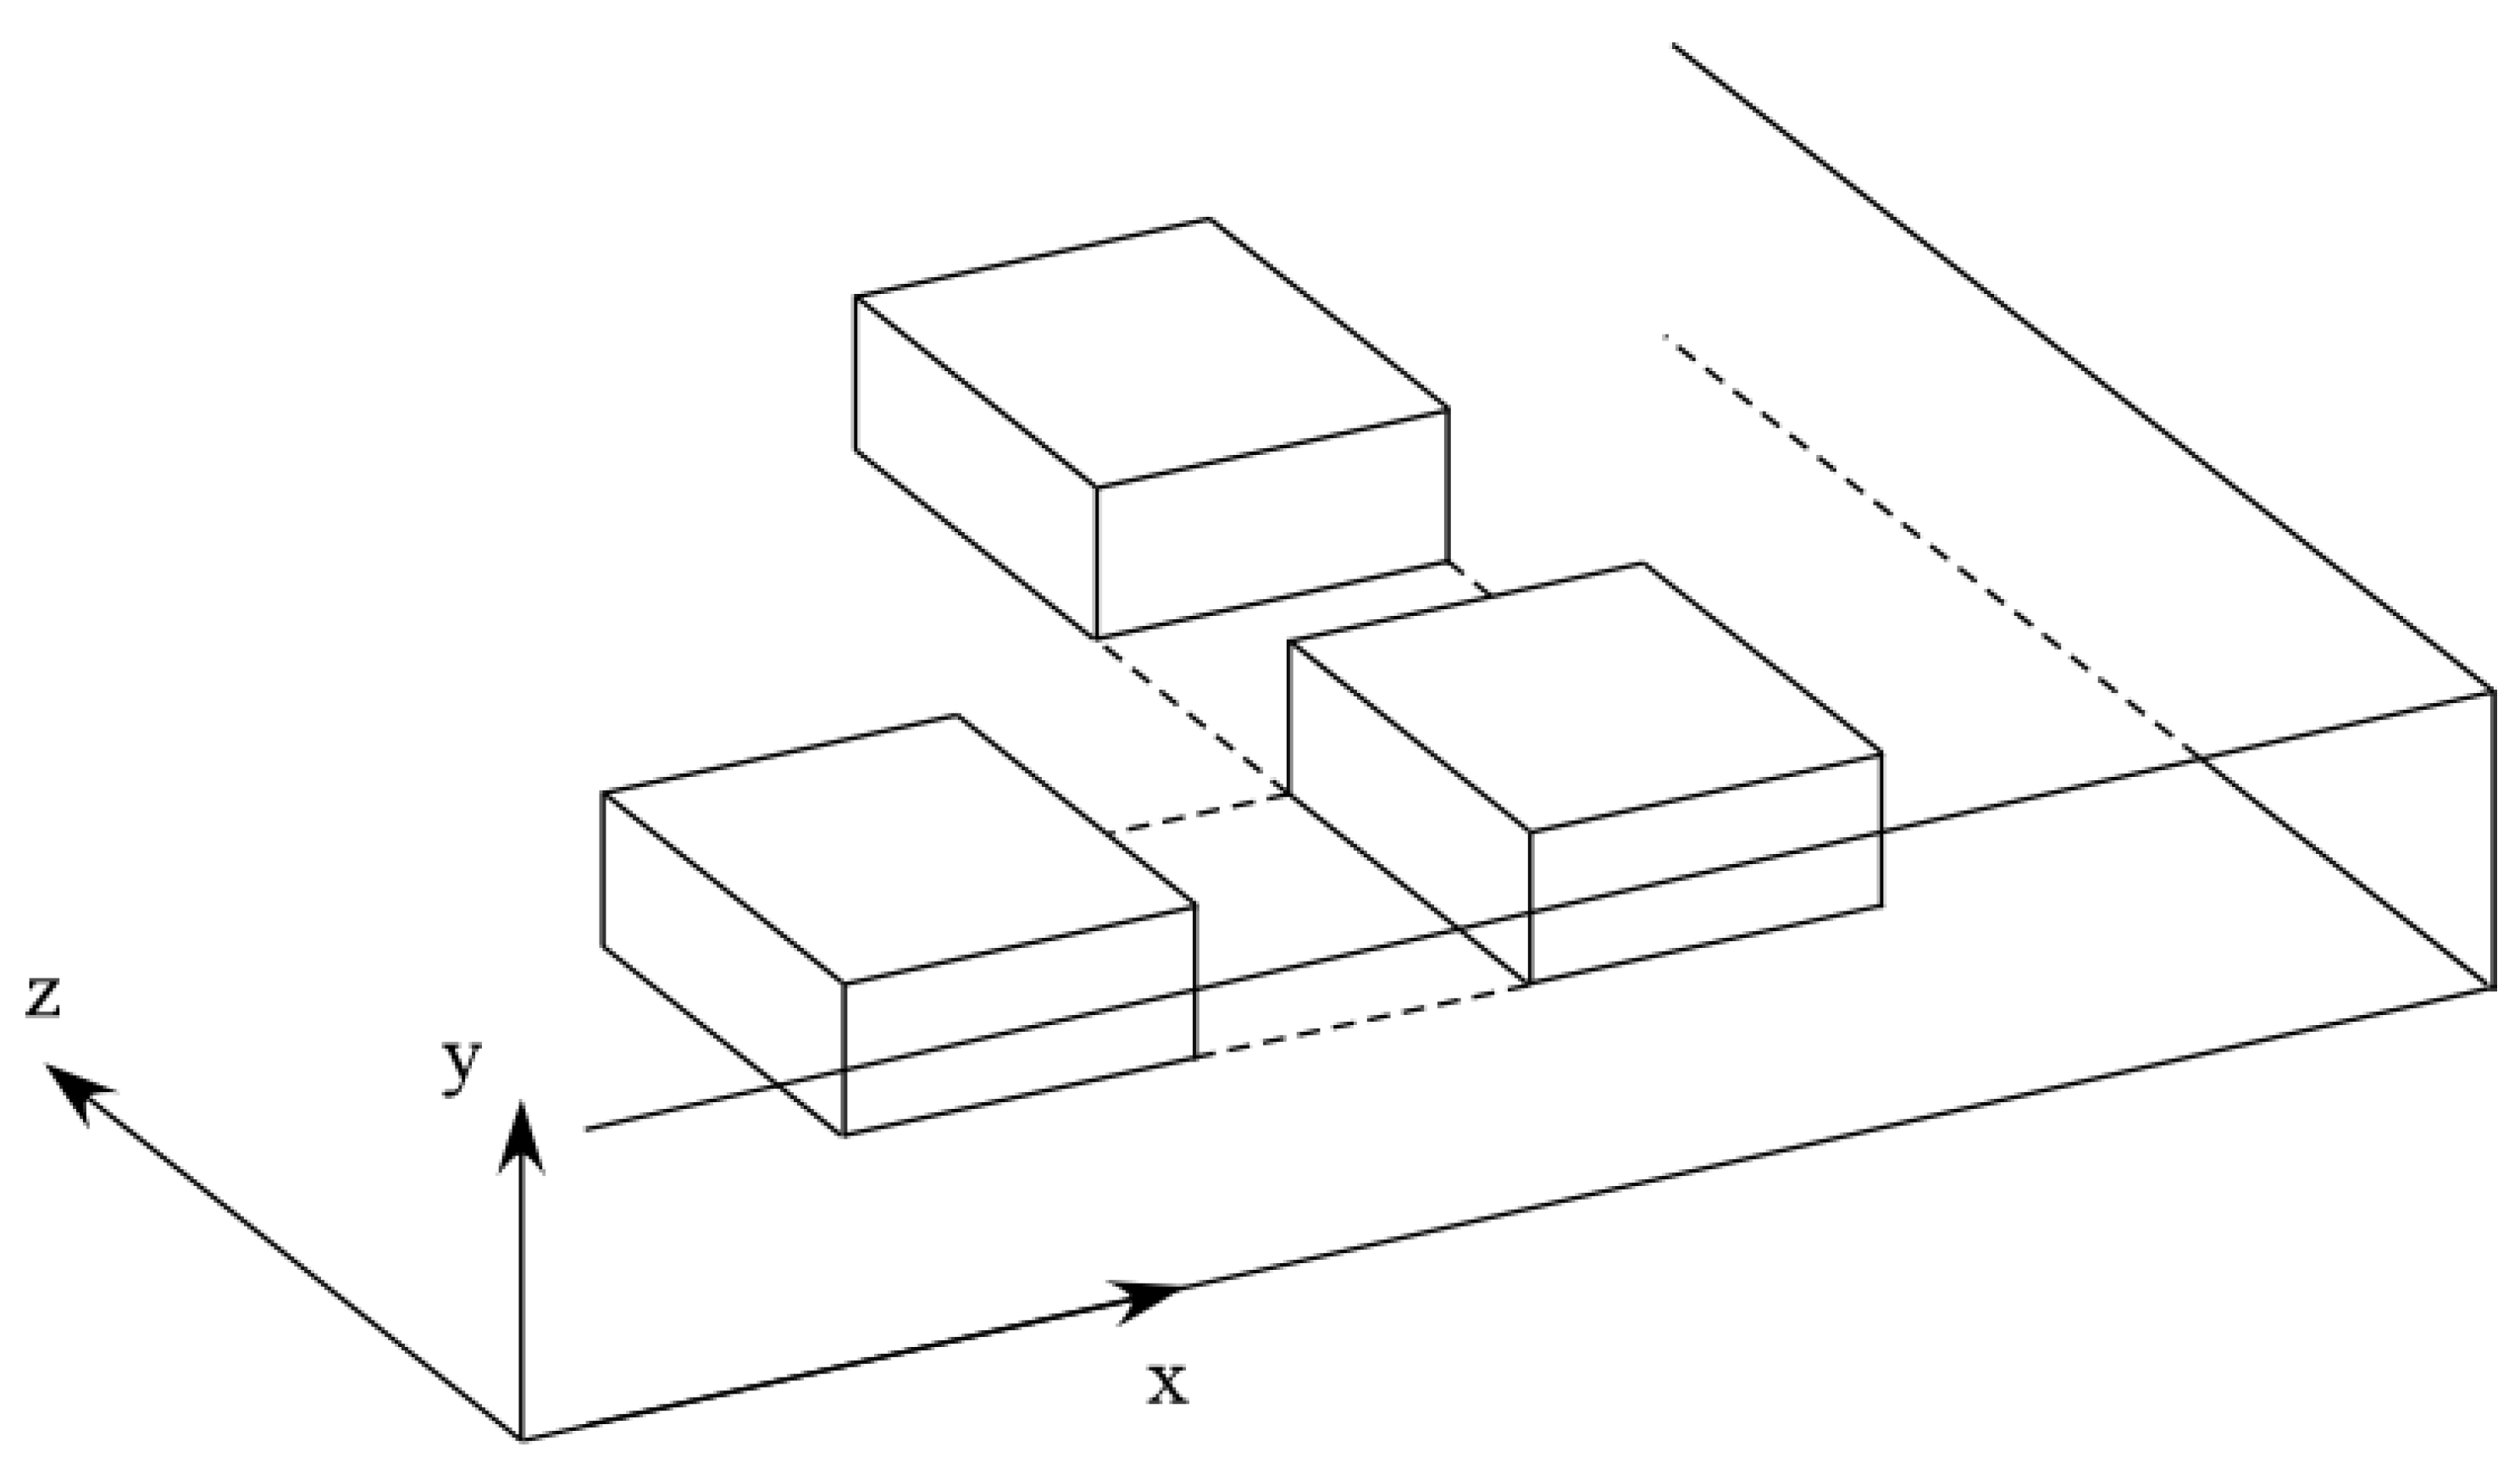
As illustrated at the end of the introduction, the distinguishing mark of the present study is the ‘patterned’ surface delimiting the considered liquid from below. More precisely, a fixed topography is imposed at the bottom consisting of wall-mounted hot rods with square cross-section (having side length h o r i z ) and thickness v e r t . A series of such box-shaped blocks, regularly arranged in space is implemented along both the x and z (horizontal) directions, as shown in Figure 1. As evident in Figure 2, this results in a bottom wall with N × M elements mounted on it, which protrude vertically (along the y axis) into the liquid. The free surface is cooled by an adjoining gas phase. The cooling is described in the framework of the one-layer model by a Biot-type boundary condition. The height of the blocks is variable but remains below the layer depth. The number (spacing) of blocks can also be changed.
It is clear that a strong link with standard forms of convection such as those described in the introduction, should be invoked since the beginning. The blocks will indeed provide the required energy (heat) for the activation of the aforementioned mechanisms of convection based on the dependence of density and/or surface tension on temperature. Along these lines and for the sake of completeness, we consider both situations in which the floor (the portions of flat bottom boundary between adjoining elements) is either adiabatic or set at the same temperature Thot of the blocks (hot floor case).
For simplicity, however, the free surface separating the liquid from the external gas environment is assumed to be flat and undeformable. This assumption reflects practical situations in which the so-called Galileo and Capillary numbers are relatively small (see, e.g., [16,17] and references therein for additional arguments about this point). These can be expressed as Gac = µVrρgd2 and Ca = µVr/σ, respectively, where g is the gravity acceleration, d is the characteristic depth of the fluid layer, Δρρ is the difference between the density of the liquid ρ and that of the overlying gas, μ is the liquid dynamic viscosity, σ is the surface tension and Vr is a characteristic flow velocity, which reads as Vg = ρgβTΔTd2/µ or VMa = σTΔT/μ depending on the dominant driving force, be it buoyancy or the Marangoni effect (βT and σT being the thermal expansion coefficient and the surface tension derivative with respect to temperature, respectively; ΔT being a characteristic temperature difference). It is known that if these numbers are smaller than 1, the order of magnitude of the non-dimensional deformation δ of the free surface due to viscous forces can be estimated as δ = O(Gac) or δ = O(Ca), respectively. Following a common practice in the literature, the interface can therefore be considered flat and undeformable provided Gac << 1 and/or Ca << 1 (see again [16,17] and references therein).

2.2. The Governing Equations

The problem briefly defined in Section 2.1 is addressed through solution of the partial differential equations which account for the conservation of mass, momentum and energy under the assumption of incompressible flow (complemented with the Boussinesq approximation). As specified at the end of the introduction, no turbulence model is used. Moreover, as in earlier studies on classical RB and MB convection, the equations are solved in non-dimensional form, that is, length, time and the primitive variables (velocity V, pressure p and temperature T) are divided by relevant reference quantities. Scaling the Cartesian coordinates (x,y,z), time (t), velocity (V), pressure (p) and temperature (T) by the reference quantities d, d2/α, α/d and ρα2/d2, and ΔT respectively (where α is the liquid thermal diffusivity and ΔT is, the difference between the temperature of the hot solid elements and the ambient temperature Tref), in particular, the following form is obtained:
_ V _ = 0
V _ t = _ p _ V _ V _ + Pr 2 V _ + Pr R a T i g _
T t + _ V _ T = 2 T
The parameter Pr appearing there is the well-known Prandtl number (namely, the ratio of the fluid kinematic viscosity v = µ/ρ and the aforementioned thermal diffusivity α), Ra = TΔTd3/vα is the standard Rayleigh number and ig is the unit vector along the direction of gravity.
In the present study, the gradients of surface tension are also present, and these are taken into account through a dedicated equation obtained imposing that they have to balance the viscous shear stresses at the free surface of the layer. Considering the shear stress in the external gas negligible, such relationship can be cast in condensed non-dimensional form as:
V _ S n = M a _ S T
where n is the direction perpendicular to the free interface (planar in our case), _ S is the derivative tangential to the interface and Vs is the surface velocity vector. Moreover, Ma is the Marangoni number defined as Ma = σTΔTd/µα.
Additional degrees of freedom are represented by purely geometrical parameters, namely:
δ h o r i z = h o r i z d ,   δ v e r t = v e r t d ,   A b a r = δ v e r t δ h o r i z
A x = L x d , A z = L z d
While the first group can be used to characterize the blocks aspect ratio, the second refers to the entire fluid domain (where Lx and Lz are the (dimensional) horizontal extensions of the layer along x and z, respectively). By denoting with N the number of blocks along z and by M the corresponding number along x, the nondimensional distance between adjoining elements can therefore be written as:
ξ x = L x M x M d = A x M δ h o r i z ,   ξ z = L z N z N d = A z N δ h o r i z
As a result, in the considered coordinate system, the coordinates of each block simply read:
( i 1 ) δ h o r i z + i 1 2 ξ x x ( i ) δ h o r i z + i 1 2 ξ x f o r 1 i M 0 y δ v e r t ( k 1 ) δ h o r i z + k 1 2 ξ z z ( k ) δ h o r i z + k 1 2 ξ z f o r 1 k N
where we assume:
V = 0 (no slip conditions) and T = 1
Moreover, for the space between elements, adiabatic or constant temperature conditions are set at the bottom (y = 0), i.e.,
T y = 0
or
T = 1
Finally, the classical Biot-type boundary condition is used to account for the heat exchange occurring between the liquid and the external gas (at y = 1):
T y = B i T
No-slip and adiabatic conditions or periodic boundary conditions (PBC) are imposed at the lateral boundaries. At the initial time t = 0, the flow is motionless and at the same temperature as the external gas, that is, T = 0. As time passes, its temperature increases as a result of the heat being exchanged with the heated elements until an equilibrium (steady or oscillatory) state is attained.
In the present work, such heat exchange is quantitatively substantiated using properly defined non-dimensional parameters, namely the Nusselt numbers for the lateral, top or total surface of each heated element, i.e.,
N u b a r l a t e r a l s u r f a c e i k = 1 ( 2 δ h o r i z δ v e r t + 2 δ h o r i z δ v e r t ) 0 δ v e r t x i x i + δ h o r i z T z z = z k d x d y 0 δ v e r t x i x i + δ h o r i z T z z = z k + δ h o r i z d x d y + 0 δ v e r t z k z k + δ h o r i z T x x = x i d z d y 0 δ v e r t z k z k + δ h o r i z T x x = x i + δ h o r i z d z d y
N u b a r t o p i k = 1 δ h o r i z 2 z k z k + δ h o r i z x i x i + δ h o r i z T y y = δ v e r t d x d z
N u b a r i k = N u b a r l a t e r a l s u r f a c e i k ( 2 δ h o r i z δ v e r t + 2 δ h o r i z δ v e r t ) + N u b a r t o p i k δ h o r i z 2 ( 2 δ h o r i z δ v e r t + 2 δ h o r i z δ v e r t ) + δ h o r i z 2
where x i = ( i 1 ) δ h o r i z + i 1 2 ξ x and z k = ( k 1 ) δ h o r i z + k 1 2 ξ z .
The multiple values taken by these parameters for the different blocks are finally combined into a single space averaged values using the following relationships:
N u s i d e a v e r a g e = 1 N M k = 1 N i = 1 M N u b a r l a t e r a l s u r f a c e i k
N u t o p a v e r a g e = 1 N M k = 1 N i = 1 M N u b a r t o p i k
N u b a r a v e r a g e = 1 N M k = 1 N i = 1 M N u b a r i k

3. Numerical Method

Integration of Equations (1)–(3) supplemented with the proper initial and boundary conditions described in Section 2 allows for the unknown pressure (p), velocity (V), and temperature (T) fields to be determined. In the present work these equations have been integrated in the framework of a projection method. The details of such approach and the related time-marching algorithm have already been illustrated in several earlier papers of the present authors and, for this reason, they are not duplicated here [18,19]. Here we limit ourselves to recalling that the foundations of this category of methods have been laid by Gresho [20] and further developed by [21,22,23,24,25]. Here schemes that are explicit in time have been used in combination with central difference and the QUICK schemes for the diffusive and convective terms appearing in the equations, respectively.

3.1. Validation

The numerical method has been validated through comparison with relevant results in the literature. In particular, the ability of the algorithm to reproduce the critical value of the Marangoni number needed for the onset of classical MB convection has been verified through correlation with available data obtained using the LSA approach (Linear Stability Analysis). Moreover, with regard to the second driving force involved in the considered problem (buoyancy), the earlier study by Biswas et al. [26] has been considered, where pure thermal convection was numerically simulated assuming a heated element with rectangular shape included into (located on the bottom of) a square cavity with adiabatic bottom boundary and cold (isothermal) top and lateral walls.
The outcomes of such comparisons are reported in Table 1 and Table 2, respectively.
In particular, Table 1 provides the so-called disturbance growth, i.e., the constant inclination (derivative) of the curve that describes the evolution of the logarithm of the maximum velocity versus time as a function of the Marangoni number. It also includes (see the last row) the value of the critical Marangoni number determined by extrapolating (through a quadratic law) the disturbance growth rate to zero (neutral conditions). This value of the critical Marangoni number is in very good agreement with that obtained with the LSA approach (Pearson [27]; Colinet et al. [28]), the difference being approximately 1.5%. For the convenience of the reader, we wish to recall that the definition of the Marangoni number used for this assessment is slightly different with respect to that introduced in Section 2.2 (and used in Section 4) because it relies directly on the temperature difference which would be established without convection between the top and bottom boundaries of the liquid layer, whereas in Section 2.2, Ma was based on the difference ΔT between the temperature of the hot surfaces and that of the gas located at a certain distance from the liquid surface (assumed to maintain a constant temperature in time).
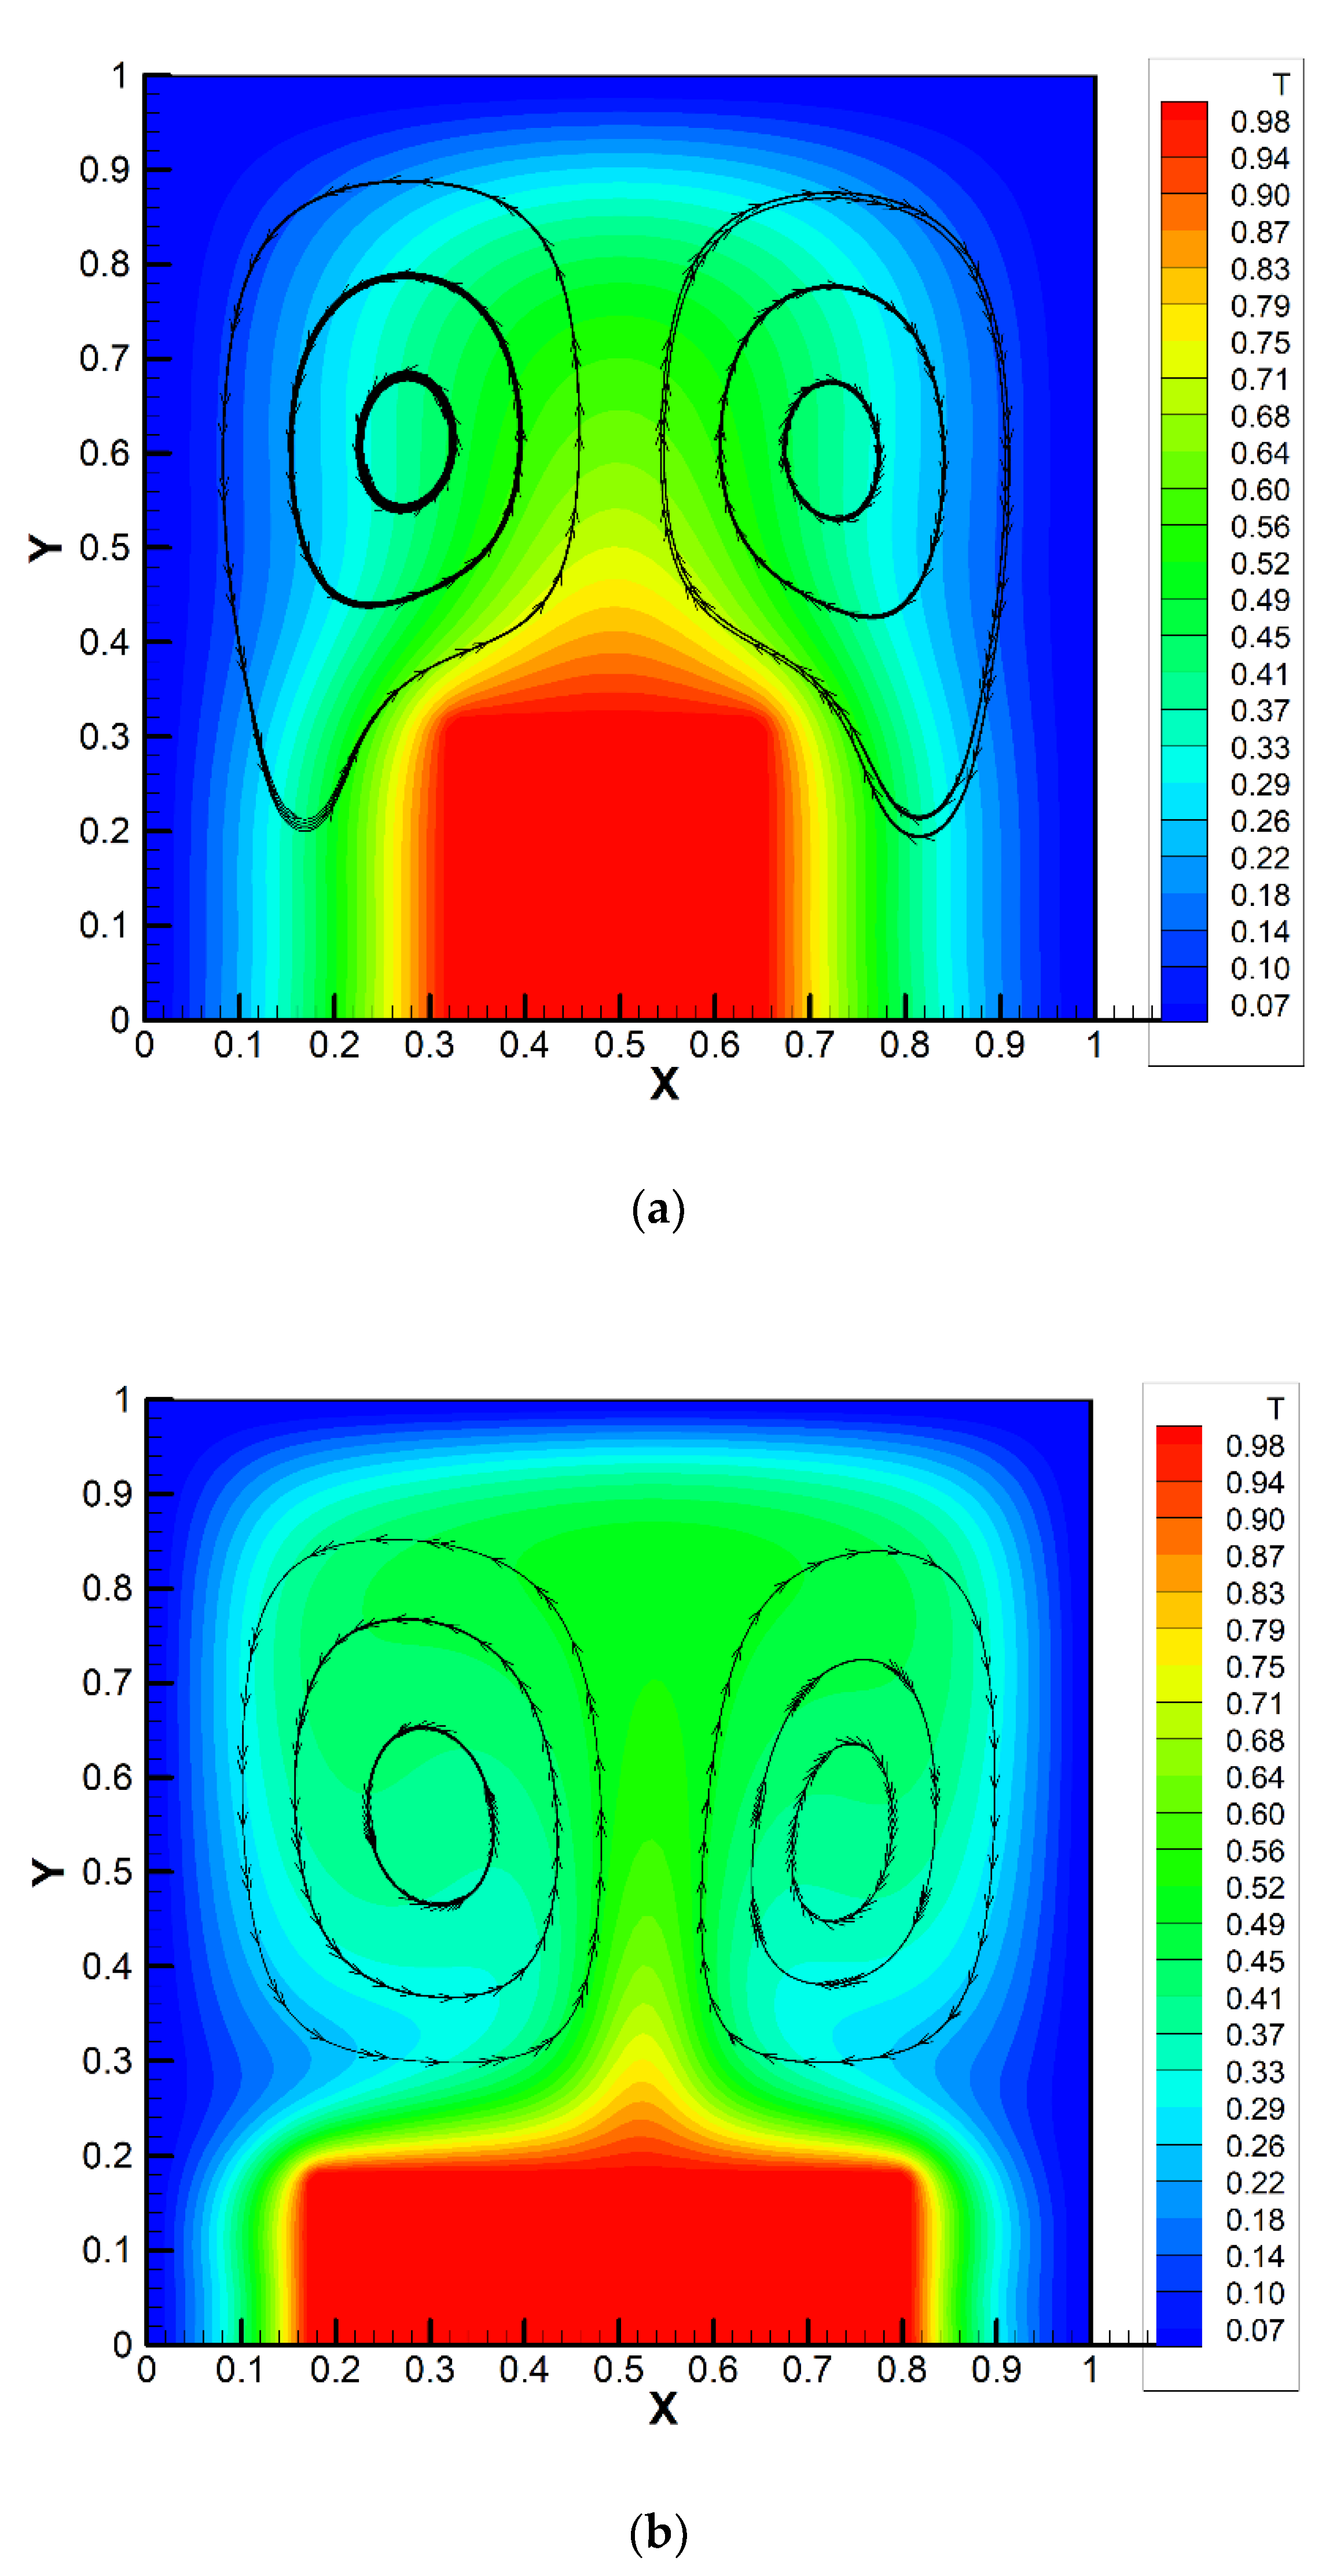
The comparison with the results by [26] is shown in Table 2 and Figure 3. Again, it can be seen that the departure of the present results from those in the literature is negligible. In such a context, we would also like to highlight that the numerical method (and related algorithm) used in this study, has already been exploited in previous investigations of the present authors for a variety of situations involving buoyancy and surface-tension driven convection (see, e.g., [16,17]), where they were verified against other relevant benchmarks and test cases (this information is not duplicated here for the sake of brevity).

3.2. Grid Refinement Study

A grid refinement study can generally be seen as a trade-off between the opposite needs of maximizing accuracy and ‘containing’ the computational cost. This becomes particularly useful in circumstances (like those considered in the present work) where, given the intrinsically 3D nature of the problem and the long ‘physical’ time needed by the emerging flow to saturate its amplitude, even a small decrease in the grid density can lead to significant benefits.
The outcomes of such an assessment are reported in Table 3. As the reader will realize by inspecting this table a resolution of 130 × 130 × 30 can be considered more than sufficient for the values of Ra and Ma (104 and 5 × 10³, respectively) considered in the present work.

4. Results

Not to increase excessively the dimensionality of the space of parameters (but without loss of generality) we have concentrated on a fixed horizontal extension of the fluid domain (assumed to be a layer with identical length along x and z, namely Ax = Az = 10). As the blocks have a square cross-section (δhoriz = 1), this naturally implies that the discrete distribution of blocks can be directly mapped into a square matrix having dimensions N × N where N can be set as an input parameter for the simulations. As another degree of freedom, a variable thickness has been considered for the blocks, with δvert spanning the range 0.5 ≤ δvert ≤ 0.7.
Moreover, the response of these systems has been examined for three distinct values of the Prandtl number Pr ≤ 1, namely Pr = 0.01, 0.1 and 1 (the first two being representative of liquid metals or semiconductor melts, the last one corresponding to the companion case of molten salts).
With the selected number of points, each simulation has taken a time ranging between one and four weeks.
In the following, for the sake of clarity, the results are presented in three segregated sections, where the influence of each of the considered degrees of freedom is examined while keeping all the other parameters fixed. Accordingly we start with the default case corresponding to pure silicon (Pr = 0.01) with a 3 × 3 distribution of elements (N = 3). For this case the variations are induced by a change in the height of the blocks and/or a variation in the considered boundary conditions. As illustrated in Section 2, the floor can be adiabatic or set at the same temperature of the blocks (hot floor), the lateral boundary can be solid and adiabatic or treated as a cyclic (or periodic) boundary condition (PBC).

4.1. Silicon Melt with Variable Block Height

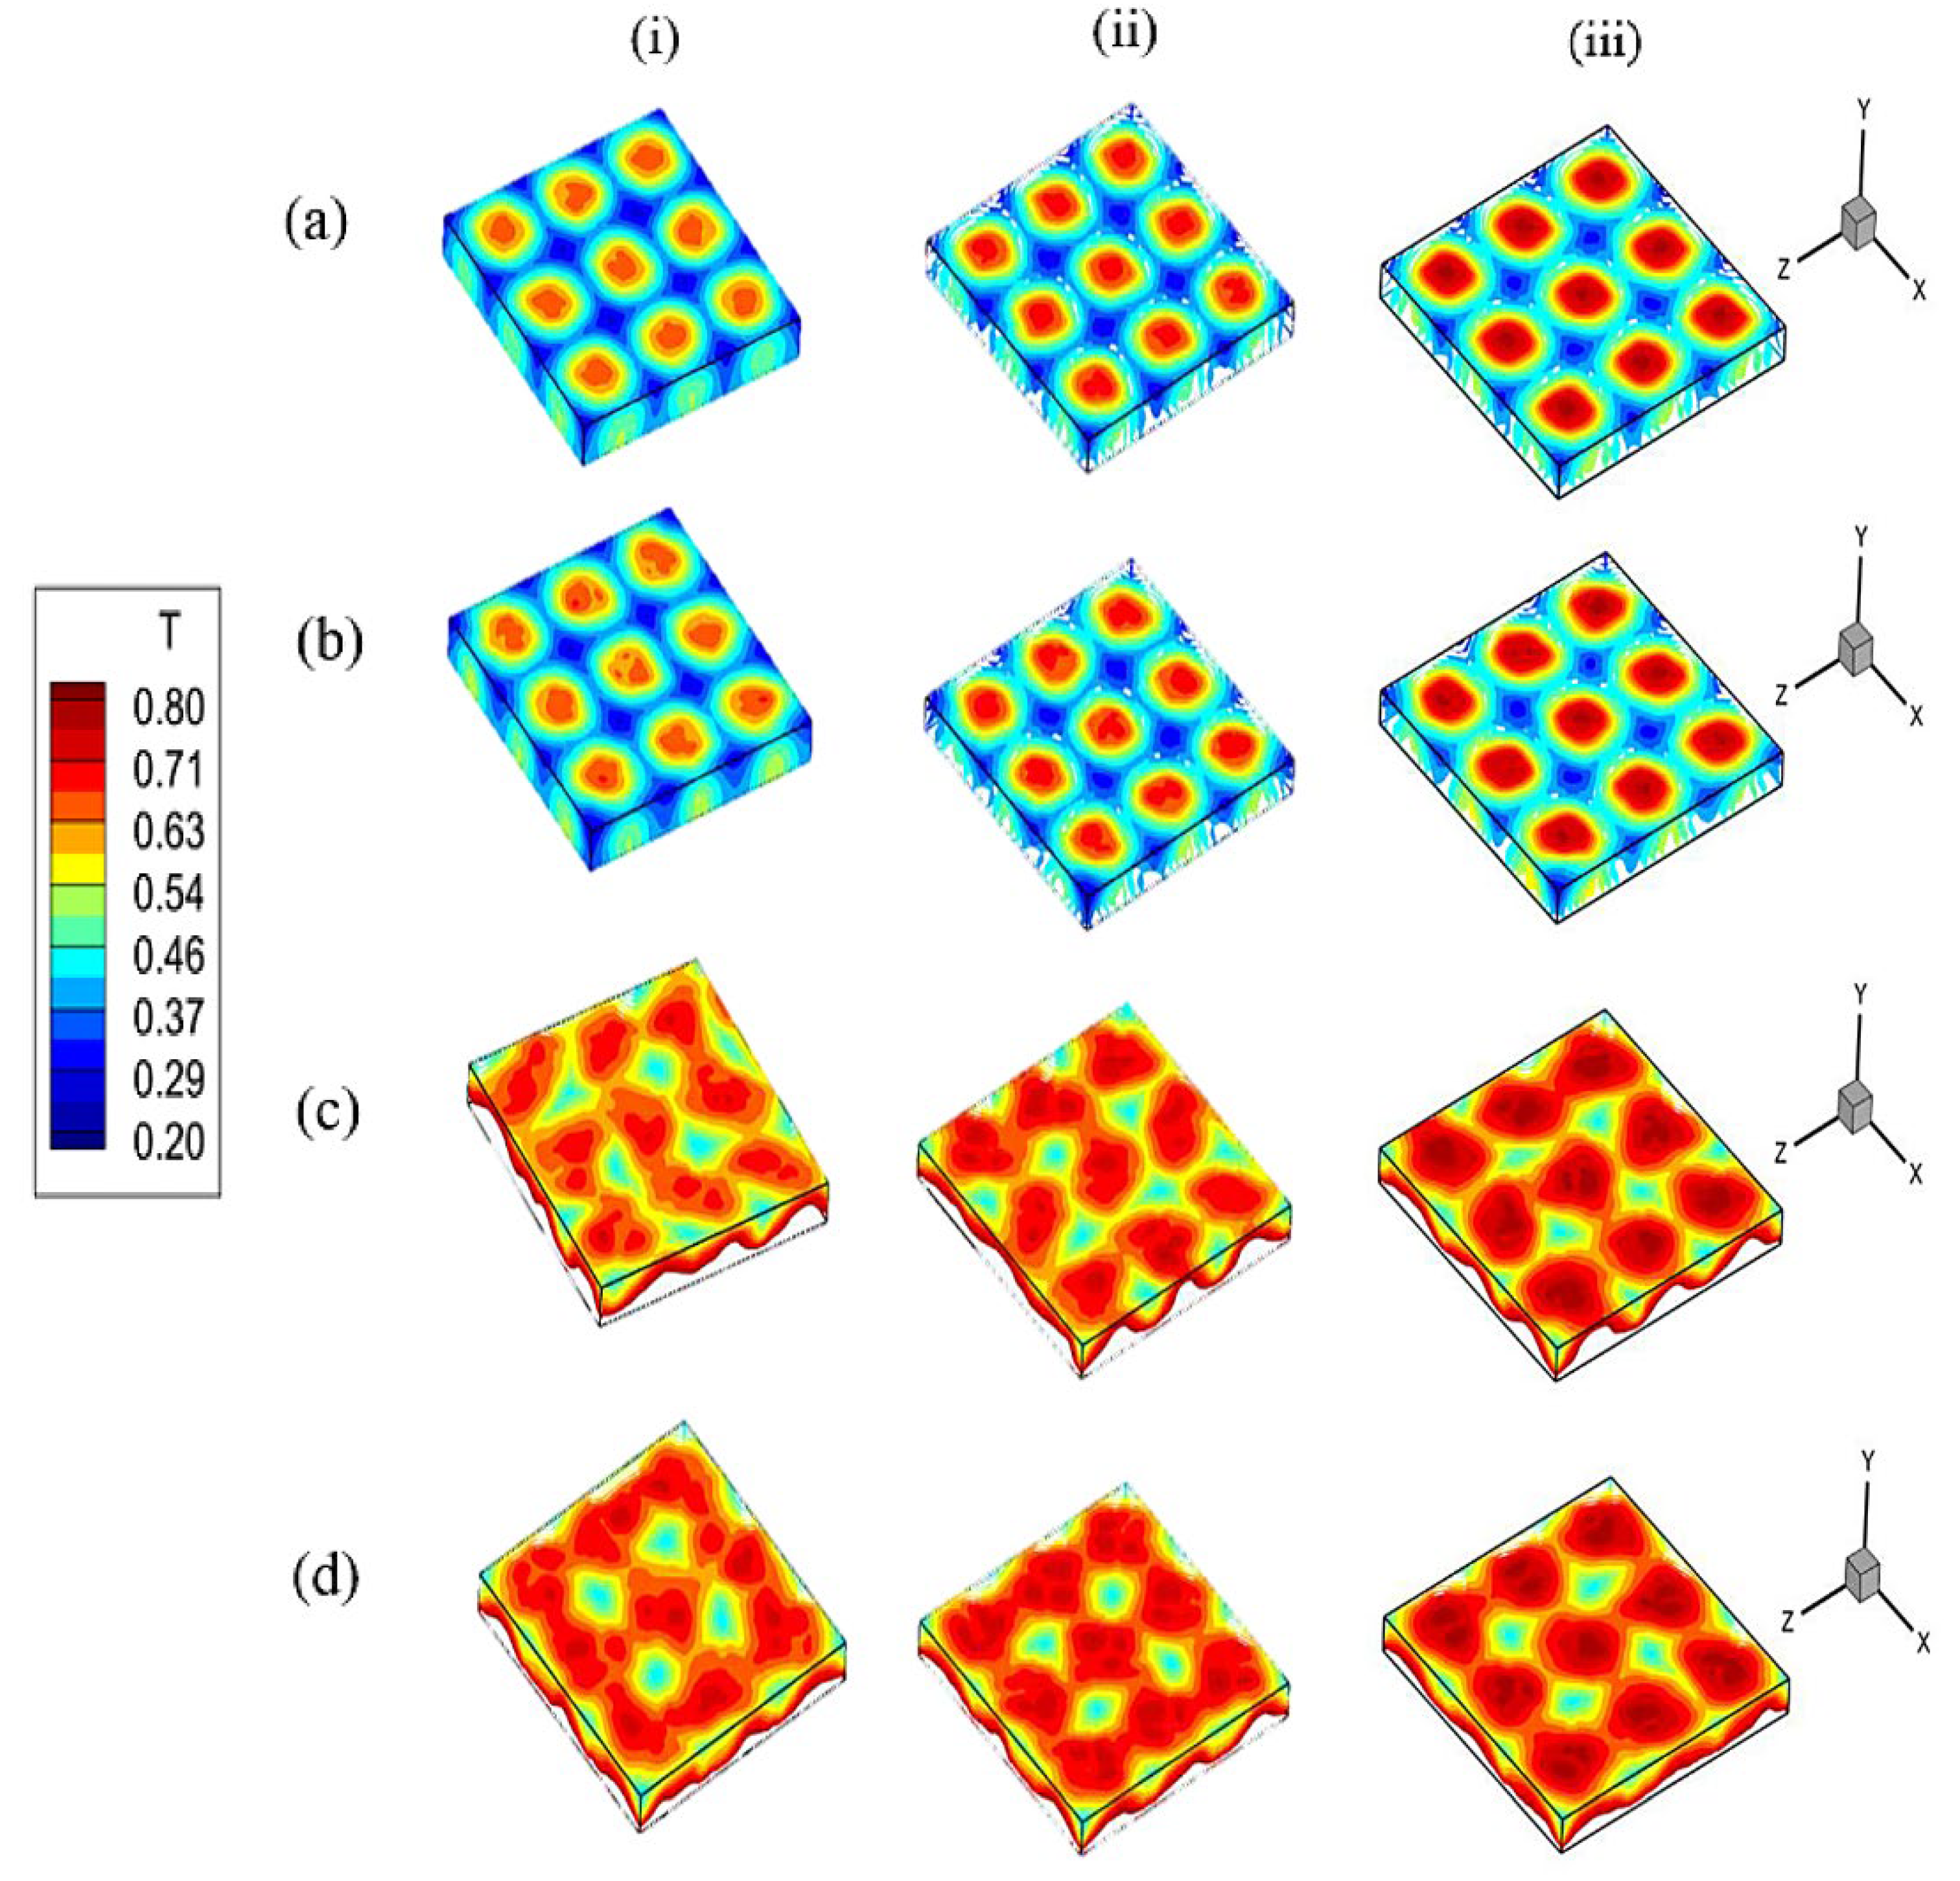
Figure 4 provide a first glimpse of the related patterning behavior in terms of 3D structure of the temperature field. It can be seen that, in general, regardless of the considered boundary conditions at the bottom and at the domain side, a distribution of hot spots can be identified at the free surface. Comparison of the results for a fixed value of δvert (aligned along columns in Figure 4) is instrumental in showing that a replacement of the adiabatic condition at the bottom with a hot floor generally leads (as expected) to an increase in the average temperature of the system and the temperature of the surface spots. Replacement of the solid lateral wall with PBC does not seem to have a big influence if the floor is adiabatic, whereas it can lead to a slightly more disordered pattern if PBCs are considered.
An increase in the vertical block extension, obviously makes the temperature of the surface spots higher as the distance between the top of the blocks and the free interface becomes smaller (see the results aligned along rows in Figure 4).
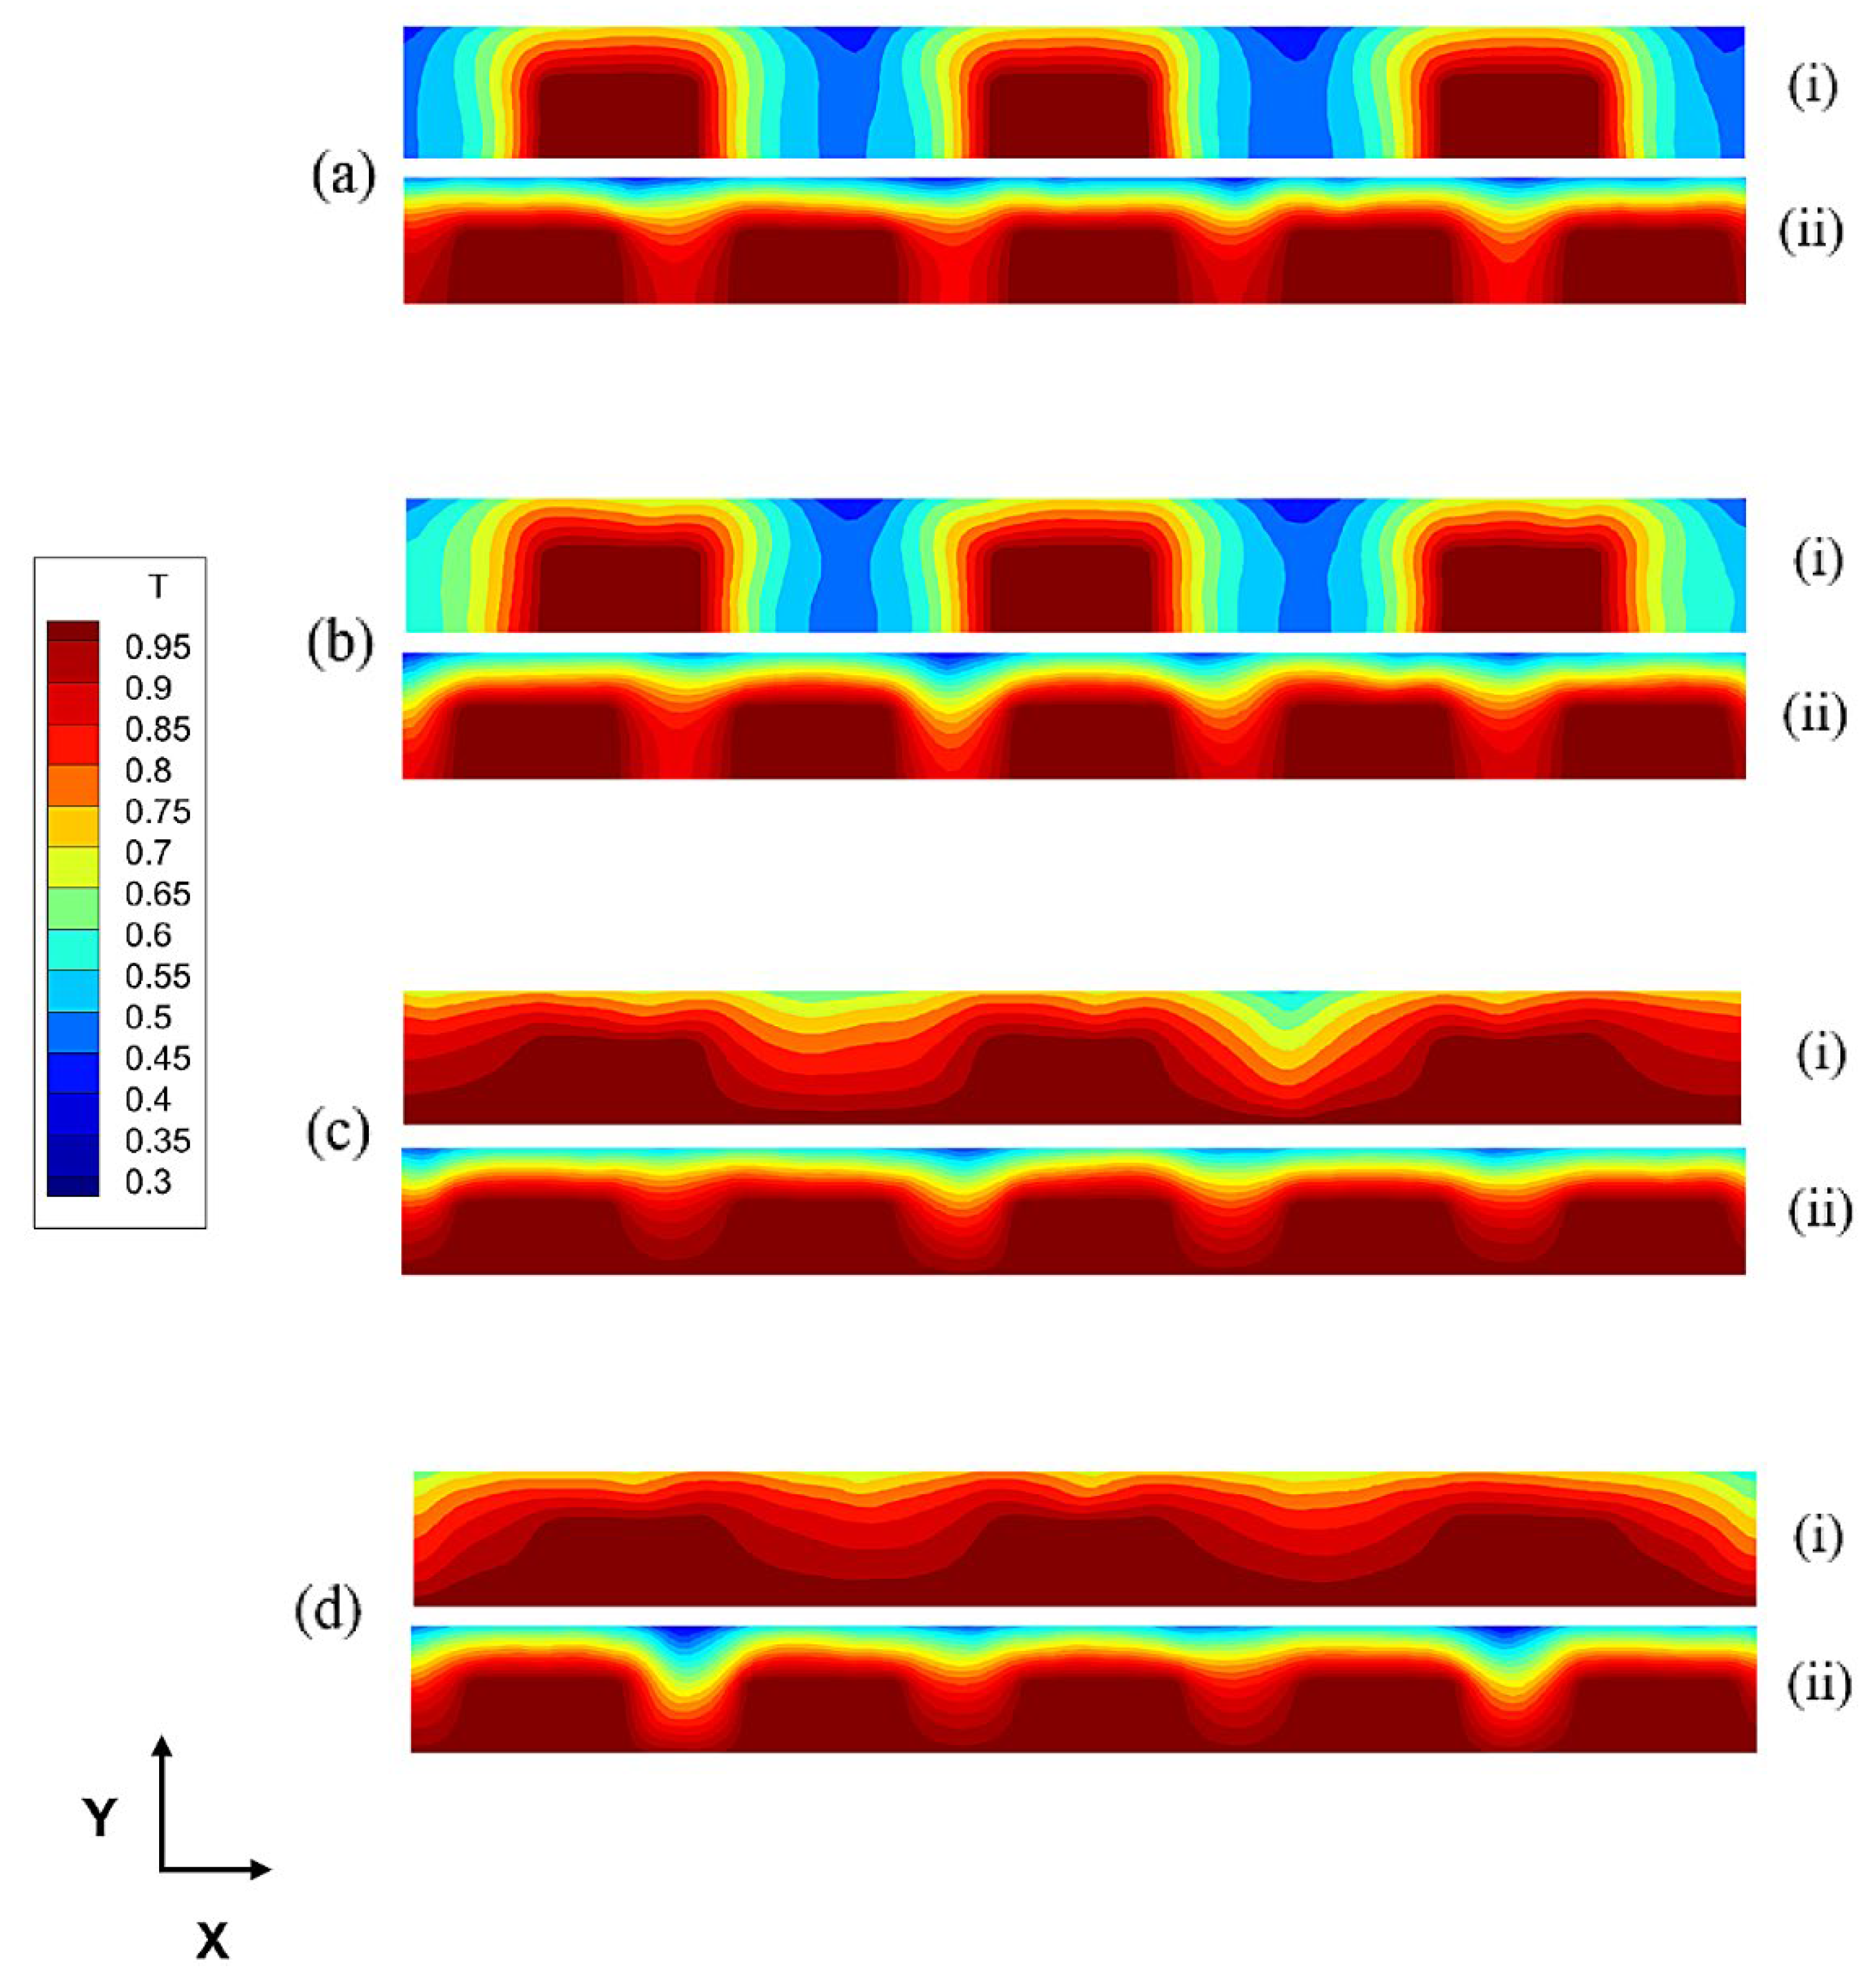
These results are naturally complemented by those reported in Figure 5 and Figure 6. The former shows the corresponding temperature maps in a transversal section (plane xy), the latter concerns the velocity field. These confirm the trends discussed before in terms of expected rise in the temperature when the hot floor is considered, or the height of the blocks is increased.
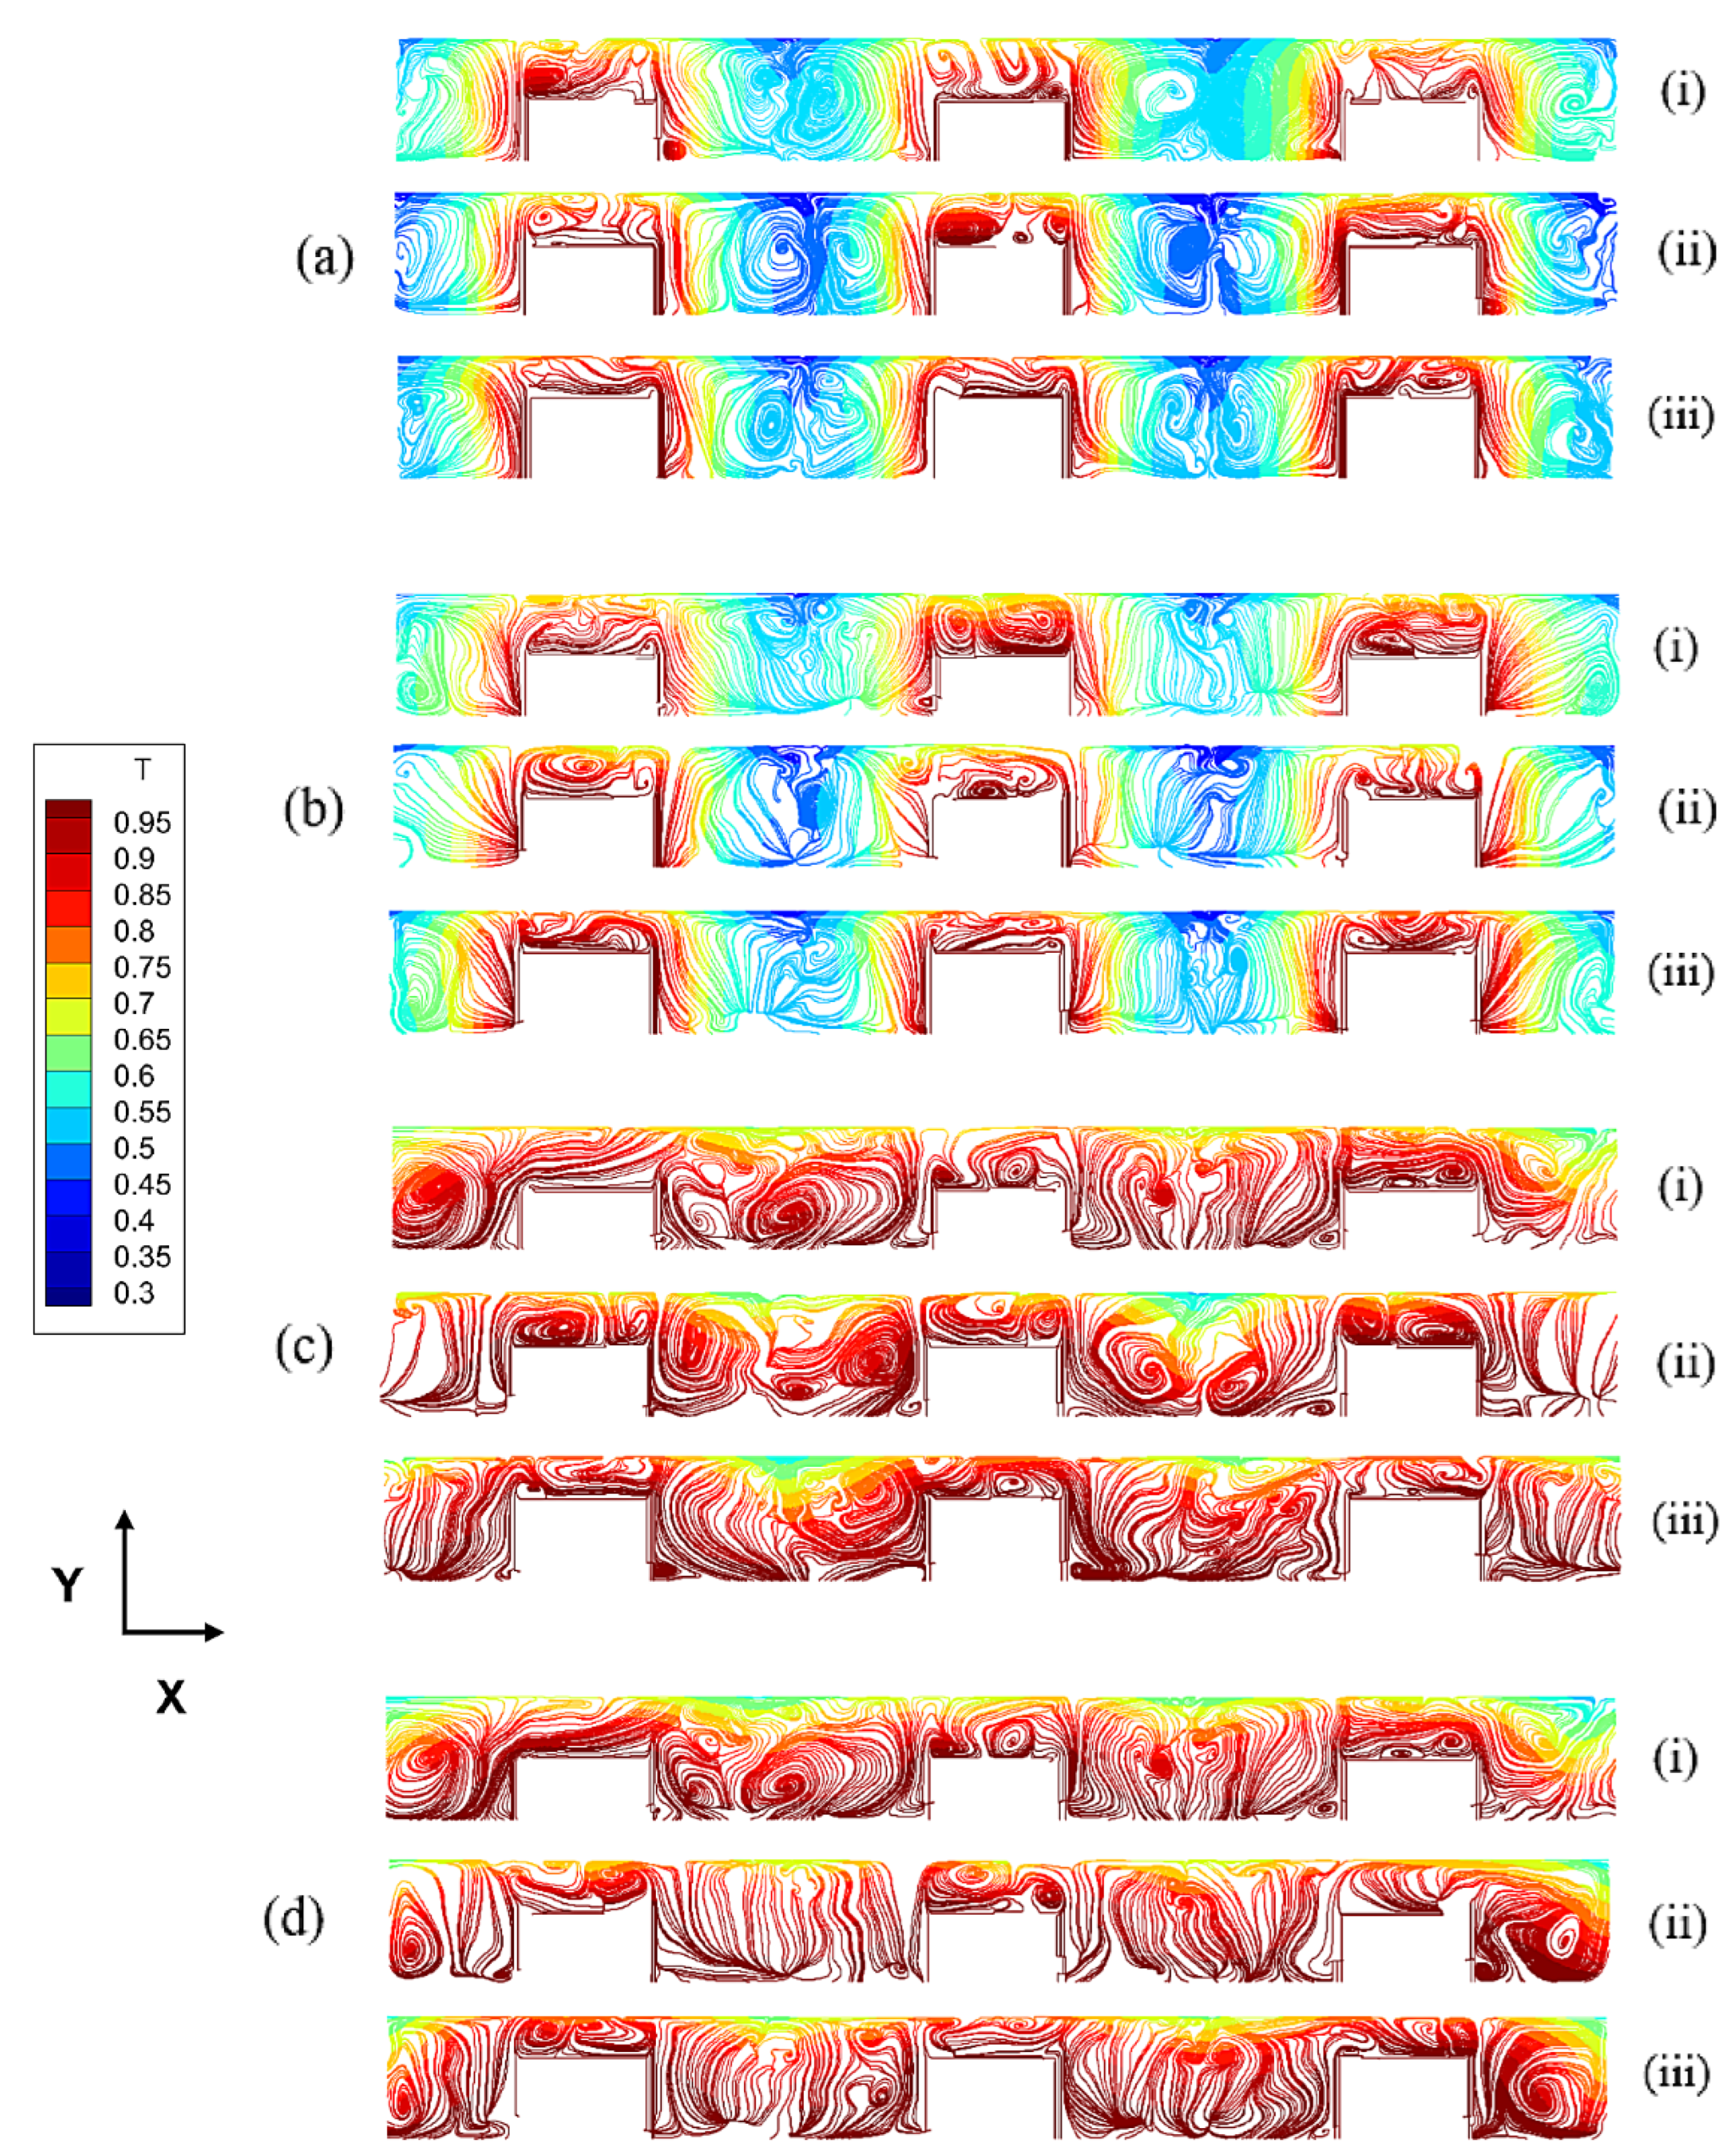
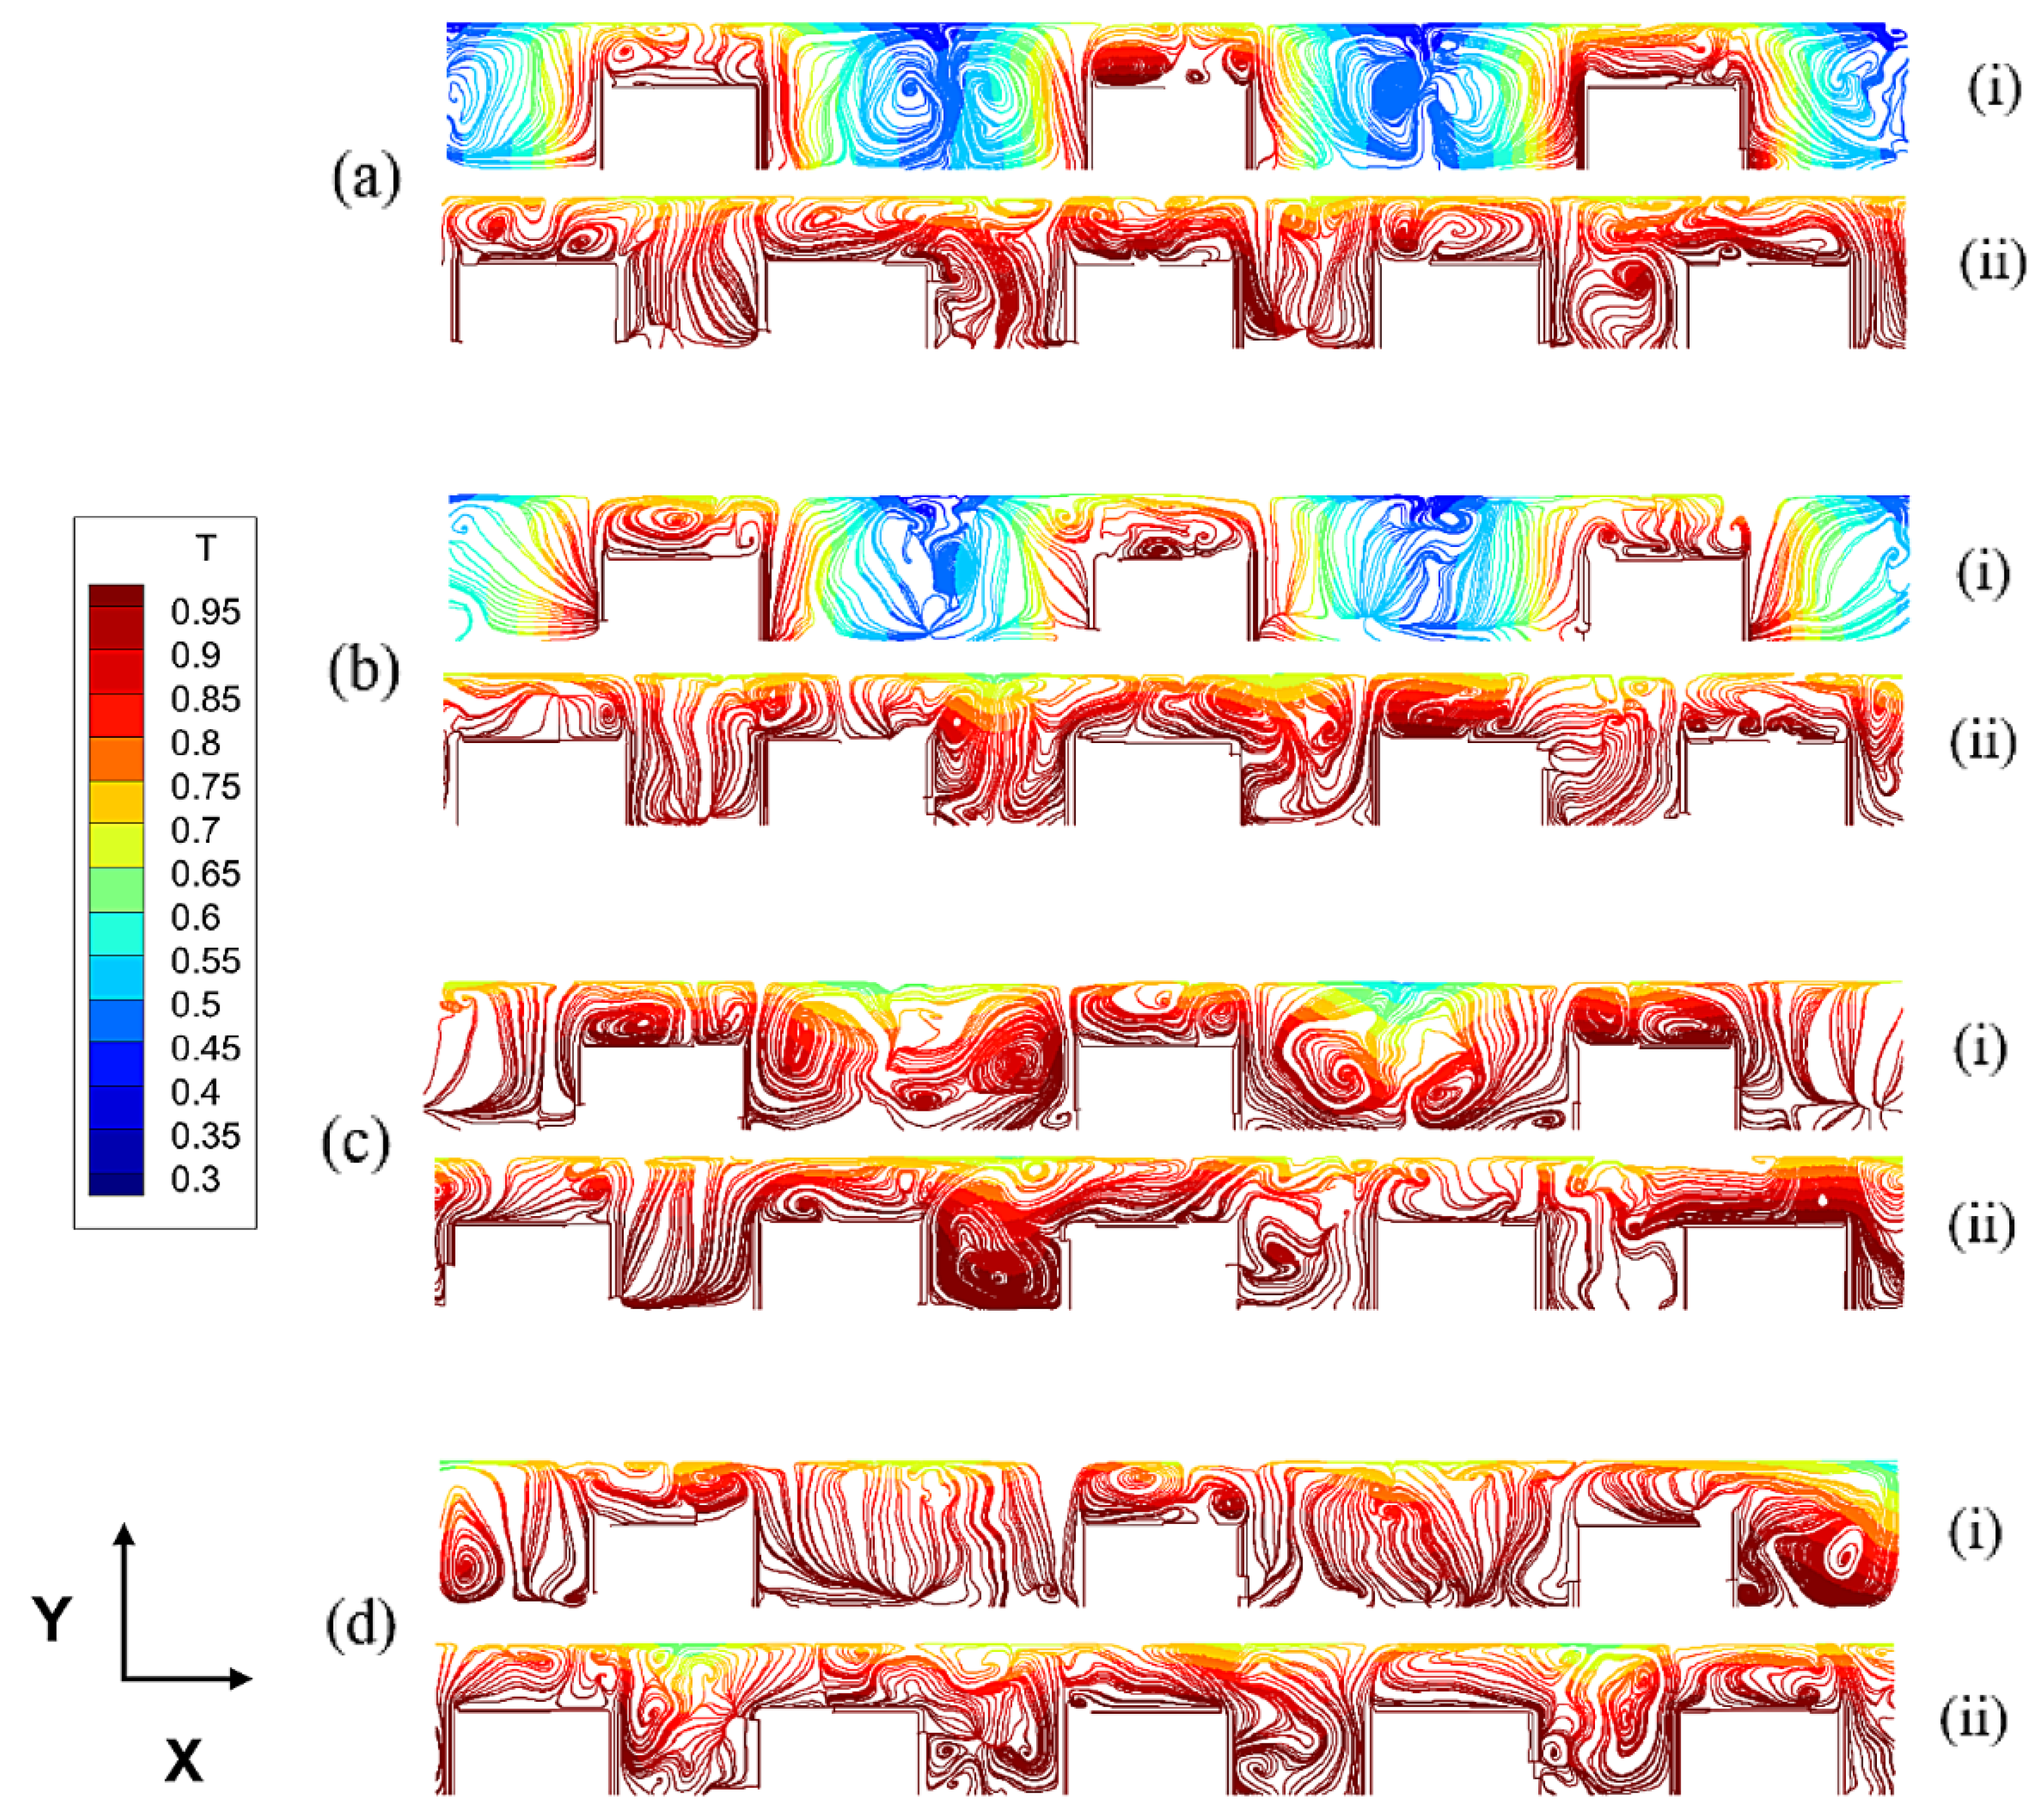
In particular, as qualitatively substantiated by Figure 6, the velocity field can be more complex than the corresponding temperature distribution. As the reader will realize by inspecting this figure (showing the lines tangent to the projection of the instantaneous velocity field on the z = Az/2 midplane, colored according to the corresponding distribution of temperature), the topology of such streamlines is quite intricate with vorticity being present in the form of more or less extended eddies both in the regions above the blocks and in the space between them (the former being reduced as δvert is increased).

4.2. Silicon Melt with Variable Number of Blocks

The next figure of the sequence (Figure 7) shows the 3D structures obtained when the number of blocks is increased from 3 × 3 to 5 × 5 while keeping their height fixed to 0.6.
The most remarkable change clearly occurs in terms of multiplicity of the surface spots.
However, significant modifications can also be detected in the distribution of temperature in the transversal sections (Figure 8). When the number of blocks is increased, the amount of heat being released in the fluid per unit time clearly increases causing an ensuing rise in the average system temperature. Along these lines, it can be seen that when the configuration with 5 × 5 blocks is considered, the differences between the cases with adiabatic and hot floor become less evident.
Finally, Figure 9 shows that an increase in the number of blocks also affects the topology of the streamlines; nevertheless, these retain their behavior with fluid rising from the top of the blocks towards the free interface and moving down in the regions between the blocks.
Most remarkably, taken together all these figures also lead to the conclusion that (in terms of patterning behavior) in the presence of a distribution of cubic blocks, thermal convection in a small-Pr fluid can retain neither the classical structure with elongated two dimensional rolls typical of RB convection, nor the hexagonal-cell based topology of classical MB convection. Regardless of whether the floor is adiabatic or set at the same temperature of the blocks, the blocks create a kind of ‘blockage’ or act as barriers (or perturbing elements) that can break the two-dimensional rolls and prevent the system from developing a pattern with the honeycomb symmetry. As we will discuss in detail later, varying the number of blocks can also have a non-negligible impact on the temporal response (time-dependence) of the flow. Before treating this specific aspect, the next sub-section is concerned with the influence of another significant parameter, i.e., the Prandtl number itself.

4.3. Effect of the Prandtl Number

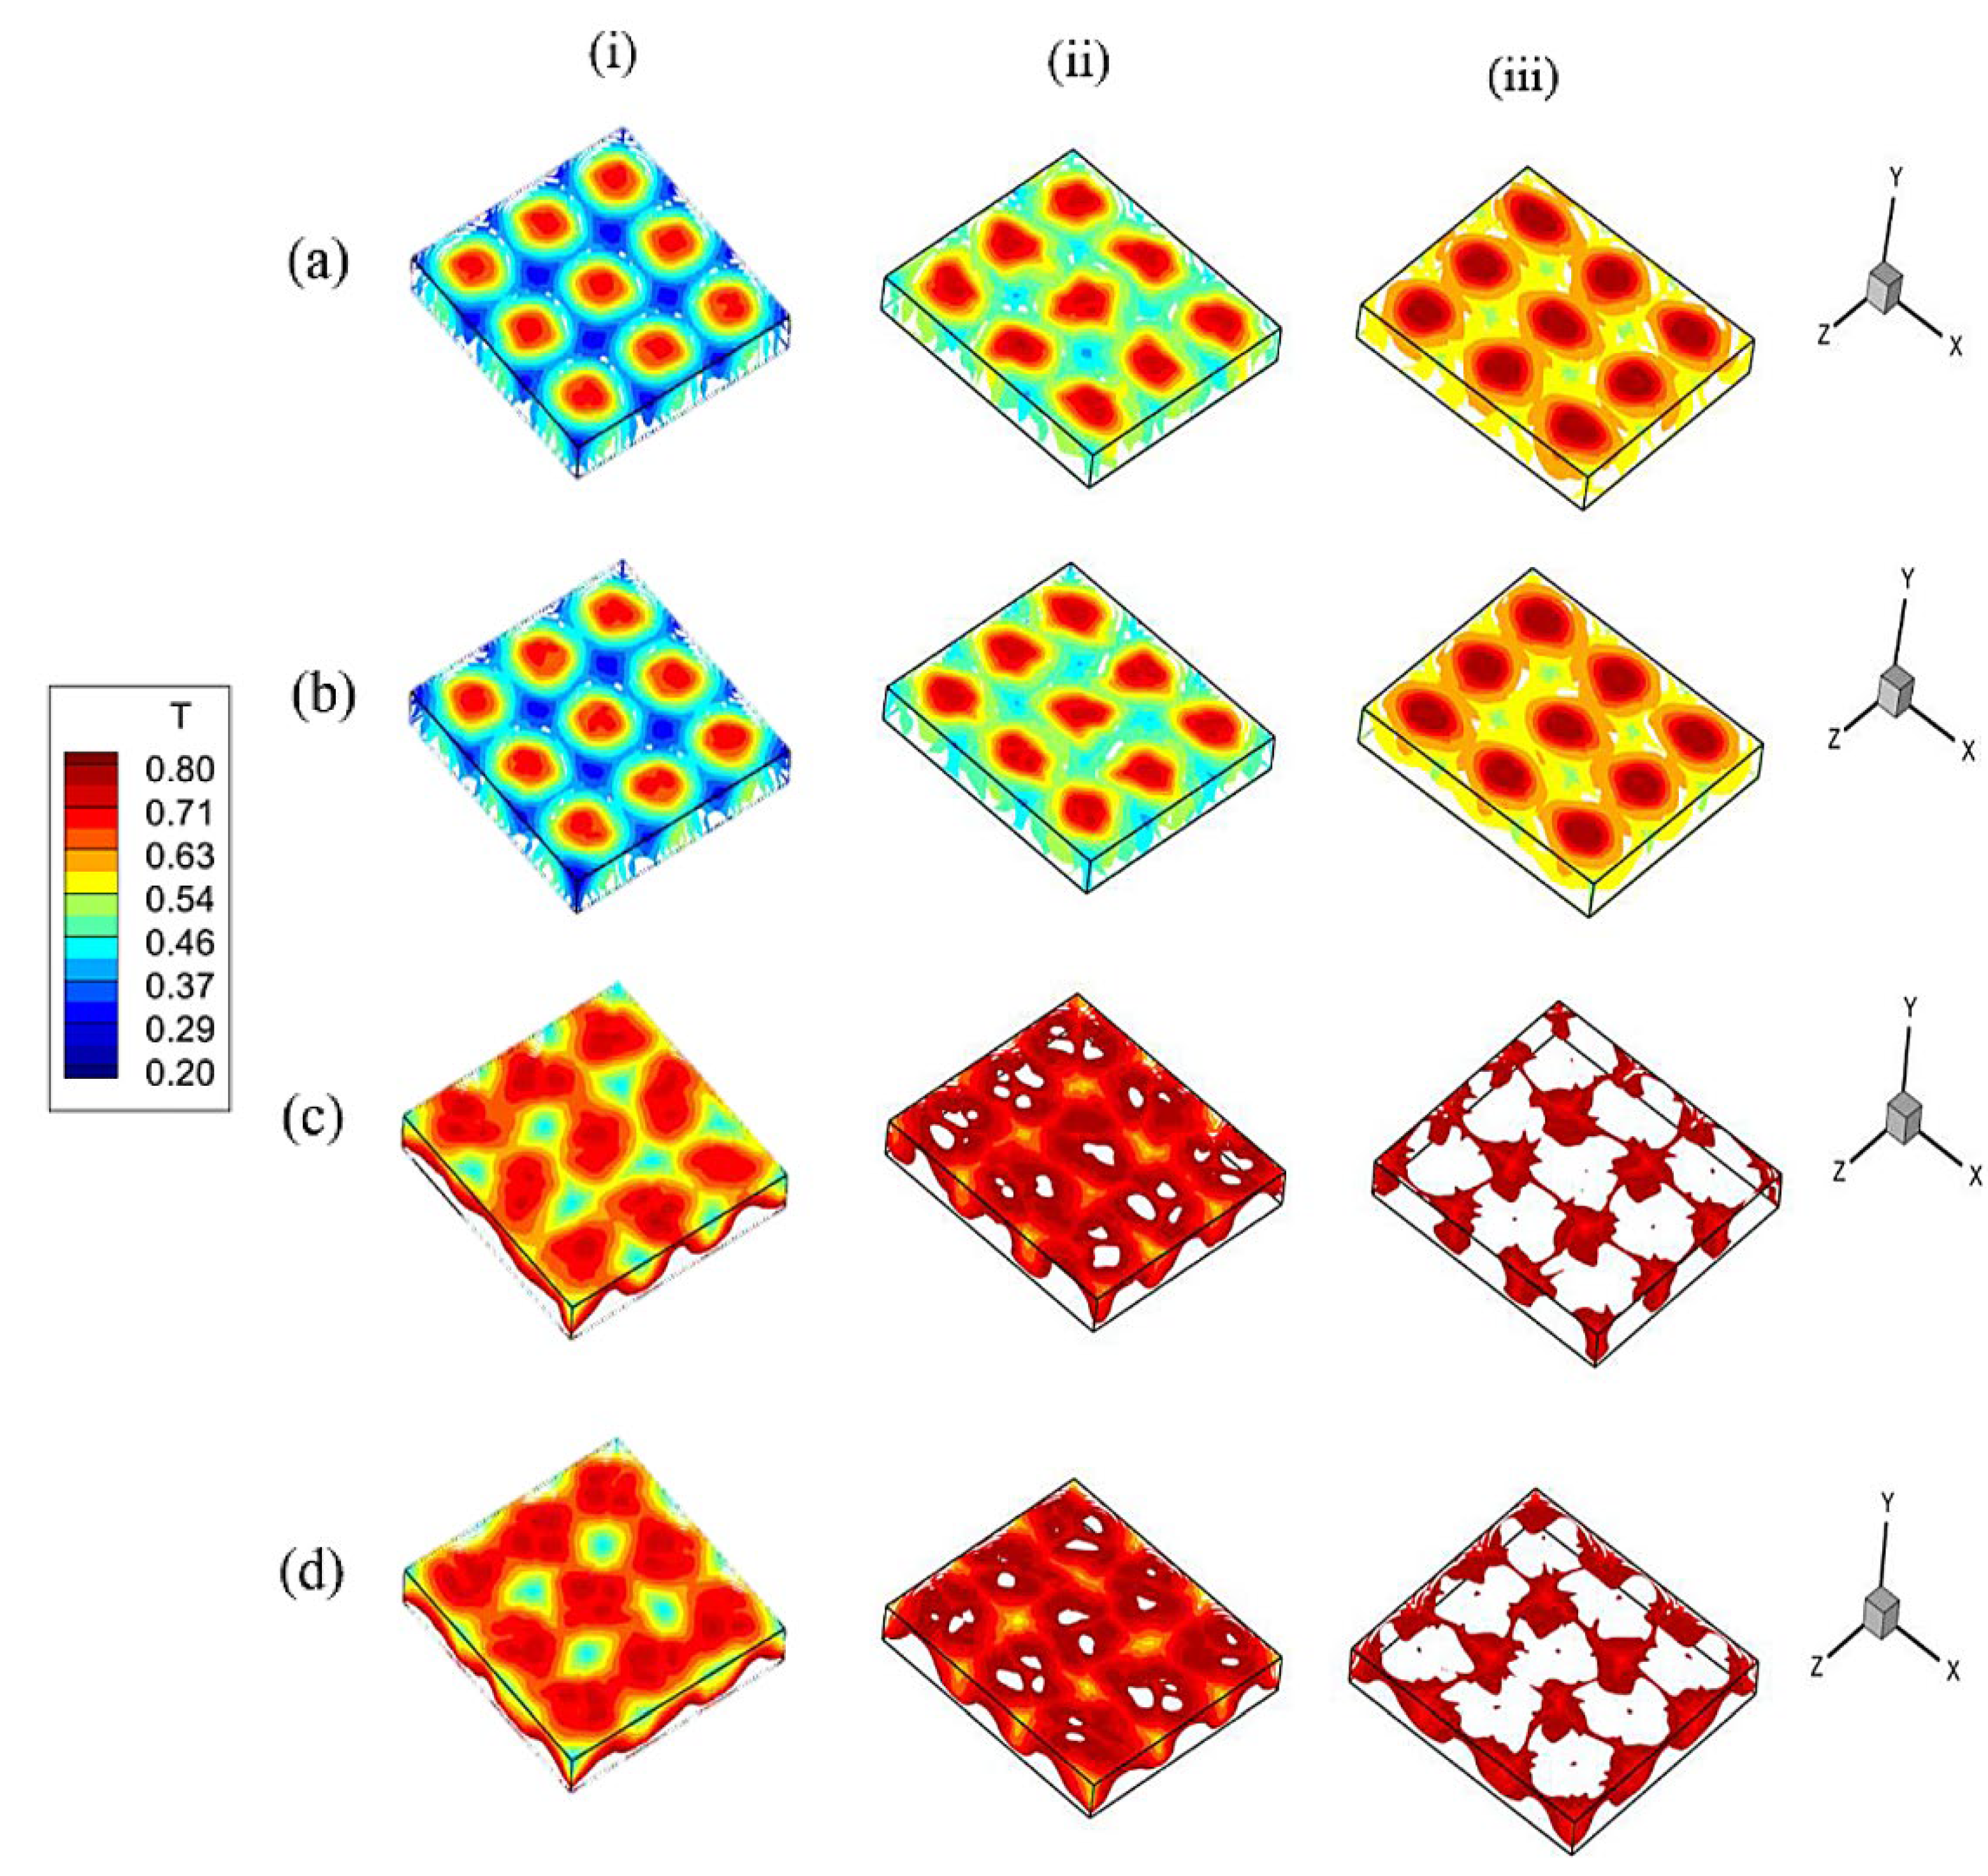
As witnessed by Figure 10, on varying the Prandtl number for a fixed number (N = 3 in this case) and given height of the blocks (δvert = 0.6), significant changes can be induced in the system in terms of patterning behavior. This is more evident when the configuration with hot floor is considered and/or the Prandtl number is increased.
For both Pr = 0.1 and Pr = 1 and hot floor condition (Figure 10(c,ii), (c,iii), (d,ii) and (d,iii)), the rising columns of hot fluid inside the layer no longer simply reflect the underlying distribution of hot blocks. In place of nine plumes evenly spaced along the x and z axes, a set of 4 × 4 thermal pillars is obtained.
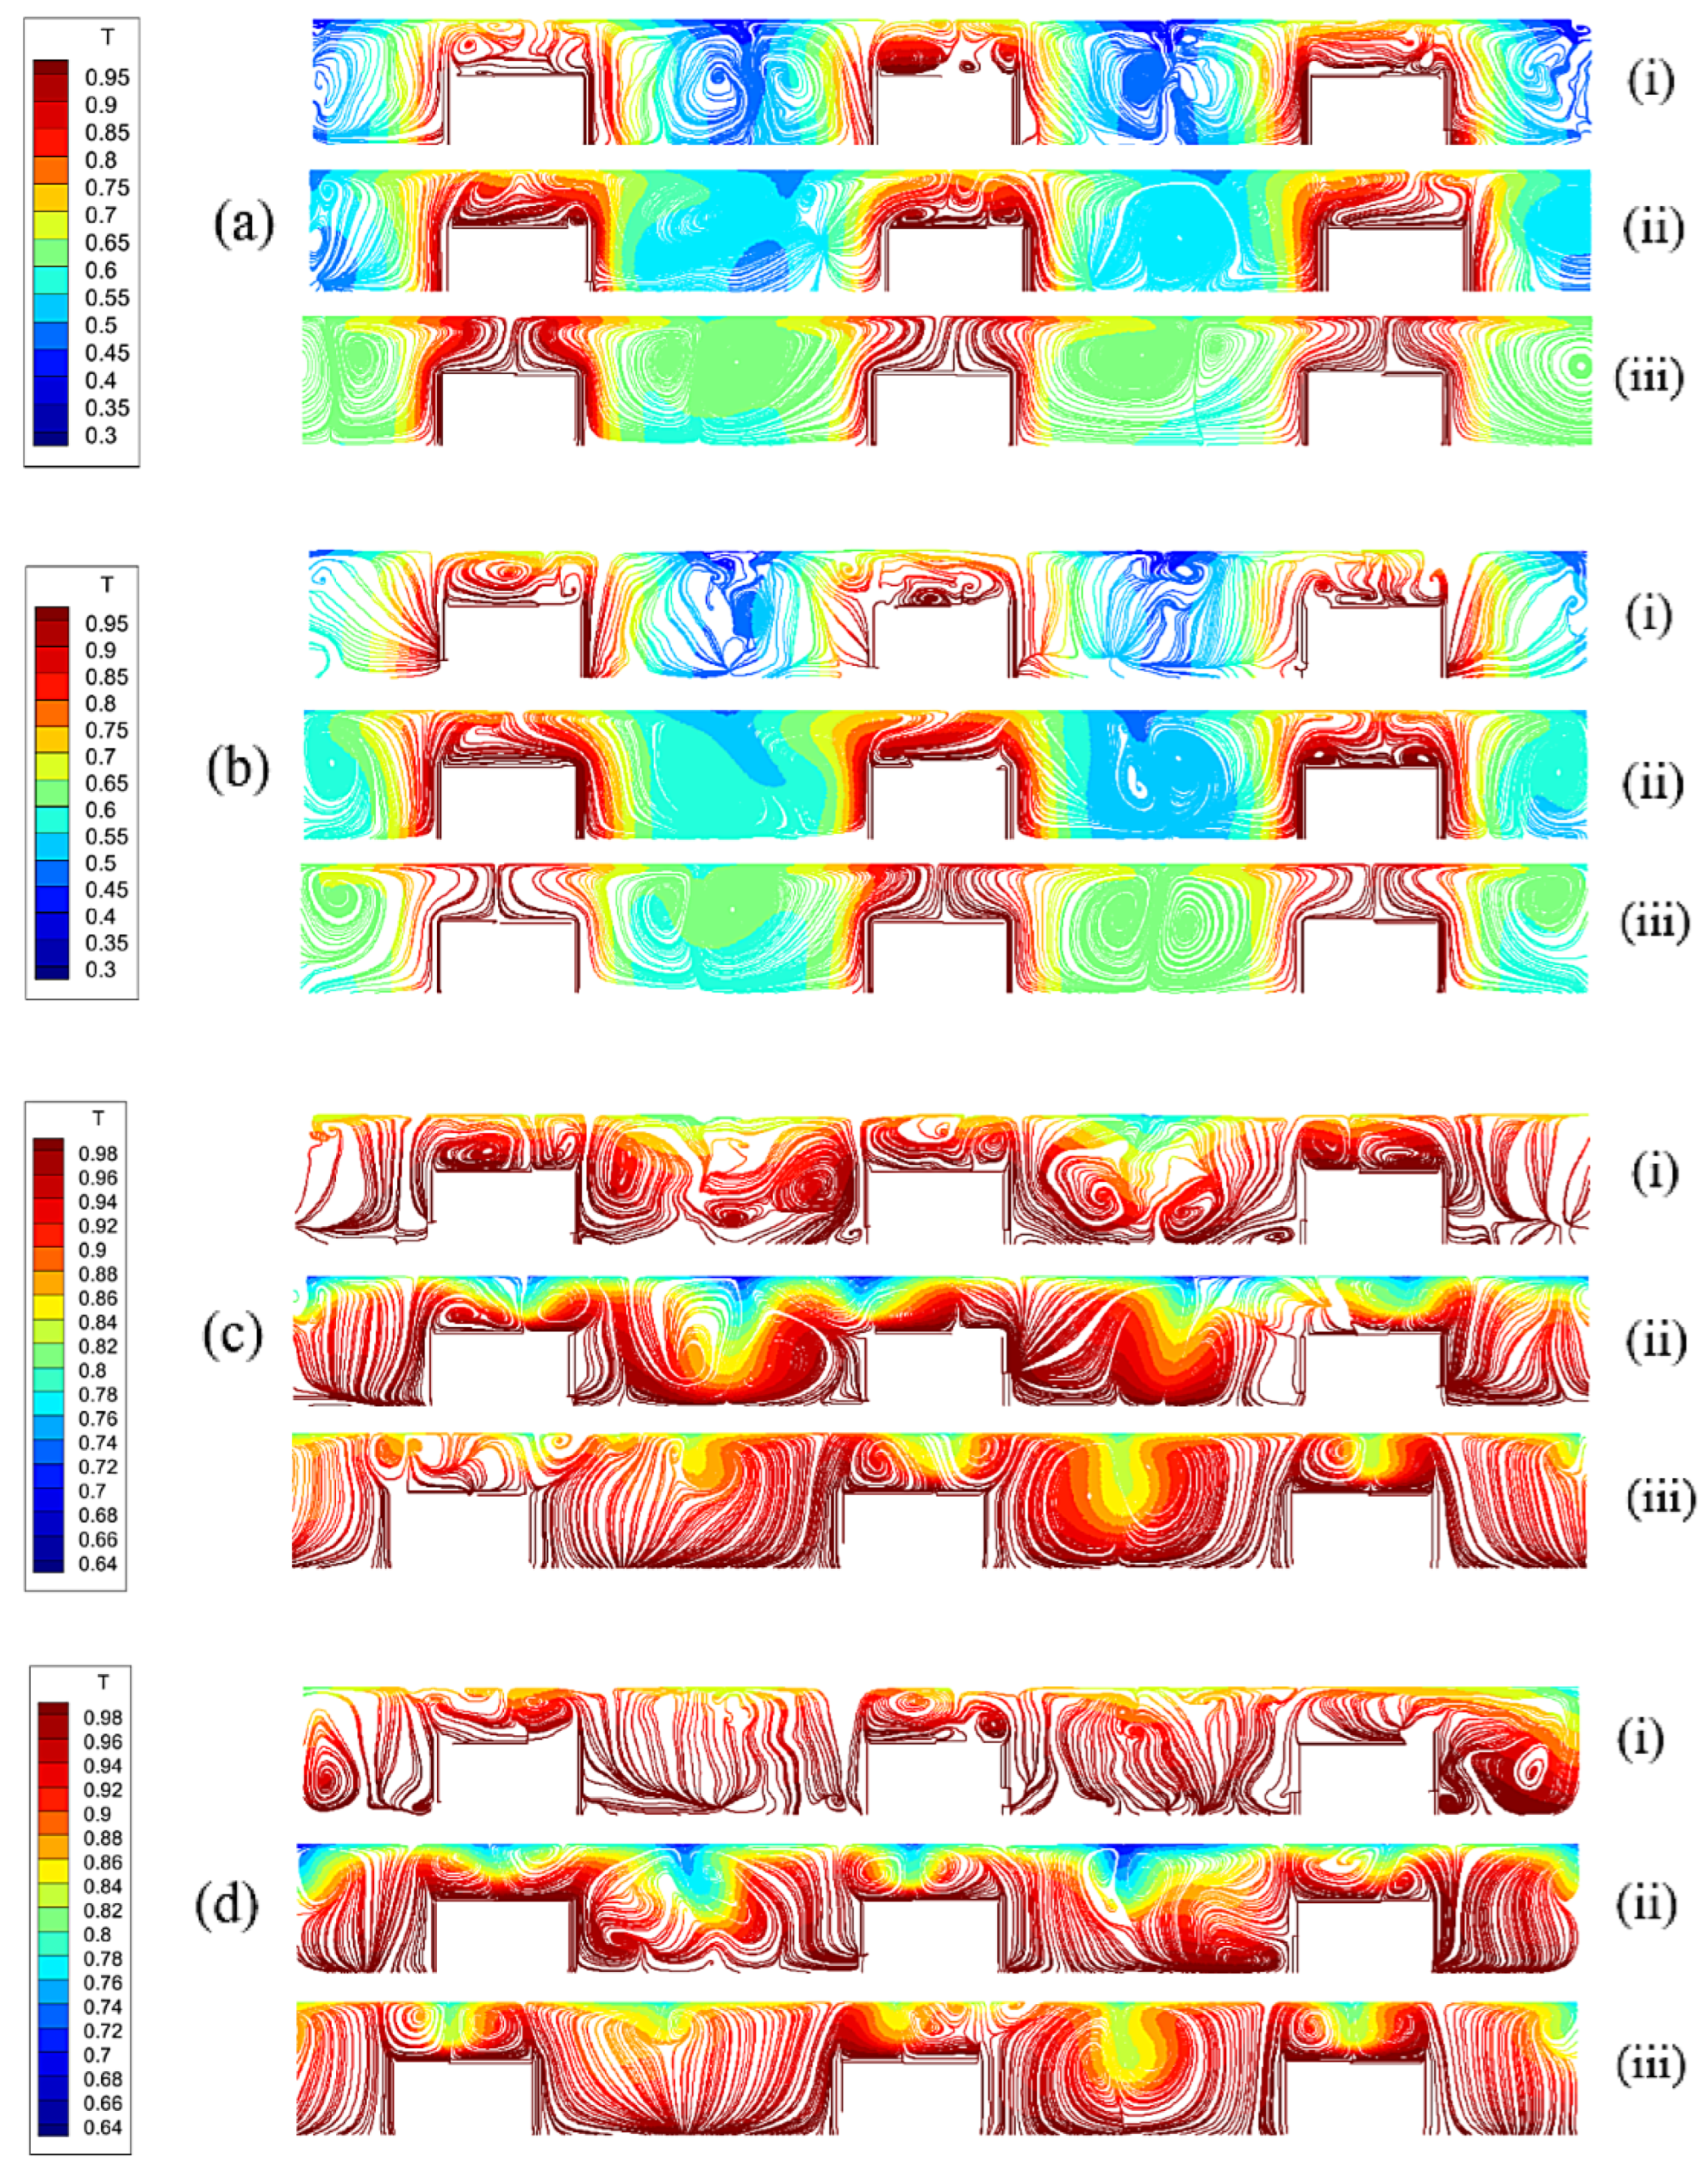
As the reader will realize by taking a look at Figure 11 and Figure 12, the increase in the visible number of columns of rising hot fluid (the aforementioned pillars) is due to a change in the process leading to plume formation. When the floor is hot and the Prandtl number is 0.1 or 1, plumes originate from the top corners of each block rather than from its center as it was for Pr = 0.01. This should be ascribed to the increased ability of the vertical walls of the blocks to produce convection in such conditions.

4.4. Time-Dependence and Related Effects

This section is dedicated to treat an aspect that has been glossed over until now, namely the behavior of these systems from a temporal point of view.
In this regard, it is worth starting from the simple remark that, in all cases relatively similar dynamics have been observed, namely a flickering behavior of the plumes or ‘pillars’ discussed before due to localized oscillations of the vortical structures supporting them. In general, these localized oscillations have been observed to be relatively chaotic for the considered values of the Rayleigh and Marangoni number.
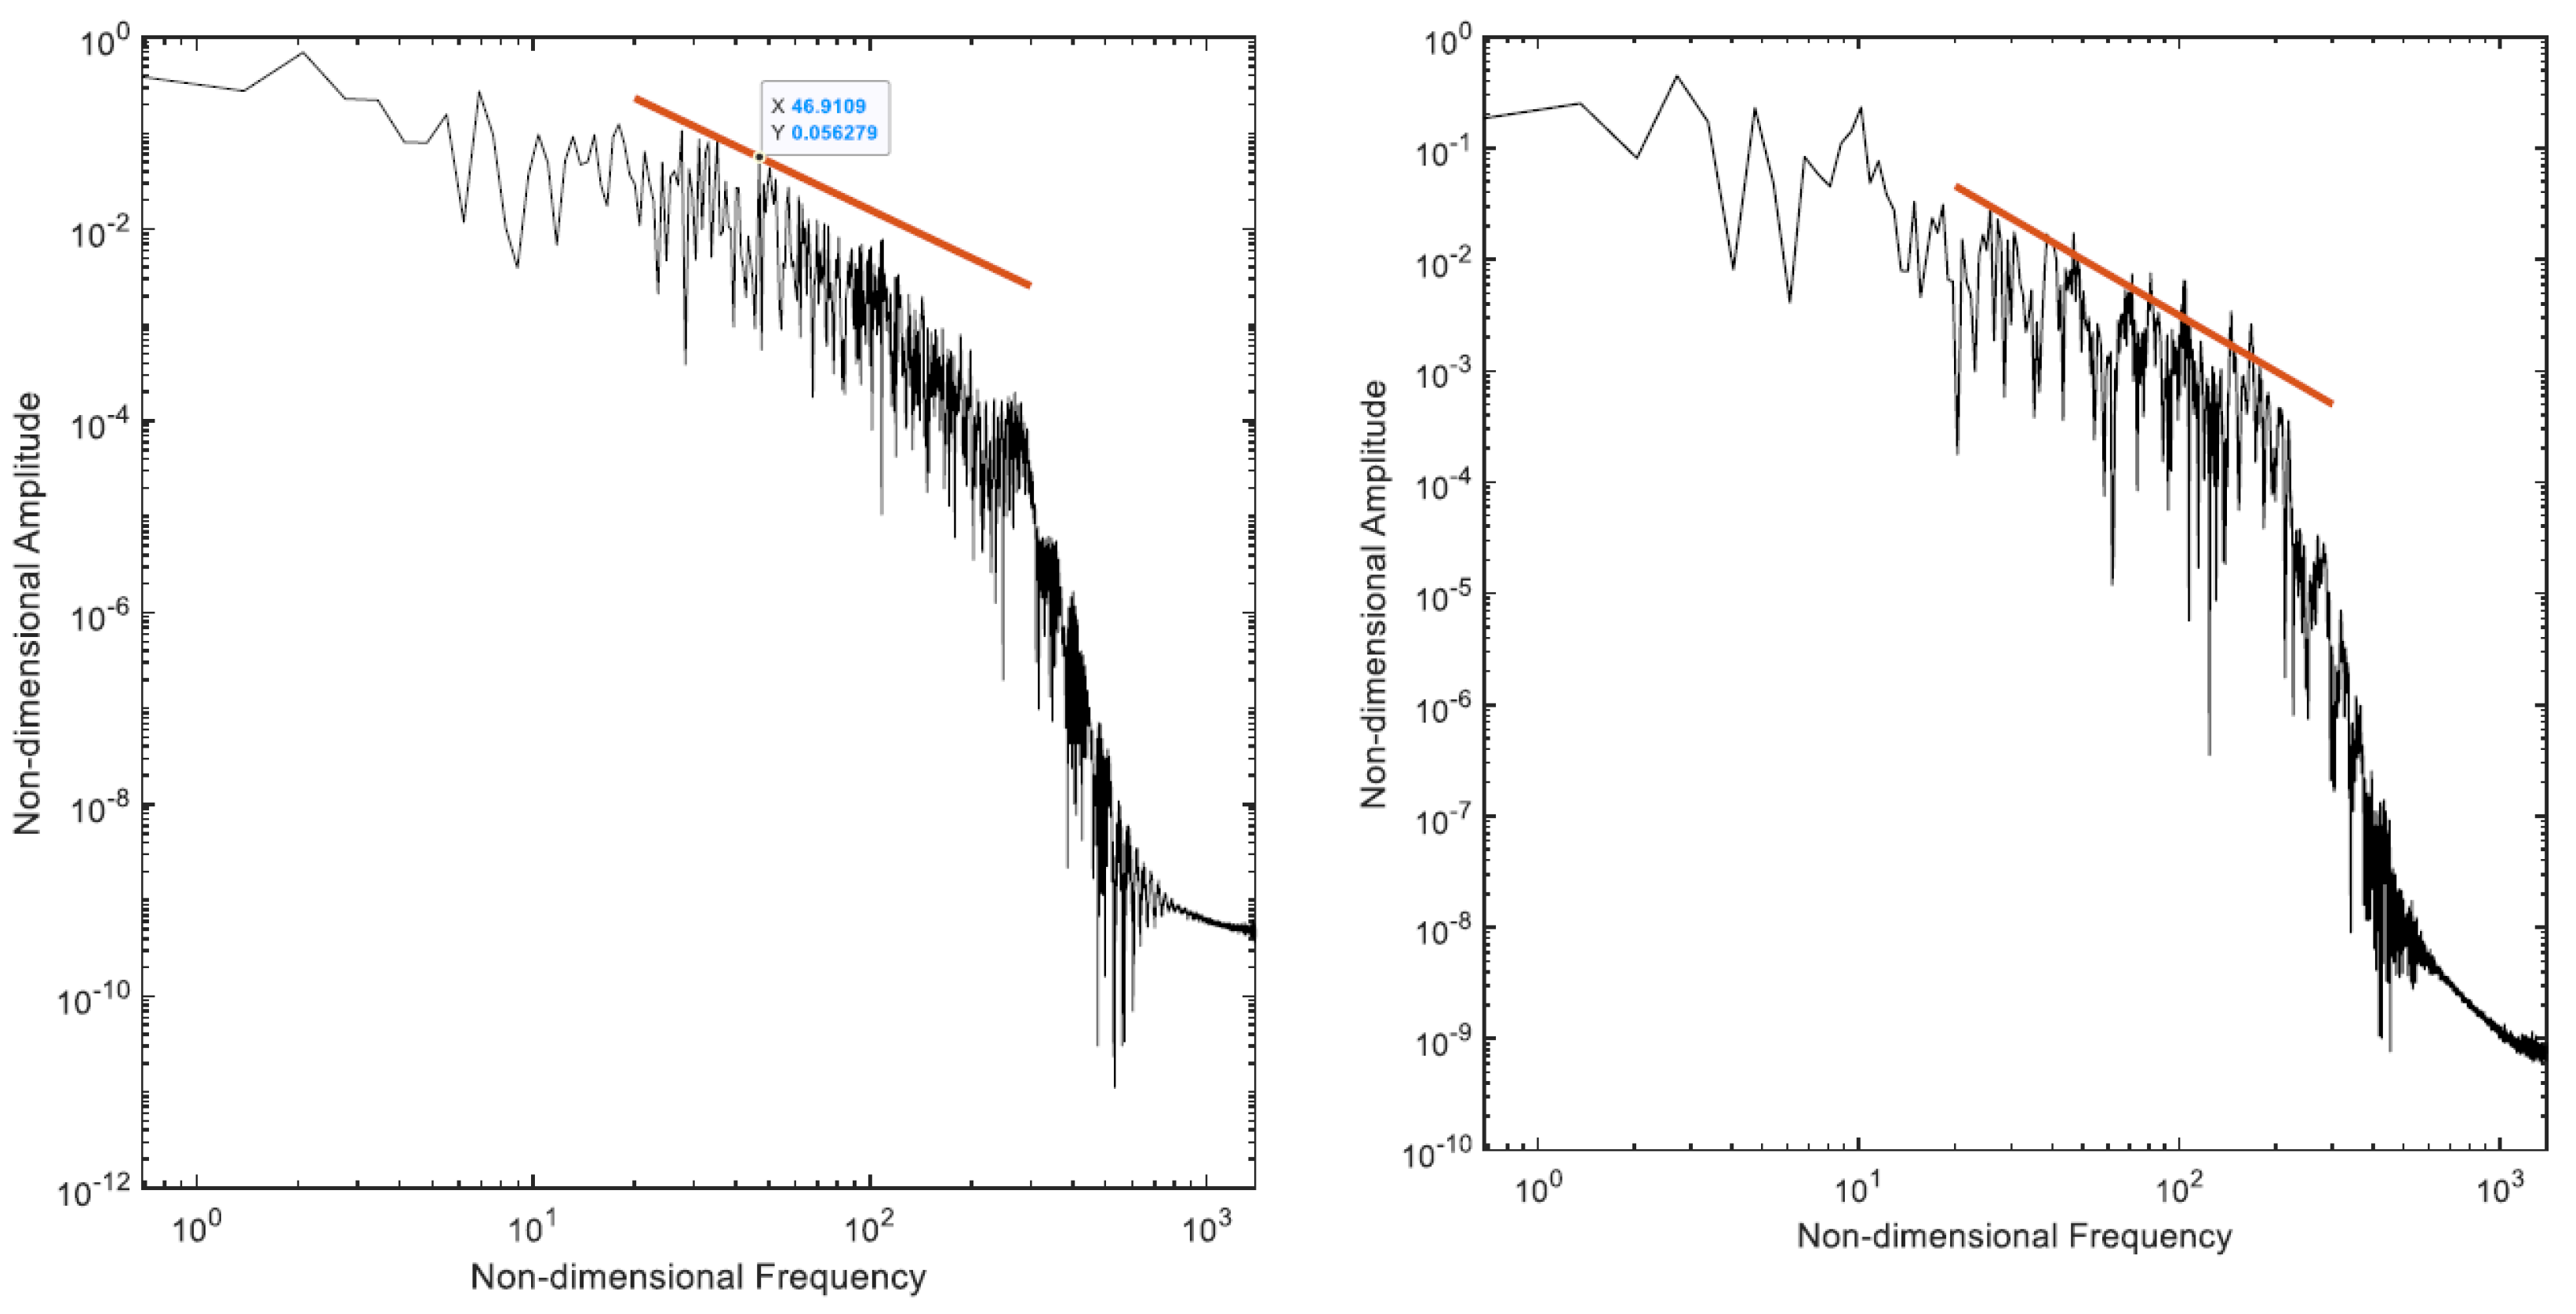
The related spectra for Pr = 0.01 can be seen in Figure 13.
Some meaningful information can be gathered from this figure as follows.
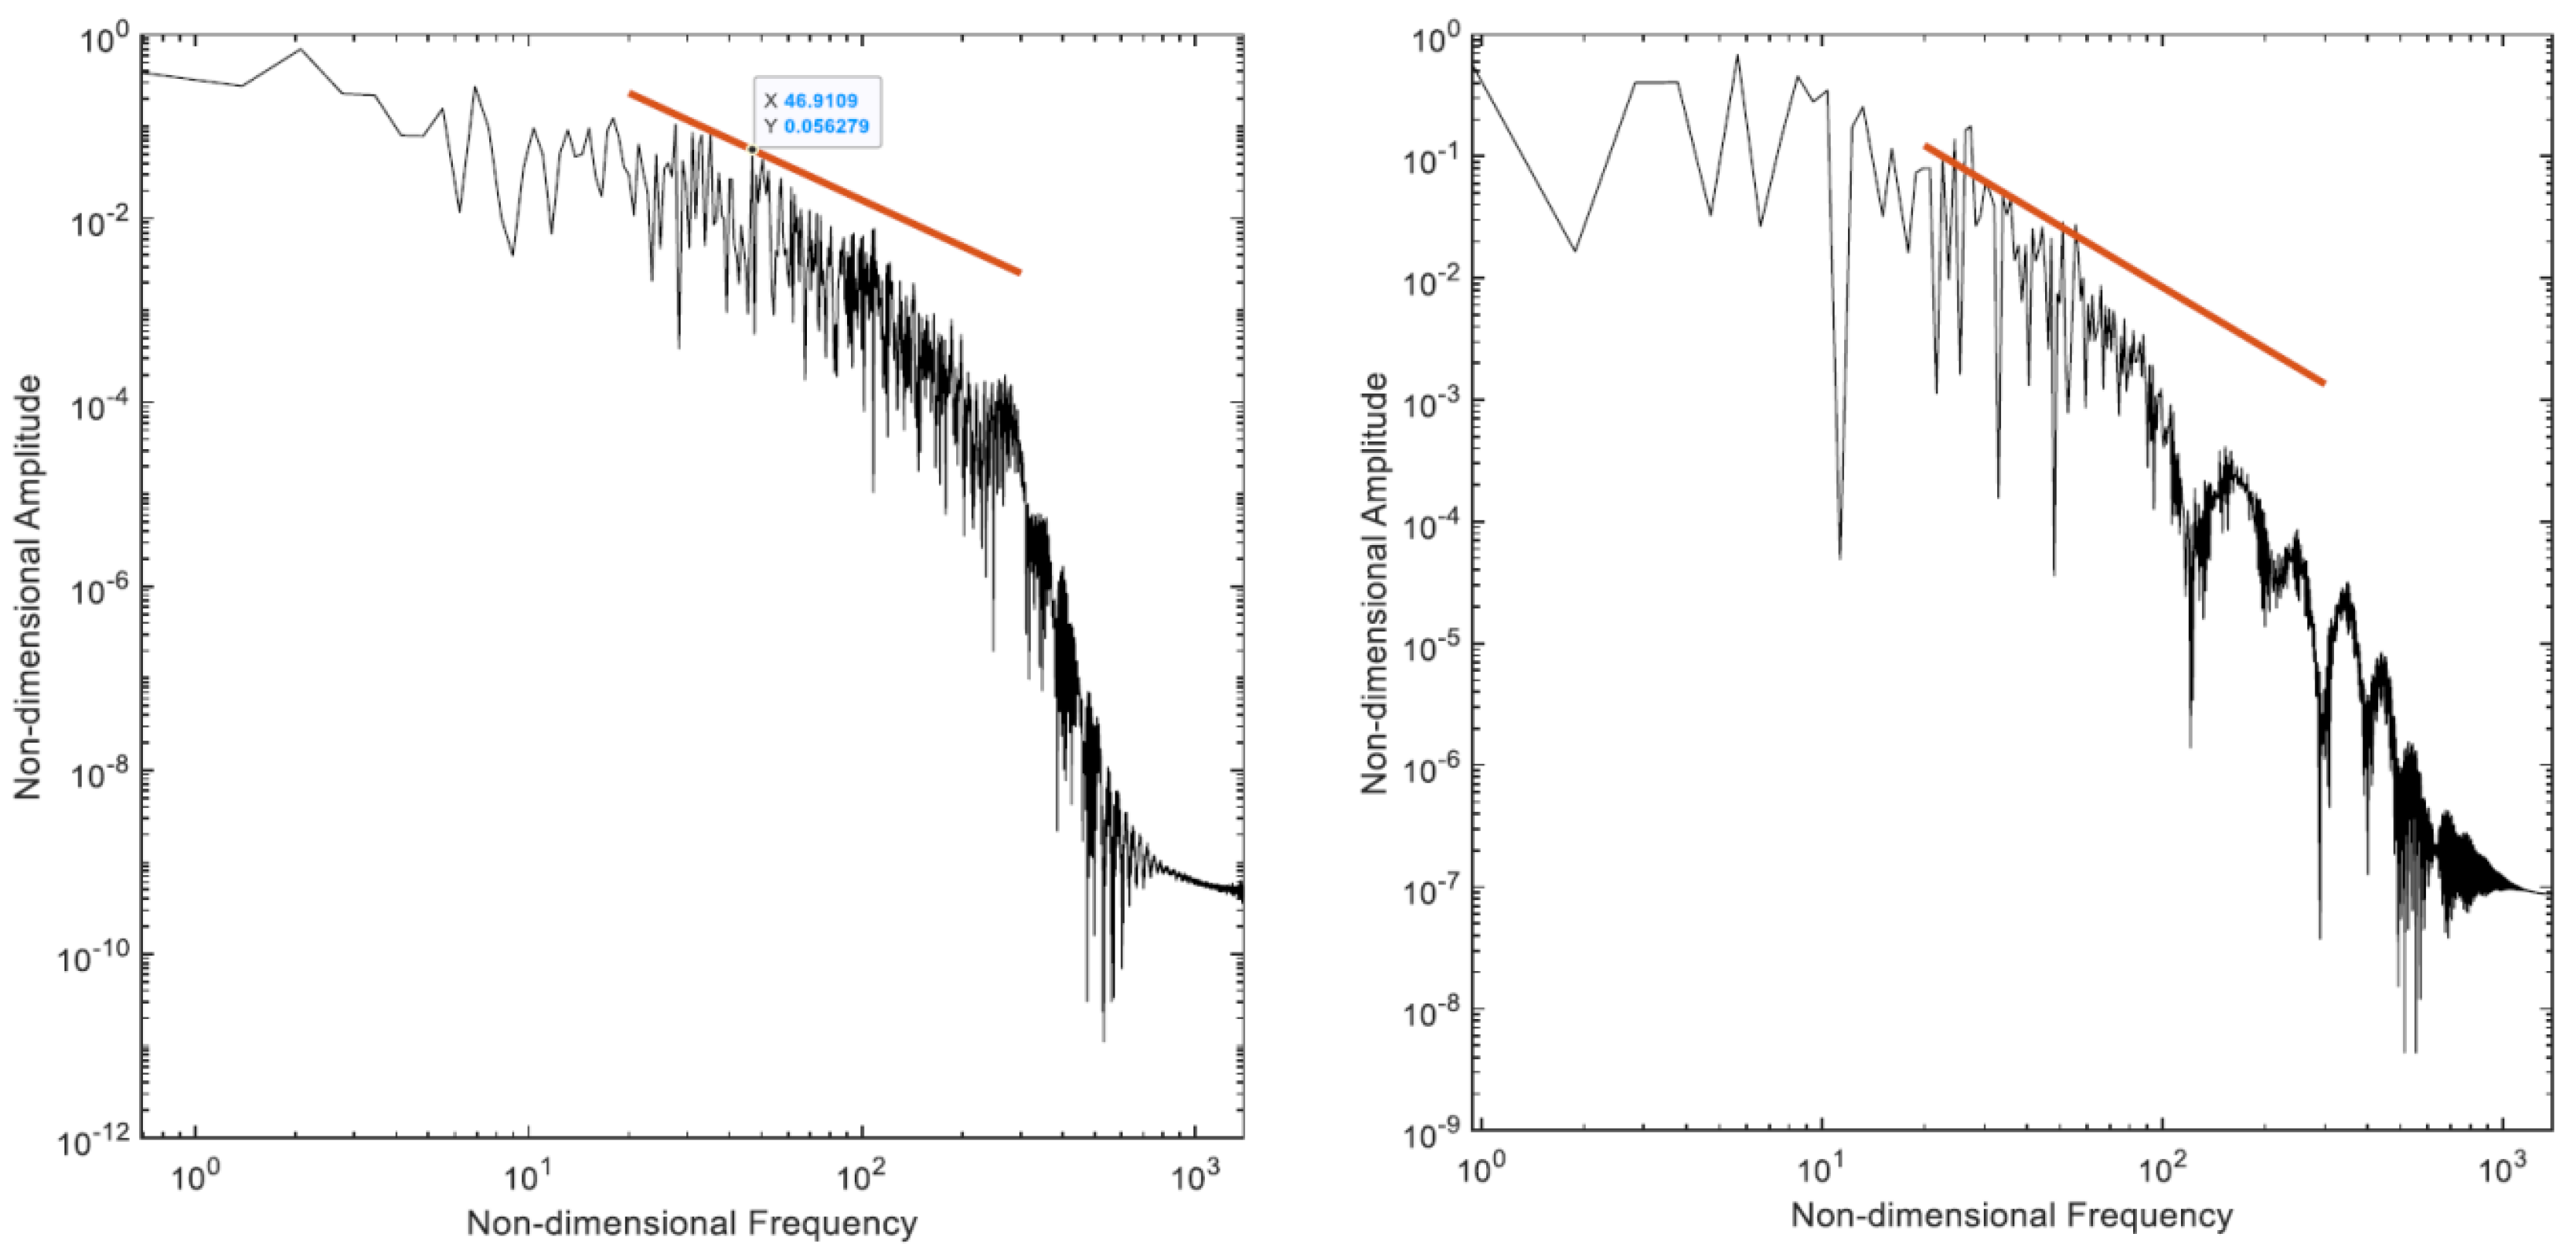
A range of frequencies can be identified where the spectrum follows the so-called Kolmogorov law (highlighted using a red straight line in the figure). Roughly speaking, this law states that a range of wavenumbers exists in space [k1, k2], where the energy density of the flow E scales as k−5/3 (where k denotes the wavenumber). In a completely equivalent way (because in terms of vorticity the local flow velocity turnover cycle depends on the length scale) the same law can be formulated stating that a range of frequencies exist in time where the energy density of the flow E scales as ω−5/3 (where ω denotes the angular frequency, see, e.g., De et al. [29]). This is a well-known outcome of a theory originally elaborated by Kolmogorov [30,31,32,33], where it was postulated that, while the large scales of a flow are not isotropic because they are influenced by the specific geometry of the considered domain and the nature of the forces driving it, the memory of this geometrical and directional information is progressively lost while energy cascades from large to smaller scales. In other words, a range of scales should exist where small-scale turbulent motions are statistically isotropic (i.e., no preferential spatial direction can be identified) before the kinetic energy reaches a scale where it is finally converted into internal energy (heat) due to dissipative (frictional) effects.
Cross comparison of Figure 13 leads to the conclusion that if the number of blocks is increased, the spectra are very similar, although, the latter seems to align with the Kolmogorov law over a slightly larger interval.
Along these lines, Figure 14 reveals that an increase in the Prandtl number can make the spectrum slightly more energetic in the range of high frequencies, which, in agreement with the observations reported in the earlier sections, can be explained considering the excitation of smaller scale features in the flow.

4.5. Heat Exchange Effects

In line with the approach implemented by [26] and other authors, further characterization of these systems can be obtained through evaluation of the Nusselt number on the basis of Equations (13)–(18).
Relevant information about the dependence of N u s i d e a v e r a g e , N u t o p a v e r a g e and N u b a r a v e r a g e on Pr, N and δvert, has been summarized in Table 4, Table 5 and Table 6, respectively.
The most striking effect that can be seen in these tables concerns the weakening of heat exchange when the adiabatic floor is replaced with a (hot) isothermal boundary. This change, which occurs regardless of the considered value of Pr, N or δvert, can be ascribed to the rise in the average temperature of the liquid when the floor is hot (clearly visible in Figure 5, Figure 8 and Figure 11). As a result of such an increase, the difference between the temperature of the liquid and the top or lateral surfaces of the blocks becomes smaller, thereby lowering the related Nusselt numbers. As similar mechanism is responsible for the decrease in N u b a r a v e r a g e when δvert is increased for fixed Pr, N and assuming the adiabatic floor. Although N u t o p a v e r a g e does not change much, making the blocks taller leads to an appreciable shrinkage in the values of N u s i d e a v e r a g e owing to the larger amount of heat that is released accordingly in the surrounding fluid and the ensuing increase in temperature. The same arguments also apply to the cases with a larger number of N. Yet for the case with adiabatic floor, if N is increased from 3 to 5 while keeping the other parameters unchanged, the Nusselt numbers become smaller and approach the values obtained in the corresponding situations with the hot floor. This is due to a three-fold effect, namely the increase in the average temperature of the system, the weakening of temperature gradients present in the liquid and the ensuing damping of convection driven by such gradients.
As a concluding remark for this section, it is also worth noting that, on increasing the Prandtl number, the average heat exchange occurring between the blocks and the surrounding fluid (as quantified by N u b a r a v e r a g e ) becomes more intense, and the simplest way to justify this dependence is to consider a decrease in the thickness of the thermal boundary layers formed along the horizontal and vertical surfaces of the hot blocks.

5. Discussion and Conclusions

In this section some additional insights into the considered problem are sought through comparison with ‘companion problems’, not necessary linked to thermal convection driven by buoyancy of Marangoni effects.
A first quite relevant exemplar can be found in the field concerned with the cooling of printed circuit boards and the assessment of the related thermal performances [34,35,36,37,38,39]. These problems are generally modeled considering the horizontal flow over a matrix of wall-mounted ‘cubes’, some of which behave as heat-producing sources. The professional and researchers involved in this field are typically interested in evaluating the local heat transfer coefficients owing to their strong connection with the lifespan and reliability of microprocessors and memories. In turn, these coefficients are highly dependent on geometrical factors such as the size of the considered chip, its relative position with respect to other electronic components, and the ‘channel height’ (i.e., the distance between the upper and lower printed circuit boards). Models based on a staggered arrangement of finite-size squared elements, however, are not an exclusive prerogative of this specific area. Parallelepipedic items fully submerged in a (mathematically reconstructed) urban atmospheric boundary layer, can also be used to model the interaction of wind with an array of buildings [40,41] or with a set of power generators (power plants, [18]). In these cases, the elements are typically staggered in the downstream direction and periodically arranged in the streamwise and/or spanwise directions. Taken together, all these efforts have shown that flow interruptions created in flow passages at periodic intervals can result in a variety of fluid-dynamic effects. These include flow separation at the sharp leading top of each element, flow recirculations originating from side edges with subsequent flow reattachment along these faces, arc-type vortices formed in the wake of any upstream cube, horseshoe-type vortices in front of the downstream cubes and other flow instabilities causing vortex shedding at the side faces of the elements (and ensuing small-scale turbulence in the near wake region, [42]).
Although the physics of the problem examined in the present work is quite different, referring to this companion category of phenomena is useful because such studies have shown that a variation in the gap between two items can produce significant changes in the heat transfer process. In those cases such modifications are essentially due to the different ‘level of blockage’ that is induced in the flow when the spacing among the protuberances is altered. The resulting flow physics is made extremely complex by the interplay of the horizontal flow with the related solid boundaries and the ensuing generation of a large number of (mutually interacting) vortex systems, and regions of relatively stagnant fluid. This complex physics, in turn, significantly affects the heat transfer mechanisms.
Obviously, the concept of blockage is not applicable directly to the present conditions, where the heated elements (regardless of whether the dominant driving force is buoyancy or thermocapillarity) represent the source of convection rather than factors hindering it. Moreover, the role of the cold ‘wind’ entering the domain hosting the hot elements is taken on by the heat exchange with the external gaseous environment through the top free liquid/gas interface (which acts as an extended heat sink for the entire system). We wish to remark that, despite these differences in the characteristic directions of fluid flow and heat transfer, some useful similarities can still be identified by simply replacing the notion of blockage with that of ‘heat island’ (visible in Figure 8). Just like portions of stagnant fluid can contribute to weaken heat exchange effects in a fluid blowing through a set of warm solid blocks, regions of stagnant heat (due to the excessive proximity of adjoining hot elements) can hamper the mechanism producing natural convection thereby causing a decrease in the Nusselt number.
Additional affinity can also be identified in the tendency of both categories of systems to develop turbulence or relatively chaotic solutions in some circumstances, i.e., large values of the Reynolds and Marangoni numbers, respectively (both account for the strength of horizontally directed flow). In the wind-obstacles problem, such complex states are essentially the outcome of purely hydrodynamic effects and related bifurcations [18,42,43,44,45,46,47,48,49,50].We have shown that if hybrid buoyancy-Marangoni convection induced by hot blocks in liquid metals is considered, the frequency spectra still align with the Kolmogorov law in a certain range of frequencies.
Some general conclusions on the basis of the findings presented in Section 4 and the analogy with the companion category of phenomena discussed in the present section, can therefore be drawn as follows. Though quite limited in terms of depth and scope due to the extremely long time required by the simulations, the present work has shown that a topography at the bottom of a layer of liquid metal coupled with a thermal inhomogeneity can deeply alter the flow with respect to the patterns which would be produced in the equivalent conditions without blocks. The presence of obstructions prevents the layer from forming the horizontally extended rolls or the hexagonal cells, which would be typical of RB and MB convection, respectively.
While the outcomes of an increase in the height of the blocks are generally limited to a rise in the temperature of the hot spots produced by rising thermal currents that meet the free surface, an increase in their numbers can make the average temperature of the entire fluid layer much higher. As a result, the difference between the configuration with adiabatic and isothermal (at the same temperature of the blocks) floor becomes less evident.
On increasing the Prandtl number in the range from 0.01 to 1 even more interesting phenomena are enabled. Owing to a shift in the location of the regions from which thermal plumes originate (from the center of the top surface of blocks to their edges), the perfect correspondence between the disposition of hot blocks at the bottom and the set of hot spots on the free surface is lost. In such conditions the multiplicity of surface spots overcomes that of the underlying matrix of heat sources.
Regardless of the considered value of the Prandtl number or the boundary conditions at the bottom and at the lateral boundary, in place of the traveling waves known to be the typical outcome of the first Hopf bifurcation for both RM and MB classical forms of convection in liquid metals, unsteadiness is due to small oscillations in time of the thermal pillars. Analysis of the related frequency spectra has revealed that a range of frequencies exists where the spectrum aligns with the prediction of the Kolmogorov theory for isotropic homogeneous turbulence and that the extension of such a range depends on the specific conditions considered.
Future studies shall be devoted to determine the minimum height of the blocks for which the formation of classical hexagonal cells or traveling waves is prevented, assess the system response when the horizontal size of the blocks is varied continuously in a given range, analyze all these behaviors also for other values of the Marangoni and Rayleigh numbers, and eventually exploit relevant turbulence models (such as those elaborated by Da Vià et al. [51,52,53] to reduce the otherwise prohibitive computational times required by DNS).

Author Contributions

Data Curation, A.S.; Formal Analysis, M.L. and W.W.; Investigation, A.S. and M.L.; Methodology, M.L.; Software, M.L.; Supervision, M.L.; Visualization, A.S.; Writing—Original Draft, M.L.; Writing—Review and Editing, M.L. and W.W. All authors have read and agreed to the published version of the manuscript.

Funding

This research received no external funding.

Institutional Review Board Statement

Not applicable.

Informed Consent Statement

Informed consent was obtained from all subjects involved in the study.

Data Availability Statement

Publicly available datasets were analyzed in this study. These data can be found in the pure repository of the University of Strathclyde.

Conflicts of Interest

The authors declare no conflict of interest.

References

  1. Kaddeche, S.; Henry, D.; Putelat, T.; Ben Hadid, H. Instabilities in liquid metals controlled by constant magnetic field, Part I: Vertical magnetic field. J. Cryst. Growth 2002, 242, 491–500. [Google Scholar] [CrossRef]
  2. Busse, F.H.; Clever, R.M. An asymptotic model of two-dimensional convection in the limit of low Prandtl number. J. Fluid Mech. 1981, 102, 75–83. [Google Scholar] [CrossRef]
  3. Clever, R.M.; Busse, F.H. Low Prandtl number convection in a layer heated from below. J. Fluid Mech. 1981, 102, 61–74. [Google Scholar] [CrossRef]
  4. Clever, R.M.; Busse, F.H. Nonlinear oscillatory convection. J. Fluid Mech. 1987, 176, 403–417. [Google Scholar] [CrossRef]
  5. Clever, R.M.; Busse, F.H. Convection at very low Prandtl numbers. Phys. Fluids A 1990, 2, 334–339. [Google Scholar] [CrossRef]
  6. McLaughlin, J.B.; Orszag, S.A. Transition from periodic to chaotic thermal convection. J. Fluid Mech. 1982, 122, 123–142. [Google Scholar] [CrossRef]
  7. Meneguzzi, M.; Sulem, C.; Sulem, P.L.; Thual, O. Three-Dimensional numerical simulation of convection in low-Prandtl-number fluids. J. Fluid Mech. 1987, 182, 169–191. [Google Scholar] [CrossRef]
  8. Thual, O. Zero-Prandtl-Number convection. J. Fluid Mech. 1992, 240, 229–258. [Google Scholar] [CrossRef]
  9. Lappa, M. On the nature and structure of possible three-dimensional steady flows in closed and open parallelepipedic and cubical containers under different heating conditions and driving forces. Fluid Dyn. Mater. Process. 2005, 1, 1–19. [Google Scholar]
  10. Lappa, M. Thermal convection and related instabilities in models of crystal growth from the melt on earth and in microgravity: Past history and current status. Cryst. Res. Technol. 2005, 40, 531–549. [Google Scholar] [CrossRef]
  11. Thess, A.; Bestehorn, M. Planform selection in Bénard-Marangoni convection: L hexagons versus g hexagons. Phys. Rev. E 1995, 52, 6358–6367. [Google Scholar] [CrossRef]
  12. Parmentier, P.M.; Regnier, V.C.; Lebon, G. Nonlinear analysis of coupled gravitational and capillary thermoconvention in thin fluid layers. Phys. Rev. E 1996, 54, 411–423. [Google Scholar] [CrossRef]
  13. Boeck, T.; Thess, A. Bénard–Marangoni convection at low Prandtl number. J. Fluid Mech. 1999, 399, 251–275. [Google Scholar] [CrossRef]
  14. Lappa, M. Thermal Convection: Patterns, Evolution and Stability; John Wiley & Sons, Ltd.: Chichester, UK, 2009. [Google Scholar]
  15. Lappa, M. Rotating Thermal Flows in Natural and Industrial Processes; John Wiley & Sons, Ltd.: Chichester, UK, 2012. [Google Scholar]
  16. Lappa, M. A mathematical and numerical framework for the simulation of oscillatory buoyancy and Marangoni convection in rectangular cavities with variable cross section, Chapter 12. In Computational Modeling of Bifurcations and Instabilities in Fluid Mechanics; Alexander, G., Ed.; (Springer Mathematical Series, 2018, Part of the Computational Methods in Applied Sciences book series—COMPUTMETHODS); Springer International Publishing: Cham, Switzerland, 2019; Volume 50, pp. 419–458. ISBN 978-3-319-91493-0. [Google Scholar] [CrossRef] [Green Version]
  17. Lappa, M. On the gravitational suppression of hydrothermal modes in liquid layers with a blockage on the bottom wall. Int. J. Therm. Sci. 2019, 145, 19. [Google Scholar] [CrossRef]
  18. Lappa, M. On the Highly Unsteady Dynamics of Multiple Thermal Buoyant Jets in Cross Flows. Phys. Fluids 2019, 31, 27. [Google Scholar] [CrossRef]
  19. Lappa, M.; Boaro, A. Rayleigh–Bénard convection in viscoelastic liquid bridges. J. Fluid Mech. 2020, 904, A2. [Google Scholar] [CrossRef]
  20. Gresho, P.M. Incompressible fluid dynamics: Some fundamental formulation issues. Ann. Rev. Fluid Mech. 1991, 23, 413–453. [Google Scholar] [CrossRef]
  21. Guermond, J.-L.; Quartapelle, L. On stability and convergence of projection methods based on pressure Poisson equation. Int. J. Numer. Meth. Fluids 1998, 26, 1039–1053. [Google Scholar] [CrossRef] [Green Version]
  22. Guermond, J.-L. Some practical implementations of projection methods for Navier–Stokes equations. Model. Math. Anal. Num. 1996, 30, 637–667. [Google Scholar] [CrossRef] [Green Version]
  23. Guermond, J.-L.; Minev, P.; Shen, J. An Overview of Projection Methods for Incompressible Flows. Comput. Methods Comput. Methods Appl. Mech. Eng. 2006, 195, 6011–6045. [Google Scholar] [CrossRef] [Green Version]
  24. Petersson, N.A. Stability of Pressure Boundary Conditions for Stokes and Navier–Stokes Equations. J. Comput. Phys. 2001, 172, 40–70. [Google Scholar] [CrossRef]
  25. Strikwerda, J.C.; Lee, Y.S. The accuracy of the fractional step method. SIAM J. Numer. Anal. 1999, 37, 37–47. [Google Scholar] [CrossRef] [Green Version]
  26. Biswas, N.; Mahapatra, P.S.; Manna, N.K.; Roy, P.C. Influence of Heater Aspect Ratio on Natural Convection in a Rectangular Enclosure. Heat Transf. Eng. 2016, 37, 125–139. [Google Scholar] [CrossRef]
  27. Pearson, J.R.A. On convection cells induced by surface tension. J. Fluid Mech. 1958, 4, 489–500. [Google Scholar] [CrossRef]
  28. Colinet, P.; Legros, J.C.; Velarde, M.G. Nonlinear Dynamics of Surface-Tension-Driven Instabilities; John Wiley: Hoboken, NJ, USA, 2001. [Google Scholar]
  29. De, A.K.; Eswaran, V.; Mishra, P.K. Scalings of heat transport and energy spectra of turbulent Rayleigh-Bénard convection in a large-aspect-ratio box. Int. J. Heat Fluid Flow 2017, 67, 111–124. [Google Scholar] [CrossRef] [Green Version]
  30. Kolmogorov, A.N. The local structure of turbulence in incompressible viscous fluids at very large Reynolds numbers. Dokl. Akad. Nauk. SSSR 1941, 30, 299–303, Reprinted in Proc. R. Soc. Lond. A 1991, 434, 9–13. [Google Scholar]
  31. Kolmogorov, A.N. On the degeneration of isotropic turbulence in an incompressible viscous fluids. Dokl. Akad. Nauk. SSSR 1941, 31, 538–541. [Google Scholar]
  32. Kolmogorov, A.N. Dissipation of energy in isotropic turbulence. Dokl. Akad. Nauk. SSSR 1941, 32, 19–21. [Google Scholar]
  33. Kolmogorov, A.N. Equations of turbulent motion in an incompressible fluid. Izv. Akad. Nauk. SSSR Ser. Fiz. 1942, 6, 56–58. [Google Scholar]
  34. Incropera, F.P. Convection heat transfer in electronic equipment cooling. J. Heat Transf. 1988, 110, 1097–1111. [Google Scholar] [CrossRef]
  35. Liu, Y.; Phan-Thien, N. An Optimum Spacing Problem for Three Chips Mounted on a Vertical Substrate in an Enclosure. Numer. Heat Transf. Part A 2000, 37, 613–630. [Google Scholar]
  36. Chuang, S.H.; Chiang, J.S.; Kuo, Y.M. Numerical Simulation of Heat Transfer in a Three-Dimensional Enclosure with Three Chips in Various Position Arrangements. Heat Transf. Eng. 2003, 24, 42–59. [Google Scholar] [CrossRef]
  37. Rahman, M.M.; Alim, M.A.; Saha, S.; Chowdhury, M.K. Numerical study of mixed convection in a square cavity with a heat conducting square cylinder at different locations. J. Mech. Eng. 2008, 39, 78–85. [Google Scholar] [CrossRef] [Green Version]
  38. Venkatachalapathy, S.; Udayakumar, M. Numerical investigation of natural convection heat transfer from multiple heat sources in a square enclosure. J. Eng. Appl. Sci. 2010, 5, 56–63. [Google Scholar]
  39. Tyacke, J.; Tucker, P. LES of heat transfer in electronics. Appl. Math. Model. 2012, 36, 3112–3133. [Google Scholar] [CrossRef] [Green Version]
  40. Nakayama, H.; Takemi, T.; Nagai, H. LES analysis of the aerodynamic surface properties for turbulent flows over building arrays with various geometries. J. Appl. Meteorol. Climatol. 2011, 50, 1692–1712. [Google Scholar] [CrossRef]
  41. Nakayama, H.; Jurcakova, K.; Nagai, H. Development of local-scale high resolution atmospheric dispersion model using large-eddy simulation. Part 3: Turbulent flow and plume dispersion in building arrays. J. Nucl. Sci. Technol. 2013, 50, 503–519. [Google Scholar] [CrossRef] [Green Version]
  42. Meinders, E.; Hanjalic, K. Vortex structure and heat transfer in turbulent flow over a wall-mounted matrix of cubes. Int. J. Heat Fluid Flow 1999, 20, 255–267. [Google Scholar] [CrossRef]
  43. Yaghoubi, M.; Velayati, E. Undeveloped convective heat transfer from an array of cubes in cross-stream direction. Int. J. Therm. Sci. 2005, 44, 756–765. [Google Scholar] [CrossRef]
  44. Coceal, O.; Dobre, A.; Thomas, T.G.; Belcher, S.E. Structure of turbulent flow over regular arrays of cubical roughness. J. Fluid Mech. 2007, 589, 375–409. [Google Scholar] [CrossRef] [Green Version]
  45. Leonardi, S.; Castro, I.P. Channel flow over large cube roughness: A direct numerical simulation study. J. Fluid Mech. 2010, 651, 519–539. [Google Scholar] [CrossRef] [Green Version]
  46. Lee, J.H.; Sung, H.J.; Krogstad, P.A. Direct numerical simulation of the turbulent boundary layer over a cube-roughened wall. J. Fluid Mech. 2011, 669, 397–431. [Google Scholar] [CrossRef]
  47. Basara, B. Fluid flow conjugate heat transfer in a matrix of surface-mounted cubes: A PANS study. Int. J. Heat Fluid Flow 2015, 51, 166–174. [Google Scholar] [CrossRef]
  48. Saeedi, M.; Wang, B.-C. Large-Eddy simulation of turbulent flow and dispersion over a matrix of wall-mounted cubes. Phys. Fluids 2015, 27, 115104. [Google Scholar] [CrossRef]
  49. Blackman, K.; Perret, L. Non-Linear interactions in a boundary layer developing over an array of cubes using stochastic estimation. Phys. Fluids 2016, 28, 095108. [Google Scholar] [CrossRef]
  50. Khan, B.A.; Saha, A.K. Direct numerical simulation of turbulent flow and heat transfer over a heated cube placed in a matrix of unheated cubes. Int. J. Heat Mass Transf. 2021, 171, 121052. [Google Scholar] [CrossRef]
  51. Da Vià, R.; Giovacchini, V.; Manservisi, S. A Logarithmic Turbulent Heat Transfer Model in Applications with Liquid Metals for Pr = 0.01–0.025. Appl. Sci. 2020, 10, 4337. [Google Scholar] [CrossRef]
  52. Da Vià, R.; Manservisi, S.; Menghini, F. A k-Ω-kθ-Ωθ four parameter logarithmic turbulence model for liquid metals. Int. J. Heat Mass Transf. 2016, 101, 1030–1041. [Google Scholar] [CrossRef]
  53. Da Vià, R.; Manservisi, S. Numerical simulation of forced and mixed convection turbulent liquid sodium flow over a vertical backward facing step with a four parameter turbulence model. Int. J. Heat Mass Transf. 2019, 135, 591–603. [Google Scholar] [CrossRef]
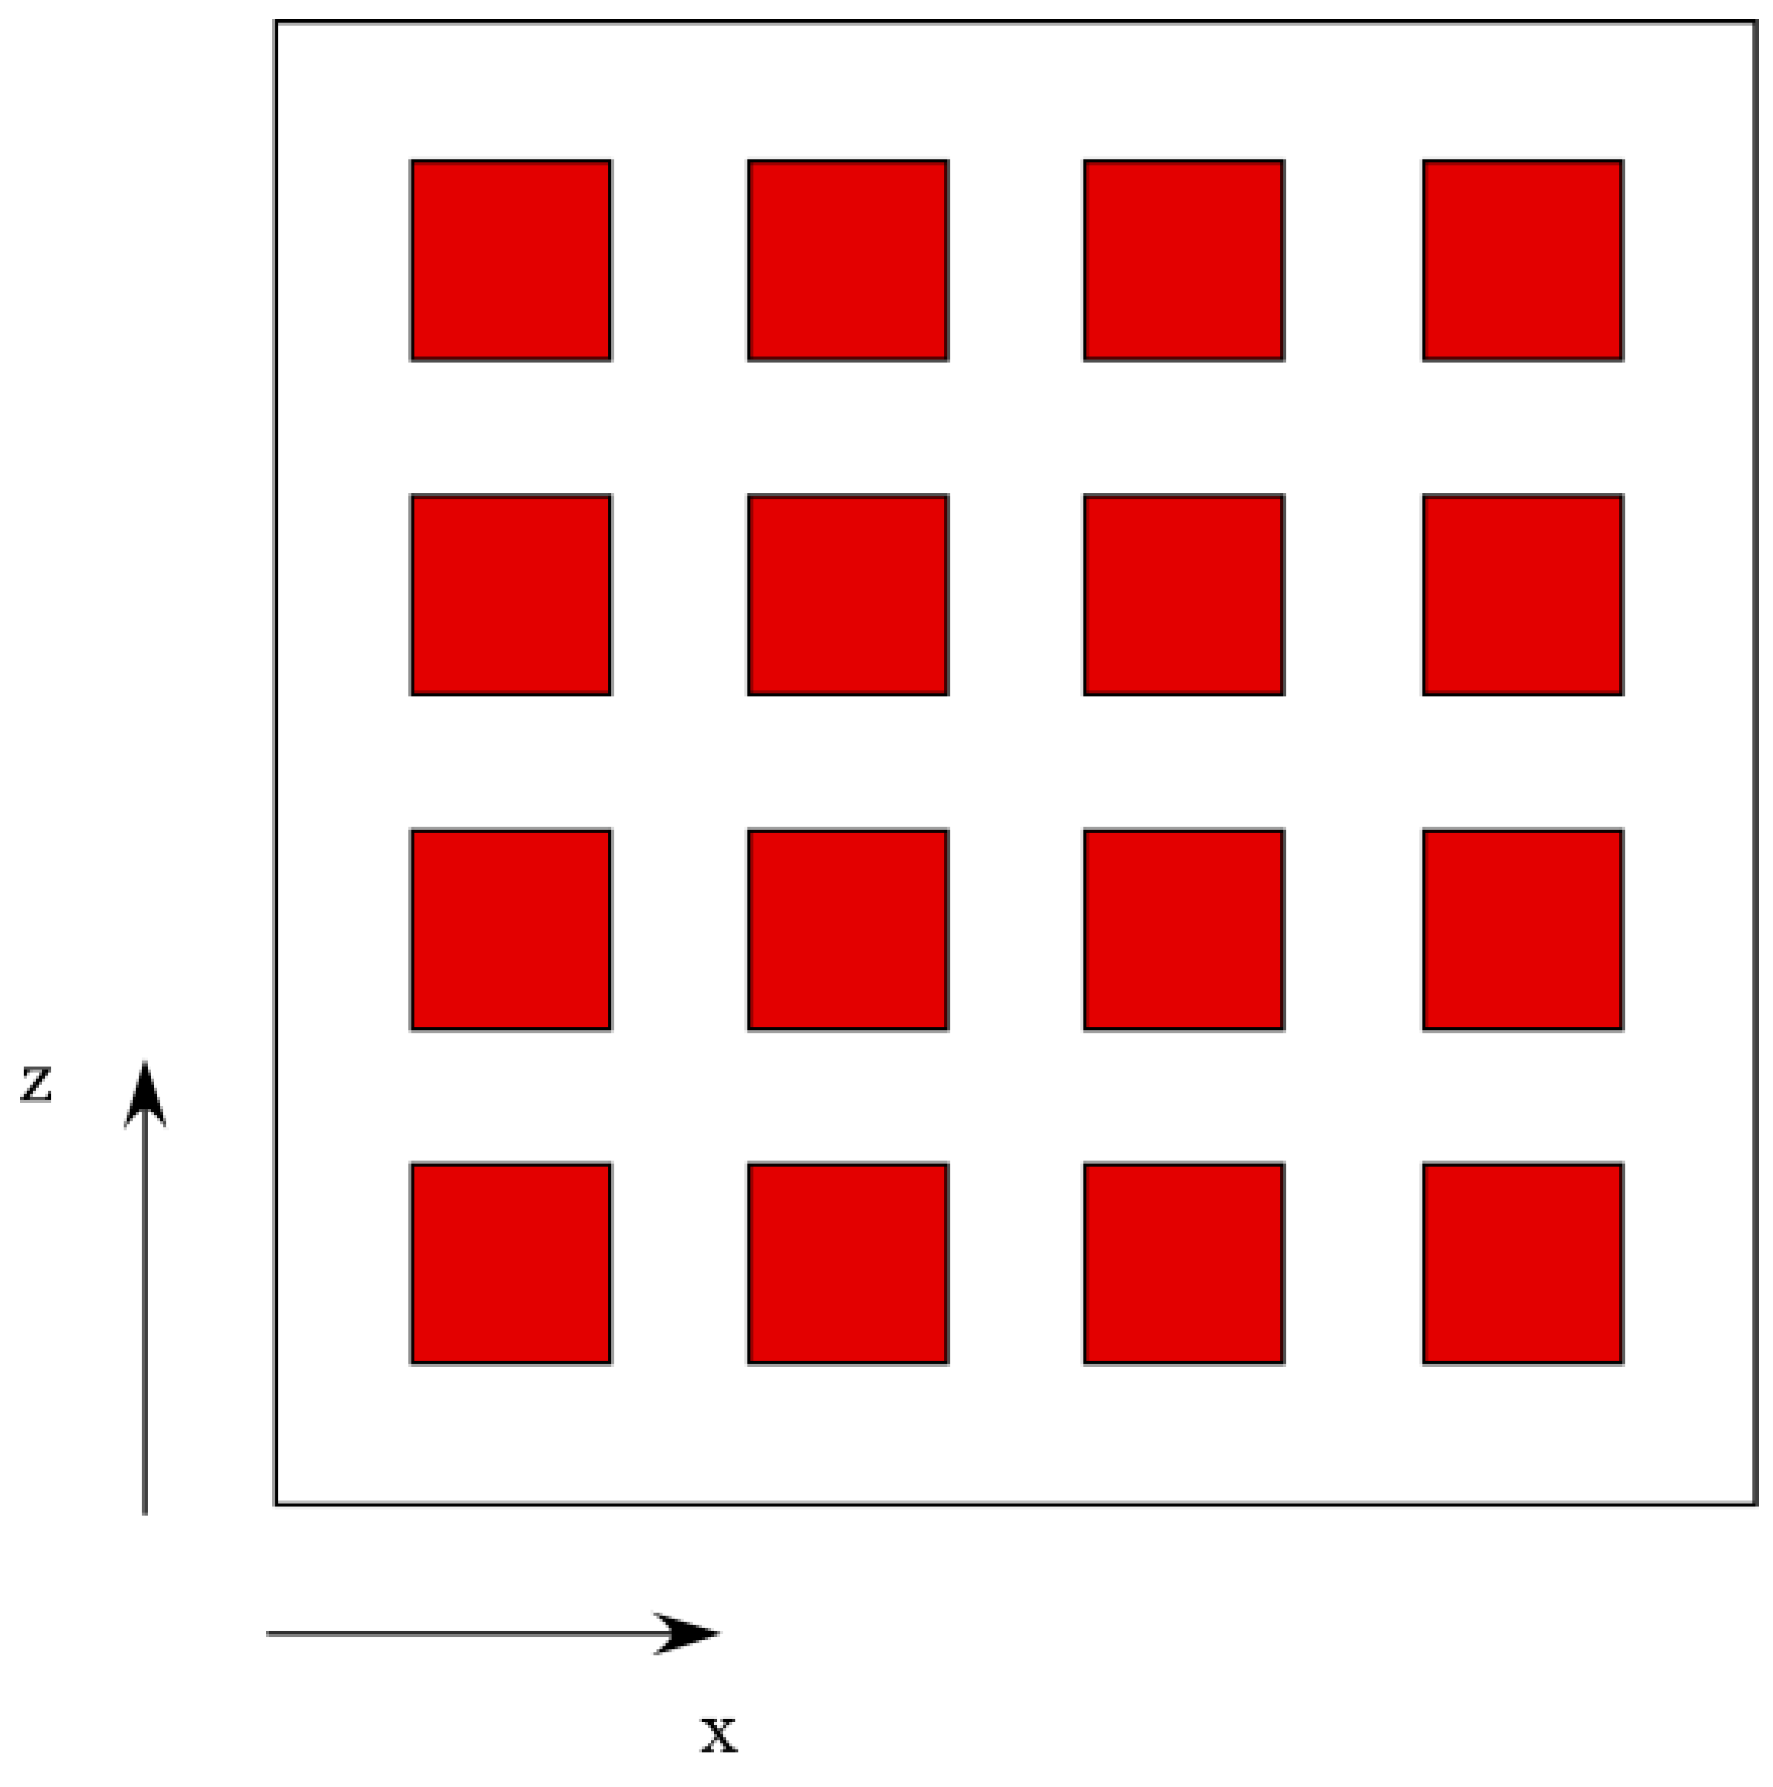
Figure 1. Sketch of the fluid layer with successions of square bars evenly mounted on the bottom wall along two perpendicular directions (as seen from above).
Fluids 06 00447 g001
Figure 2. Three-dimensional view of the fluid layer hosting an array of square bars resting on the bottom wall (hot blocks), uniformly spaced along the x and z (horizontal) directions (spacing, width and height can be systematically varied).
Fluids 06 00447 g002
Figure 3. Temperature and streamlines in a square cavity with heater located on an adiabatic bottom and the other (lateral and top) walls kept at a constant (cold) temperature (Pr = 25.83, different values of Ra and the heated element aspect ratio); (a) δhoriz = 0.33, Abar = 1.0, Ra = 104 (grid 70 × 70); (b) δhoriz = 0.64, Abar = 0.3, Ra = 105(grid 100 × 100).
Fluids 06 00447 g003
Figure 4. Three-dimensional (3D) Temperature snapshots (Pr = 0.01, 3 × 3 configuration): (a) adiabatic floor with PBC, (b) adiabatic floor with lateral SW, (c) hot floor with lateral PBC, (d) hot floor with lateral SW; (i) δvert = 0.5, (ii) δvert = 0.6, (iii) δvert = 0.7.
Fluids 06 00447 g004
Figure 5. Temperature distribution snapshots in the plane z = 5 (Pr = 0.01, 3 × 3 configuration): (a) adiabatic floor with PBC, (b) adiabatic floor with lateral SW, (c) hot floor with lateral PBC, (d) hot floor with lateral SW; (i) δvert = 0.5, (ii) δvert = 0.6, (iii) δvert = 0.7.
Fluids 06 00447 g005
Figure 6. Snapshots of the streamlines of the velocity field projected on the z = 5 plane, colored according to the corresponding distribution of temperature (Pr = 0.01, 3 × 3 configuration): (a) adiabatic floor with PBC, (b) adiabatic floor with lateral SW, (c) hot floor with lateral PBC, (d) hot floor with lateral SW; (i) δvert = 0.5, (ii) δvert = 0.6, (iii) δvert = 0.7.
Fluids 06 00447 g006
Figure 7. 3D Temperature snapshots (Pr = 0.01, δvert = 0.6): (a) adiabatic floor with PBC, (b) adiabatic floor with lateral SW, (c) hot floor with lateral PBC, (d) hot floor with lateral SW; (i) 3 × 3 array (ii) 5 × 5 array.
Fluids 06 00447 g007
Figure 8. Temperature distribution snapshots in the plane z = 5 (Pr = 0.01, δvert = 0.6): (a) adiabatic floor with PBC, (b) adiabatic floor with lateral SW, (c) hot floor with lateral PBC, (d) hot floor with lateral SW; (i) 3 × 3 array (ii) 5 × 5 array.
Fluids 06 00447 g008
Figure 9. Snapshots of the streamlines of the velocity field projected on the z = 5 plane, colored according to the corresponding temperature distribution (Pr = 0.01, δvert = 0.6): (a) adiabatic floor with PBC, (b) adiabatic floor with lateral SW, (c) hot floor with lateral PBC, (d) hot floor with lateral SW; (i) 3 × 3 array (ii) 5 × 5 array.
Fluids 06 00447 g009
Figure 10. 3D Temperature snapshots (δvert = 0.6): (a) adiabatic floor with PBC, (b) adiabatic floor with lateral SW, (c) hot floor with lateral PBC, (d) hot floor with lateral SW; (i) Pr = 0.01 (ii) Pr = 0.1 (iii) Pr = 1.
Fluids 06 00447 g010
Figure 11. Temperature distribution snapshots in the plane z = 5 (δvert = 0.6): (a) adiabatic floor with PBC, (b) adiabatic floor with lateral SW, (c) hot floor with lateral PBC, (d) hot floor with lateral SW; (i) Pr = 0.01 (ii) Pr = 0.1 (iii) Pr = 1.
Fluids 06 00447 g011
Figure 12. Snapshots of the streamlines of the velocity field projected on the z = 5 plane, colored according to the corresponding temperature distribution (δvert = 0.6): (a) adiabatic floor with PBC, (b) adiabatic floor with lateral SW, (c) hot floor with lateral PBC, (d) hot floor with lateral SW; (i) Pr = 0.01 (ii) Pr = 0.1 (iii) Pr = 1.
Fluids 06 00447 g012
Figure 13. Frequency spectra for 3 × 3 (left) and 5 × 5 array (right) for adiabatic floor with lateral SW and δvert = 0.6 (the red straight line indicates the Kolmogorov scaling; the spectra refer to the temperature signal measured by a probe located above one of the heated blocks, at y = 0.8).
Fluids 06 00447 g013
Figure 14. Frequency spectra for Pr = 0.01 (left), Pr = 0.1 (right) for adiabatic floor with lateral SW and δvert = 0.6 (the red straight line indicates the Kolmogorov scaling; the spectra refer to the temperature signal measured by a probe located above one of the heated blocks, at y = 0.8).
Fluids 06 00447 g014
Table 1. Growth rate as a function of the Marangoni number (Pr = 10, layer uniformly heated from below with aspect ratio A = 11.5, Bi = 1, mesh 150 × 25).
MaDisturbance Growth Rate
1451.535
1401.3791
1351.15125
1300.8528
1250.4899
119.3 (extrapolated)0
Table 2. Comparison with the results by Biswas et al. [26] (see Figure 7 in their work), square cavity with heater located on adiabatic bottom and other (lateral and top) walls at constant (cold) temperature (Pr = 25.83, different values of Ra and the heated element aspect ratio).
δhoriz A b a r = δ v e r t δ h o r i z Ra N u s i d e a v e r a g e
(Present)
N u t o p a v e r a g e
(Present)
N u b a r a v e r a g e
(Present)
N u b a r a v e r a g e
Biswas et al. [26]
0.640.31045.565934.24144.8381≅4.8
0.331.01044.82093.86134.5010≅4.5
0.640.310510.07097.73188.6032≅8.65
0.331.010510.50656.07019.0277≅9.1
Table 3. Grid refinement study (Pr = 0.01, aspect ratio = horizontal length/depth Ax = Az = 10, N = M = 3, Ma = 5000, Ra = 10,000, Bi = 1.0, δhoriz = 1.0, δvert = 0.6).
Grid Size135 × 135 × 32130 × 130 × 30100 × 100 × 2485 × 85 × 2160 × 60 × 15
N u s i d e a v e r a g e 1.741.741.751.821.79
N u t o p a v e r a g e 1.421.421.411.741.75
N u b a r a v e r a g e 1.661.661.651.801.81
Table 4. As a function of Pr, N, δvert and the considered boundary conditions.
PrNδvertAdiabatic Floor,
Lateral PBC
Adiabatic Floor,
Lateral SW
Hot Floor,
Lateral PBC
Hot Floor,
Lateral SW
0.0130.51.98122.02030.38640.2839
0.0130.61.74471.79150.33510.2613
0.0130.71.64061.66010.33130.3038
0.0150.60.61500.61750.36910.3662
0.130.62.21882.18730.28220.2850
1.030.62.41942.44970.38800.4203
Table 5. As a function of Pr, N, δvert and the considered boundary conditions.
PrNδvertAdiabatic Floor,
Lateral PBC
Adiabatic Floor,
Lateral SW
Hot Floor,
Lateral PBC
Hot Floor,
Lateral SW
0.0130.51.51371.51381.08980.9938
0.0130.61.50251.49411.15111.1057
0.0130.71.48671.49081.23361.2357
0.0150.61.25311.23741.21761.2283
0.130.61.39621.40321.03141.0317
1.030.61.57601.59520.82910.9107
Table 6. N u b a r a v e r a g e as a function of Pr, N, δvert and the considered boundary conditions.
PrNδvertAdiabatic Floor,
Lateral PBC
Adiabatic Floor,
Lateral SW
Hot Floor,
Lateral PBC
Hot Floor,
Lateral SW
0.0130.51.82541.85140.620850.5205
0.0130.61.67351.70410.57510.5096
0.0130.71.60011.61550.56880.5491
0.0150.60.80270.8000.61870.6198
0.130.61.97681.95670.50260.5046
1.030.62.17142.19840.51780.5645
Publisher’s Note: MDPI stays neutral with regard to jurisdictional claims in published maps and institutional affiliations.