
Numerical Study of Large-Scale Fire in Makkah’s King Abdulaziz Road Tunnel

 ,
,
Abstract
:
1. Introduction
2. Methods
2.1. Heat Feedback
2.2. Gas Temperature
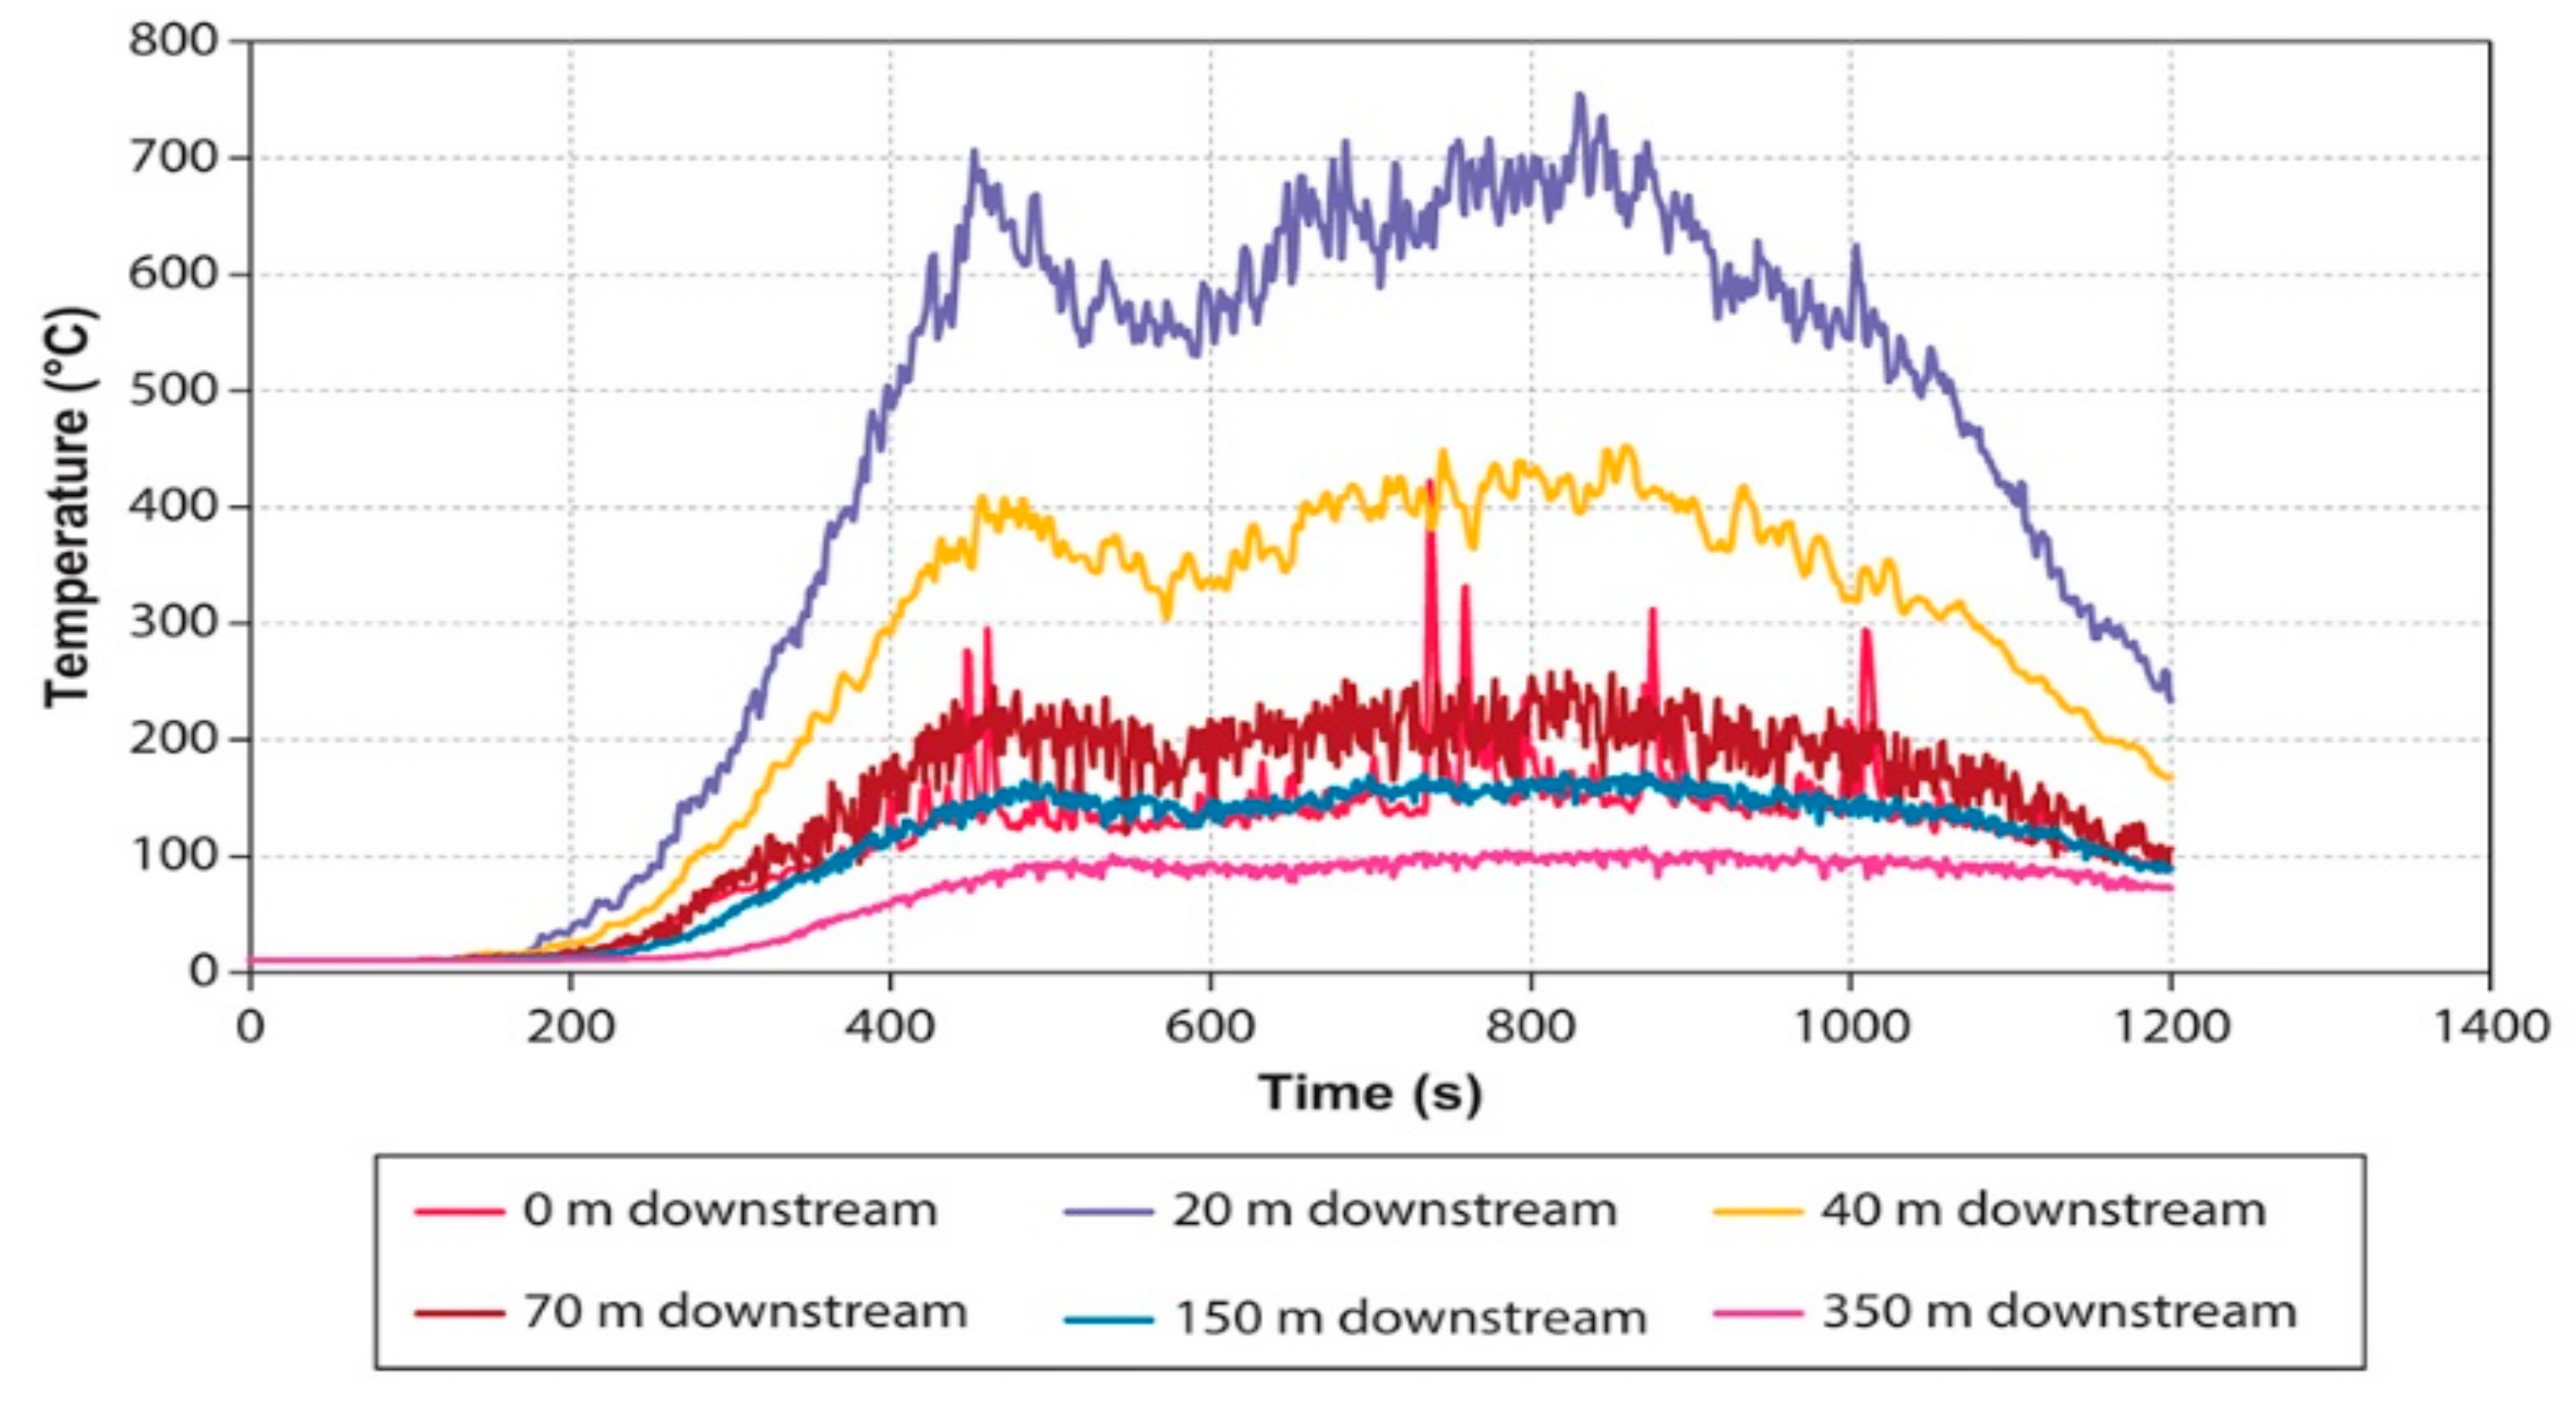
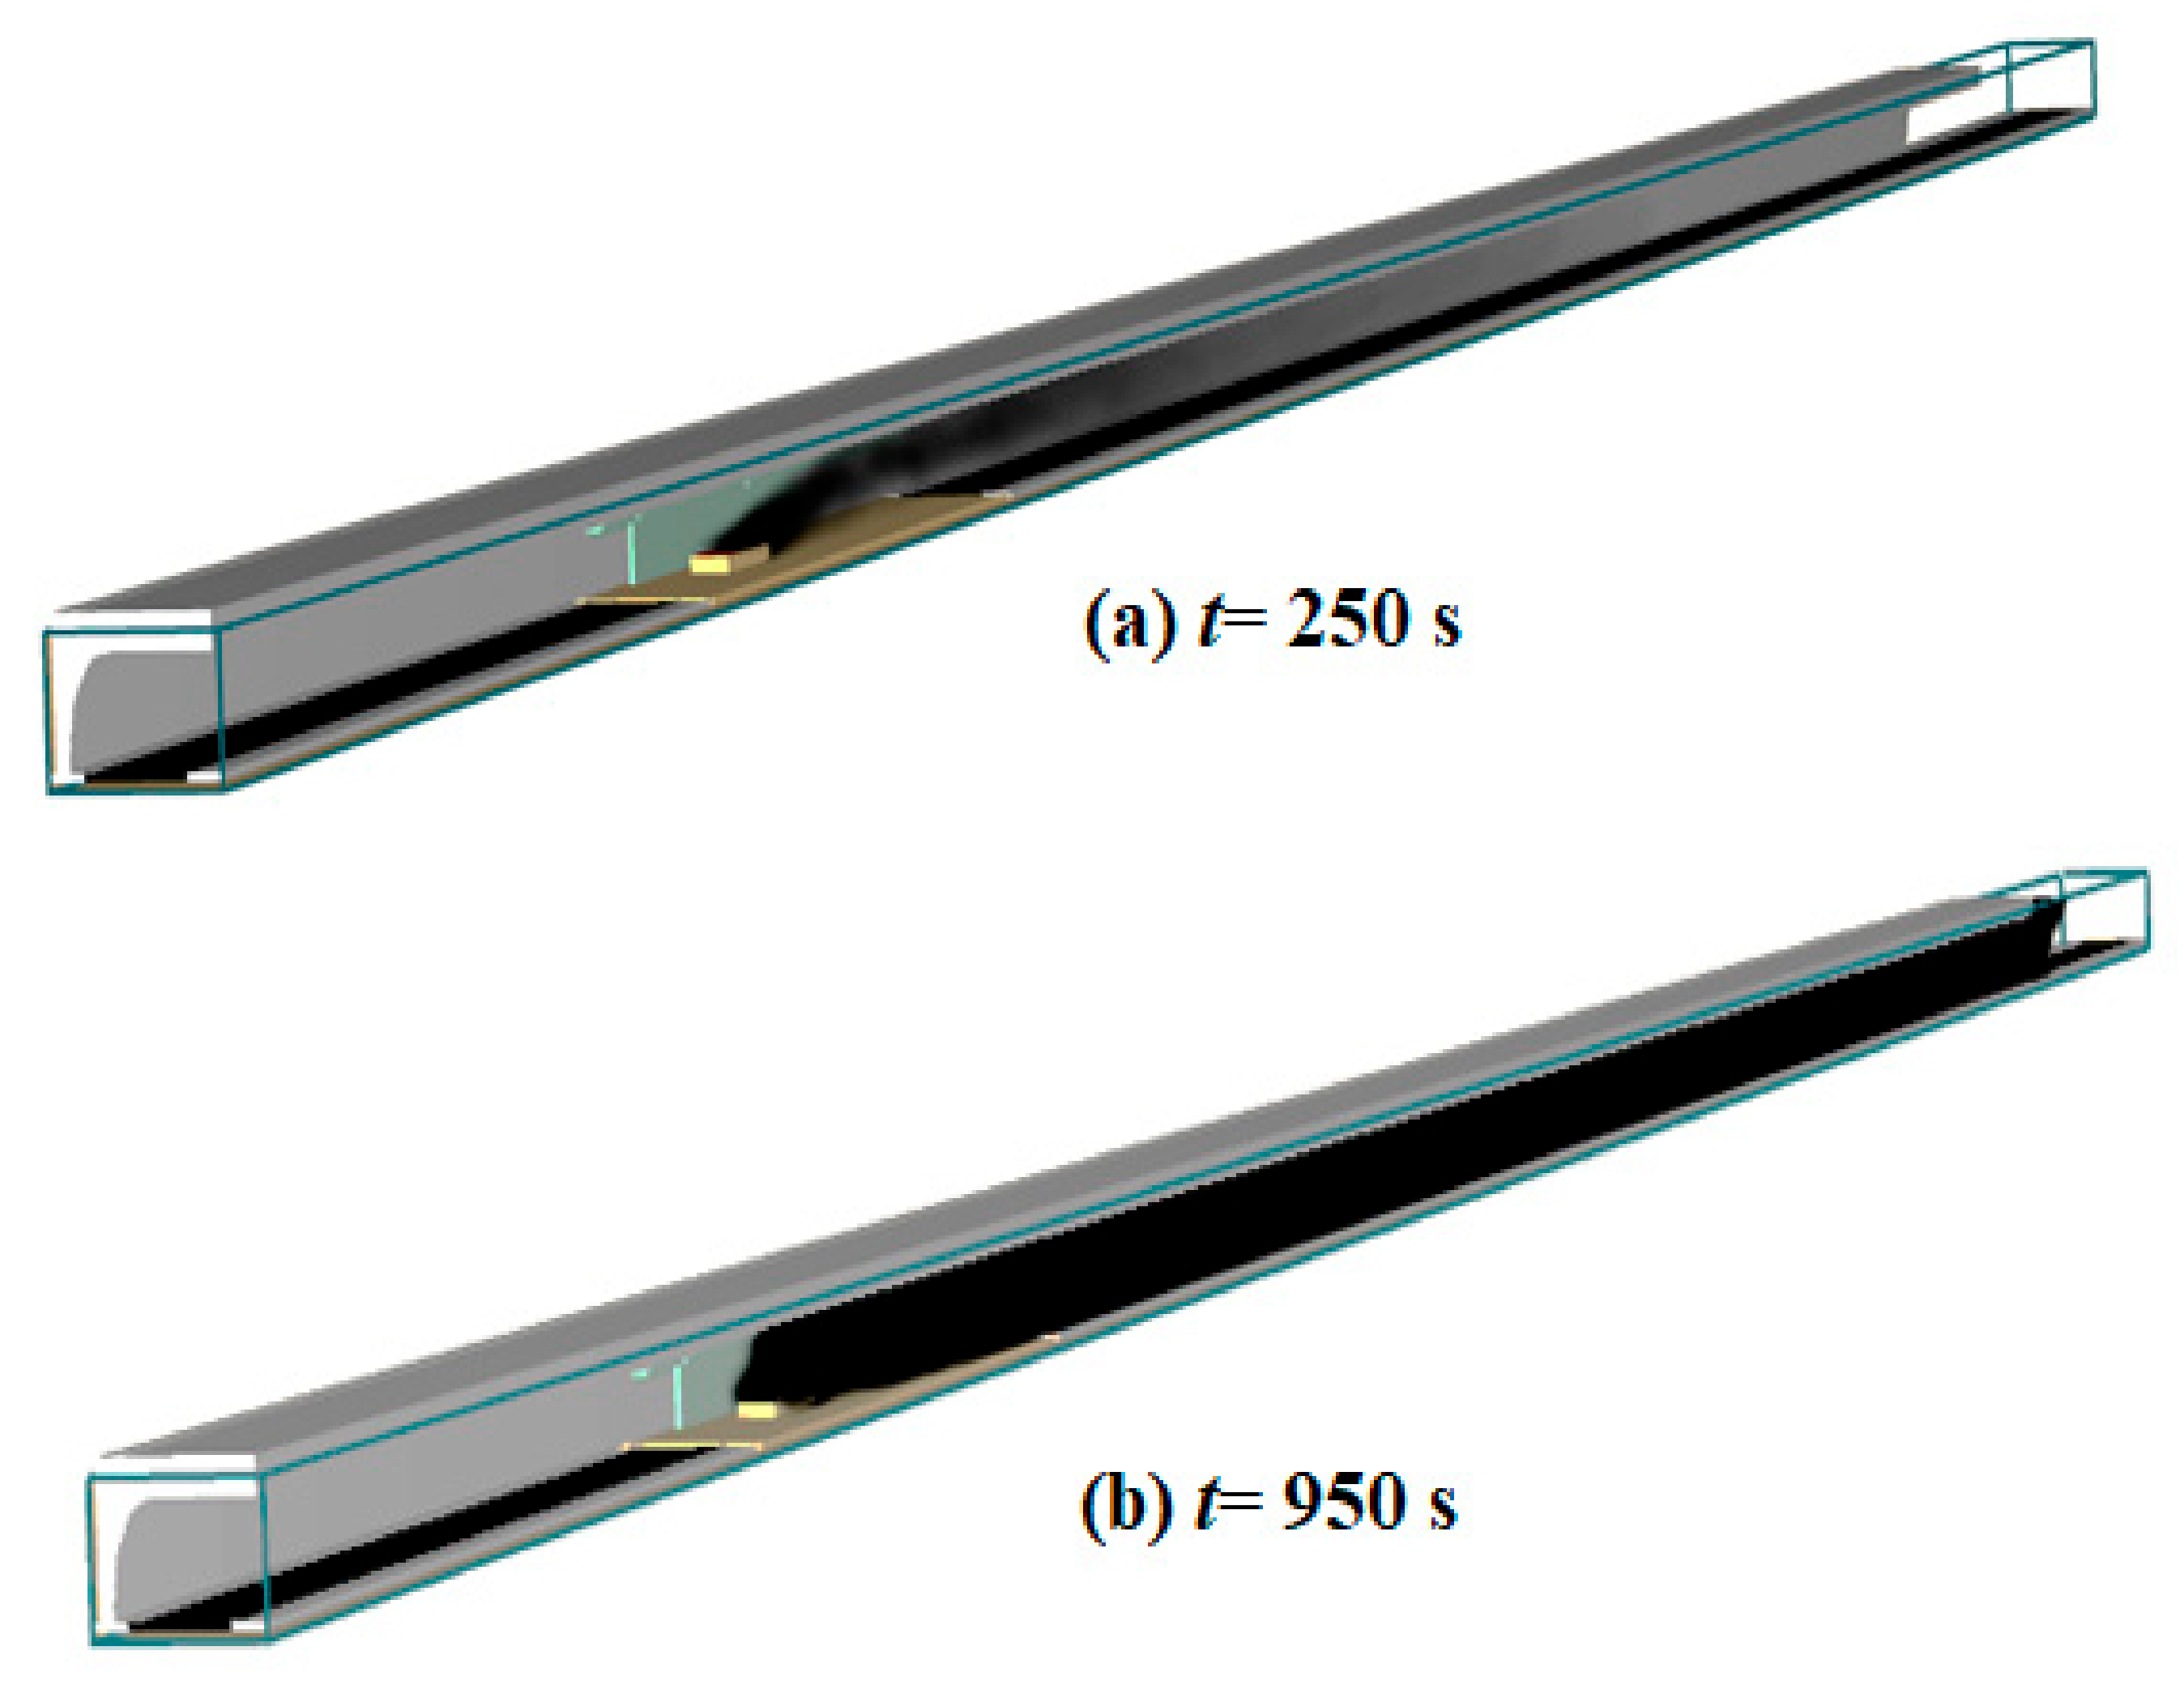
3. Results
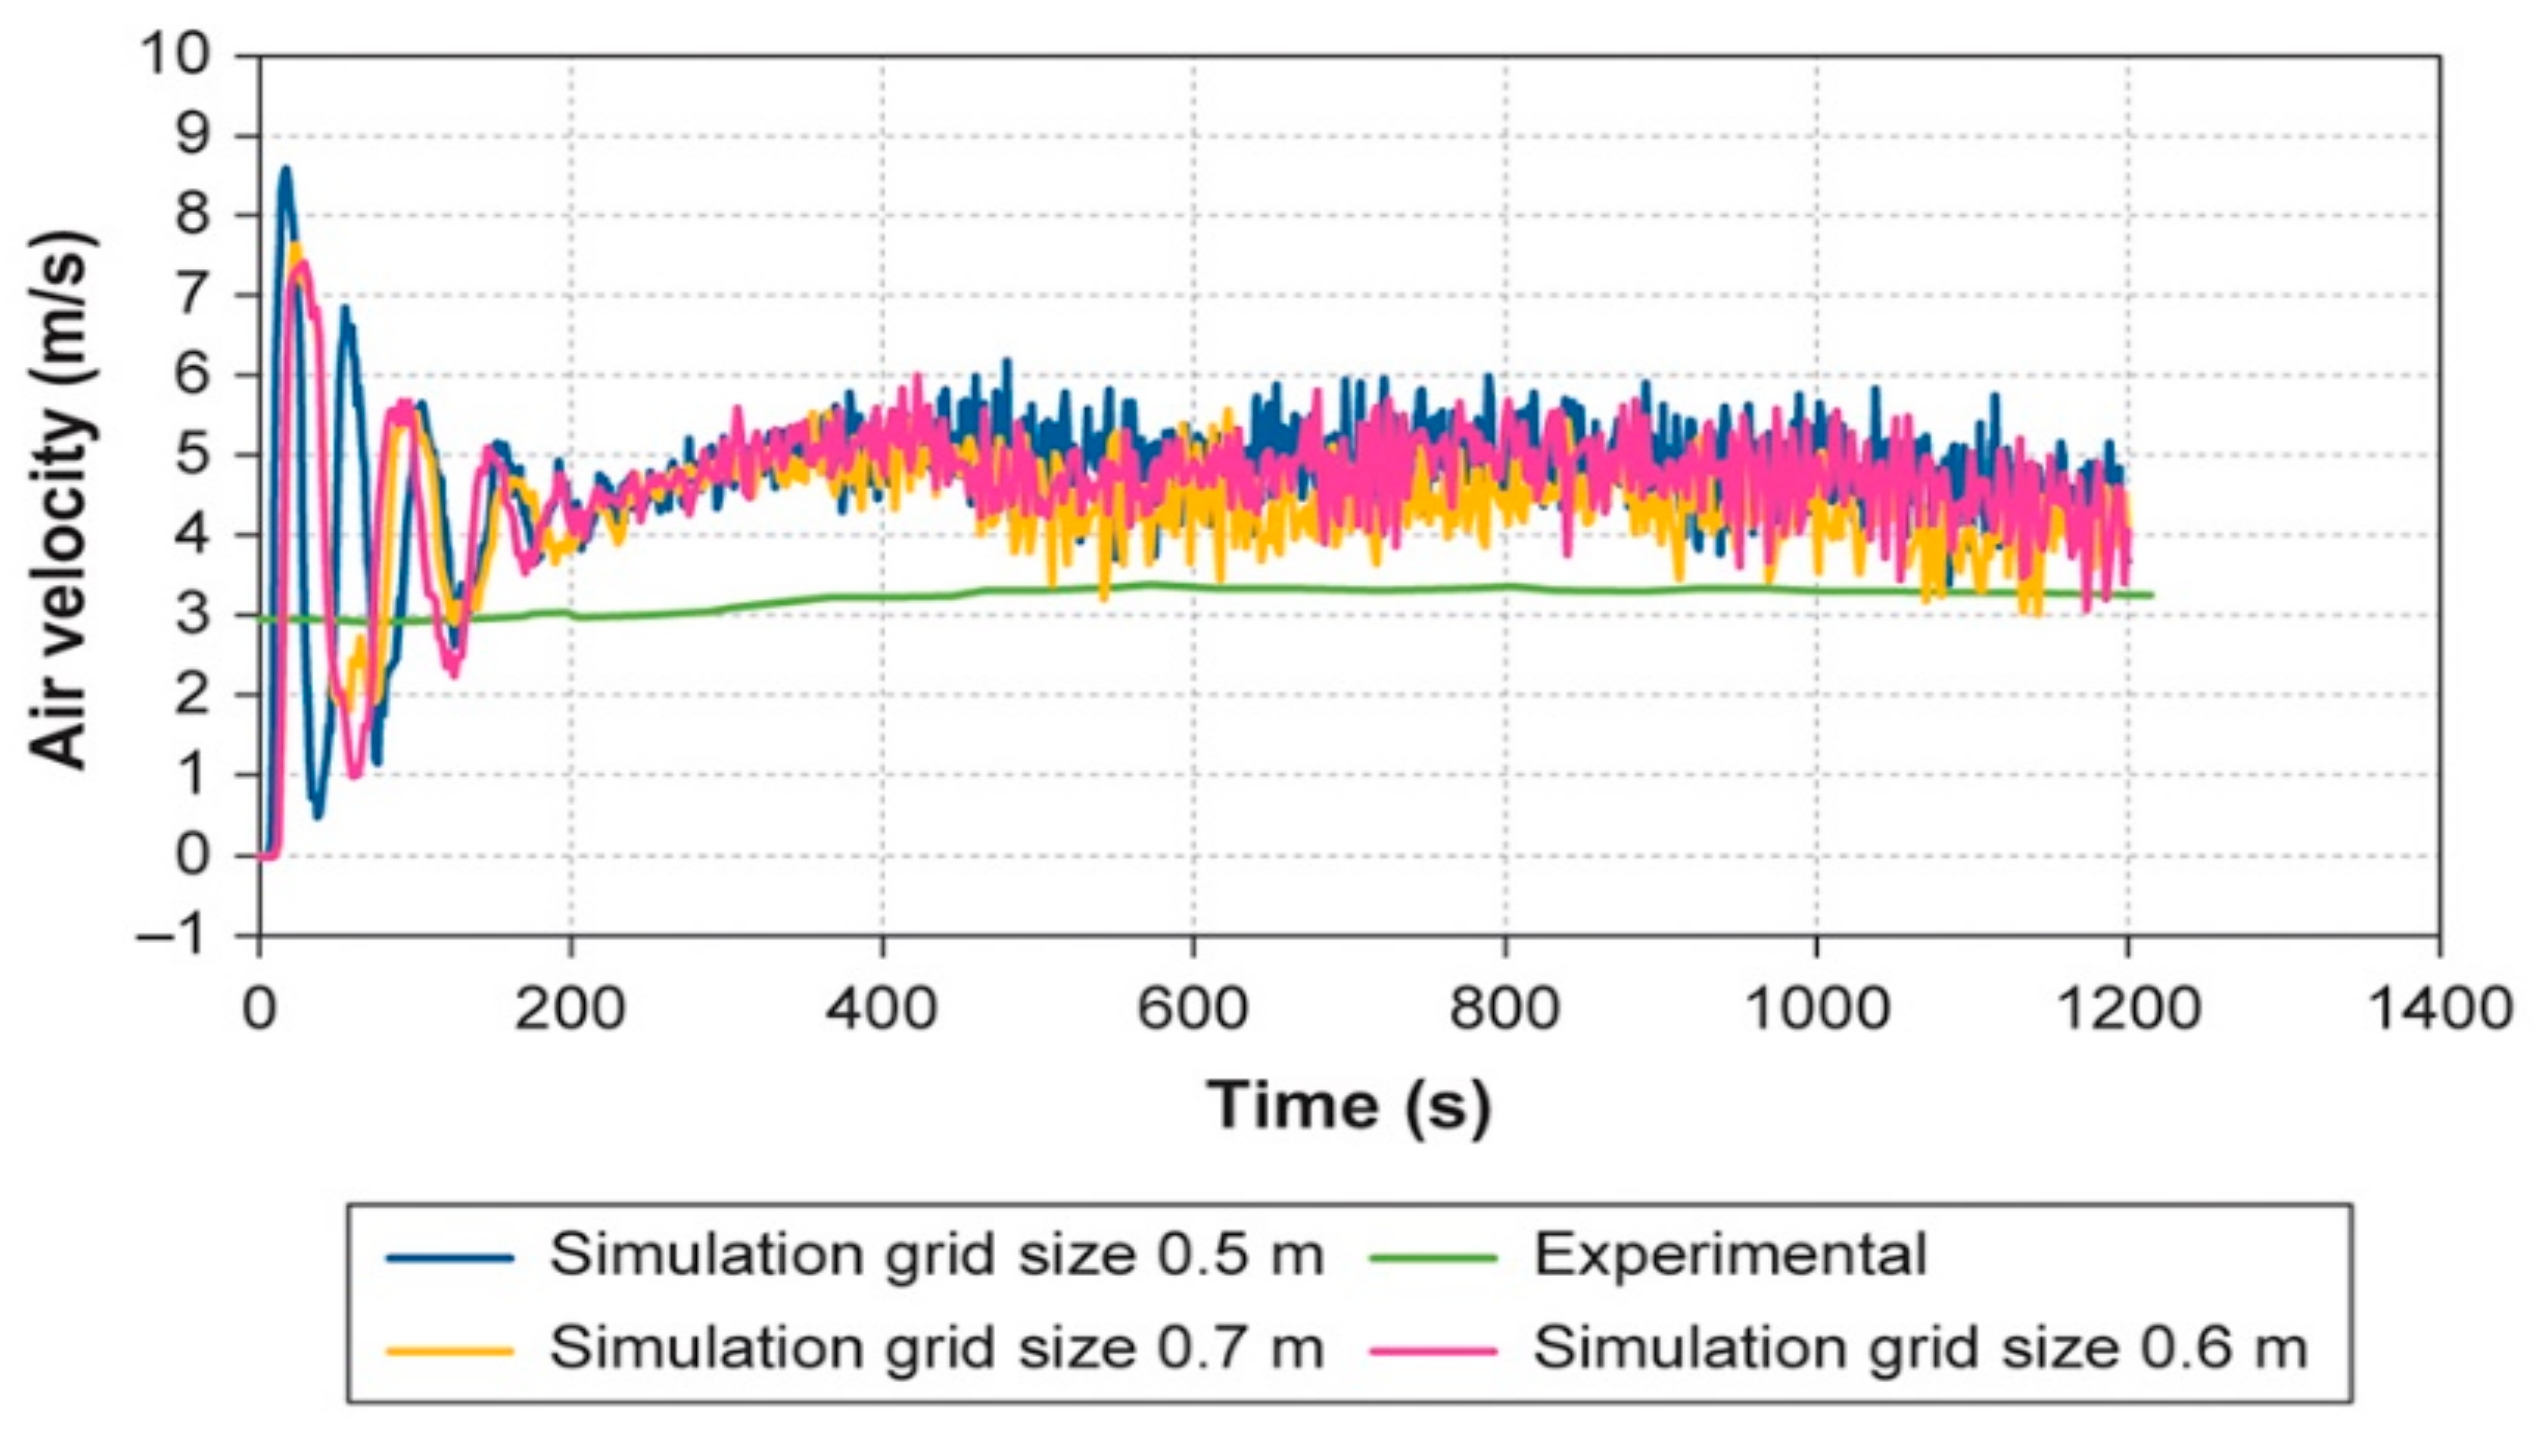
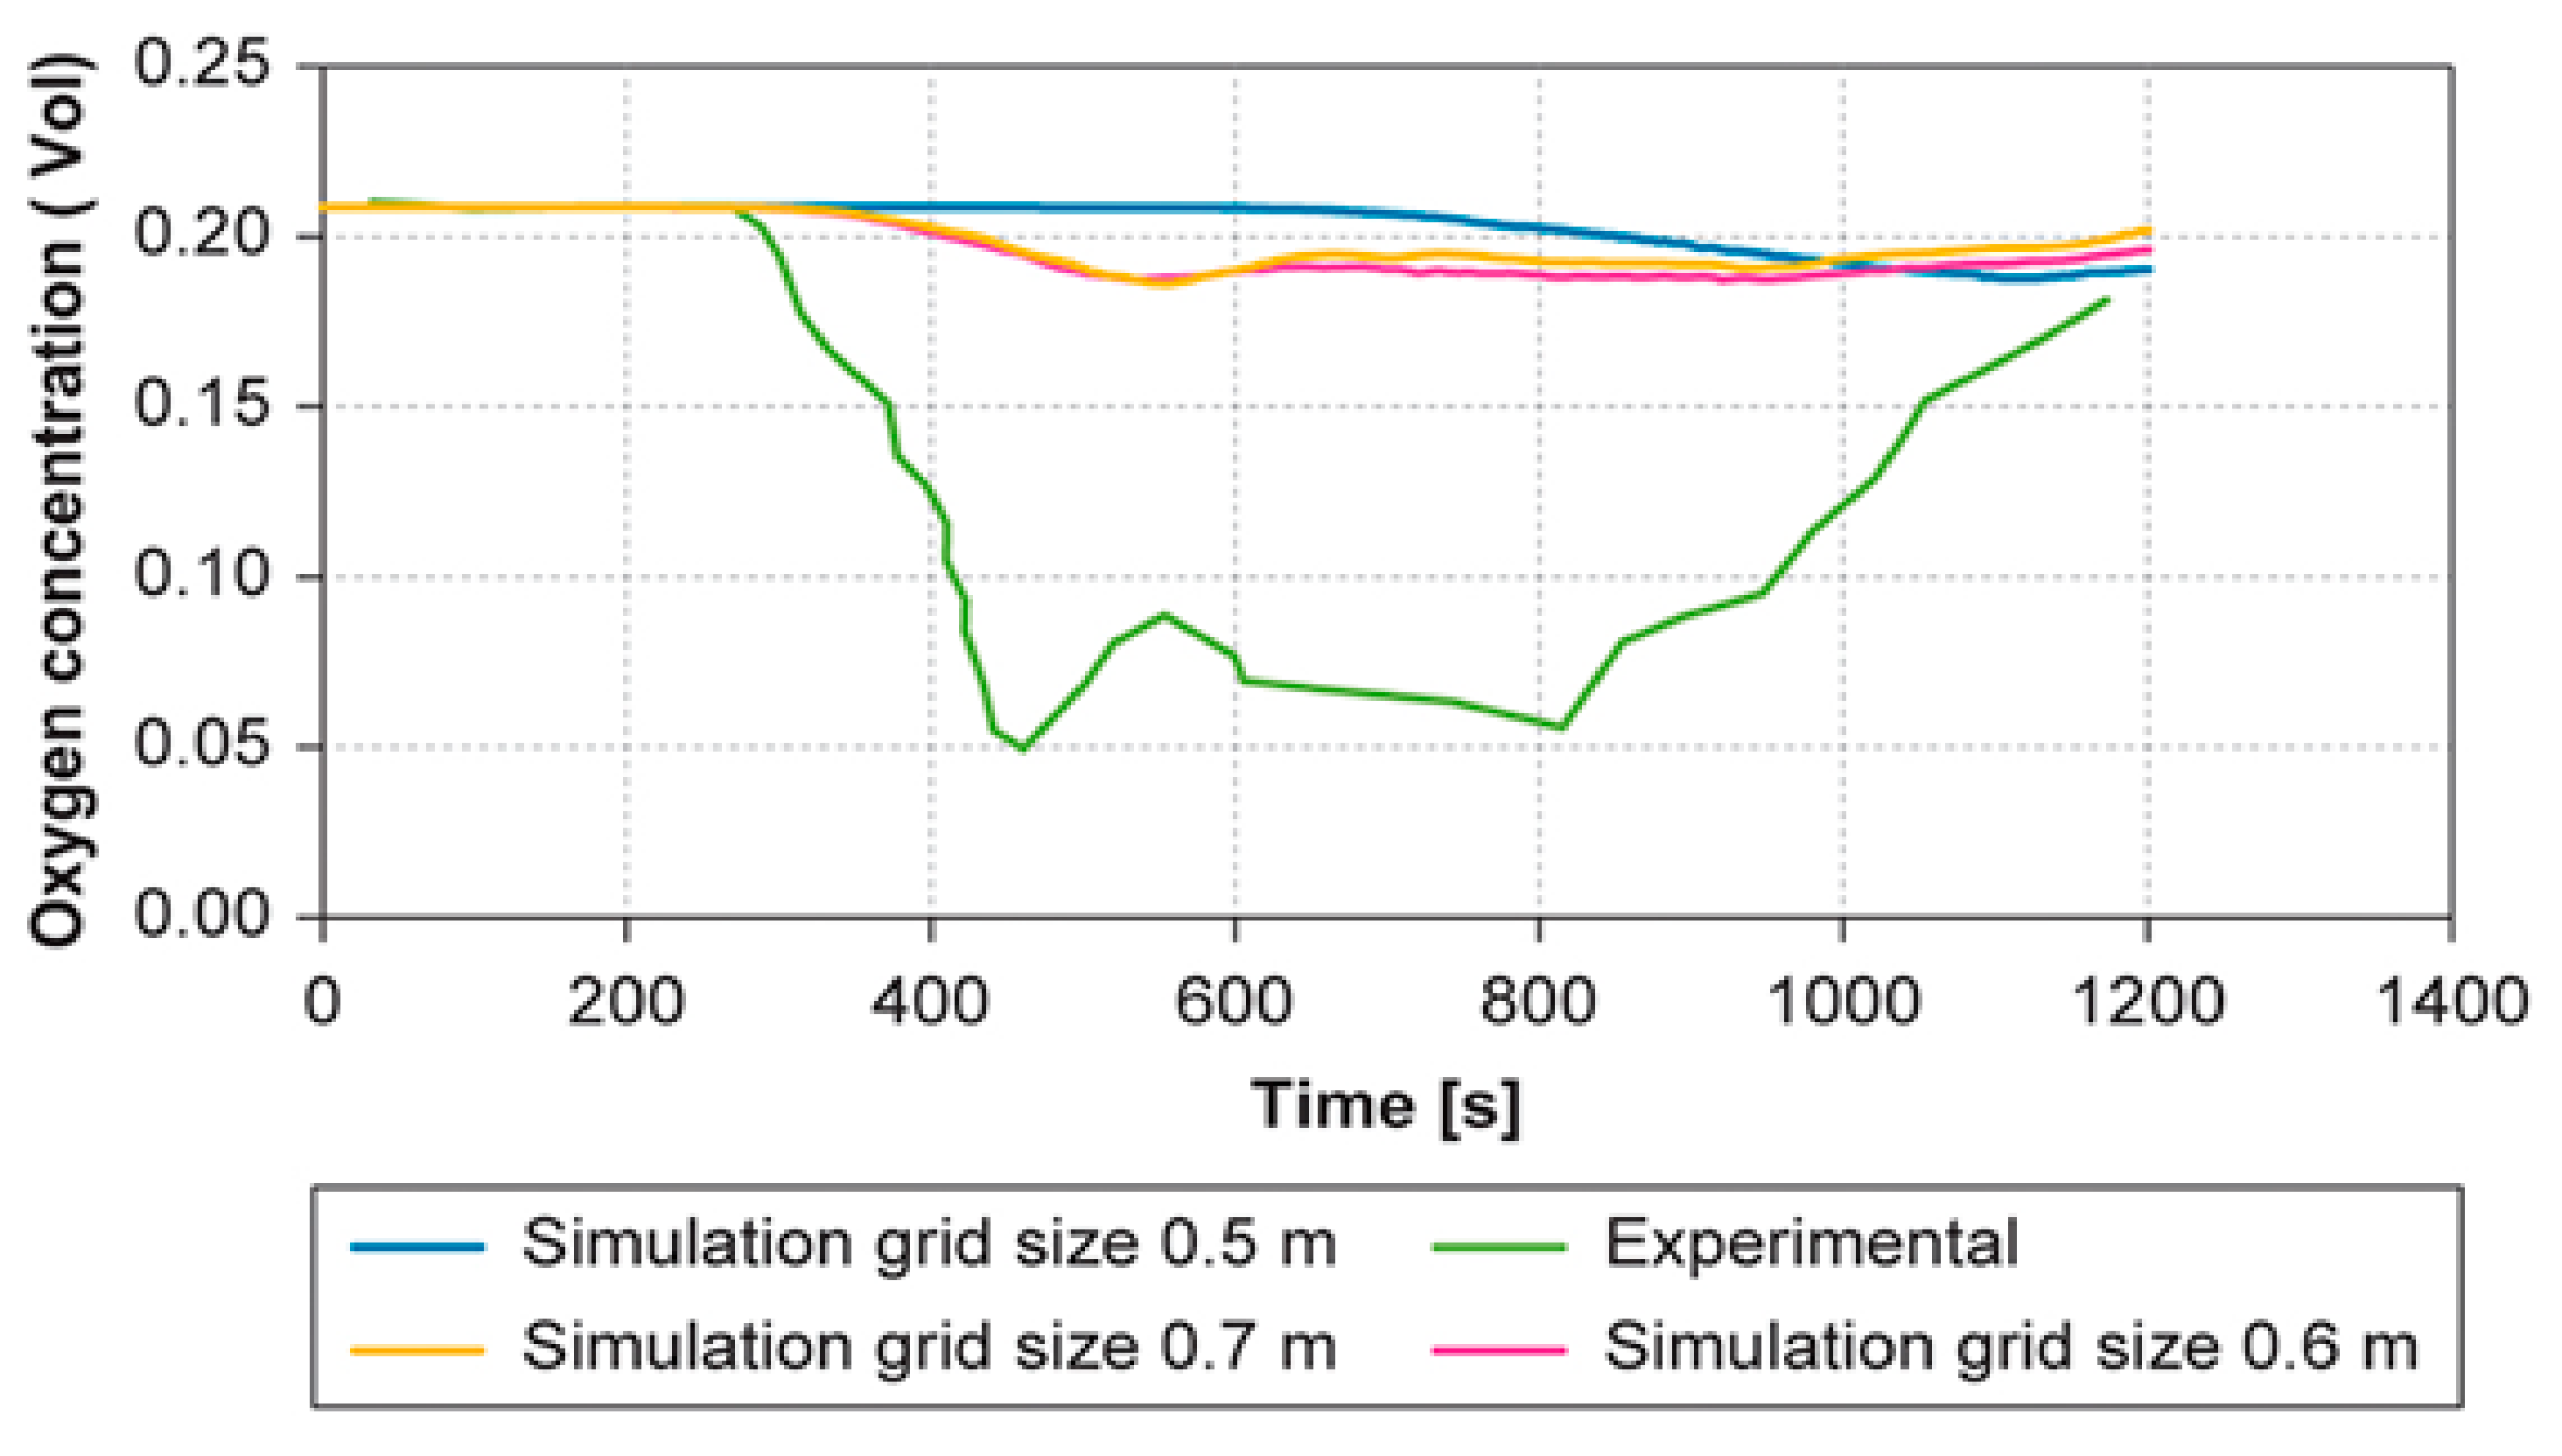
3.1. Validation
- −
- FDS smoke layer prediction exposes concerns about extensive backflow in the FDS results, which occur when the inflow velocity at the boundary is slightly reduced. The resulting flow constriction causes the simulated tunnel fire conditions to deviate from those of the actual test.
- −
- Rectilinear geometry: In our simulation the curved tunnel’ surface has been modeled by rectangular grids. Thus, the efficiency of our results is due to the limitation of a rectangular grid cells. Therefore, new techniques are recommended to be implemented to reduce the effects.
- −
- Combustion: FDS uses a mixture fraction combustion model. This model assumes that the reaction of fuel and oxygen is infinitely fast, and that the combustion is mixing controlled. For over-ventilated fires, this is a correct assumption. Combustion during under ventilated conditions and when a suppression agent is used, uncertainty increases since this is an area which needs more research.
- −
- Radiation: To solve radiation methods like those used for convection are applied, finite volume methods. Because of simplifications used for combustion, the chosen chemical composition of the fuel and the soot yield can affect the absorption and emission of thermal radiation. Another simplification is that the radiative heat transport is discretized in 100 solid angles [19]. This can affect the distribution of radiant energy further away from the fire. This can be solved by increasing the number of angles, but this increases the computational time as well.
3.2. Study of fire in Makkah’s King Abdulaziz Road Tunnel
3.2.1. Effects of HRRPUA
3.2.2. Effects of Soot Yield
3.2.3. Effects of CO Yield
4. Conclusions
Author Contributions
Funding
Data Availability Statement
Acknowledgments
Conflicts of Interest
References
- Lapointe, C.; Wimer, N.T.; Simons-Wellin, S.; Glusman, J.F.; Rieker, G.B.; Hamlington, P.E. Efficient simulations of propagating flames and fire suppression optimization using adaptive mesh refinement. Fluids 2021, 6, 323. [Google Scholar] [CrossRef]
- Kodakoglu, F.; Demir, S.; Valiev, D.; Akkerman, V. Analysis of gaseous and gaseous-dusty, premixed flame propagation in Obstructed passages with tightly placed obstacles. Fluids 2020, 5, 115. [Google Scholar] [CrossRef]
- Li, L.; Zhu, D.; Gao, Z.; Xu, P.; Zhang, W. A study on longitudinal distribution of temperature rise and carbon monoxide concentration in tunnel fires with one opening portal. Case Stud. Therm. Eng. 2021, 28, 101535. [Google Scholar] [CrossRef]
- Xu, X.; Zhu, G.; Zhang, X.; Chai, G.; Chu, T. Numerical study on temperature distribution of tunnel structure in fires. Case Stud. Therm. Eng. 2021, 21, 100874. [Google Scholar] [CrossRef]
- Halawa, T.; Safwat, H. Fire-smoke control strategies in road tunnels: The effectiveness of solid barriers. Case Stud. Therm. Eng. 2021, 27, 101260. [Google Scholar] [CrossRef]
- Gao, Y.; Zhu, G.; Gu, S.; Tao, H.; Zhao, Y. Experimental and numerical studies on ceiling maximum smoke temperature and longitudinal decay in a horseshoe shaped tunnel fire. Case Stud. Therm. Eng. 2018, 12, 134–142. [Google Scholar] [CrossRef]
- Fragkopoulou, M. Road Tunnel Fire Safety: Determining the Effect of the Performance of Technological Systems for Fire Detection on Fire Detection Time and on the Total Evacuation Time. Master’s Thesis, Department of Building Engineering, TU Delft, Delft, The Netherlands, 2016. [Google Scholar]
- Peacock, R.D.; Walter, W.; Jones, W.; Reneke, P.A.; Forney, G.P. CFAST–Consolidated Model of Fire Growth and Smoke Transport (Version 6); special publication 1041; NIST: Gaithersburg, MD, USA, 2005. [Google Scholar]
- Wu, C.A. System Architecture for the Integration of Smoke Propagation Simulation, Evacuation Simulation, and Building Information Modelling. Ph.D. Thesis, Texas A&M University, College Station, TX, USA, 2017. [Google Scholar]
- Floyd, J.E. Evaluation of the Predictive Capabilities of Current Computational Methods for Fire Simulation Using the HDR T51 and T52 Tests with a Focus on Performance-Based Fire Codes. Ph.D. Thesis, University of Maryland, College Park, MD, USA, 2000. [Google Scholar]
- Luo, J.; Xu, Z.; Li, F.; Zhao, J. Effect of vehicular blocking scene on smoke spread in the longitudinal ventilated tunnel fire. Case Stud. Therm. Eng. 2019, 14, 100495. [Google Scholar] [CrossRef]
- Wang, X. Fire Dynamics Simulator (FDS) Pyrolysis Model Analysis of Heavy Goods Vehicle Fires in Road Tunnels. Ph.D. Thesis, University of Canterbury, Christchurch, New Zealand, 2017. [Google Scholar]
- Bilge, M.İ. CFD Simulation of Train Fire in the İstanbul Metro Tunnel. Master’s Thesis, Middle East Technical University, Ankara, Turkey, 2018. [Google Scholar]
- Ingason, H.; Li, Y.Z.; Lönnermark, A. Tunnel Fire Dynamics; Springer: New York, NY, USA, 2014. [Google Scholar]
- Keita, T.; Futoshi, K.; Khalid, T.; Moinuddin, A.M. Combustion efficiency during fires in tunnels with natural ventilation by vitiated air including descending smoke. Fire Saf. J. 2021, 120, 103093. [Google Scholar] [CrossRef]
- Sargininsaat. Available online: https://sargininsaat.com/en/?page_id=198 (accessed on 15 November 2021).
- Li, Y.Z.; Bo, L.; Ingason, H. Study of critical velocity and backlayering length in longitudinally ventilated tunnel fires. Fire Saf. J. 2010, 45, 361–370. [Google Scholar] [CrossRef]
- Blazek, J. Computational Fluid Dynamics: Principles and Applications; Butterworth-Heinemann, Elsevier Ltd.: Oxford, UK, 2015. [Google Scholar] [CrossRef]
- McGrattan, K.; Hostikka, S.; McDermott, R.; Floyd, J.; Weinschenk, C.; Overholt, K. Fire Dynamics Simulator Technical Reference Guide, Volume 3: Validation; special publication 1018-3; NIST: Gaithersburg, MD, USA, 2017. [Google Scholar]
- Lönnermark, A.; Claesson, A.; Lindström, J.; Li, Y.Z.; Kumm, M.; Ingason, H. Full-Scale Fire Tests with a Commuter Train in a Tunnel; Fire Technology SP Report: 2012:05; SP Technical Research Institute of Sweden: Borås, Sweden, 2012; ISSN 0284-5172.
- Carvel, R.O.; Beard, A.N.; Jowitt, P.W.; Drysdale, D.D. Variation of heat release rate with forced longitudinal ventilation for vehicle fires in tunnels. Fire Saf. J. 2001, 31, 569–596. [Google Scholar] [CrossRef]
- Carvel, R.O.; Beard, A.N.; Jowitt, P.W.; Drysdale, D.D. The influence of tunnel geometry and ventilation on the heat release rate of a fire. Fire Technol. 2004, 40, 5–26. [Google Scholar] [CrossRef]
- Ingason, H.; Li, Y.Z. Model scale tunnel fire tests with longitudinal ventilation. Fire Saf. J. 2010, 45, 371–384. [Google Scholar] [CrossRef]
- Guedri, K.; Borjini, M.N.; Jeguirum, M.; Brilhac, J.-F.; Said, R. Numerical study of radiative heat transfer effects on a complex configuration of rack storage fire. Energy 2011, 36, 2984–2996. [Google Scholar] [CrossRef]
- Li, Y.Z.; Ingason, H.; Lönnermark, A. Numerical simulation of Runehammer tunnel fire tests. In Proceedings of the 6th International Symposium “Tunnel Safety and Ventilation”, Graz, Austria, 23–25 April 2012; Sturm, P.J., Minarik, S., Eds.; Volume 95, pp. 203–210. [Google Scholar]
- Kim, E. A Study of Pulsation in Runehammer Tunnel Fire Tests with Forced Longitudianal Ventilation. Ph.D. Thesis, Worcester Polytechnic Institute (WPI), Texas A&M University, Dallas, TX, USA, 2006. [Google Scholar]
- Marin, M.; Craciun, E.M.; Pop, N. Some results in green–lindsay thermoelasticity of bodies with dipolar structure. Mathematics 2020, 8, 497. [Google Scholar] [CrossRef] [Green Version]


| Material | Thermal Conductivity [W/mK] |
|---|---|
| Concrete | 0.8 |
| Steel | 50.2 |
| Fuel | Diesel |
|---|---|
| Soot yield | 0.046 |
| Heat of combustion (kJ/kg) | 21.05 |
| CO yield | 0.0145 |
| HRRPUA (kW) | 2214 |
| Distance from Fire (m) | Measurements Placed on | Difference Estimating Maximum Radiation Level | Relative Difference Estimating Maximum Radiation Level (%) | ||
|---|---|---|---|---|---|
| Grid Cell Size (m) | Grid Cell Size (m) | ||||
| 0.5 | 0.6 | 0.5 | 0.6 | ||
| 0 | Ceiling | −332.61 | −376.42 | −84.23 | −96.05 |
| 20 | Celling | −11.45 | −88.24 | −68.89 | −82.50 |
| 40 | Ceiling | −22.42 | −11.91 | −18.52 | −63.61 |
| Distance from Fire (m) | Height Above Road Surface (m) | Difference Estimating Minimum Oxygen Concentration | |||
|---|---|---|---|---|---|
| Grid Cell Size | |||||
| 50 cm | 60 cm | ||||
| mol/mol | % | mol/mol | % | ||
| 458 | 5.1 | 13.81 | 27.92% | 13.78 | 27.84% |
| 458 | 2.9 | 13.82 | 27.94% | 13.77 | 27.85% |
| 458 | 0.7 | 13.818 | 27.93% | 13.78 | 27.84% |
| Distance from Fire (m) | Grid Cell Size (cm) | Height above Road Surface (m) | Difference of Maximum Air Velocity | Difference of the Averaged Amount of Air Velocity | ||
|---|---|---|---|---|---|---|
| (m/s) | % | (m/s) | % | |||
| 458 | 50 | 2.9 | 5.19 | 60.6 | 4.72 | 67.27 |
| 458 | 60 | 2.9 | 4.03 | 54.38 | 1.44 | 45.43 |
| 458 | 70 | 2.9 | 4.25 | 55.68 | 1.15 | 36.32 |
| Distance from Fire (m) | Height above Road Surface (m) | Difference Estimating Temperature Averaged over First 1200 s (°C) |
|---|---|---|
| 0 | 5.7 | −359.18 |
| 20 | 5.7 | 24.47 |
| 40 | 5.7 | −158.43 |
| 100 | 5.7 | −80.72 |
| 100 | 1.8 | −71.94 |
| 250 | 5.7 | −7.45 |
| 250 | 1.8 | 5.93 |
| 350 | 5.7 | 14.33 |
| 458 | 5.7 | 19.55 |
| Parameter | Original Value | +15% | Difference Ratio (%) | −15% | Difference Ratio (%) |
|---|---|---|---|---|---|
| Temperature (°C) | 50.27 | 55.90 | 11.19 | 46.20 | −8.11 |
| Radiation flux (W/m2) | −10,407.18 | −23,096.42 | 54.94 | −15,308.88 | −32.02 |
| Oxygen concentration (mol/mol) × 10−2 | 19.86 | 19.61 | −1.25 | 20.02 | 0.87 |
| CO concentration (mol/mol) × 10−5 | 13.01 | 15.89 | 22.13 | 10.87 | −25.57 |
| CO2 concentration (mol/mol) × 10−5 | 8.64 | 10.41 | 20.45 | 7.25 | −16.08 |
| Air velocity (m/s) | 3.52 | 0.29 | 4.44 | 3.51 | −0.86 |
| Parameter | Soot Yield Change | ||||
|---|---|---|---|---|---|
| Original Value | +25% | Difference Ratio (%) | −25% | Difference Ratio (%) | |
| Temperature (°C) | 50.27 | 55.40 | 9.26 | 56.76 | −12.91 |
| HRR (kW) | 22,722.81 | 41,404.86 | 45.12 | 40,705.8 | 44.18 |
| Oxygen concentration (mol/mol) × 10−2 | 19.84 | 19.71 | −0.65 | −19.69 | −0.76 |
| CO concentration (mol/mol) × 10−5 | 13.01 | 15.05 | 15.68 | −14.73 | −12.57 |
| CO2 concentration (mol/mol) × 10−5 | 8.64 | 9.61 | 11.22 | −9.95 | −15.16 |
| Air velocity | 3.52 | 3.71 | 5.39 | 3.69 | −4.65 |
| Parameter | CO Yield Change | ||||
|---|---|---|---|---|---|
| Original Value | +10% | Difference Ratio (%) | −10% | Difference Ratio (%) | |
| Temperature (°C) | 50.27 | 50.66 | 0.78 | 55.07 | −8.73 |
| Oxygen concentration (mol/mol) × 10−2 | 19.84 | 19.86 | 0.09 | −19.59 | −1.27 |
| CO concentration (mol/mol) × 10−5 | 13.01 | 14.273 | 9.68 | −14.73 | −11.15 |
| CO2 concentration (mol/mol) × 10−5 | 8.64 | 11 | 27.19 | −5.73 | −33.68 |
| Air velocity (m/s) | 3.52 | 3.53 | 0.47 | −3.31 | −8.61 |
| HRR (kW) | 20,993.78 | 36,620.56 | 42.67 | 40,894.22 | 48.66 |
Publisher’s Note: MDPI stays neutral with regard to jurisdictional claims in published maps and institutional affiliations. |
© 2021 by the authors. Licensee MDPI, Basel, Switzerland. This article is an open access article distributed under the terms and conditions of the Creative Commons Attribution (CC BY) license (https://creativecommons.org/licenses/by/4.0/).
Share and Cite
Guedri, K.; Abdoon, A.A.; Bagabar, O.S.; Oreijah, M.; Bouzid, A.; Munshi, S.M. Numerical Study of Large-Scale Fire in Makkah’s King Abdulaziz Road Tunnel. Fluids 2022, 7, 5. https://doi.org/10.3390/fluids7010005
Guedri K, Abdoon AA, Bagabar OS, Oreijah M, Bouzid A, Munshi SM. Numerical Study of Large-Scale Fire in Makkah’s King Abdulaziz Road Tunnel. Fluids. 2022; 7(1):5. https://doi.org/10.3390/fluids7010005
Chicago/Turabian StyleGuedri, Kamel, Abdullah A. Abdoon, Omar S. Bagabar, Mowffaq Oreijah, Abdessattar Bouzid, and Shadi M. Munshi. 2022. "Numerical Study of Large-Scale Fire in Makkah’s King Abdulaziz Road Tunnel" Fluids 7, no. 1: 5. https://doi.org/10.3390/fluids7010005
APA StyleGuedri, K., Abdoon, A. A., Bagabar, O. S., Oreijah, M., Bouzid, A., & Munshi, S. M. (2022). Numerical Study of Large-Scale Fire in Makkah’s King Abdulaziz Road Tunnel. Fluids, 7(1), 5. https://doi.org/10.3390/fluids7010005