Article

Visualization and Sound Measurements of Vibration Plate in a Boiling Bubble Resonator

1
Department of Applied Electronics, Tokyo University of Science, 6-3-1 Niijuku, Katsushika-ku, Tokyo 125-8585, Japan
2
Department of Mechanical Engineering, Sanyo-Onoda City University, 1-1-1 Daigakudo-ri, Sanyo-Onoda 756-0884, Japan
*
Author to whom correspondence should be addressed.
Fluids 2021, 6(12), 443; https://doi.org/10.3390/fluids6120443
Submission received: 30 October 2021 / Revised: 27 November 2021 / Accepted: 7 December 2021 / Published: 9 December 2021
(This article belongs to the Special Issue Advances in Multiphase Flow Science and Technology)

Abstract

:
We developed a boiling bubble resonator (BBR) as a new heat transfer enhancement method aided by boiling bubbles. The BBR is a passive device that operates under its own bubble pressure and therefore does not require an electrical source. In the present study, high-speed visualization of the flow motion of the microbubbles spouted from a vibration plate and the plate motion in the BBR was carried out using high-speed LED lighting and high-speed cameras; the sounds in the boiling chamber were simultaneously captured using a hydrophone. The peak point in the spectrum of the motion of the vibration plate and the peak point in the spectrum of the boiling sound were found to be matched near a critical heat-flux state. Therefore, we found that it is important to match the BBR vibration frequency to the condensation cycle of the boiling bubble as its own design specification for the BBR.

Graphical Abstract

1. Introduction

We have previously proposed a new technique of using a boiling bubble resonator (BBR) [1,2,3] to enhance heat transfer in pool boiling without the conventional fabrication process associated with complex heat transfer surfaces [4,5,6]. In this technique, an interference plate, which can vibrate above a heat transfer surface because the plate is partially fixed or supported, is used as a BBR. Previous studies have revealed that the critical heat flux (CHF) is suppressed when an interference plate is positioned above a heat transfer surface [7,8,9]. By contrast, the BBR technique developed in our previous study [1] uses the energy of the growth and collapse of boiling bubbles to excite the interference plate and enhance boiling heat transfer. In this case, the continuous exciting force applied to the interference plate, which is caused by the expansion pressure of growing boiling bubbles and condensation due to a subcooled liquid, results in self-excited vibration. Consequently, the surface temperature of a heat transfer surface with the vibrating interference plate is lower than that of a surface without the interference plate. In addition, the CHF with the vibrating interference plate is higher than that with the interference plate without the self-excited vibration [1]. In our previous study [3], the maximum heat flux using the BBR technique reached 7.7 MW/m2 before the BBR conditions were optimized. This removable heat flux value suggests that the BBR technique might be suitable for use in the diverter cooling of a fusion reactor.
Despite the high cooling potential of the BBR technique, details of the CHF enhancement mechanism remain unclear. Therefore, for further optimization of the BBR design, a detection method that can confirm whether a BBR is in an effective vibration mode is needed. For vibration detection, an in situ contactless method is needed to prevent interference with the BBR. In the present study, the effect of the vibrating interference plate on boiling bubbles is experimentally investigated using high-speed visualization and the sound signal of the boiling. The boiling bubbles emitted from a gap between a heat transfer surface and a BBR are observed at sub-100 µm resolution in x–y–z dimensions with the progression of time. Two high-speed digital cameras (top and side cameras) are used to observe the fluid flow close to the BBR and its coupled state with the BBR. In addition, another camera (front camera) is used to observe the BBR vibration behavior. Sounds are generated from the nearby BBR and are recorded using a hydrophone. The three cameras and the hydrophone are synchronized with a timing generator. Consequently, the correlations between the sound signal, vibration behavior, and fluid flow close to the BBR are observed simultaneously. In the present study, these correlations are compared with the heat flux on a heat transfer surface.

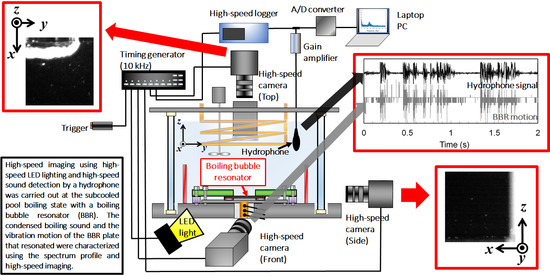
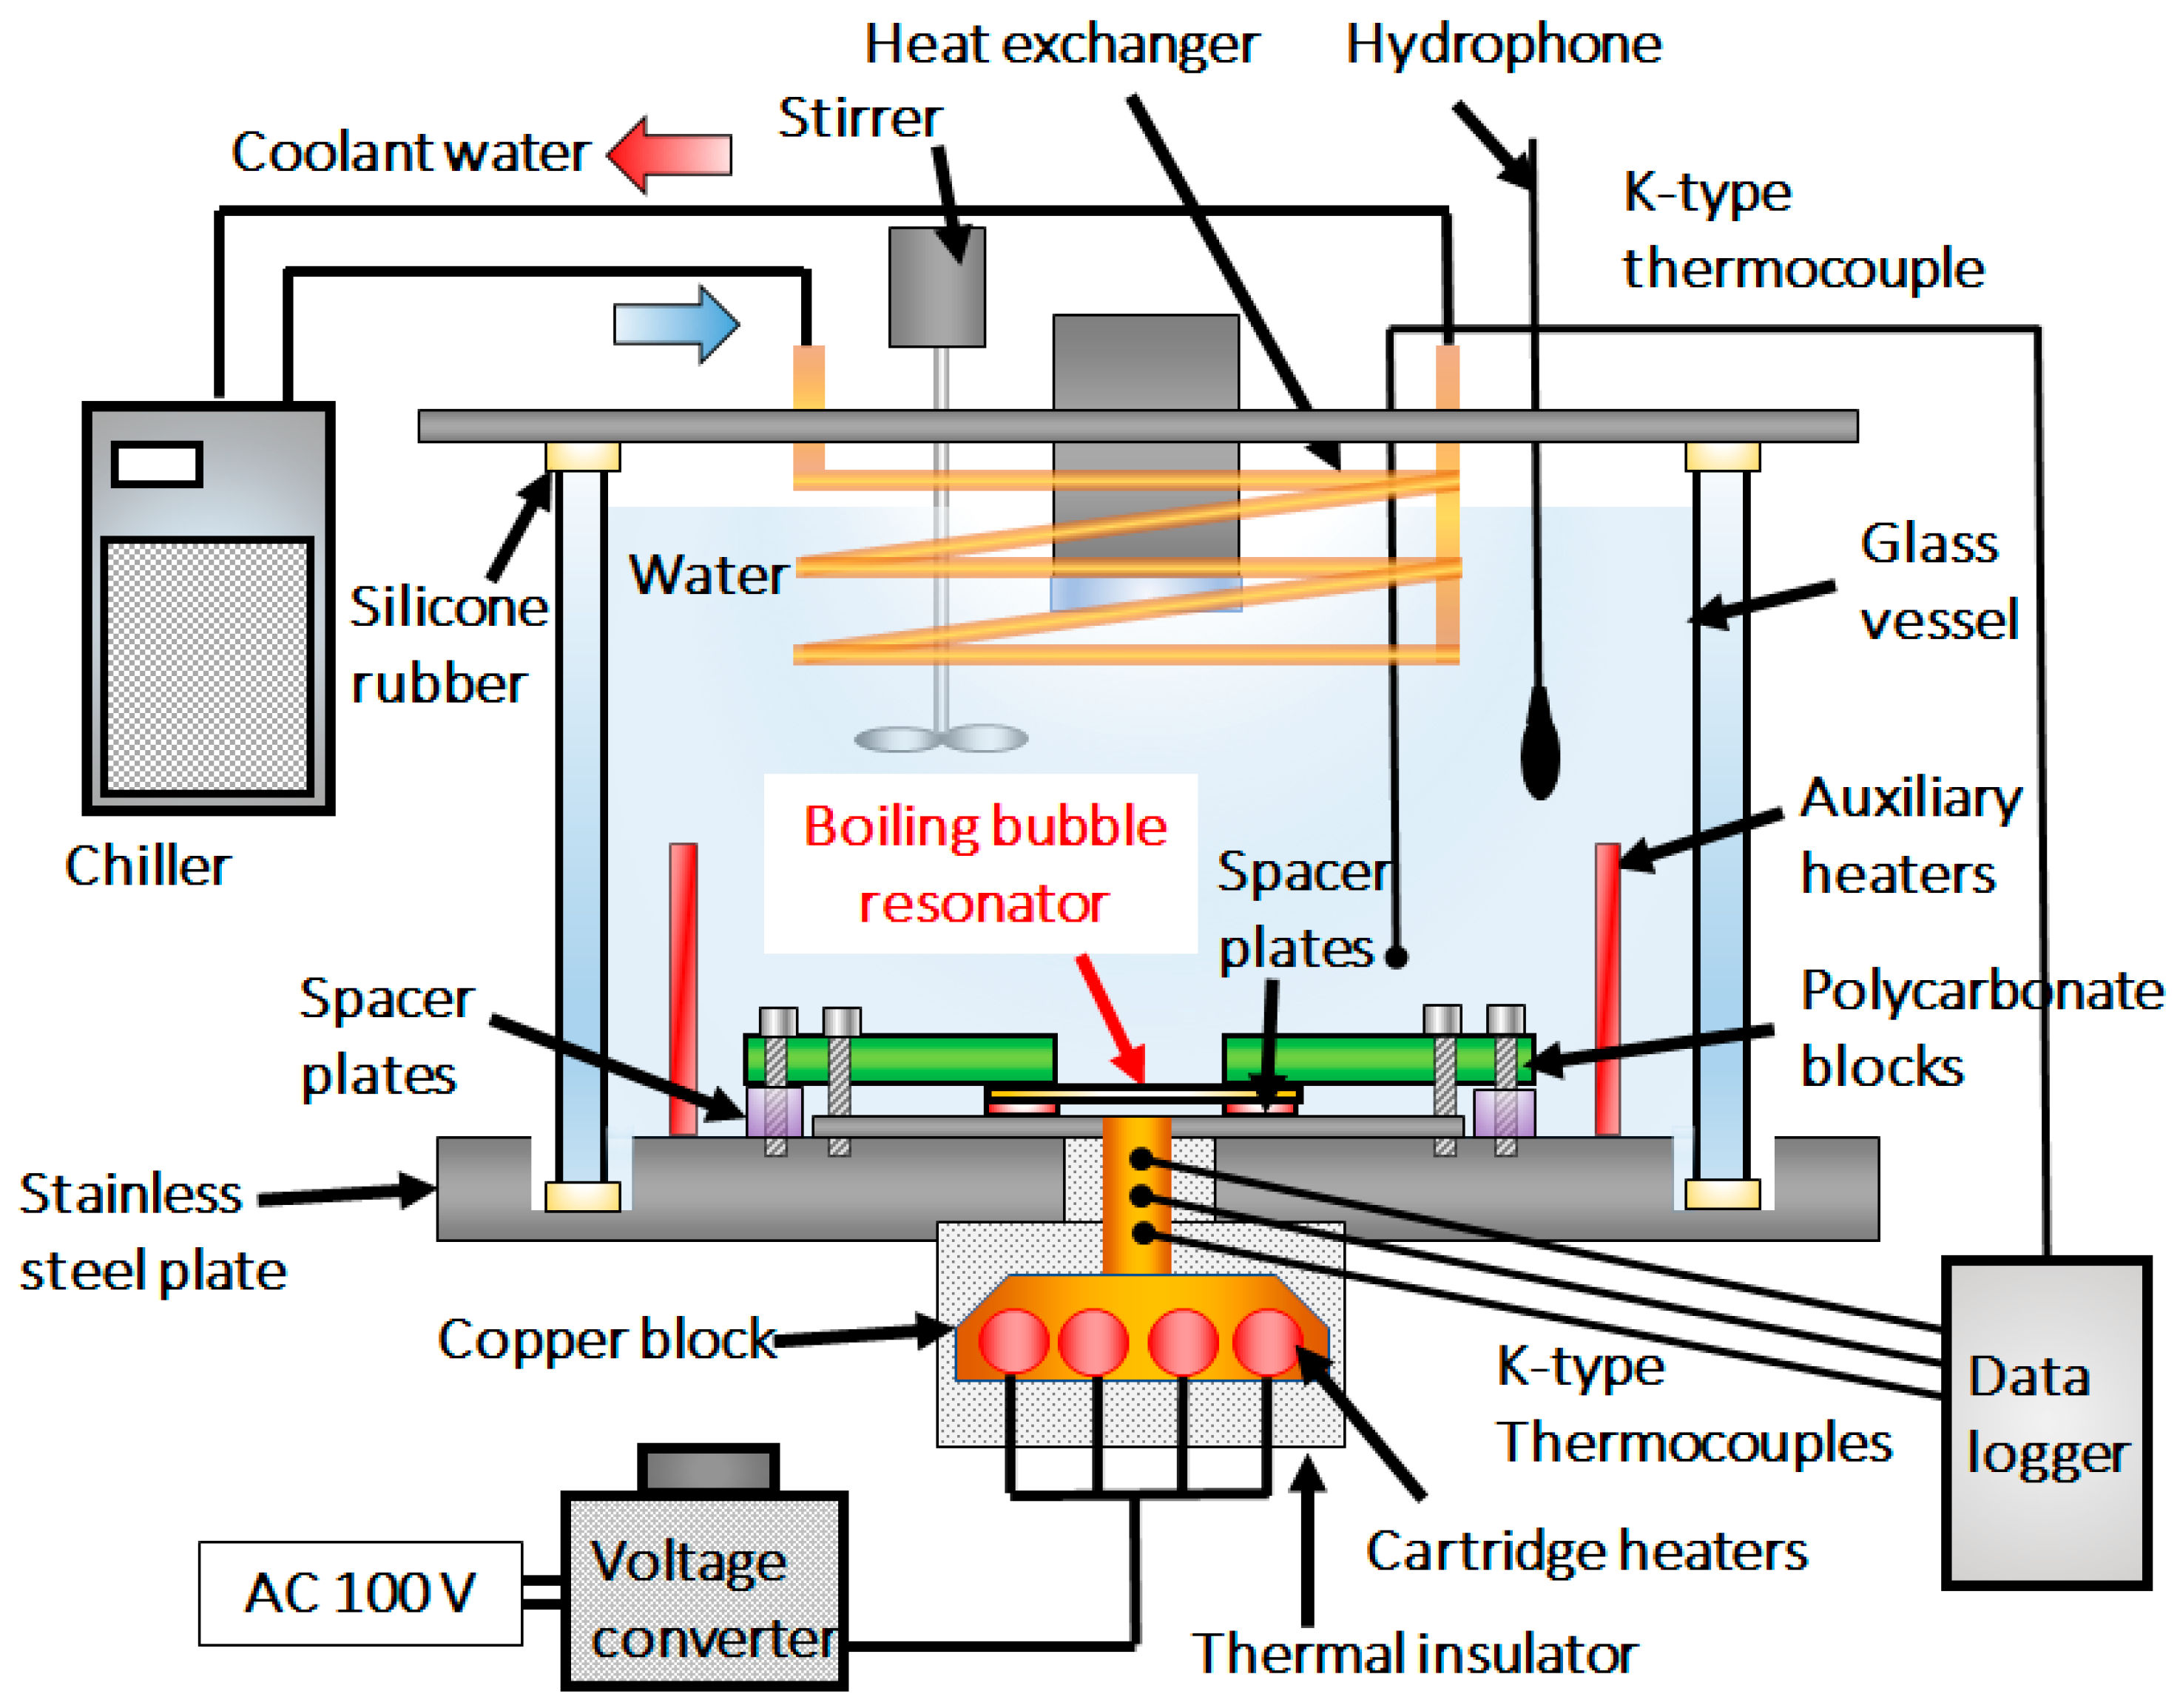
2. Experimental Setup and Measurement Methods

Figure 1 shows the experiment setup for subcooled pool boiling for investigating the BBR behavior. The side wall was made of a glass frame; it was 150 mm in width and length and 200 mm in height. Silicone rubber was placed between the glass frame and the top and bottom stainless-steel plates to prevent leakage of the working fluid. In this experiment, distilled water was used for subcooled pool boiling and the operating pressure was atmospheric pressure. The water level was 150 mm. Distilled water was previously boiled in the apparatus to degas it. The temperature of the water was maintained at 50 °C using a heat exchanger and auxiliary heaters; the degree of liquid subcooling was 50 K. An external chiller supplied cooling water to the heat exchanger, and the cooling water was circulated between the chiller and the heat exchanger. To keep the subcooling liquid distribution as uniform as possible, we used a stirrer (60 rpm) while taking care to not affect the boiling heat transfer. A high-speed camera was used to observe boiling bubbles emitted from the heat transfer surface. According to the bubble motion, the fluid flow caused by the stirrer was not dominant near the BBR or near the heat transfer surface in the present study. A heating block made of oxygen-free copper and cartridge heaters was installed at the bottom of the heating block. The upper part of the heating block was columnar. The power input to the cartridge heaters was varied using a voltage converter, which was connected to an AC 100 V source. To reduce heat leaks from the heating block to air, the heating block was covered with a thermal insulator. The diameter of the heat transfer surface was 9 mm. Thermocouple holes were located 3, 6, and 9 mm from the heat transfer surface, and three K-type thermocouples (Class 1, diameter 0.5 mm) were installed in them. The bottoms of the holes were aligned along the center axis of the columnar part. All the temperatures measured with thermocouples, including that of the water, were recorded every 0.5 s and averaged for 1 min. Similar to the method used in ref. [2], by assuming one-dimensional heat conduction (the Fourier’s law), we estimated the surface temperature from the temperature distribution data obtained by the three thermocouples. The heat flux on the heat transfer surface was also calculated from the product of the slope of the temperature distribution, as obtained by the least-squares method from the data recorded by the three thermocouples, and the thermal conductivity of the copper block. A hydrophone was submerged in the water pool to record the boiling sound.
In the present study, a 100 μm-thick, 30 mm-long, and 10 mm-wide thin brass plate was used as the BBR. The BBR plate was fixed with polycarbonate blocks to a vibration length of 17.5 mm. The vibration length of the BBR plate played an important role in ensuring that the BBR was vibrated at a frequency similar to the bubble growth and condensation frequency [1]. At the resonance frequency, the amplitude of the BBR is increased and promotes the process of coalescent boiling bubbles being pressed and blown out from a heat transfer surface. Consequently, the critical heat flux is increased compared with that in the case of no vibrating interference plate. The gap is also important for blowing out coalescent boiling bubbles because a narrow gap causes collisions between the BBR and a heat transfer surface. As a result, the BBR vibration is restricted and disturbs the CHF increasement [2]. Therefore, the gap height was adjusted using a 200 μm-thick spacer plate. These settings are the same conditions used in our previous work [2].
Figure 2 shows the visualization setup for observing boiling bubbles when the BBR was present. An LED light (IDT LED120E, Integrated Design Tools Inc., Pasadena, CA, USA) was used as a light source, giving a single pulse at a repetition rate of 10 kHz. Two high-speed cameras (IDT NR5S2 and IDT NX5S2, Integrated Design Tools Inc., California, USA) with a resolution of 2336 × 1728 (7 μm/pixel) and equipped with a 55 mm f2.8 lens (micro-Nikkor, NIKON, Tokyo, Japan) were used to obtain top and side images. The field of view (FOV) of the top and side cameras was 5.6 mm × 5.6 mm and 8.6 mm × 8.6 mm, respectively. A 112 × 112 area was extracted from the full 2336 × 1728 image area for image capture at 10 kHz. The top camera was used along with a tube inserted into the glass to exclude the reflection from the water surface. A third high-speed camera (Redlake Motion Pro ×3, Integrated Design Tools Inc., California, USA) with a lens (Tamron SP 35–210 mm, Tamron, Saitama, Japan) was used to acquire front images to capture the vibration of the BBR plate; the resolution of this camera was 1280 × 1024 (12 μm/pixel). A 700 × 100 area was extracted from the 1280 × 1024 full image area for image capture at 10 kHz. The FOV of the front camera was 31.8 mm × 4.5 mm. The amplitude of the BBR was detected using the images obtained by the front camera. We first binarized the obtained images. The z position of the BBR edge was then detected at a certain fixed y point. The FFT analysis was performed using the z position data. A hydrophone was used to capture the sound in the boiling chamber. The synchronization of the three cameras, the hydrophone, and the LED lighting exposures was controlled by a timing generator unit (LabSmith LC880, LabSmith, Livermore, CA, USA). The images and the sound were recorded over a 2 s period to obtain the spouted boiling bubble from the BBR plate and the motion of the BBR plate. Separately from the synchronized sound measurement, a fast Fourier transform measurement was also performed using the signal from an A/D converter that collected the signal branched in the signal of the hydrophone.

3. Results & Discussion

3.1. Boiling Curves

Figure 3 shows the boiling curves recorded with and without the BBR installed. The degree of liquid subcooling was 50 K. The dotted line is the Ivey–Morris correlation [10], which is predicting the CHF at subcooled pool boiling, and the continuous line is the Kutateladze correlation [11], which is typically used in the nucleate boiling regime. When the BBR was not installed (i.e., during normal boiling heat transfer), the CHF was 3.6 MW/m2. Thereafter, microbubble emission boiling occurred, which is well known behavior at subcooled pool boiling [12]. The boiling curve corresponding to the setup with the BBR was totally different from that corresponding to the setup without the BBR. First, the wall superheat with the BBR was lower (<0.9 MW/m2) than that without the BBR. This result is attributable to a superheated liquid layer that can easily develop between such a narrow gap. This phenomenon was also observed in experiments using interference plates with no vibration. However, the wall superheat in the experiment with the BBR increased when the heat flux was increased from 0.8 to 1.5 MW/m2. In our previous study, if the interference plate was not vibrated (specifically, if the blow out motion was not observed), CHF was observed at heat fluxes between 0.8 to 1.5 MW/m2 [1]. When the BBR started to vibrate, CHF was not observed and the heat flux increased to 4.8 MW/m2. In the present study, the experiment was stopped at this heat flux because of the limitation of the heater temperature. Notably, an inflection point was observed at approximately 2.5 MW/m2; a similar inflection point has been observed in our previous BBR studies [1,2,3]. To elucidate the mechanism of this unique boiling curve, we investigated the boiling sound and the BBR and boiling bubble behaviors, as described in Section 3.2.

3.2. Acoustic and Motion Spectra of the Vibration Plate

Figure 4 shows the spectra acquired using the synchronized signal with a high-speed camera and a hydrophone. Both spectral profiles were averaged for a 2 s period. The boiling sounds at low frequencies show a maximum under lower heat-flux conditions. The peak shifted to higher frequencies with increasing heat flux. The peak value was ~760 Hz, similar to the peak value reported in a previous study [13]. However, the peak spectral value corresponding to the vibration of the BBR plate was ~560 Hz under low-heat-flux conditions. This peak also shifted to higher frequencies with increasing heat flux. The peak finally reached ~760 Hz. Therefore, the enhanced spectral point for the boiling sound and the vibration of the BBR plate resonated at 4.8 MW/m2. The expected design value based on the theoretical value (i.e., the natural frequency determined by elastic analysis using the plate properties and dimensions) is 1170 Hz. We consider that the amplitude of the BBR will be maximized when the vibration frequency is matched to its natural frequency, resulting in the maximum heat transfer performance. However, even if the vibration frequency of the BBR is similar to the natural frequency, the amplitude will be enhanced. As a result, coalescing bubbles on the heat transfer surface will be pressed against and pushed away from the BBR repeatedly, improving the critical heat flux.

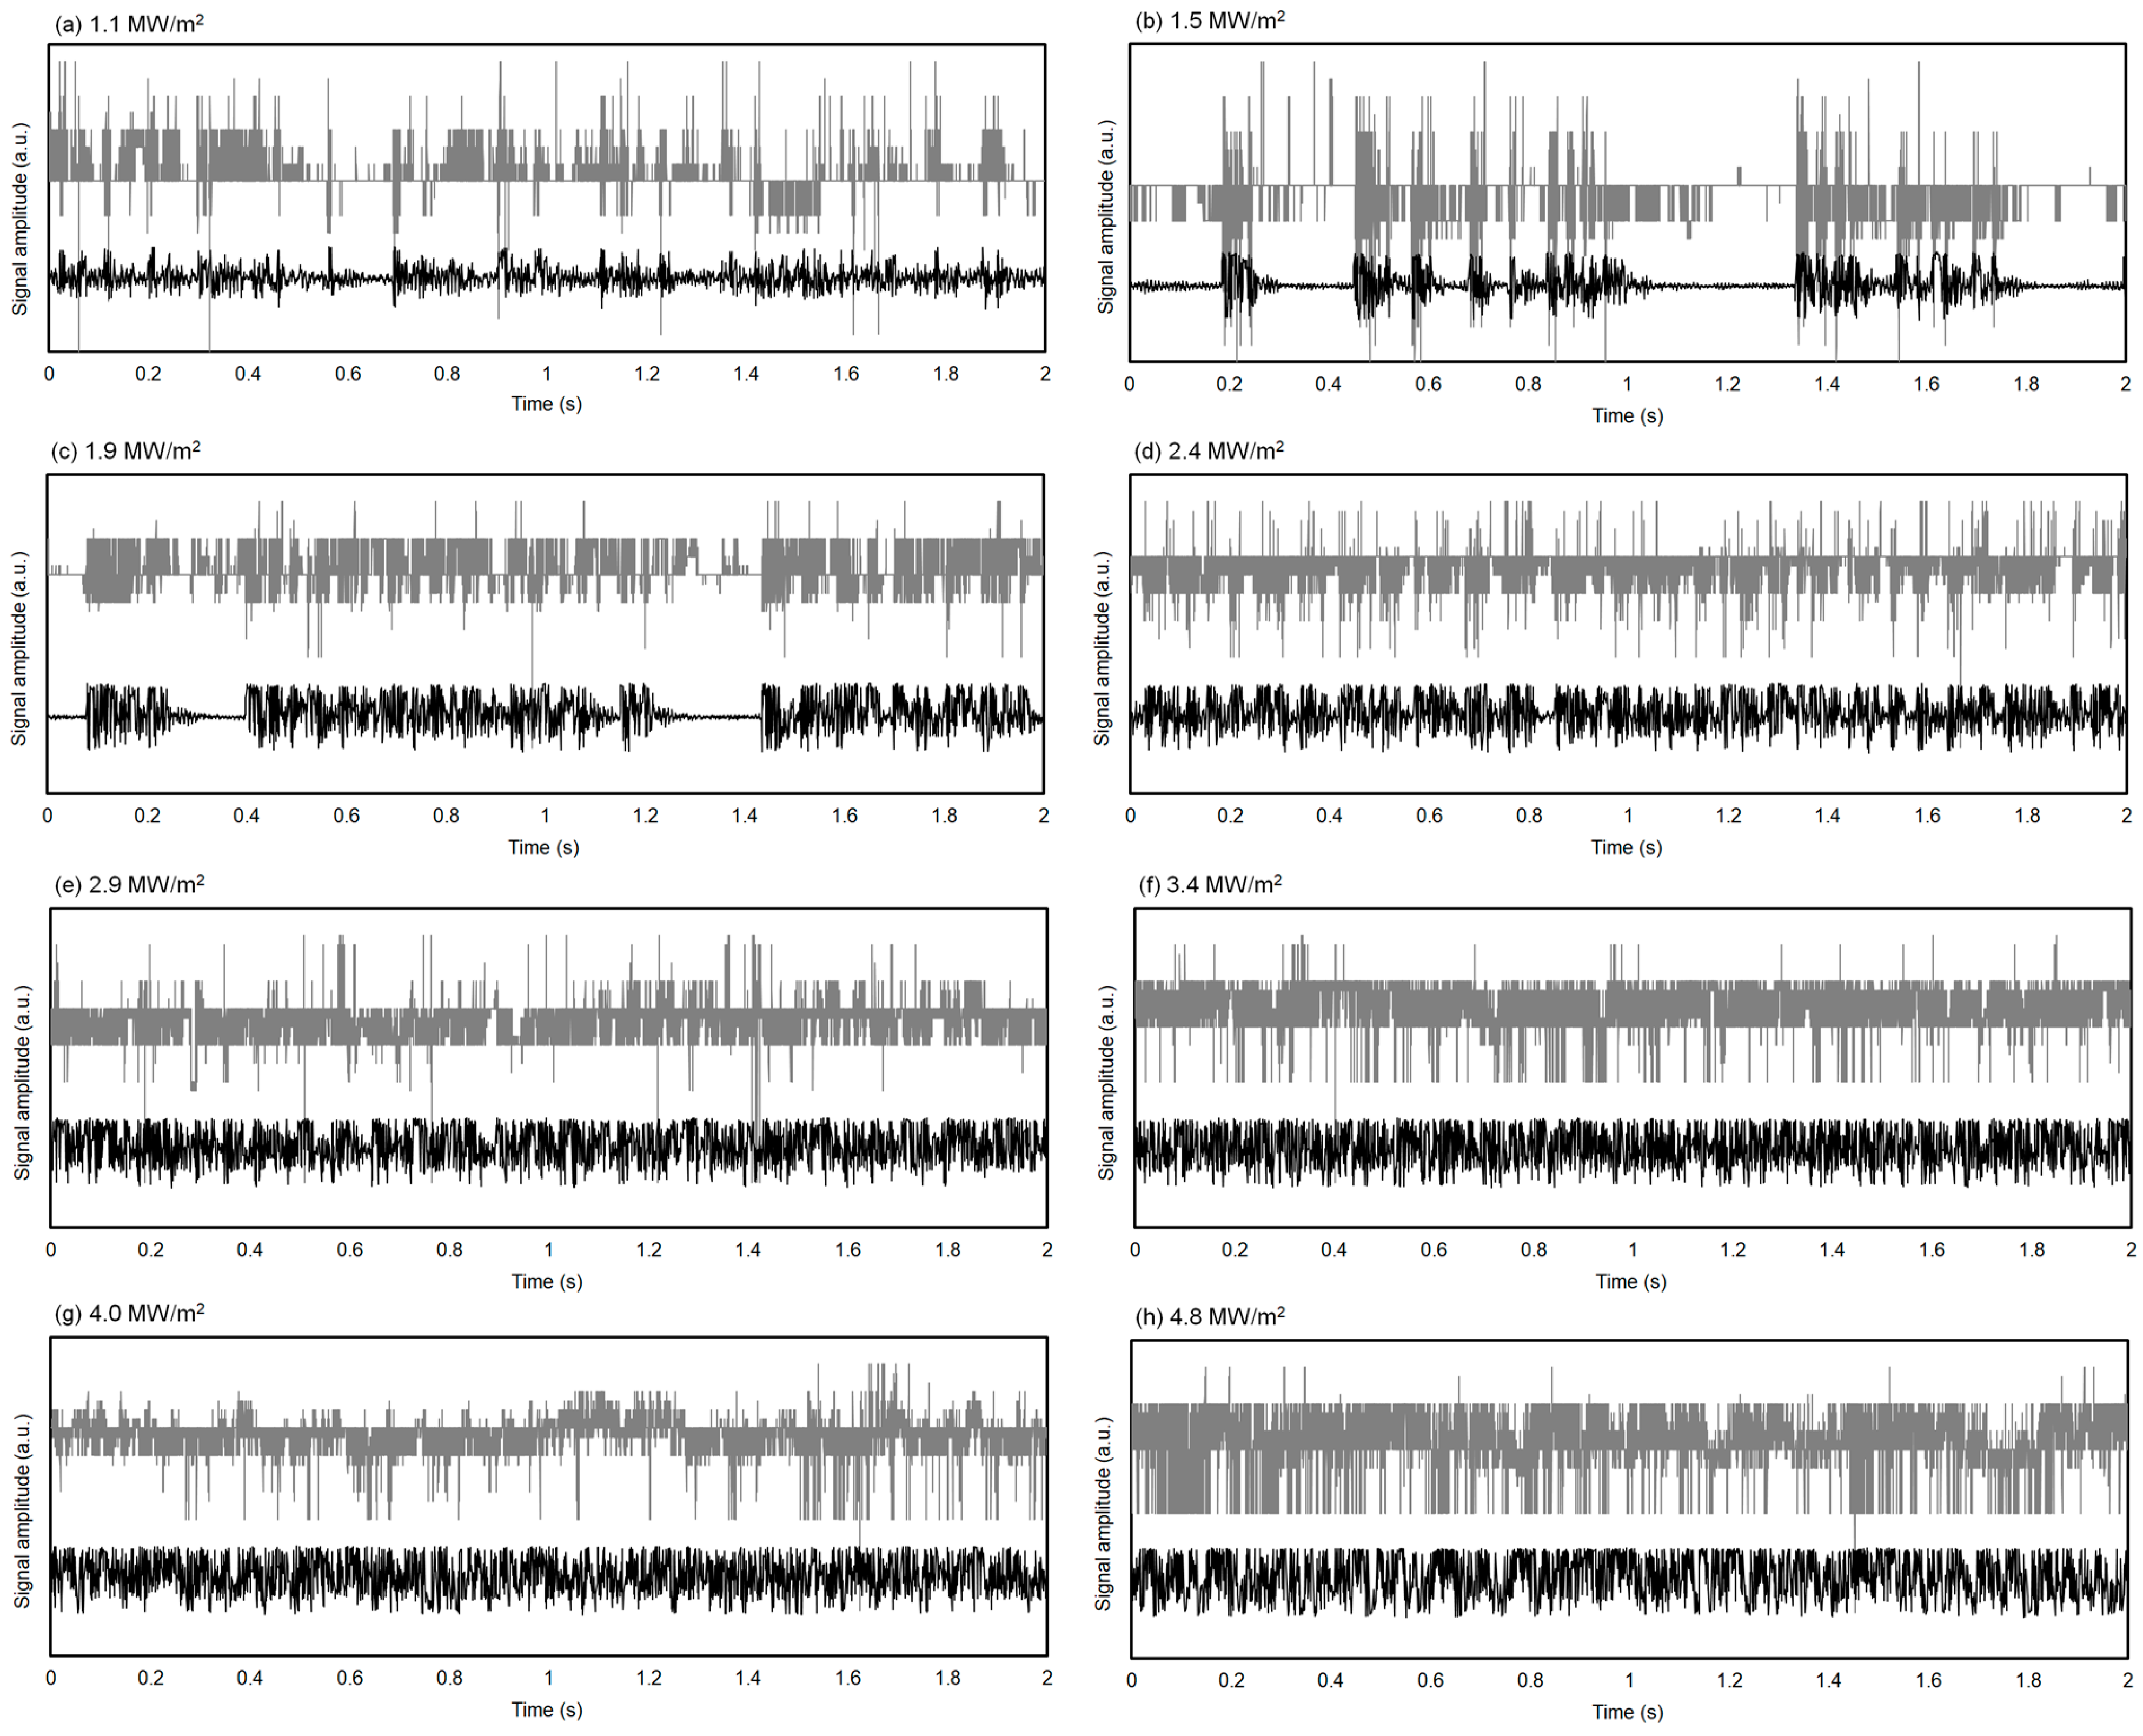
3.3. Instantaneous Acoustics and Motion of the Vibration Plate

Figure 5 shows the acquired sound signals (black lines) and a comparison with the motion of the BBR vibration (grey lines) at various heat fluxes. At a heat flux of 1.1 MW/m2, the BBR appeared to be vibrated randomly; little correlation was observed between the sound and the BBR vibration. At 1.5 MW/m2, a strong correlation was observed between the sound and the BBR vibration: the amplitude of the sound signals increased when the BBR was strongly vibrated. The timing of the sound signal was also synchronized with the BBR vibration. At heat fluxes less than 1.9 MW/m2, the quiescent time of the sound signal appeared [2]. By contrast, the quiescent time was not observed at heat fluxes greater than 2.4 MW/m2. Notably, this heat flux is the same as the inflection point observed in the boiling curve recorded with the BBR present. Consequently, the experimental results show that the boiling heat transfer using a BBR is clearly enhanced by continuous vibration of the BBR and that this resonance can be detected through analysis of the boiling sound.

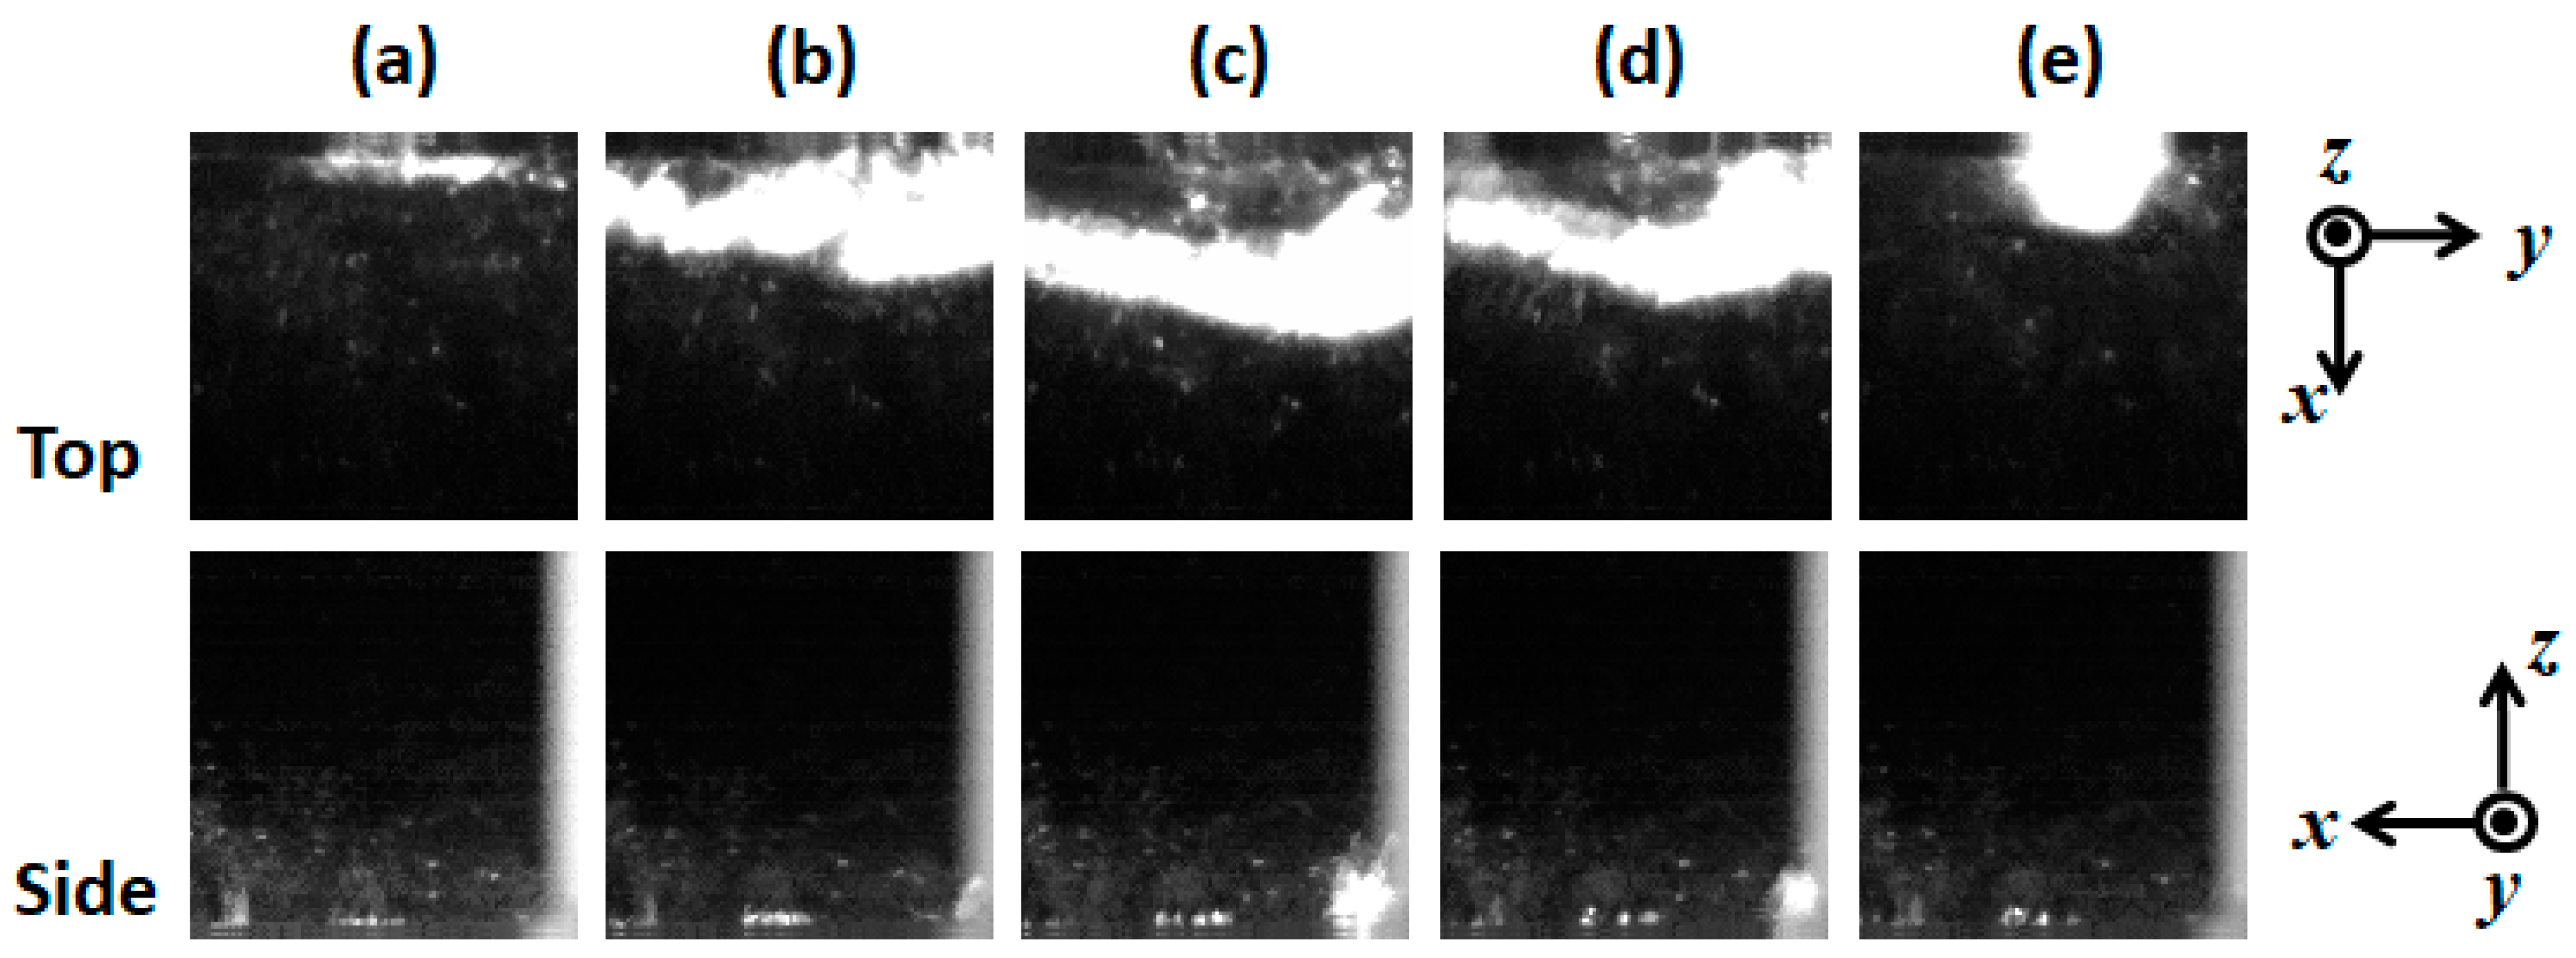
3.4. Instantaneous Visualization of Microbubble Motion around the Vibration Plate

Figure 6, Figure 7, Figure 8, Figure 9, Figure 10 and Figure 11 show high-speed visualized images from two different viewpoints at various heat fluxes. The field of view of the top camera was 5.6 × 5.6 mm2, whereas that of the side camera was 8.6 × 8.6 mm2. The white area is boiling bubbles recorded by high-speed imaging under LED lighting. In the top camera image in each figure, the flow direction is from top to bottom and the edge of the BBR plate is located at the top area. In the side camera image in each figure, the flow direction is from right to left and the edge of the BBR plate is located at the right end line. At low heat flux, the spouted bubble has an intermittency period and the spout period is longer. However, at high heat flux, the spout period is shorter; these figures show the boiling bubble behavior in a single period. The periods of the growth and condensation were 1.4, 1.0, 1.1, 1.0, 1.3, and 1.3 ms at 1.1, 1.5, 1.9, 2.4, 4.0, and 4.4 MW/m2, respectively. Consequently, the boiling bubble cycle was 770 Hz (1/1.3 ms) at 4.0 and 4.4 MW/m2, which corresponded to the sound signal. This value is approximately the same as that obtained from the averaged spectrum in Figure 4h. Therefore, resonance was also observed by high-speed imaging of the actual spouted boiling bubble motion.

4. Conclusions

High-speed imaging using high-speed LED lighting and high-speed sound detection by a hydrophone was carried out at the subcooled pool boiling state with a BBR. The condensed boiling sound and the vibration motion of the BBR plate that resonated were characterized using the spectrum profile and high-speed imaging. The resonance value was 760 Hz, which is consistent with the condensed boiling value and coincides with the value reported in a previous study. When designing the BBR’s specifications, the maximum performance related to critical heat flux can be controlled by manipulating the natural frequency value via the properties and length of the vibration material.

Author Contributions

Conceptualization, S.-i.S.; methodology, S.-i.S.; software, J.O.; validation, N.U. and K.Y.; formal analysis, N.U.; investigation, N.U.; resources, J.T.; data curation, J.O.; writing—original draft preparation, S.-i.S.; writing—review and editing, N.U.; visualization, J.O.; supervision, S.-i.S.; project administration, S.-i.S.; funding acquisition, S.-i.S. All authors have read and agreed to the published version of the manuscript.

Funding

This research received no external funding.

Institutional Review Board Statement

Not applicable.

Informed Consent Statement

Not applicable.

Conflicts of Interest

The authors declare no conflict of interest.

References

  1. Unno, N.; Yuki, K.; Taniguchi, J.; Satake, S. Boiling heat transfer enhancement by self-excited vibration. Int. J. Heat Mass Transf. 2020, 153, 119588. [Google Scholar] [CrossRef]
  2. Unno, N.; Yuki, K.; Taniguchi, J.; Satake, S. Effect of the gap height between the vibration plate and heating surface on boiling heat transfer in a boiling bubble resonator. J. Therm. Sci. Technol. 2021, 16, JTST0017. [Google Scholar] [CrossRef]
  3. Unno, N.; Yuki, K.; Taniguchi, J.; Satake, S. Heat Transport Augmentation Using Vibration Material Excited by Boiling Bubbles for Heat Removal from Divertor. Fusion Sci. Technol. 2021, 77, 716–720. [Google Scholar] [CrossRef]
  4. Liang, G.; Mudawar, I. Review of pool boiling enhancement by surface modification. Int. J. Heat Mass Transf. 2019, 128, 892–933. [Google Scholar] [CrossRef]
  5. Singh, S.K.; Sharma, D. Review of pool and flow boiling heat transfer enhancement through surface modification. Int. J. Heat Mass Transf. 2021, 181, 122020. [Google Scholar] [CrossRef]
  6. Khan, S.A.; Atieh, M.A.; Koç, M. Micro-nano scale surface coating for nucleate boiling heat transfer: A critical review. Energies 2018, 11, 3189. [Google Scholar] [CrossRef] [Green Version]
  7. Bonjour, J.; Lallemand, M. Effects of Confinement and Pressure on Critical Heat Flux During Natural Convective Boiling in Vertical Channels. Int. Commun. Heat Mass Transf. 1997, 24, 191–200. [Google Scholar] [CrossRef]
  8. Cheng, L. Fundamental issues of critical heat flux phenomena during flow boiling in microscale-channels and nucleate pool boiling in confined spaces. Heat Transf. Eng. 2013, 34, 1016–1043. [Google Scholar] [CrossRef]
  9. Kawakami, K.; Sakamoto, S.; Tanigawa, H.; Tsuruta, T. A study on transition process to MEB by limiting boiling space. J. Therm. Sci. Technol. 2021, 16, JTST0004. [Google Scholar] [CrossRef]
  10. Kutateladze, S.S. Heat Transfer in Condensation and Boiling; Translation Series; AEC-tr-3770; U.S. Atomic Energy Commission: Washington, DC, USA, 1952.
  11. Ivey, H.J.; Morris, D.J. Critical heat flux of saturation and subcooled pool boiling in water at atmospheric pressure. In Proceedings of the International Heat Transfer Conference 3, Chicago, IL, USA, 7–12 August 1966; pp. 129–142. [Google Scholar]
  12. Unno, N.; Yuki, K.; Kibushi, R.; Suzuki, K. Advanced boiling cooling technology using a compact vessel with a low water level. Trans. Jpn. Inst. Electron. Packag. 2018, 11, E18-010-1–E18-010-6. [Google Scholar] [CrossRef] [Green Version]
  13. Tang, J.; Xie, G.; Bao, J.; Mo, Z.; Liu, H.; Du, M. Experimental study of sound emission in subcooled pool boiling on a small heating surface. Chem. Eng. Sci. 2018, 188, 179–191. [Google Scholar] [CrossRef]
Figure 1. Experimental apparatus for subcooled pool boiling with a boiling bubble resonator (BBR) at atmospheric pressure.
Fluids 06 00443 g001
Figure 2. Visualization setup using the synchronized signal with high-speed cameras and a hydrophone.
Fluids 06 00443 g002
Figure 3. Atmospheric-pressure boiling curves with and without the BBR. The degree of liquid subcooling was 50 K.
Fluids 06 00443 g003
Figure 4. Spectra acquired using a synchronized signal with a high-speed camera and a hydrophone. The black line in each pair is the hydrophone spectrum, and the grey line is the spectrum of the motion of the vibration plate. The spectra were acquired at heat fluxes of (a) 1.1 MW/m2, (b) 1.5 MW/m2, (c) 1.9 MW/m2, (d) 2.4 MW/m2, (e) 2.9 MW/m2, (f) 3.4 MW/m2, (g) 4.0 MW/m2, and (h) 4.8 MW/m2.
Fluids 06 00443 g004
Figure 5. Signals obtained using the synchronized signal with the front high-speed camera (grey lines) and the hydrophone (black lines). The signals were acquired at heat fluxes of (a) 1.1 MW/m2, (b) 1.5 MW/m2, (c) 1.9 MW/m2, (d) 2.4 MW/m2, (e) 2.9 MW/m2, (f) 3.4 MW/m2, (g) 4.0 MW/m2, and (h) 4.8 MW/m2.
Fluids 06 00443 g005
Figure 6. Instantaneous visualization using the synchronized signal with two high-speed cameras at a heat flux of 1.1 MW/m2: (a) 689.8 ms, (b) 690.3 ms, (c) 690.7 ms, (d) 690.9 ms, and (e) 691.2 ms.
Fluids 06 00443 g006
Figure 7. Instantaneous visualization using the synchronized signal with two high-speed cameras at a heat flux of 1.5 MW/m2: (a) 186.3 ms, (b) 186.6 ms, (c) 186.9 ms, (d) 187.1 ms, and (e) 187.3 ms.
Fluids 06 00443 g007
Figure 8. Instantaneous visualization using the synchronized signal with two high-speed cameras at a heat flux of 1.9 MW/m2: (a) 77.8 ms, (b) 78.1 ms, (c) 78.4 ms, (d) 78.7 ms, and (e) 78.9 ms.
Fluids 06 00443 g008
Figure 9. Instantaneous visualization using the synchronized signal with two high-speed cameras at a heat flux of 2.4 MW/m2: (a) 852.5 ms, (b) 852.8 ms, (c) 853.1 ms, (d) 853.3 ms, and (e) 853.5 ms.
Fluids 06 00443 g009
Figure 10. Instantaneous visualization using the synchronized signal with two high-speed cameras at a heat flux of 4.0 MW/m2: (a) 1006.2 ms, (b) 1006.6 ms, (c) 1006.9 ms, (d) 1007.2 ms, and (e) 1007.5 ms.
Fluids 06 00443 g010
Figure 11. Instantaneous visualization using the synchronized signal with two high-speed cameras at a heat flux of 4.4 MW/m2: (a) 804.4 ms, (b) 804.7 ms, (c) 805.2 ms, (d) 805.5 ms, and (e) 805.7 ms.
Fluids 06 00443 g011
Publisher’s Note: MDPI stays neutral with regard to jurisdictional claims in published maps and institutional affiliations.

