Article

A Momentum-Conserving Scheme for Flow Simulation in 1D Channel with Obstacle and Contraction

by
Putu Veri Swastika
,
Sri Redjeki Pudjaprasetya
*,
Leo Hari Wiryanto
and
Revi Nurfathhiyah Hadiarti
Industrial and Financial Mathematics Research Group, Faculty of Mathematics and Natural Sciences, Institut Teknologi Bandung, Jalan Ganesha 10, Bandung 40132, Indonesia
*
Author to whom correspondence should be addressed.
Fluids 2021, 6(1), 26; https://doi.org/10.3390/fluids6010026
Submission received: 26 November 2020 / Revised: 17 December 2020 / Accepted: 23 December 2020 / Published: 6 January 2021
(This article belongs to the Special Issue Mathematical and Numerical Modeling of Water Waves)

Abstract

:
We consider the extension of the momentum conservative staggered-grid (MCS) scheme for flow simulation in channels with varying depth and width. The scheme is formulated using the conservative properties of the Saint-Venant equations. The proposed scheme was successful in handling various steady flows and achieved results that are in complete accordance with the analytical steady solutions. Different choices of boundary conditions have created steady solutions according to the mass and energy conservations. This assessment has served as a validation of the proposed numerical scheme. Further, in a channel with a contraction and a nonuniform bed, we simulate two cases of dam break. The simulation results show a good agreement with existing experimental data. Moreover, our scheme, that uses a quasi-1-dimensional approach, has shown some fair agreement with existing 2-dimensional numerical results. This evaluation demonstrates the merits of the MCS scheme for various flow simulations in channels of varying width and bathymetry, suitable for river flow modeling.

1. Introduction

The Saint-Venant equations are governing equations commonly used to model river flow and open channel flow. They are deduced from mass conservation and momentum balance for an incompressible fluid flow under the assumptions of hydrostatic pressure. The numerical approach commonly used to find approximate solutions to the SWE equation is the finite volume method. This approach approximates the solution by representing the differential equations in the form of algebraic equations, while maintaining the conservative properties of the original equation. The finite volume method is a fairly well-established method for hyperbolic equations. A reasonably complete explanation of this approach can be found in textbooks, see, e.g., in [1,2]. Various software packages, such as Swash, Comcot, HEC-RAS, etc., have adopted a specific version this finite volume method. This kind of software certainly has a large range of applications related to free surface flows, and river flow modeling is one of them. For flood simulations along river basins, numerical calculations using 2- or 3-dimensional approaches require extensive computation [3]. However, if the river under consideration is not too complex, a one-dimensional approach is considered a good compromise [4]. Apart from simulating the flow dynamics along the river, steady flow simulation is also important. The steady solution of the Saint-Venant equation is itself important. Basically, this steady solution provides an overview of the hydrograph shape as the flow travels through a river channel; this technique is commonly known as the flood routing procedure [5,6].
Natural channels are usually non-prismatic, that is, their cross section is nonuniform. Discussions on modeling flow in channels of varying widths and depths can be found in, for example, [7,8,9]. Most of them use the Saint-Venant equations as the governing equation and apply a numerical approach to studying the flow. Such an approach is considered feasible for modeling streamflow under real conditions, as suggested in [10]. Studies on channel flow with a triangular, trapezoidal cross section were carried out, for instance, in [11,12]. Until recently [13], there are only a limited number of steady-state-preserving schemes for the Saint-Venant equations in channels that take into account varying channel with gradients. It is generally not easy to design a scheme that respects all steady states.
Our goal here is to propose an accurate code, suitable for a wide range of flow regimes, including subcritical, supercritical, transcritical flow, as well as transcritical flow with a shock. The numerical model proposed here is the extension of the momentum conservative staggered-grid (MCS) scheme [14], which holds for flow simulation in channels with varying width and depth. The MCS-scheme is a version of the finite volume method for the shallow water equations that uses a staggered partition domain. The formulation of this scheme is based on a discrete version of conservation of mass and momentum balance, from which it gains its name as the momentum conserving staggered-grid scheme, abbreviated as the MCS-scheme, see in [14] for detail. See also in [15] for the 2-dimensional version of the MCS-scheme. By evaluating the surface and velocity variables on adjacent staggered grid points, and applying the upwind approximation to calculate the appropriate flux, the scheme does not require any Riemann solver for calculating flux, so the numerical calculation is cheap. Moreover, this scheme can accurately handle numerical solutions with hydraulic jumps [14].
In this article, we discuss one extension of the MCS-scheme for flow simulation in channels with changing depth and width. The conservative formulation, i.e., mass and momentum, is maintained here. A discrete version of mass conservation can be easily formulated for channel with an arbitrary but regular cross section. Further, an approximation of the advection term, which uses the momentum balance formulation, is important to be adopted here. The resulting MCS scheme is then validated by a selection of steady and transient hydraulic problems with reference solutions. We simulate the evolution of transient solutions to a steady state. By implementing the proper boundary conditions, we can obtain steady solutions, exactly as predicted from the conservation mass and energy head formula. Those includes subcritical and supercritical steady flow, as well as smooth and discontinuous transcritical solutions. Various numerical experiments are presented to demonstrate that the proposed numerical model is capable to exactly preserve both moving-water and still-water steady states.
The organization of this paper is as follows. We recall the mathematical model and the analytical steady profiles in Section 2. The extension of the MCS scheme, including its validation with the analytical steady solution is presented in Section 3. Two numerical simulations were carried out in Section 4 for validation with known experimental data.

2. Mathematical Model—The Saint-Venant Equations

Consider a fluid layer bounded above by the free surface and below by a topography, flowing through a channel with an arbitrary cross section as sketched in Figure 1. The motion of free surface is governed by the Saint-Venant equations read as
A t + Q x = 0 ,
Q t + x Q 2 A + g A h ^ x = g A d d ^ d x .
In the above equations, A ( x , t ) is the wet cross-sectional area of the channel, Q ( x , t ) is momentum, and d ^ ( x ) the channel bathymetry, see Figure 1. Here, Q ( x , t ) = A ( x , t ) u ^ ( x , t ) , with u ^ ( x , t ) is the horizontal velocity. When we restrict our discussion for the case of rectangular channels, the cross section area A ( x , t ) = h ^ b ^ , with h ^ ( x , t ) denotes the fluid height, and b ^ ( x ) the channel width. Furthermore, the Saint-Venant equations can be expressed as follows,
A t + Q x = 0 ,
u ^ t + u ^ u ^ x + g ( h ^ + d ^ ) x = 0 .
In deriving (4) from (1), (2) we have used the following relation,
u ^ u ^ x = 1 A ( Q u ^ ) x u ^ Q x .
In Section 3, the staggered conservative approximation will be applied to Equations (3) and (4), and considered as the extension of the MCS-scheme [14]. The resulting scheme turns out to be good, and suitable for simulating flow for any Froude number, both subcritical as well as supercritical.

2.1. Flow over a Bump

In this section, we will discuss about types of steady solution of the fluid layer in a channel with a bump. For the sake of clearness, here we will provide a short review on open channel flow theory, which discusses about steady solution for flow with every Froude number. This steady solution can be obtained from the conservation of mass and energy.
Suppose that the fluid is flowing along the channel with a constant depth and encounters a smooth bump, see Figure 1. We assume the bump is slowly varying, and so the flow is approximately unidirectional. Let H be the water depth, and U the horizontal velocity far upstream, anywhere else the water depth and horizontal velocity are denoted as h ^ ( x ) and u ^ ( x ) . Conservation of mass:
u ^ ( x ) h ^ ( x ) = U H ,
and Bernoulli’s equation:
1 2 g u ^ ( x ) 2 + ( h ^ ( x ) + d ^ ( x ) ) = 1 2 g U 2 + H .
Note that the two relations above should be fulfilled by the steady solutions h ^ ( x ) and u ^ ( x ) of (3) and (4), as both functions do not depend on time t. Eliminating u ^ ( x ) from (6) and (7) will give us
h ^ 3 E ^ h ^ 2 + U 2 H 2 2 g = 0 , E ^ = E ^ 1 d ^ , E ^ 1 = U 2 2 g + H ,
Let us introduce the following non-dimensional variables and the Froude parameter number F as follows,
d = d ^ H , h = h ^ H , F = U g H ,
Then, the relation (8) can be written in terms of the non-dimensional variables d, h and the Froude number F, as follows,
h + 1 2 F 2 1 h 2 = E ,
with the normalized energy
E = E ^ H = 1 2 F 2 + 1 d .
Unless stated otherwise, further discussion will use normalized variables, i.e., without hat. As the steady solution satisfies mass conservation (6) and Bernoulli (7), it satisfies (10). If the upstream flow condition U and H (including the Froude number F) are known, Equation (10) gives a relation between the height of the bump d and the fluid height h. Basically, by performing the numerical root finding algorithm towards (10), the steady surface can be obtained. This steady surface will be considered as the analytical steady surface, for later use, in order to distinguish it with the numerical steady surface. In addition, different type of steady solution will appear depending on the choice of downstream boundary condition and the flow type, as we shall discuss in the following.
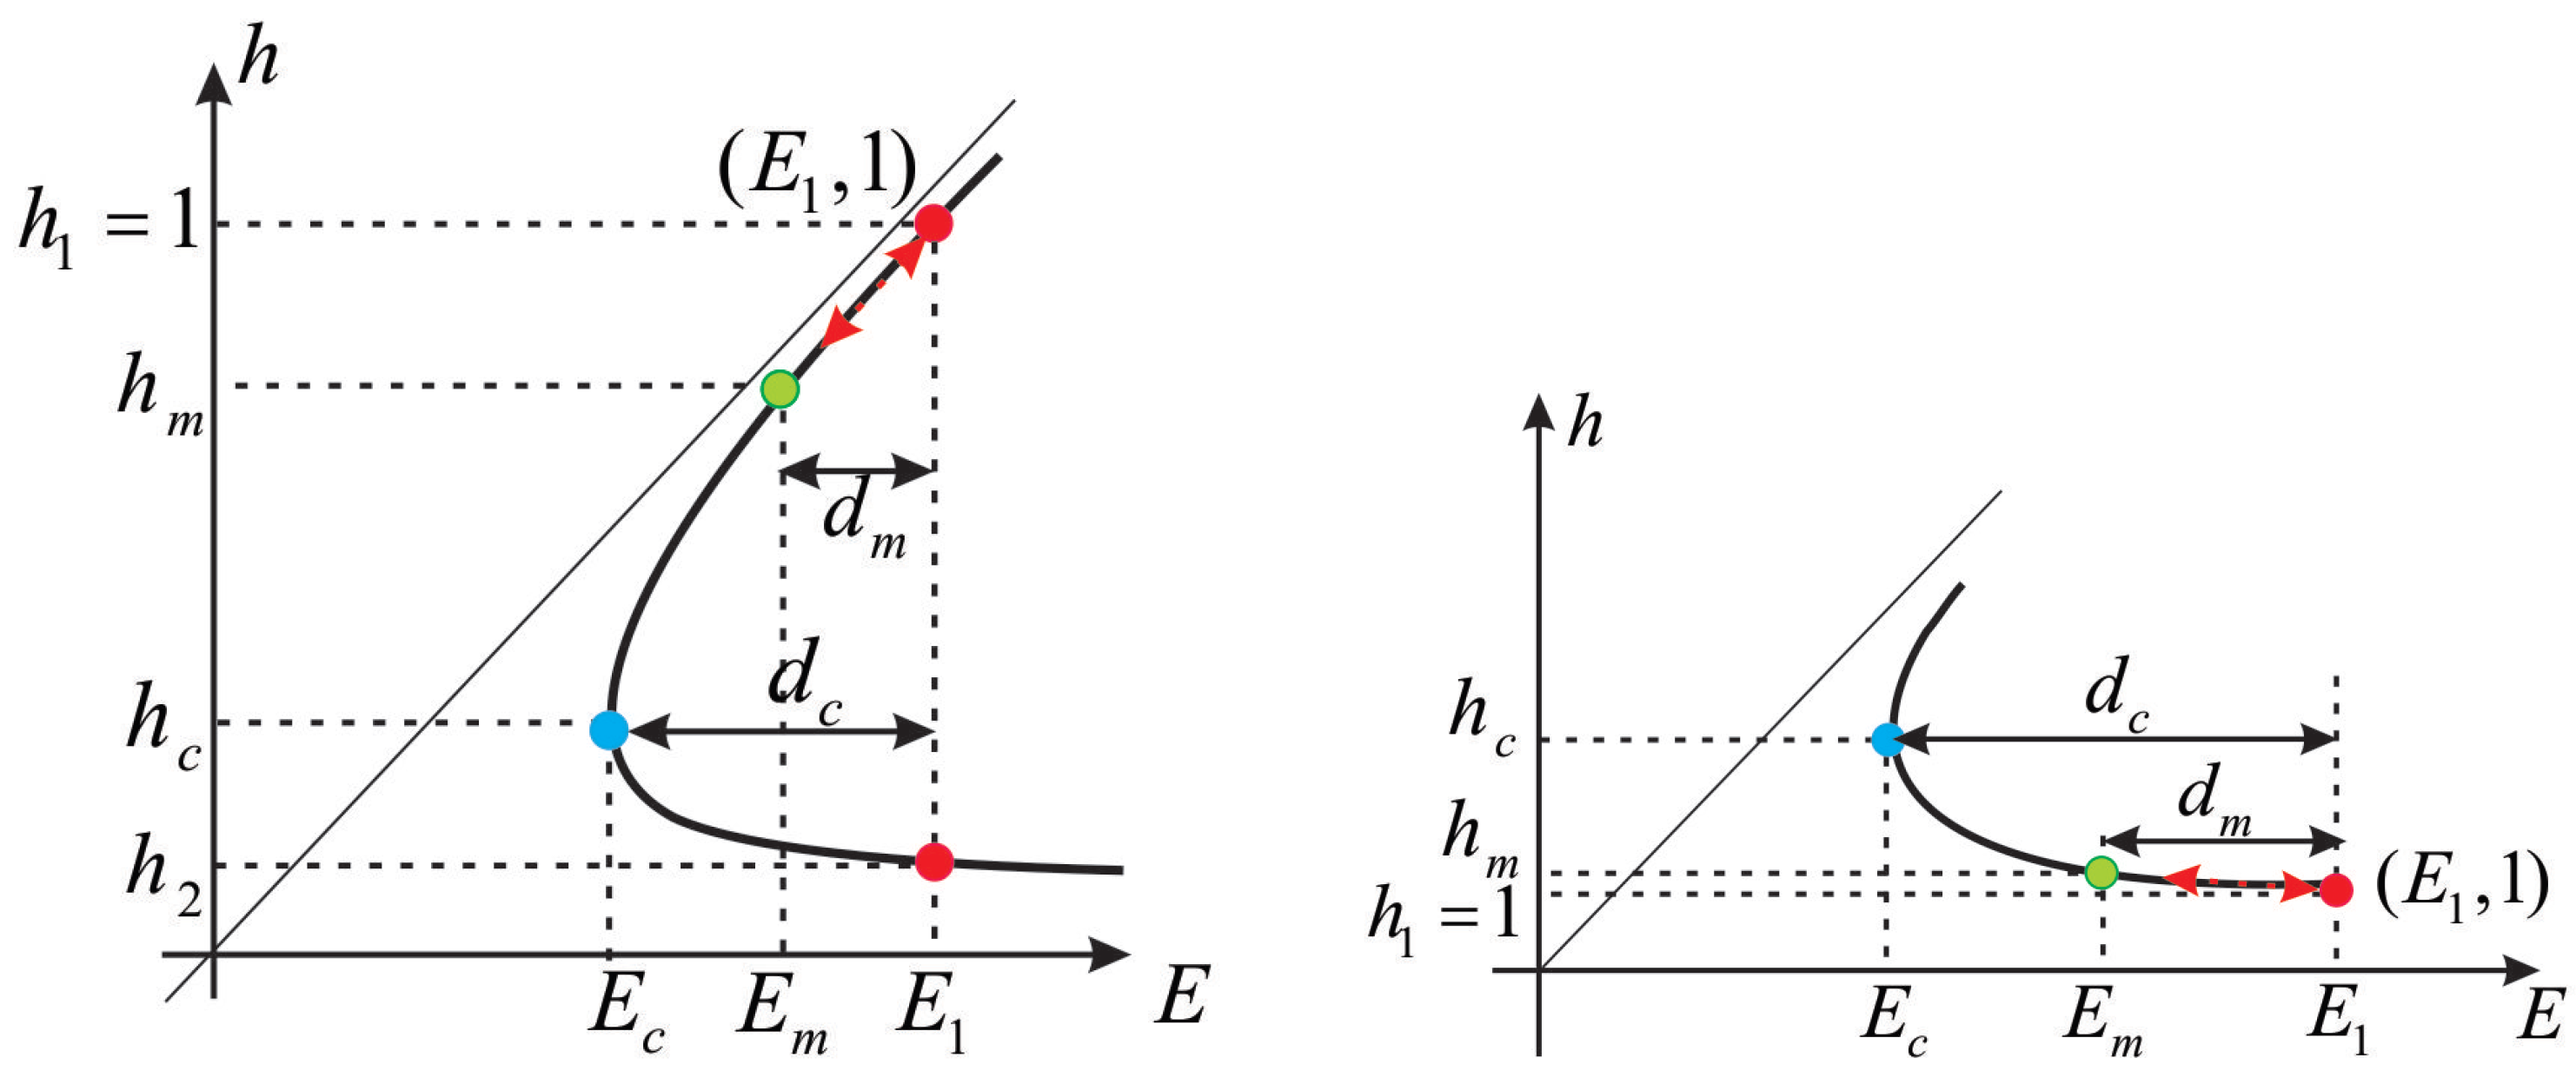
Consider a subcritical flow from left to right over a bump d ( x ) that tends to zeros near the left and right boundaries. On the upstream part, water height is set to be h = 1 . In Figure 2, we plot the curve E ( h ) , with our interest is on the first quadrant, with positive horizontal and vertical axes. The upstream condition is represented by a point ( E 1 , h 1 = 1 ) , which happen when the bathymetry is zero. First, we focus on the subcritical case, see Figure 2 (left). As indicated by the red arrow, as d ( x ) increases from 0 to d m , the energy decreases from E 1 to E m . At the maximum height of the bump d m , the energy and fluid height is represented by the point ( E m , h m ) . After reaching the maximum value, the bump d ( x ) decreases back to zero, which means the energy goes back to E 1 . Therefore, in this subcritical case, the steady fluid height follows the upper leg of the energy curve; starting from E 1 goes to E m and then goes back to E 1 , see Figure 2 (left). From this analysis, it is clear that in the case of subcritical flow, water level decreases at the bump.
Furthermore, for a given upstream flow condition F, we can determine a critical flow condition, i.e., the maximum height of the bump d c that corresponds to the minimum energy E c . The critical point ( E c , h c ) can be obtained by equating the first derivative d E d h to zero to yield the critical fluid height and the critical bump as follows,
h c = F 2 / 3 , and d c = 1 2 F 2 + 1 3 2 F 2 / 3 ,
In this critical situation, the minimum energy is E c = 3 2 F 2 / 3 = 3 2 h c . Therefore, if we have a bump with height reaches this maximum value d m = d c , we can get a transcritical steady solution. On the energy curve in Figure 2 (left), this transcritical steady solution is illustrated by the curve segment, that starts from the point ( E 1 , 1 ) , moves to the left following the subcritical leg, passes the critical point ( E c , h c ) , where the Froude number F = 1 , and then turns around following the supercritical leg up to the point ( E 1 , h 2 ) . Note that this downstream water height h 2 is indeed the second positive root of Equation (10) with energy E = E 1 , whereas the first positive root is h 1 = 1 .
On the other hand, if the upstream flow is supercritical, with F > 1 , the upstream condition ( E 1 , h 1 = 1 ) is located on the lower leg of the energy curve, see Figure 2 (right). In this case, the steady solution is described by the curve segment which is located on the lower leg of the energy curve. As the bump d ( x ) increases from 0 to the maximum height d m , the energy decreases from E 1 to E m , and this situation corresponds to a steady solution h ( x ) which increases from 1 to the maximum fluid height h m . Then, on the downstream part of the bump, the fluid height decreases back to its previous height h ( x ) = 1 , see Figure 2 (right). In Section 3, all three cases discussed above, i.e., subcritical, supercritical, and transcritical steady flow, will be simulated using the momentum conserving staggered grid (MCS) scheme.

2.2. Flow through a Contraction

In this subsection, we discuss the steady water level in a channel with a slowly varying width. We focus on different steady flow as response to a contraction on the channel width. Here, we consider a channel with constant bathymetry, and varying width b ^ ( x ) with the max width B, as depicted in Figure 1 (right). The steady solution will be dictated by the same Bernoulli Equation (7), but with a modified mass conservation (13):
b ^ ( x ) u ^ ( x ) h ^ ( x ) = B U H .
Eliminating u ^ ( x ) from the two equations; mass conservation (13) and Bernoulli’s Equation (7), and writing them in terms of the normalized width b ( x ) = b ^ ( x ) B , and the normalized fluid depth h ( x ) = h ^ ( x ) H to yield
1 b 2 1 = k ( h ) , k ( h ) = h 2 F 2 F 2 + 2 ( 1 h ) 1 .
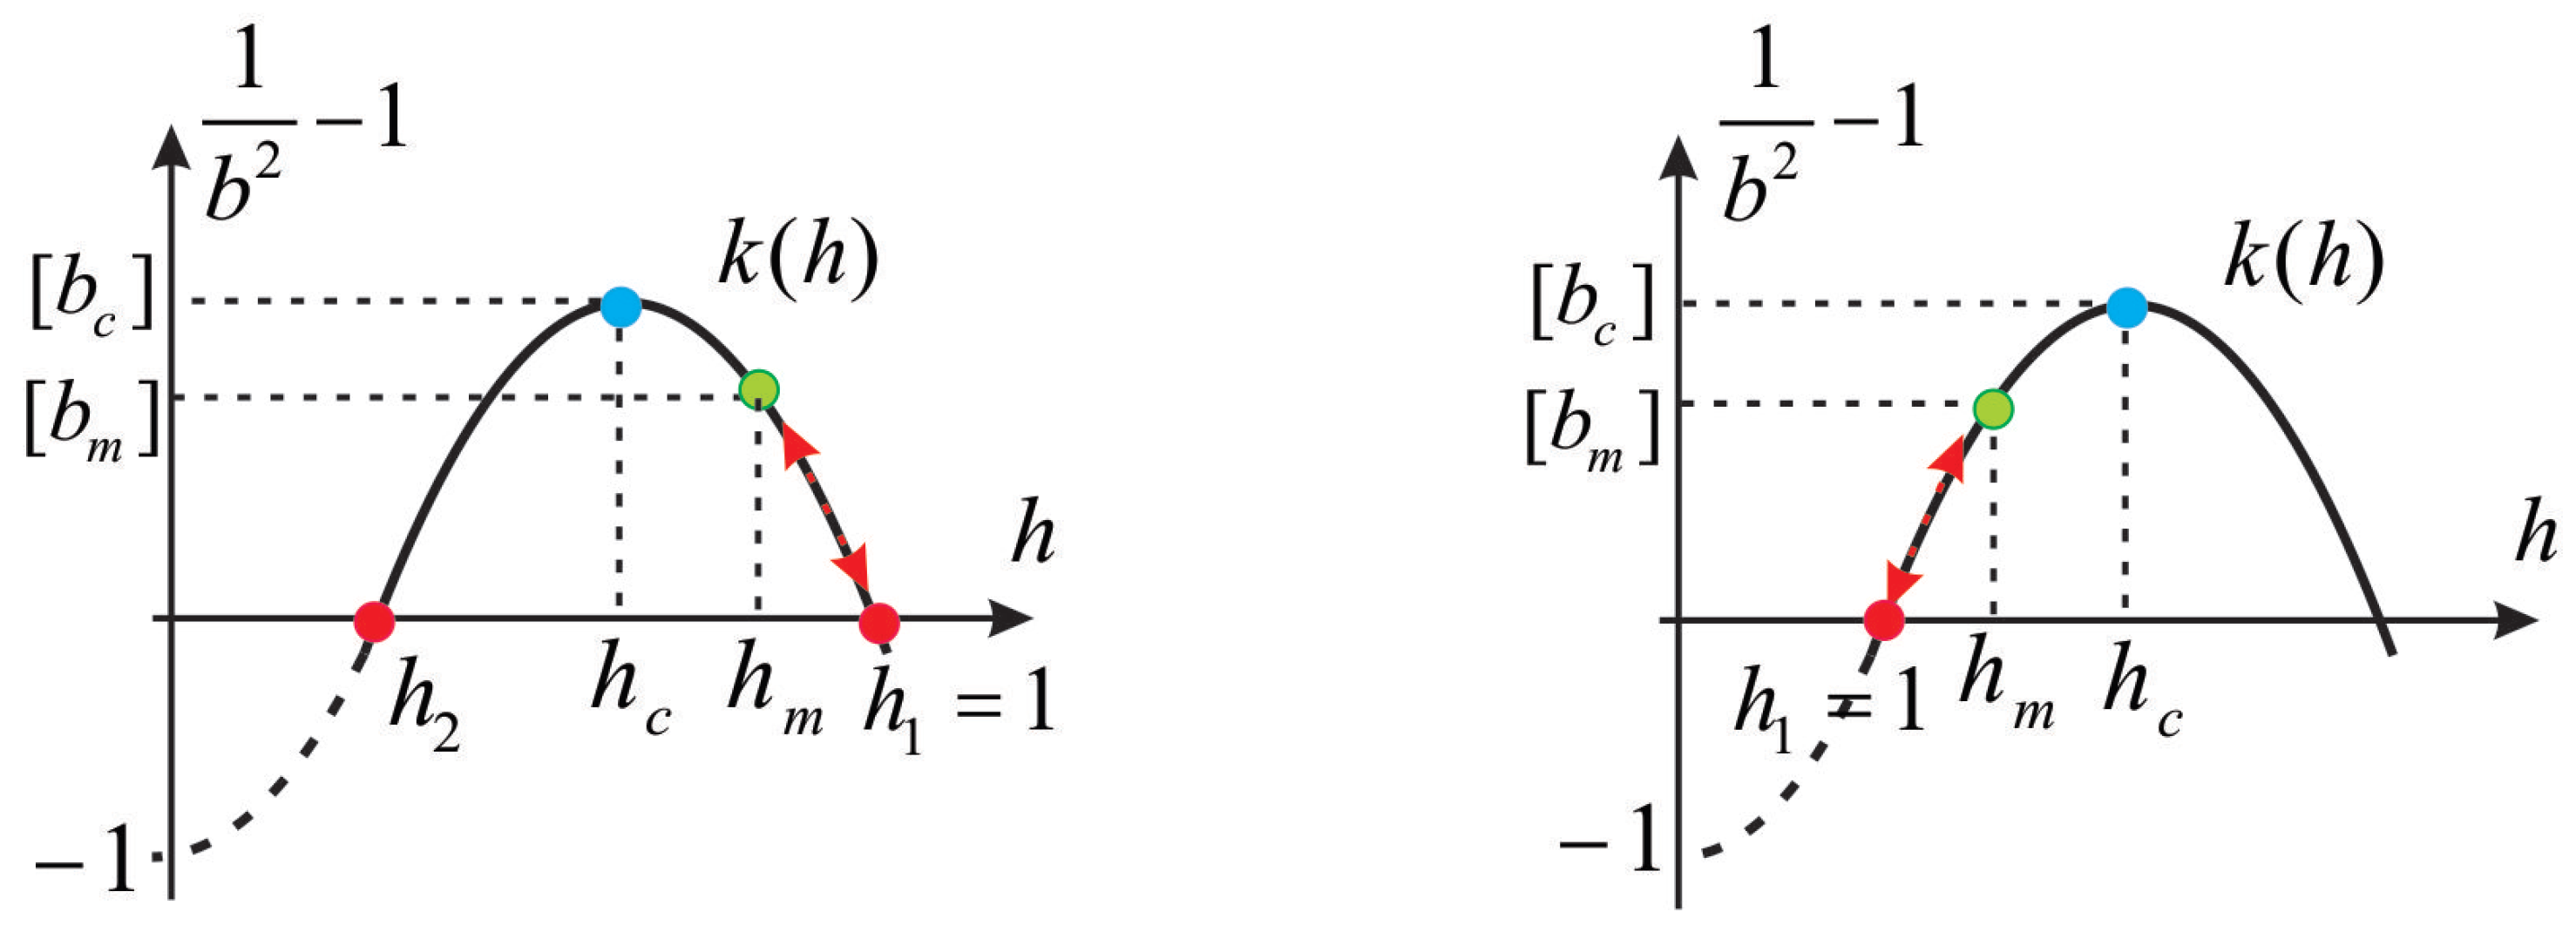
The relation (14) will determine the steady water level that will appear in a channel with width b ( x ) . Similar to the steady surface as a response to bathymetry as discussed in Section 2.1, the steady surface as a response to channel constriction can be obtained from (14), by performing numerical root finding algorithm. Furthermore, this steady surface will be considered as the analytical steady surface, in order to distinguish it with the numerical steady surface. Our discussion here will use normalized water height h ( x ) and normalized width b ( x ) . Moreover, we define the following notation [ b ] 1 / b 2 1 to simplify its expression in formulas. In Figure 3, a typical smooth curve of a normalized width b, with b m b ( x ) 1 , and the corresponding curve of [ b ] are plotted. Then, the curve k ( h ) is plotted on the h [ b ] plane, as shown in Figure 4. The curve intersects the horizontal axis at two positive zeros h 1 and h 2 , one of them equals to 1. The curve has only one feasible critical point ( h c , k ( h c ) ) , which is attained at h c = 1 3 ( F 2 + 2 ) , with the corresponding critical width
[ b c ] = k ( h c ) , or b c = ( k ( h c ) + 1 ) 0.5 .
Part of the curve k ( h ) , with h > h c corresponds to the subcritical leg, whereas part of the curve with h < h c is the supercritical leg. Various steady solutions may appear depending on different type of flows, which will be discussed below. The mechanism is analogous to those from the section of steady flow due to bump.
Consider a subcritical flow from left to right passing over a flat channel with a varying width b ( x ) , that tends to unity near the left and right boundaries. On the upstream part, water height is set to be h = 1 , and the channel width is b ( x ) = 1 (or [ b ( x ) ] = 0 ). On the curve k ( h ) , this upstream flow is represented as a point ( h 1 = 1 , 0 ) , see Figure 4 (Left). As the channel width decreases from the normal width b = 1 to b m , the flow accelerates. On the k ( h ) curve the steady flow follows along the subcritical leg of the curve, which means h decreases. When the channel width increases back to the original width, the steady water height increases. If the downstream water height is set to h = 1 , the steady water flow returns back to the original height. Therefore, in this subcritical case, the channel contraction causes a negative steady hump at the surface. However, if the downstream water height is set to be h 2 , which is the second positive water height that corresponds to the normal width [ b ] = 0 , see Figure 4 (Left), and if we set the b m = b c the steady flow appears in the form of a smooth transcritical flow. On the curve k ( b ) , this smooth transcritical steady flow is represented as a segment curve that starts from ( h 1 = 1 , [ b ] = 0 ) , goes up to the maximum point ( h c , [ b c ] ) , turns around, and further goes down to ( h 2 , [ b ] = 0 ) . Similarly, if the upstream flow is supercritical with water height h = 1 , the steady flow can be traced from the curve k ( h ) starting from the left part of the curve. In the next section, numerical simulations of various type of flows will be conducted. Those simulations are to be validated by the analytical steady water level as described by the relation (14).

3. Numerical Model and Flow Simulations

The numerical scheme for solving the Saint-Venant Equations (3) and (4) will be discussed here. This is a second-order staggered grid scheme that maintains the conservative property of the equations, namely, the mass and momentum balance. The scheme is a direct generalization of the momentum conserving scheme as originally proposed by [16]. Consider the Saint-Venant equations on the computational domain x [ a , b ] , and time t [ 0 , T ] , with a , b , T R . Both spatial and time domain are uniformly discretized with a spatial step size Δ x / 2 and a time step Δ t , respectively. The staggered partition along the spatial domain produce partition points: x 1 / 2 = a , x 1 , , x j 1 / 2 , x j , x j + 1 / 2 , , x N x + 1 / 2 = b , with N x = b a Δ x . In this staggered setting, the variable u is approximated at half grid points u | x j + 1 / 2 = u j + 1 / 2 , whereas the surface area A is approximated at full grid points A | x j = A j . Next, the water level can be computed from h j = A j / b j .
Further, the mass conservation (3) is approximated at cell [ x j 1 / 2 , x j + 1 / 2 ] , whereas the momentum Equation (4) is approximated at cell [ x j , x j + 1 ] . The approximate equations now read as
d A j n d t + Q j + 1 / 2 n Q j 1 / 2 n Δ x = 0 ,
d u j + 1 / 2 n d t + ( u u x ) j + 1 / 2 n + g h j + 1 n + 1 h j n + 1 Δ x + g d j + 1 d j Δ x = 0 .
In the above formula, the following variables are computed consistently,
A | j = h | j b | j , Q | j + 1 / 2 = * h j + 1 / 2 u j + 1 / 2 b j ,
where * h j + 1 / 2 is calculated using the upwind approximation,
* h j + 1 / 2 = h j , for u j + 1 / 2 0 , h j + 1 , for u j + 1 / 2 < 0 .
Adopting the relation (5), the consistent approximation for the advection term reads
u u x | j + 1 / 2 = 1 A ¯ j + 1 / 2 Q ¯ j + 1 * u j + 1 Q ¯ j * u j Δ x u j + 1 / 2 Q ¯ j + 1 Q ¯ j Δ x ,
whereas
A ¯ j + 1 / 2 = A j + A j + 1 2 , Q ¯ j = Q j 1 / 2 + Q j + 1 / 2 2 ,
and the first-order upwind approximation for horizontal velocity is
* u j = u j 1 / 2 , for Q ¯ j 0 , u j + 1 / 2 , for Q ¯ j < 0 .
The resulting scheme (16)–(22) is semi-discrete. It is second-order accurate for the linear terms, but it is first-order accurate for the nonlinear terms. For time integration, the second-order θ scheme, with 0 < θ < 1 is taken. Using this scheme, the steady water levels that appear as a response to various different situations will be simulated. This will also serve as a validation of the proposed scheme.
For simulations which involve dry areas, see the discussion in Section 4; a simple wet–dry procedure should be adopted. In order to avoid instability, the momentum calculation (17) is deactivated in the dry area. Here, a location will be considered as dry if the water level is less than a prescribed threshold value h t h r e s , or equivalently if the area A ¯ j in (20) is less then A t h r e s h t h r e s b j . All computations conducted in the following subsections will use normalized variables.

3.1. Simulation of Flow over a Bump

Consider a horizontal, frictionless rectangular channel of a constant width b ( x ) = 1 . Assuming that the upstream flow carrying a discharge Q at depth h = 1 , which corresponds to the upstream velocity u = Q , and the upstream Froude number F = u / g h = u / g . In this simulation, we use a channel base in the form of
d ( x ) = max { 0 , d m ( 1 0.25 x 2 ) } ,
which is a bump of height d m .
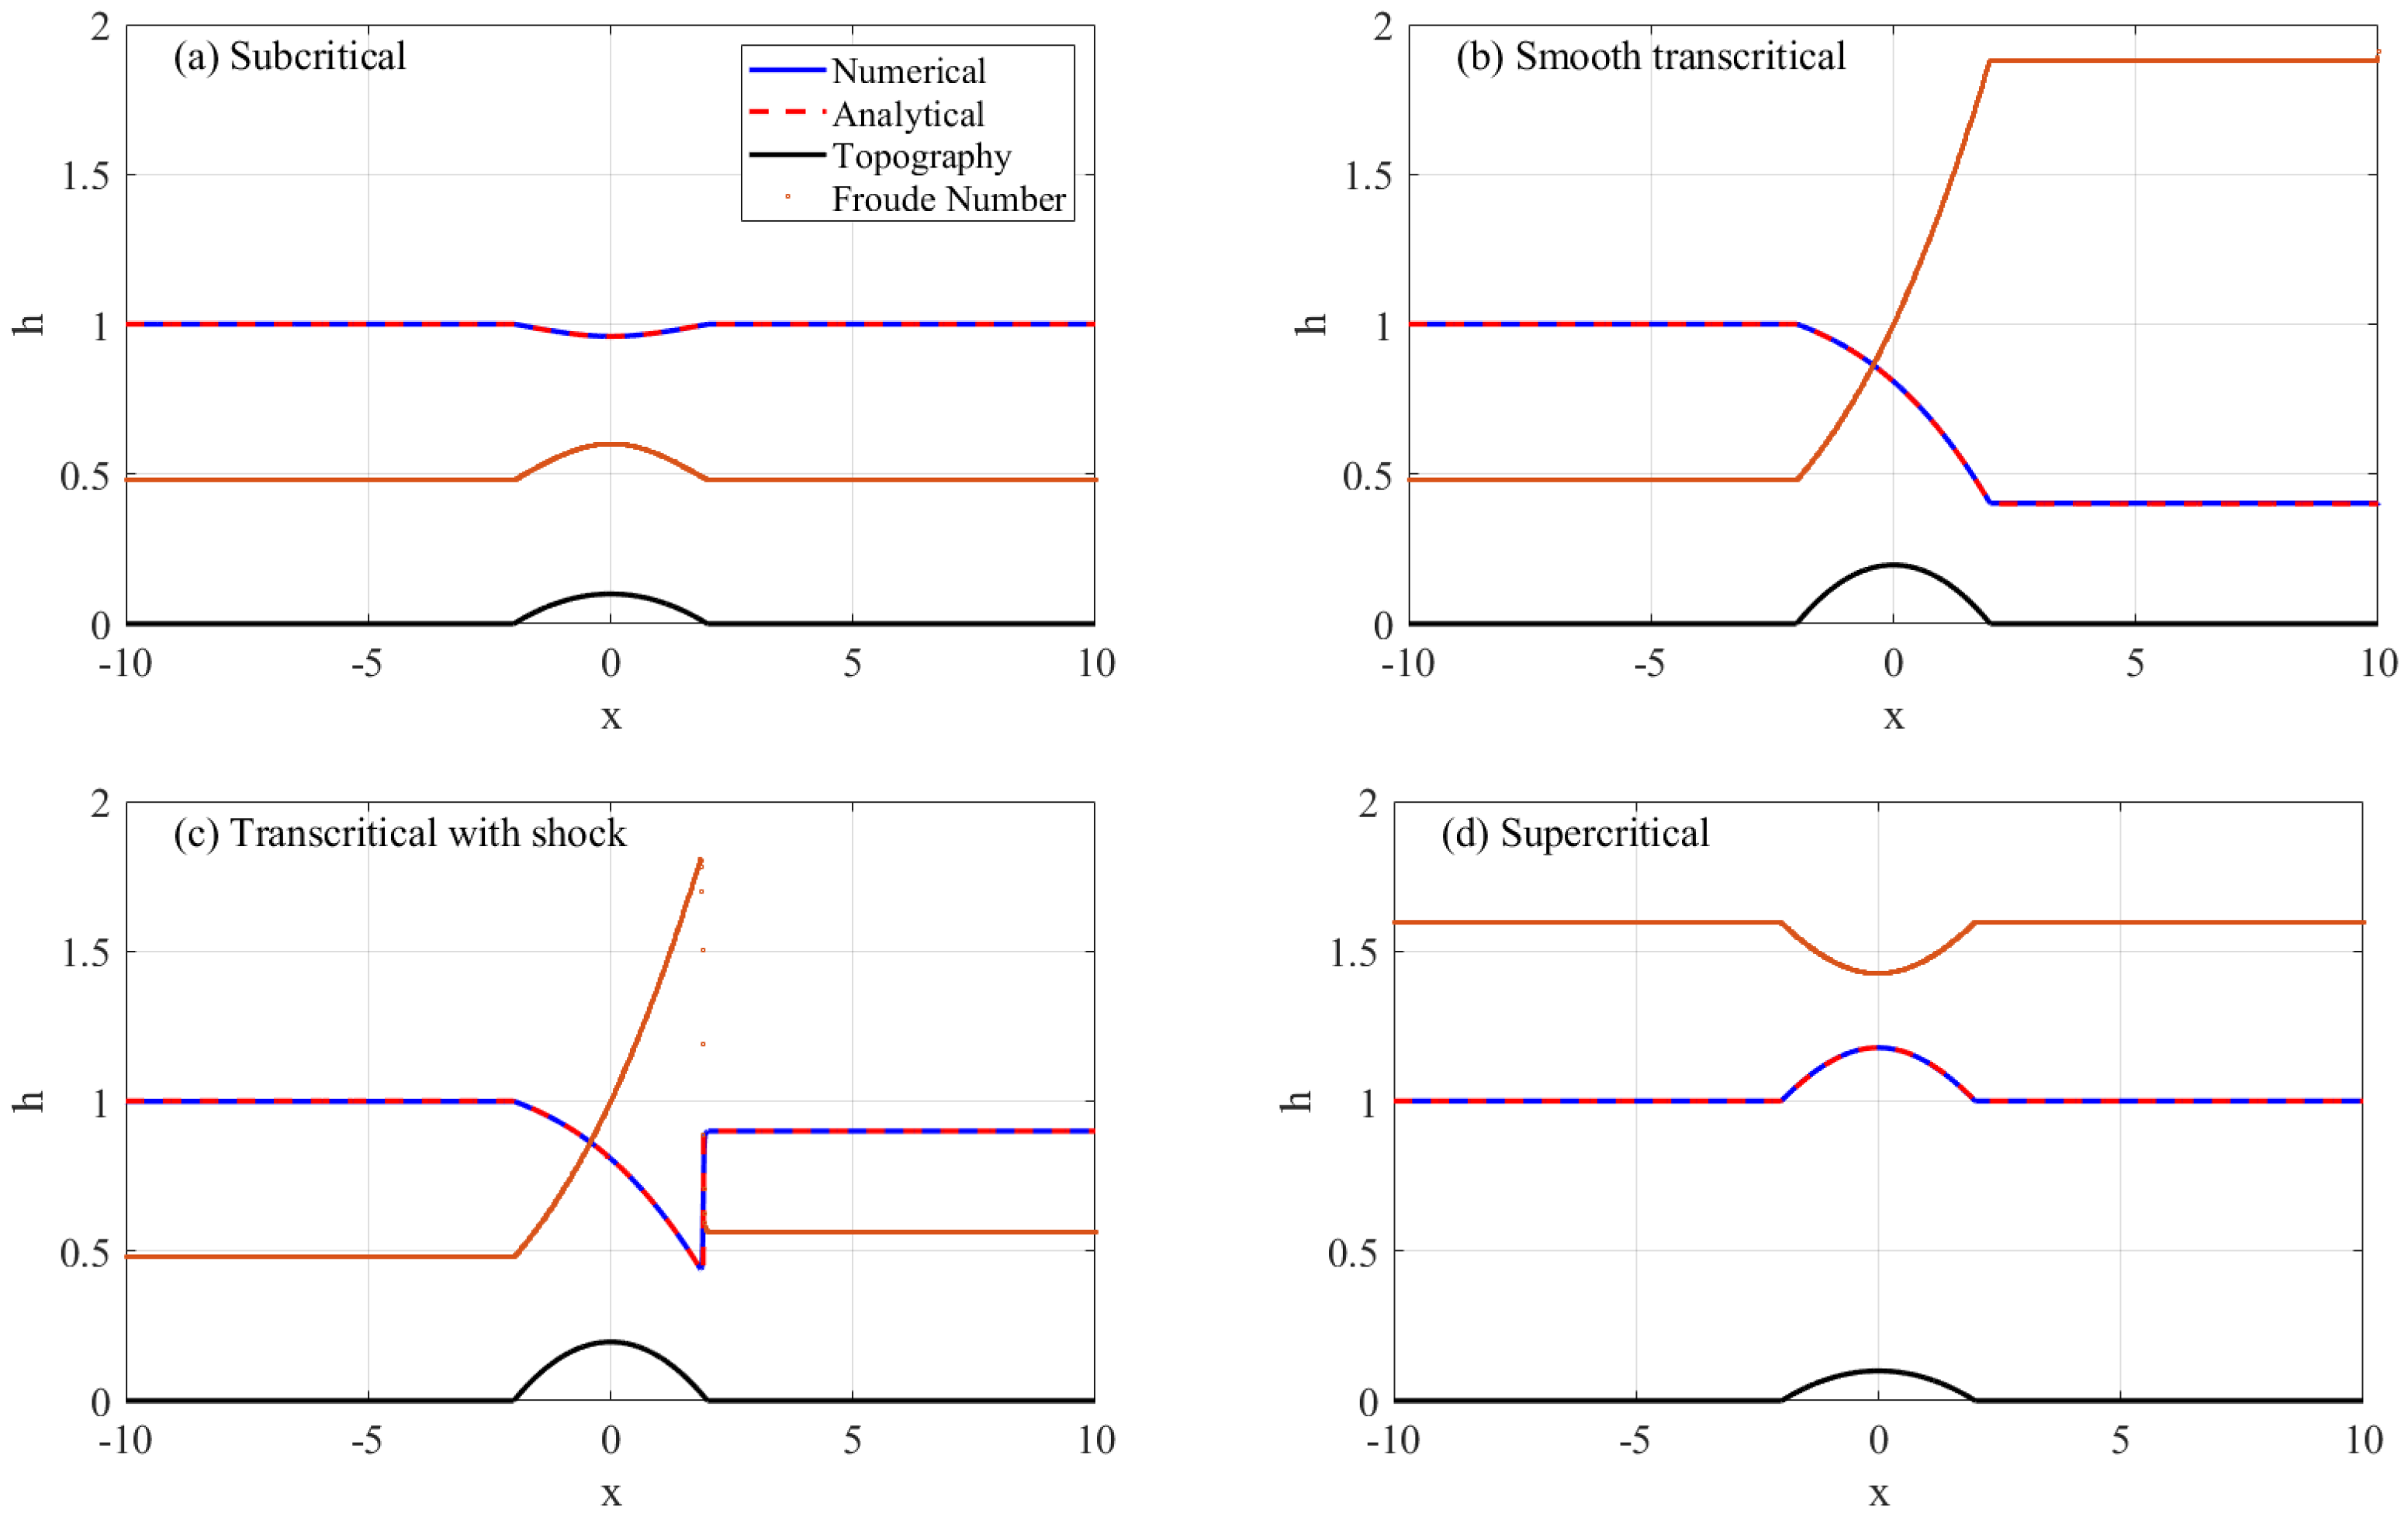
In the discussion follows, the MCS scheme will be implemented to show the development of a specific steady water level as response to the bump d ( x ) , as well as their dependence on the chosen boundary condition. Different types of situations, as predicted by the theory, will be simulated: subcritical, supercritical, and transcritical. For all numerical experiments conducted here, we use the computational domain L x L , time t > 0 , with the spatial grid size Δ x = 0.01 , and Δ t = 0.001 , so that the CFL number is 0.30 . All steady flow simulations conducted here will be compared with the analytical steady solutions from (10). The comparison shows a perfect agreement, with the root mean square error (RMSE) ± 0.6 % as resumed in Table 1.

3.1.1. Example 1: Subcritical Steady Flow

In this first simulation, the initial conditions used are water height h ( x , 0 ) = 1.0 and horizontal velocity u ( x , 0 ) = 1.5 , which correspond to an initial discharge of q ( x , 0 ) = 1.5 . Here, we adopt two boundary conditions: an upstream discharge q ( 0 , t ) = 1.5 and a downstream water height h ( L , t ) = 1 , and the channel bump (23) with d m = 0.1 .
Shortly after the simulation begins, the steady situation starts to develop, and after sometime the steady situation is reached, see Figure 5a. The expected steady flow that appear in this case, can be traced using the subcritical leg of the energy curve in Figure 2 (Left). The inflow boundary condition q ( 0 , t ) = 1.5 on the normal water height, corresponds to the point ( E 1 = F 2 / 2 + 1 , h 1 = 1 ) . As it runs over the bump, the energy E decreases, also the water height h decreases. The process continues until the maximum crest of the bump d m , at which the water height reaches its minimum, beyond which the water height increases back to meet the downstream boundary condition h ( L , t ) = 1 . As shown in Figure 5a the Froude number changes from its upstream value F = 0.4789 , increases until F = 0.6 at the maximum bump, which is then decreases back to the original value F = 0.4789 , therefore this steady flow is fully subcritical. Moreover, the numerical steady surface agrees with the analytical steady solution.

3.1.2. Example 2: Smooth Transcritical Steady Flow

In this second simulation, we will simulate a transcritical steady flow, i.e., a situation where the flow changes from subcritical to supercritical. Notice that for E 1 = F 2 / 1 + 1 , with F = 0.4789 , the Equation (10) has two solutions: h 1 = 1 and h 2 = 0.4008 . For this second simulation, we use the same parameters as in the first simulation in Section 3.1.1, except that d m = d c (the critical height of the bump (12)), and the downstream boundary is now taken to be h = h 2 = 0.4 . Not long after the simulation begins, the steady surface starts to developed; it appears in the form of a smooth transcritical flow as shown in Figure 5b. On the energy curve, this steady flow is recognized as a path that starts from the point ( E 1 , 1 ) on the subcritical leg, which moves to the left as the bump height increases, until the maximum height d m = d c , at which the flow becomes critical, and turns around to the supercritical branch. It then continues along the supercritical branch until it meets the condition of the outflow boundary h = h 2 = 0.4 . During the process, the Froude number starts at F = 0.4789 , over the channel bump the Froude number keeps increasing, until it reaches F = 1 exactly at the crest of the bump; the Froude number keeps increasing until the channel base is back to a constant. On this transcritical steady surface, the flow accelerates smoothly from the subcritical flow on the upstream side, and the supercritical flow on the downstream side. This result is again perfectly match with the analytical solution.

3.1.3. Example 3: Transcritical Steady Flow with a Shock

In reference to Figure 2 (Left), the values h 1 and h 2 are the only outflow boundary conditions that produce smooth solutions; h 1 produces a symmetric subcritical flow, whereas h 2 an asymmetric transcritical flow. Therefore, in this third simulation, we conducted a computation with the same parameter as the second simulation, except that the outflow water height differs from h 2 . Here, we take the outflow water height to be h = 0.9 . This choice of the downstream boundary condition will results in the formation of a transcritical flow with a shock as observed in Figure 5c.
Similar to the previous case, the Froude number starts at F = 0.4789 , it increases over the bump, until it reaches F = 1 exactly at the crest of the bump d m = d c , the Froude number keeps increasing over the channel bump. When the channel base is flat again, the Froude number experiences a sudden decrease towards a subcritical flow.

3.1.4. Example 4: Supercritical Steady Flow

In this fourth simulation, we use the same scheme to simulate a steady supercritical flow. Here, the initial condition is h ( x , 0 ) = 1 , u ( x , 0 ) = 5 , which corresponds to a supercritical flow with Froude number F = 5 / g . For the simulation, two boundary conditions are imposed on the upstream, a discharge of q ( 0 , t ) = 5 and fixed depth of h ( 0 , 1 ) = 1 . As shown in Figure 5d, a supercritical steady flow is developed, and the Froude number is larger than unity throughout the channel. Furthermore, in response to the channel bump (23) with d m = 0.1 , this steady supercritical flow has a positive bump on the surface. This can be explained via the supercritical leg of the energy curve on Figure 2 (Right). Starting from the point ( E 1 , 1 ) , which represents the upstream flow condition, as the channel base increases, the energy E decreases and water height h increases. At the crest of the bump d m , the water height reaches its maximum, beyond which the water height decreases back to its initial height h = 1 . Moreover, this numerically computed steady surface shows a good agreement with the analytical steady solution.

3.2. Simulation of Flow through a Contraction

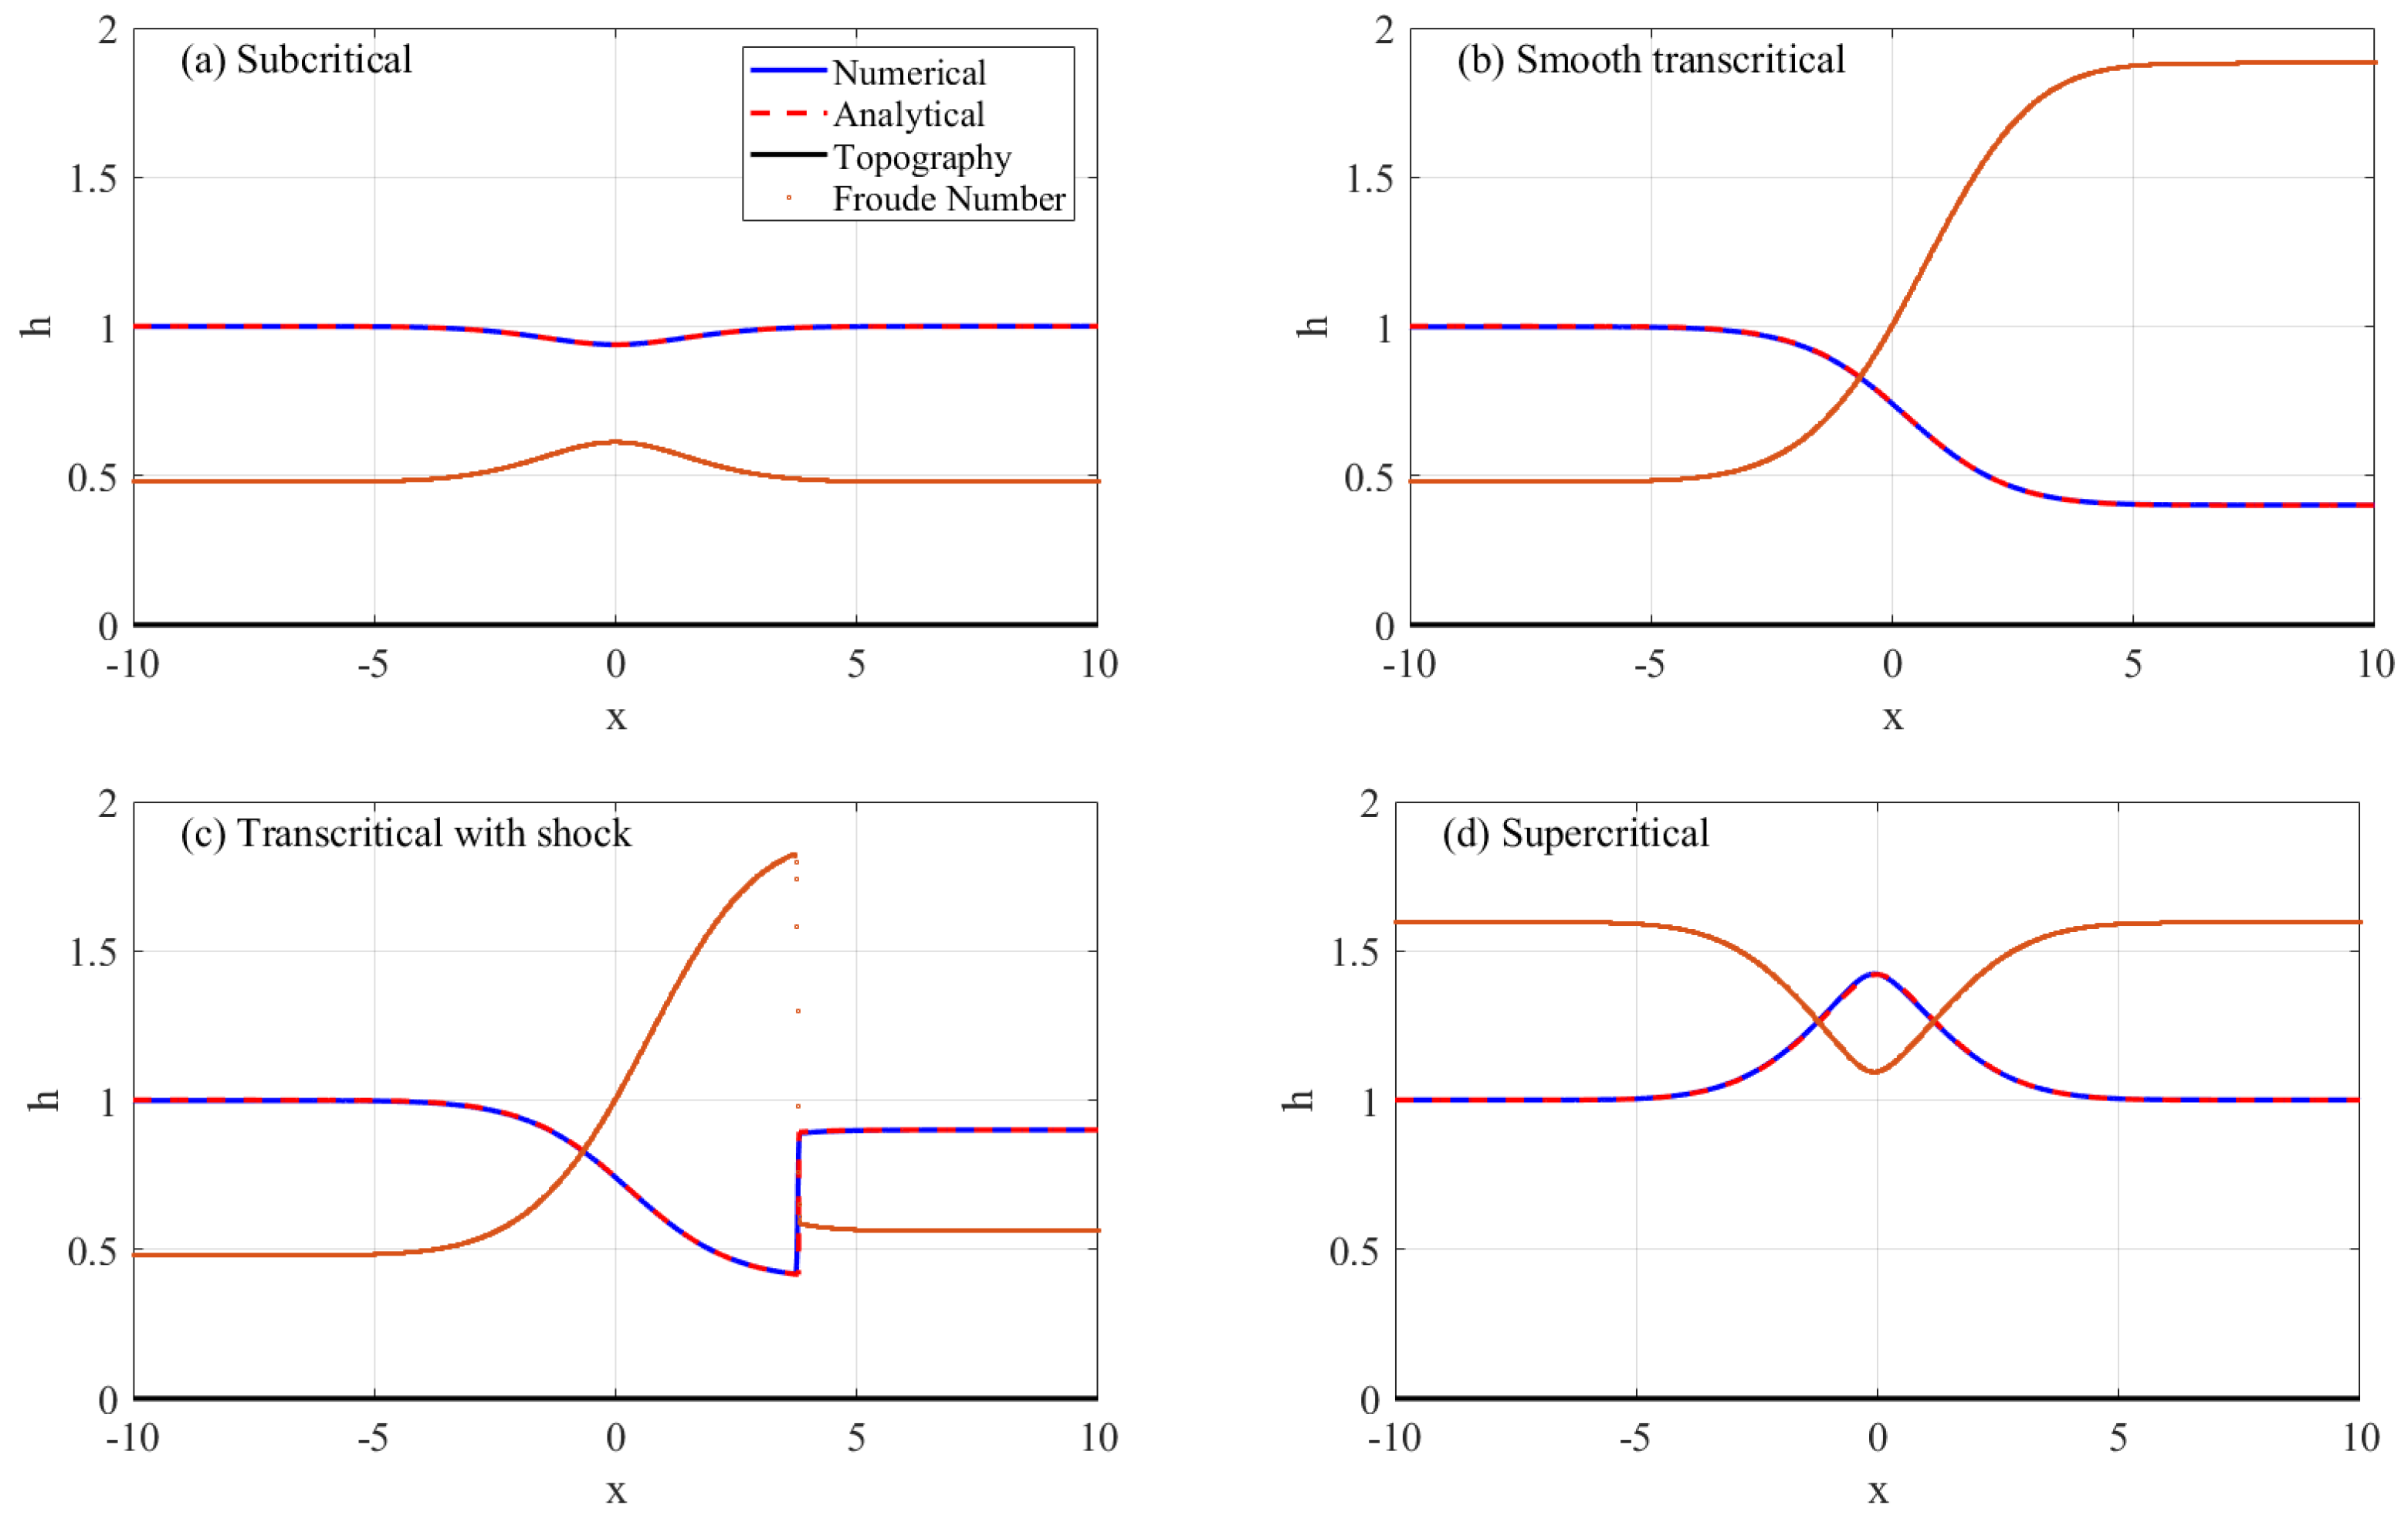
In this subsection, we investigate the steady flow as response to a contraction of the channel width b ( x ) , over a constant bathymetry d ( x ) = 0 . The same principles as in Section 3.1 are applied here, i.e., when the upstream Froude number is known, and the channel width b ( x ) is known, the steady surface is uniquely determined from Equation (14). For all numerical simulations conducted here, the computational domain is L x L , time t > 0 , with the spatial grid size Δ x = 0.01 , and Δ t = 0.001 , so that the CFL number is 0.30 . Similar to the previous simulations, all steady flow simulations conducted here will be compared with the analytical steady solutions from (14). The comparison shows a perfect agreement, with the RMSE-error ± 1 % resumed in Table 1. The channel width used in this simulation is
b ( x ) = 1 ( 1 b m ) exp x x 0 2.5 2 .
where b m denotes the minimum width achieved at x = x 0 = 0 , the mid point of the channel.

3.2.1. Example 1: Subcritical Steady Flow

In this simulation, we use the initial condition h ( x , 0 ) = 1 , u ( x , 0 ) = 1.5 , and adopt two boundary conditions: the upstream discharge q ( 0 , t ) = 1.5 and the downstream water level h ( L , t ) = 1 . The flow enters the rectangular channel of a flat base, and a varying width b ( x ) as in (24) with a contraction b m = 0.86 . Similar like the previous, not long after the simulation begins, the steady situation is reached, and the result is depicted in Figure 6a. As shown in the Froude number curve, its upstream value is F = 0.47 , which increases up to F = 0.6 in the contraction region, and decreases back to F = 0.47 on the downstream part. Therefore, this steady flow is fully subcritical. The steady surface that appears in the form of a negative bump, can be explained through the curve k ( h ) in Figure 4 (left). The upstream condition with normal width b = 1 (or [ b ] = 1 ) corresponds to the point ( h 1 = 1 , [ b ] = 0 ) , as the flow passes through the contraction, [ b ] gets increases up to the maximum value ( b m ) , which follows by the decreases of water level h m , see Figure 4 (left). Further, as the width increases back to the normal width, [ b ] decreases back to zero, and on the curve k ( h ) the water level is back to the normal water height h = 1 .

3.2.2. Example 2: Smooth Transcritical Steady Flow

In this second simulation, a smooth transcritical flow due to a contraction is simulated. The same set up as in the previous is used, except that here we use a downstream water level h ( L , t ) = 0.40 , and the narrowest width b m = b c that corresponds to the critical flow condition. In the case with the upstream Froude number F = 0.4 , Equation (15) results in b c = 0.74 . In this setting, the steady flow that is developed has the form of a transcritical flow, as shown in Figure 6b. Furthermore, the Froude number starts from F = 0.4789 on the upstream part, and as the channel width decreases, the Froude number increases up to unity F = 1 , exactly at the narrowest b c , and further increases till the channel width is back to the normal width.
On the curve k ( h ) , as in Figure 4 (Left), this steady transcritical flow is recognized as a path that starts from the point ( h 1 = 1 , 0 ) . As the channel width decreases, the solution moves along the subcritical leg all the way to b m = b c , becomes critical, and “turns” around to the supercritical leg, and further till it meets the condition of the downstream boundary h ( L , t ) = 0.4 . This steady flow is indeed consider as a transcritical flow, with the subcritical flow on the left-side of the narrow, and changes smoothly to be a supercritical flow on the right side.

3.2.3. Example 3: Transcritical Steady Flow with a Shock

The formation of a shock in the transcritical flow as a response of contraction is considered. In the same setup as the previous simulation, a channel width with the narrow b m = b c and downstream boundary condition h ( L , t ) = 0.90 is used. As the downstream water level differs from h 2 = 0.4 and h 1 = 1 , the resulting transcritical steady flow produces a shock wave front. The numerical steady result is shown in Figure 6c. The plot of the Froude number curve shows that this steady flow is subcritical on the left-side of the narrow, and supercritical on the right-side until the shock position, beyond which the flow is back to the subcritical flow.

3.2.4. Example 4: Supercritical Steady Flow

In this subsection, a supercritical steady flow is developed on a rectangular channel over a flat base with varying width b ( x ) as in (24), with b m = 0.85 . Under the same set up and boundary conditions as in Section 3.1.4, the numerical simulation produces this steady supercritical flow as shown in Figure 6d. Moreover, the Froude number is greater than unity, all the way throughout the channel, which confirm the supercritical type of flow.
From the above observation, we assume that our numerical MCS-scheme shows a good convergence in simulating transient solution to the steady state. This holds for various different flow types—subcritical, supercritical, and transcritical, including the transcritical flow with a shock. All these numerical steady solutions show good agreement with the steady solutions obtained directly from the energy relation (10) (or (14)) which is solved using the root finding algorithm. These type of solutions are referred as the analytical steady solutions. For all eight cases conducted here, the numerical steady solutions show a perfect agreement with the analytical solutions, with the RMSE error summarized in Table 1. Moreover, when the steady state was reached, the flow discharge is constant.

3.3. Simulation of Flow over a Bump and through a Contraction

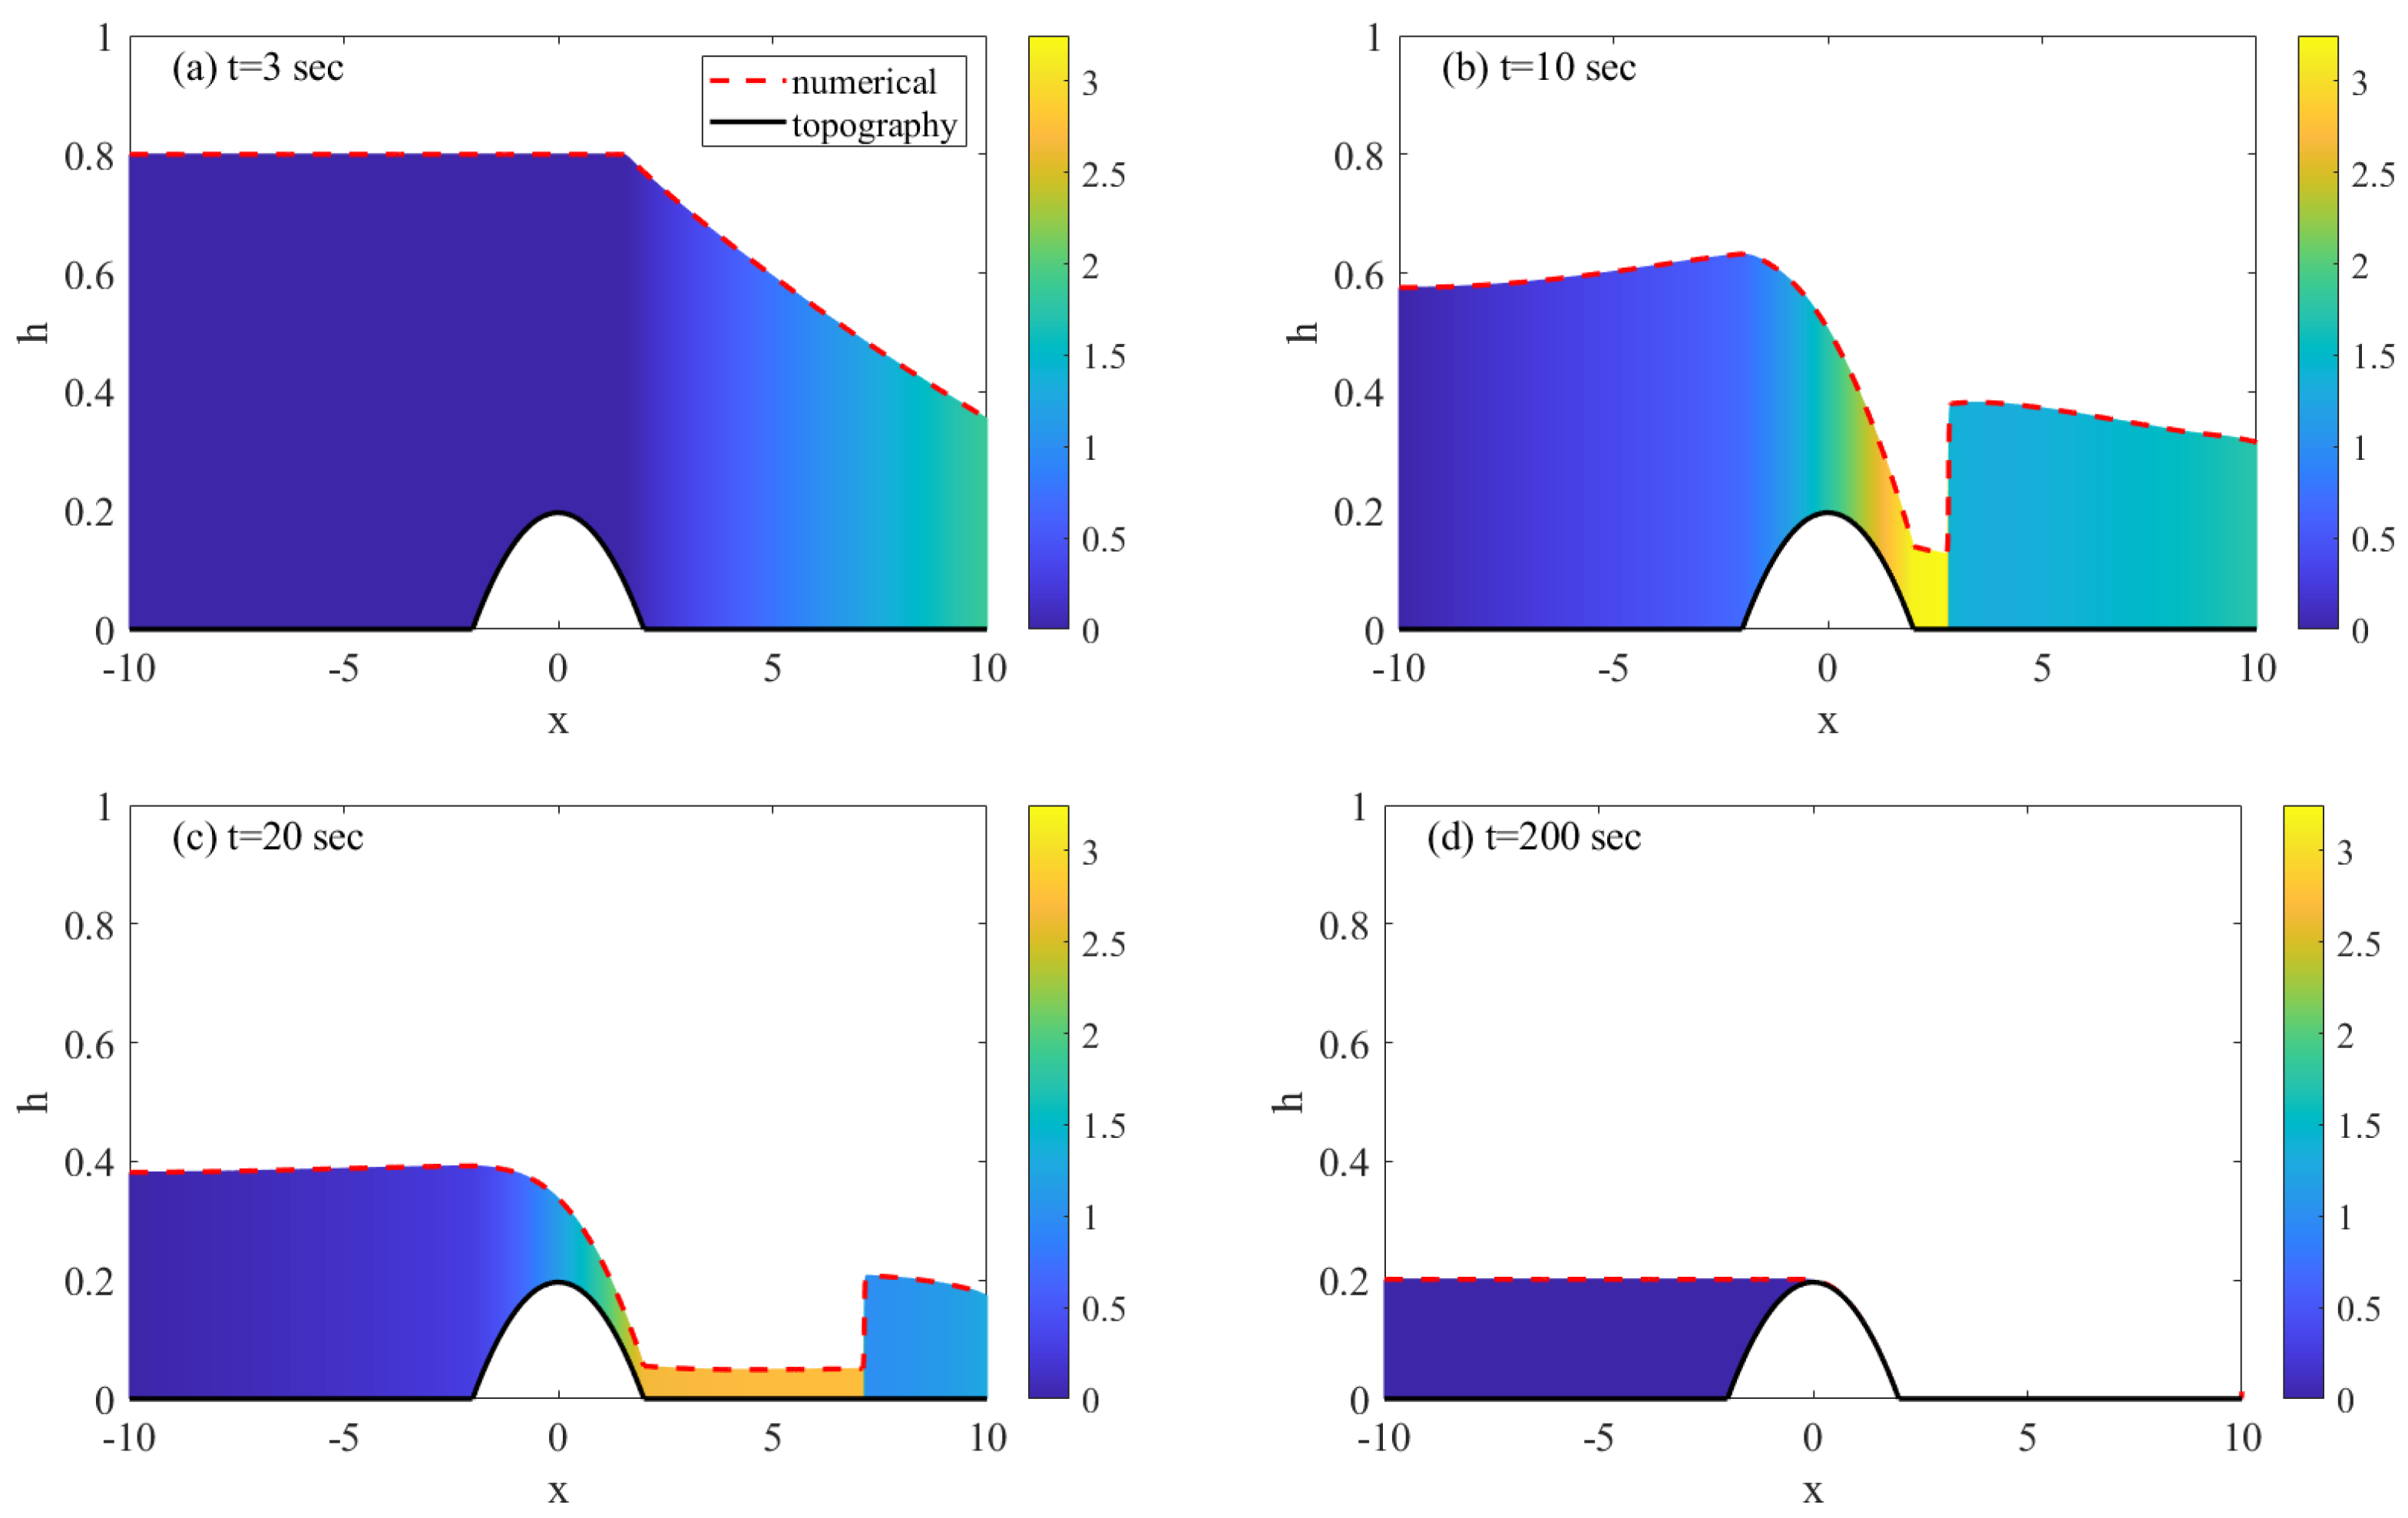
Finally, here we conducted flow simulation as a response to both a contraction and a bump. The channel width and the bump used in this simulation is (24) and (23), with b m = 0.69 and d m = 0.19 , respectively. The initial condition used are h ( x , 0 ) = 0.8 , u ( x , 0 ) = 0 , and the computation uses the spatial grid size Δ x = 5.10 4 , and Δ t = 5.35 5 , so that the CFL number is 0.3 . Boundary conditions used here are; a hard wall boundary on the left, and an absorbing boundary on the right. The computed water level at subsequent times is plotted in Figure 7. As time progresses, water on the downstream part is draining out, by the implementation of the absorbing right boundary, whereas on the upstream part, the water is being trapped by the hard wall and the bump. Further observation, the color scale in Figure 7 shows the horizontal velocity at subsequent times. As shown in the figure, the downstream horizontal velocity is always larger than the upstream velocity, as expected.

4. Experimental Validation

Experimental validation of the MCS-scheme will be conducted using two laboratory experiments established in [3]. For that purpose, the MCS-scheme (16)–(22) is used, with an additional friction term C f | u | u on the right hand side of Equation (2). Here, C f is the drag coefficient parameter, expressed in terms of the Manning coefficient n as
C f = g n 2 h 1 / 3 .

4.1. Dam Break Flow in a Channel with a Contraction

Consider a rectangular channel with a flat base, with a top-view configuration shown in Figure 8 (Left). In this dam break experiment, a volume of water on the upstream part was hold by a gate, located 6.1 m to the right of the left boundary. The channel has a normal width 0.5 m, with a sudden contraction to width 0.1 m, this contraction is located 7.9 m from the gate. Along the channel four wave gauges are installed, see Figure 8 (left).
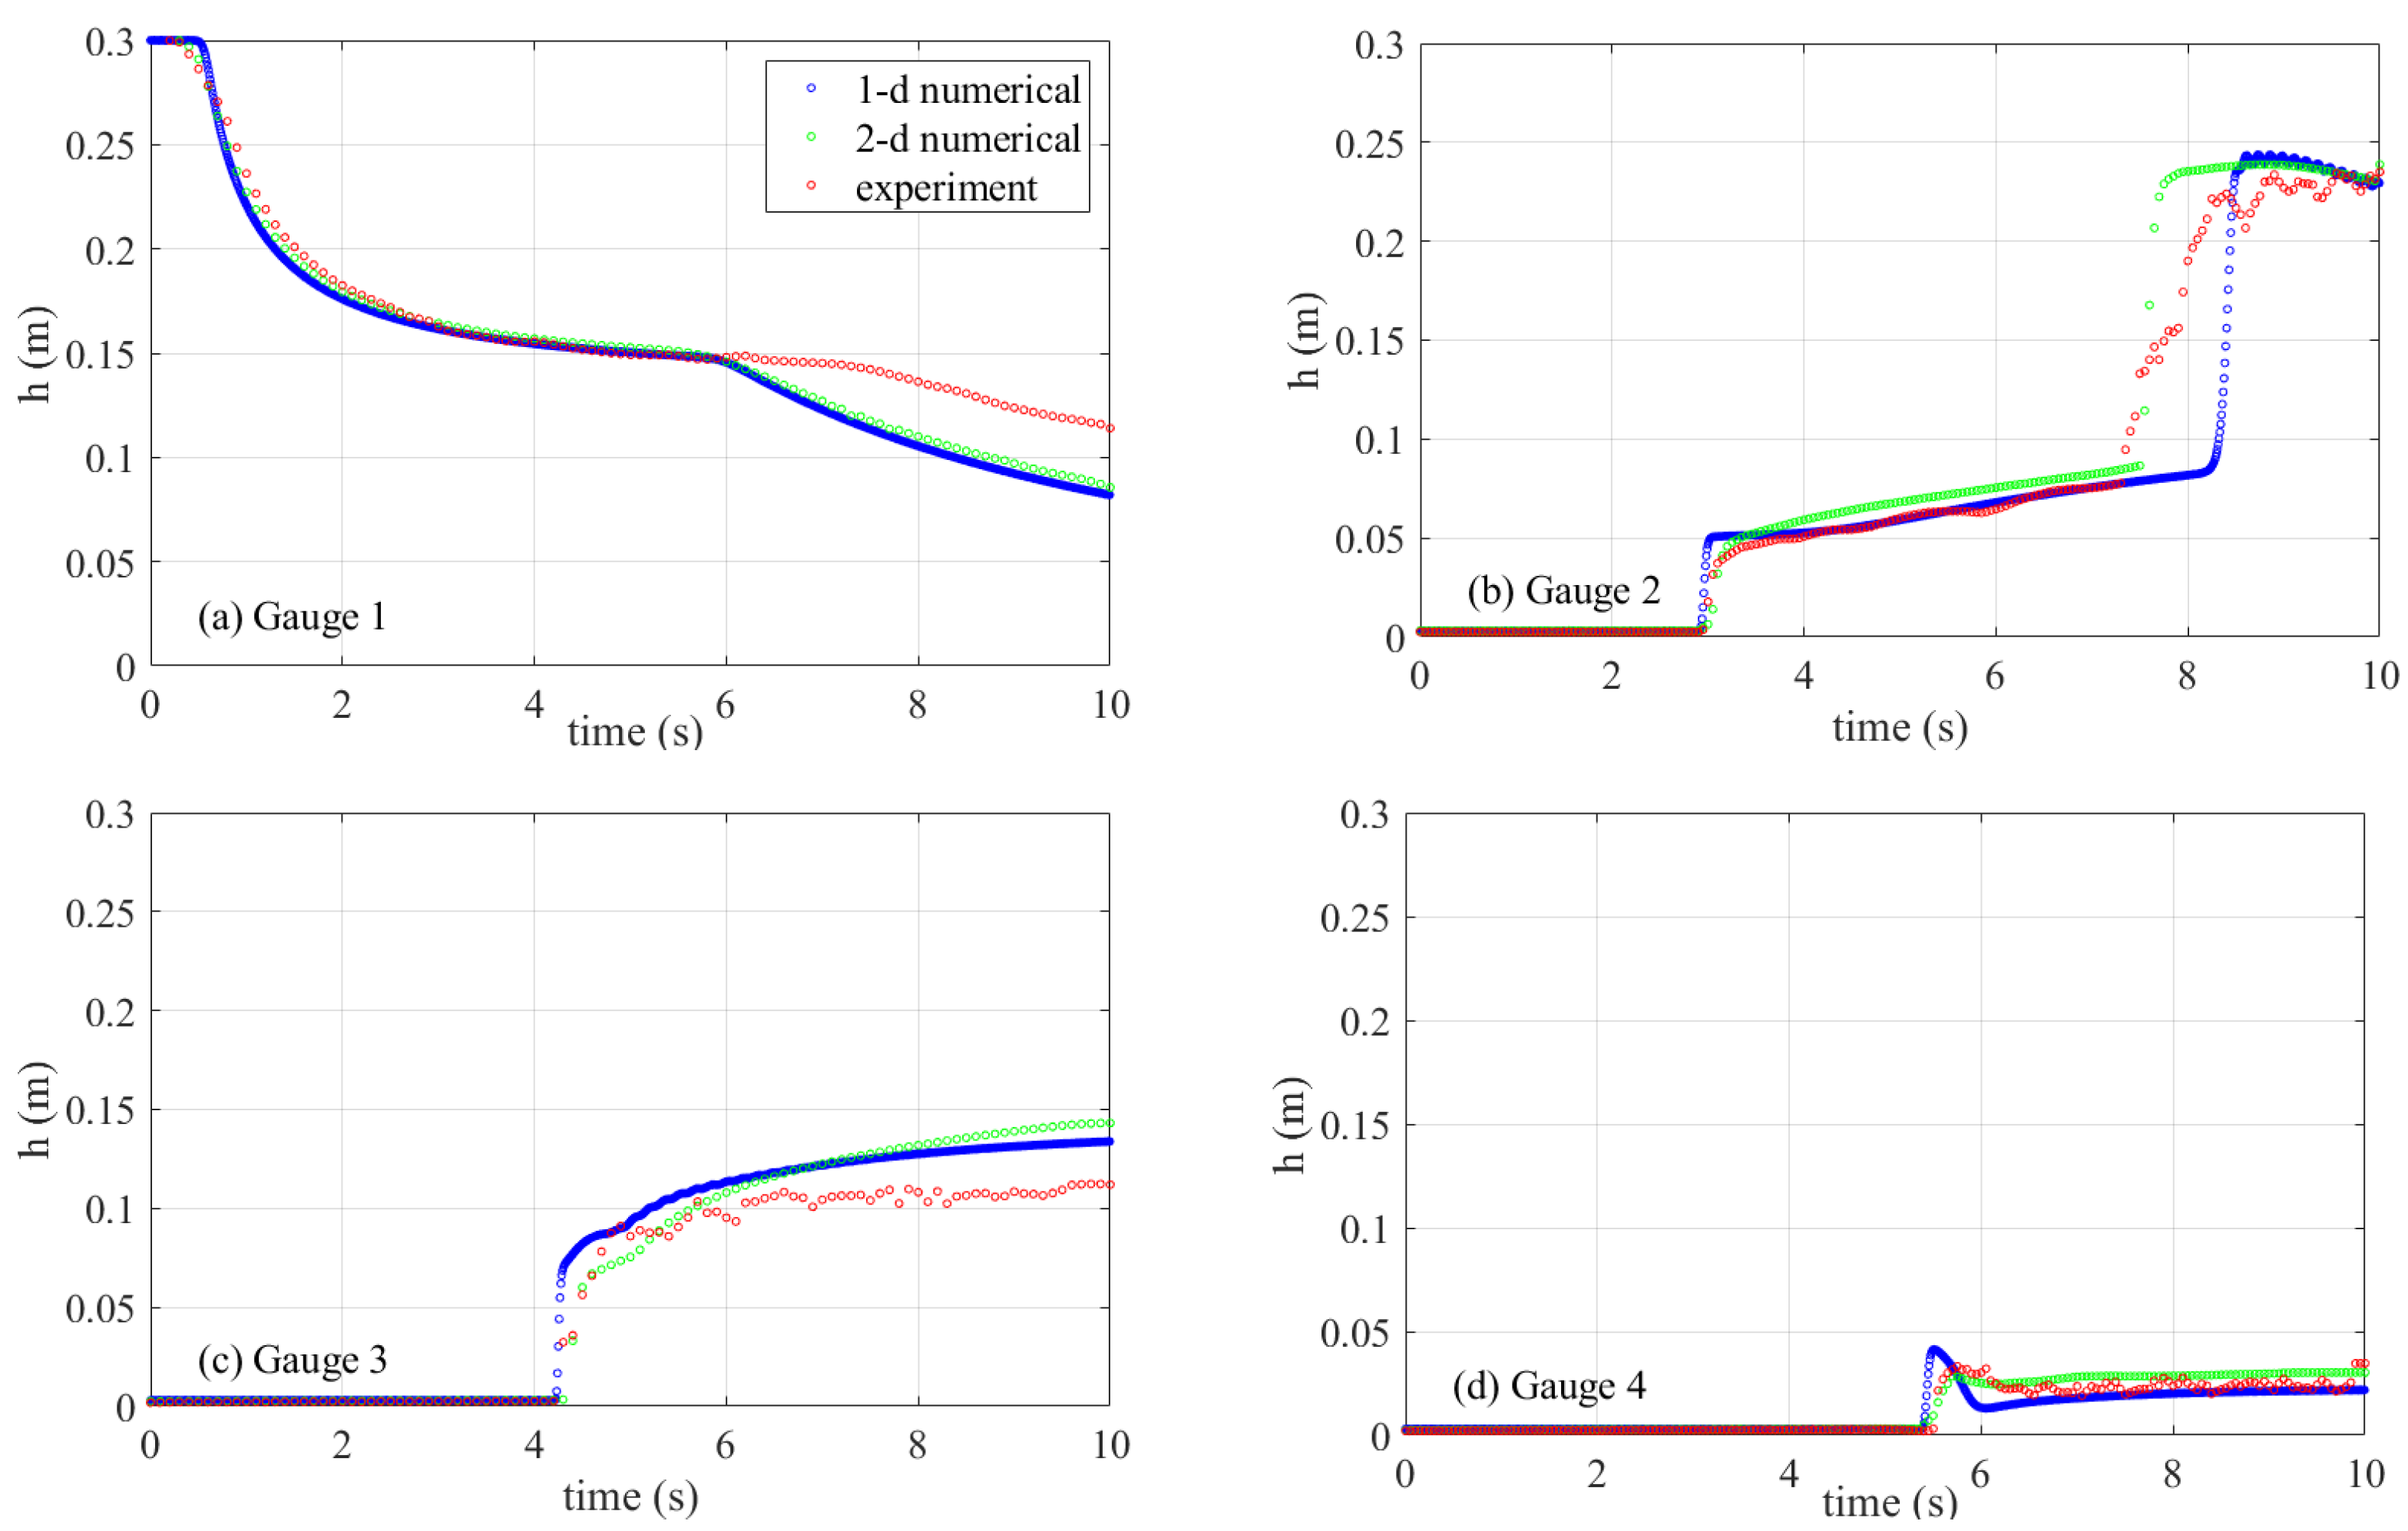
In the simulation, the grid size Δ x = 0.05 m, Δ t = 0.008 s were used. The Manning coefficient n = 0.01 and threshold area A t h r e s = 0.01 m 2 were taken. The left boundary is a hard wall, whereas the right boundary is an absorbing boundary. The initial water level is set to be 0.3 m on the left side of the gate, and 0.003 m on the right side. As soon as the simulation starts, the water in the reservoir rapidly flows down towards the downstream part, and the recorded water level at Gauge 1 is presented in Figure 9a. At Gauge 2, the recorded water level shows a shock front arriving at time t = 3 s, see Figure 9b, later a rarefaction wave appears which causes a drop in the water level upstream of the dam, measured at Gauge 1. In Figure 9a, the water level suddenly increases with the arrival of the shock front after about 3 s. Another abrupt change of depth is noted later at t = 8 s, which is due to the reflected shock from the constriction. The water level in Figure 9c is recorded by Gauge 3, located inside the contraction area. Here, there is only one shock wave that was arrived at about 4 s. In Figure 9d the sudden increase at water level happened after time t = 5 s.
As shown in Figure 9, the numerical results of the quasi-1-dimensional MCS scheme can capture the whole process accurately enough. The results obtained show a good agreement with the experimental data [3]. Further, as shown at Gauges 2–4, our numerical calculations can predict the arrival of the shock fronts, accurate enough. Some discrepancies were shown at Gauges 1–3, especially on areas where some turbulence occur, that is because our scheme has not taken the turbulence effect into account. Moreover, our numerical results has shown the same trend with results from the 2-dimensional numerical scheme [17]. Of course, calculations with the quasi-1-dimensional MCS-scheme are much cheaper than calculations with 2-dimension scheme.

4.2. Dam Break Flow in a Channel with a Triangular Obstacle

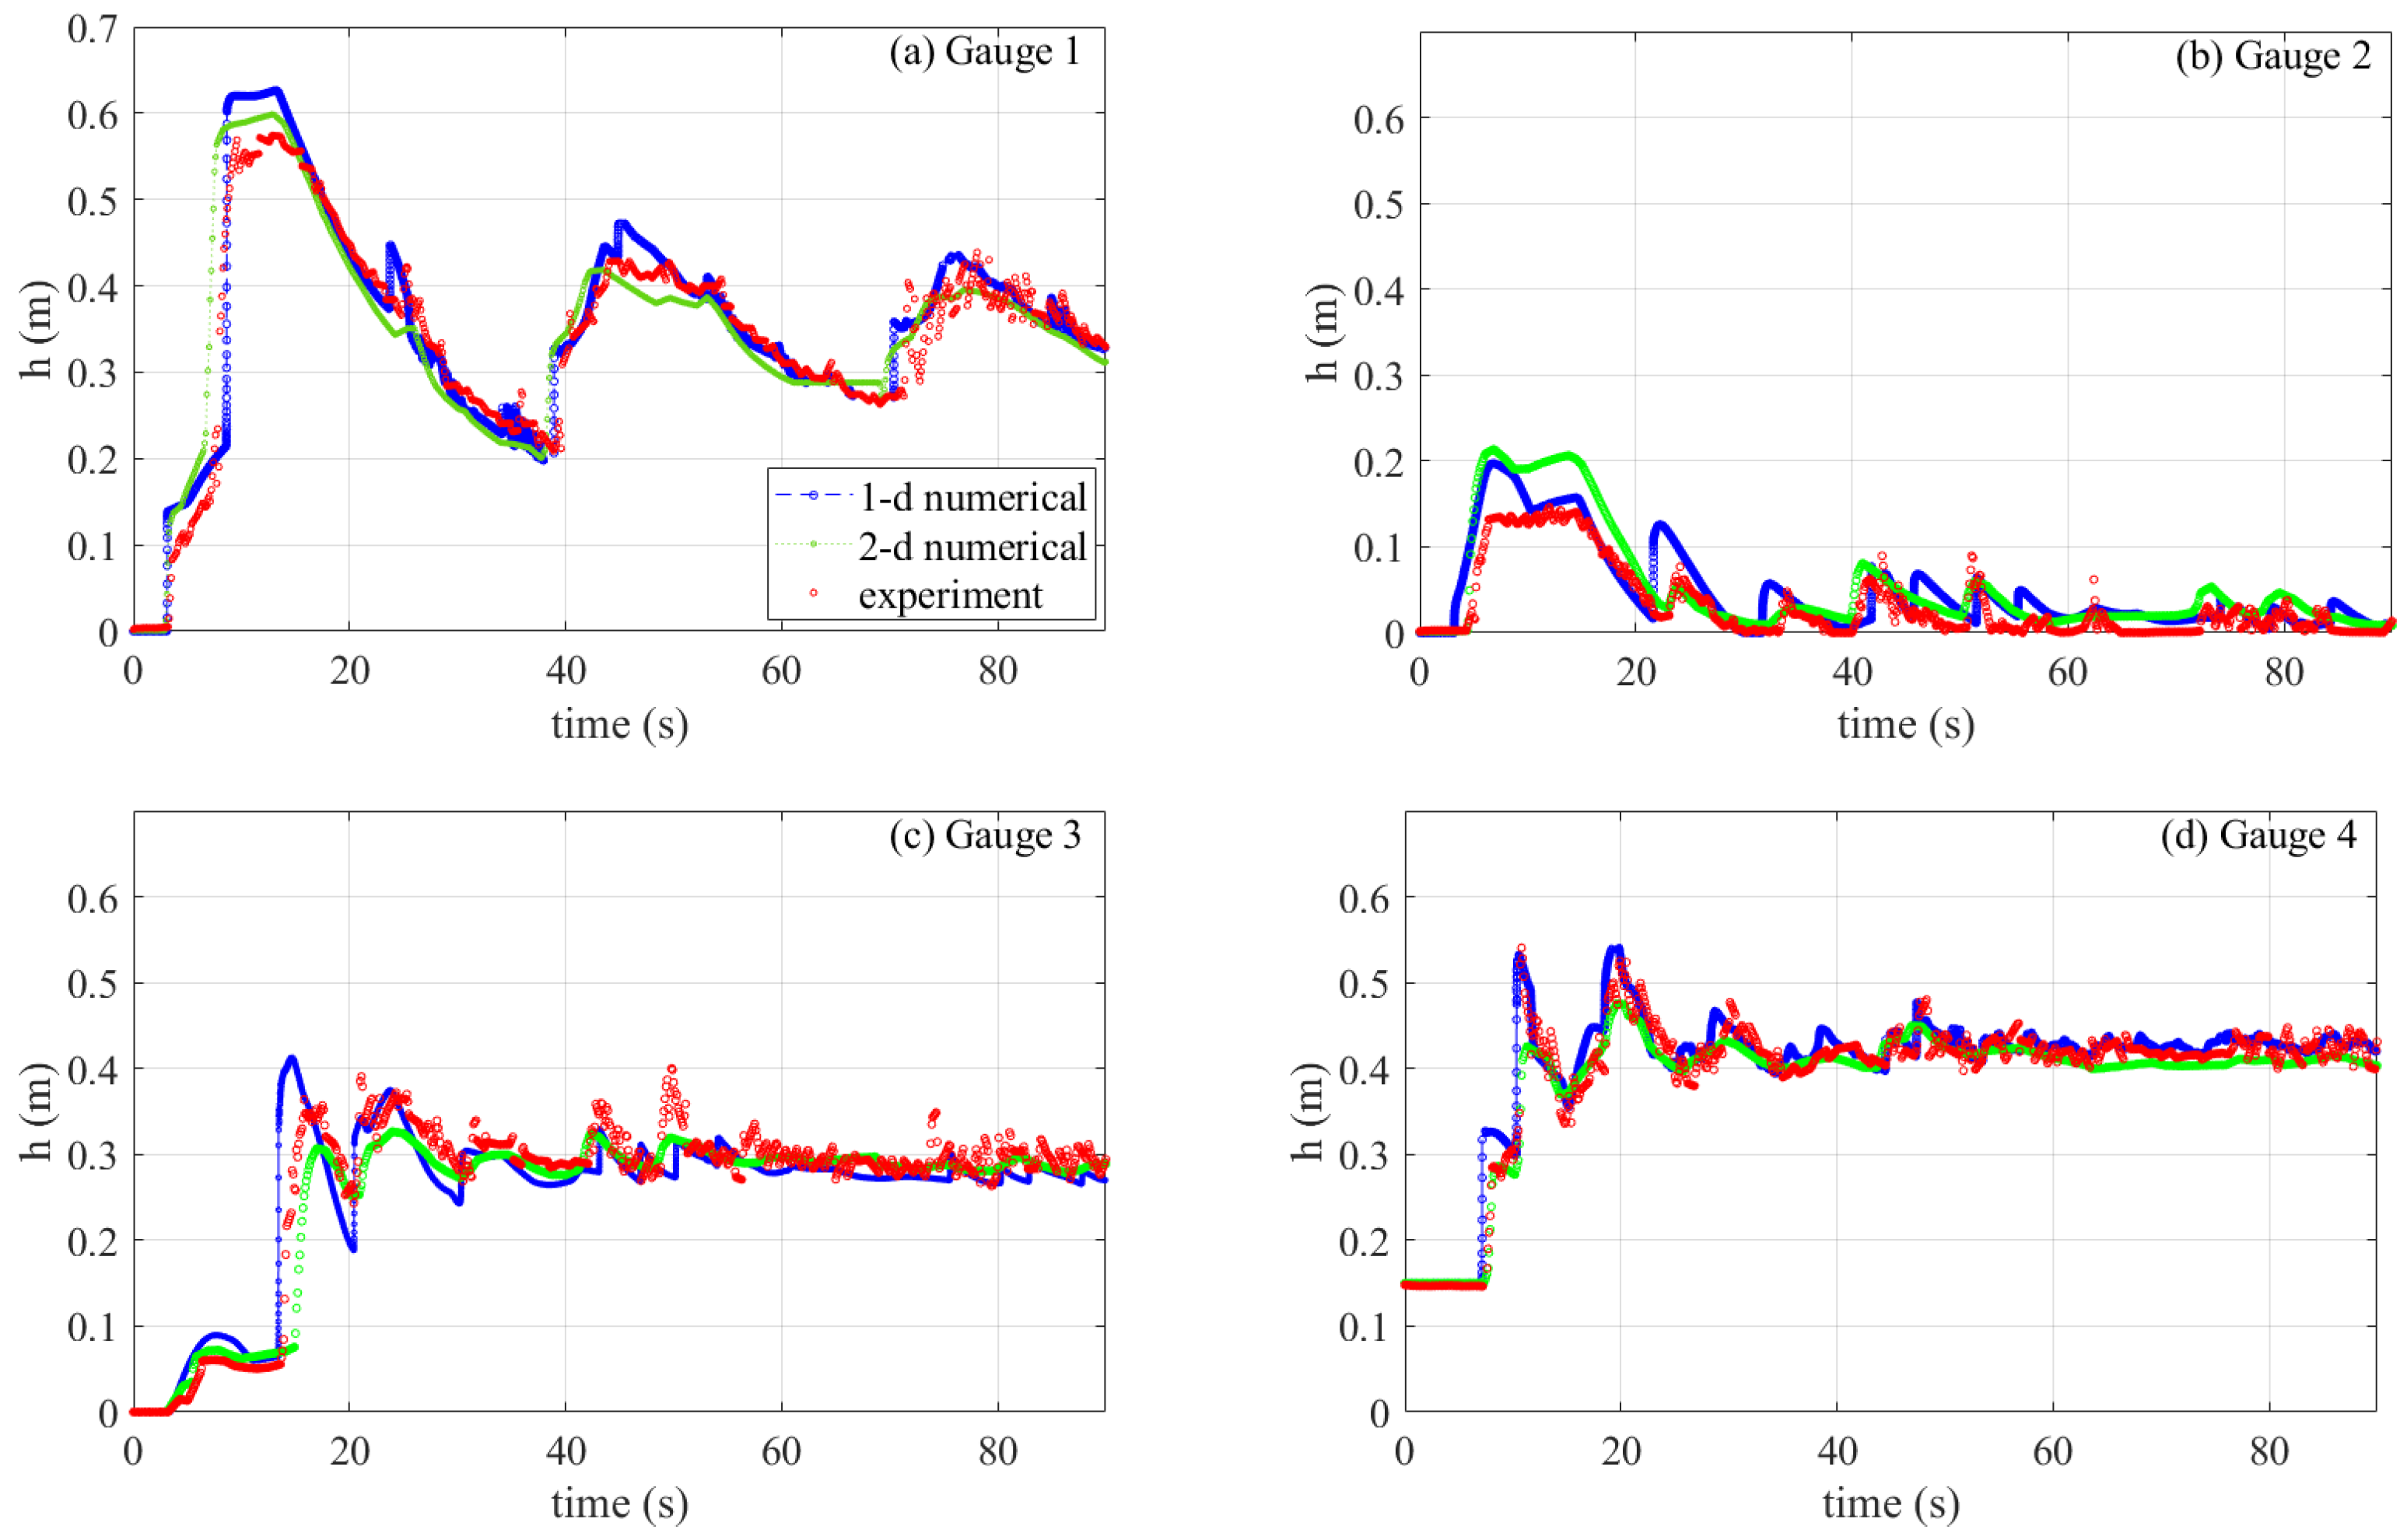
In this second test, we conducted a dam break simulation in a channel of uniform width, with a triangle obstacle on the channel base. The triangle height is 0.4 m, and located 13 m on the downstream side of the reservoir, see Figure 8 (Right). Initially, the reservoir holds a water level height 0.75 m, and the triangle holds a water height 0.15 m to create a puddle, while the area between the reservoir and the triangle is dry. Our simulation was conducted using Δ x = 0.05 m, Δ t = 0.04 s, the Manning coefficient n = 0.0125 , and threshold area A t h r e s = 0.01 , whereas both boundaries were set to be hard walls. After the dam breaks, a wall of water is rapidly released and propagates downstream. This wall of water will hit the triangle, and climbing up the obstacle and form a shock wave that propagates further downstream. This obstacle also creates a reflected shock wave which propagates upstream. The shock waves will be reflected from the boundary wall, and interact again with the obstacle. The process continues for sometime, creating somewhat complex behavior. During simulation, the water level is recorded at four wave gauges, and the results are shown in Figure 10.
In Figure 10, the recorded water level at four wave gauges was plotted together with the experimental data [3] and the 2-dimensional numerical results [17]. As shown in Figure 9 and Figure 10, our quasi-1-dimensional MCS scheme can describe this physical processes well enough. Furthermore, our comparison with experimental data shows some fair agreement, also our numerical calculation predicts the shock fronts correctly. However, some discrepancies are observed, which is also detected by other authors [3,4,17]. This may be due to the absence of turbulence effects and the hydrostatic assumption used in the model.

5. Conclusions

An extension of the MCS scheme for channels of varying width and depth has been proposed. Formulation of the method has maintained the conservative properties of the Saint-Venant Equations. By validation with a steady analytical solution, our scheme was able to simulate various steady flow for a wide range of Froude number. Good agreement was also obtained in the validation of experimental data, which required the wet-dry algorithm, as well as friction in their calculations. This study demonstrated the success of the MCS scheme as a quasi-1-dimensional model suitable for simulating flows in channels with varying widths and depths. However, the scheme developed here is still limited to rectangular cross section channels, and the slope of the channel bed should also not be too steep. In the case of applications for actual river flow, the scheme needs further development, also taking into account the branching of river flows that are commonly found in nature.

Author Contributions

Conceptualization, S.R.P. and P.V.S.; methodology, S.R.P.; validation, P.V.S., L.H.W. and R.N.H.; formal analysis, S.R.P.; writing—original draft preparation, P.V.S. and S.R.P.; writing—review and editing, S.R.P. and L.H.W.; visualization, P.V.S. and R.N.H.; funding acquisition, S.R.P. and L.H.W. All authors have read and agreed to the published version of the manuscript.

Funding

This research was funded by Institut Teknologi Bandung Research Grant 2S/I1.C01/PL/2020 and Kemenristek BRIN 2/AMD/E1/KP.PTNBH/2020.

Conflicts of Interest

The authors declare no conflict of interest. The funders had no role in the design of the study; in the collection, analyses, or interpretation of data; in the writing of the manuscript; or in the decision to publish the results.

Abbreviations

The following abbreviations are used in this manuscript:
MCSMomentum-conserving staggered grid

References

  1. Eymard, R.; Gallouët, T.; Herbin, R. Finite volume methods. Handb. Numer. Anal. 2000, 7, 713–1018. [Google Scholar]
  2. LeVeque, R.J. Finite Volume Methods for Hyperbolic Problems; Cambridge University Press: Cambridge, UK, 2002; Volume 31. [Google Scholar]
  3. Alias, N.A.; Liang, Q.; Kesserwani, G. A Godunov-type scheme for modelling 1D channel flow with varying width and topography. Comput. Fluids 2011, 46, 88–93. [Google Scholar] [CrossRef]
  4. Gouta, N.; Maurel, F. A finite volume solver for 1D shallow-water equations applied to an actual river. Int. J. Numer. Methods Fluids 2002, 38, 1–19. [Google Scholar] [CrossRef]
  5. Wang, G.T.; Chen, S.; Boll, J. A semianalytical solution of the Saint-Venant equations for channel flood routing. Water Resour. Res. 2003, 39. [Google Scholar] [CrossRef]
  6. Moussa, R.; Bocquillon, C. Approximation zones of the Saint-Venant equations f flood routing with overbank flow. Hydrol. Earth Syst. Sci. 2000, 4, 251–260. [Google Scholar] [CrossRef] [Green Version]
  7. Liu, H.; Wang, H.; Liu, S.; Hu, C.; Ding, Y.; Zhang, J. Lattice Boltzmann method for the Saint–Venant equations. J. Hydrol. 2015, 524, 411–416. [Google Scholar] [CrossRef]
  8. Hernández-Dueñas, G.; Karni, S. Shallow Water Flows in Channels. J. Sci. Comput. 2011, 48, 190–208. [Google Scholar] [CrossRef]
  9. Akbari, G.; Firoozi, B. Implicit and explicit numerical solution of Saint-Venant equations for simulating flood wave in natural rivers. In Proceedings of the 5th National Congress on Civil Engineering, Mashhad, Iran, 4–6 May 2010; p. 7. [Google Scholar]
  10. Catella, M.; Paris, E.; Solari, L. Conservative scheme for numerical modeling of flow in natural geometry. J. Hydraul. Eng. 2008, 134, 736–748. [Google Scholar] [CrossRef] [Green Version]
  11. Ying, X.; Khan, A.A.; Wang, S.S. Upwind conservative scheme for the Saint Venant equations. J. Hydraul. Eng. 2004, 130, 977–987. [Google Scholar] [CrossRef]
  12. Sanders, B.F. High-resolution and non-oscillatory solution of the St. Venant equations in non-rectangular and non-prismatic channels. J. Hydraul. Res. 2001, 39, 321–330. [Google Scholar] [CrossRef]
  13. Liu, X. A steady-state-preserving scheme for shallow water flows in channels. J. Comput. Phys. 2020, 423, 109803. [Google Scholar] [CrossRef]
  14. Pudjaprasetya, S.; Magdalena, I. Momentum conservative scheme for dam break and wave run up simulations. East Asian J. Appl. Math. 2014, 4, 152–165. [Google Scholar] [CrossRef]
  15. Erwina, N.; Adytia, D.; Pudjaprasetya, R.; Nuryaman, T. Staggered Conservative Scheme for 2-Dimensional Shallow Water Flows. Fluids 2020, 5, 149. [Google Scholar] [CrossRef]
  16. Stelling, G.S.; Duinmeijer, S.A. A staggered conservative scheme for every Froude number in rapidly varied shallow water flows. Int. J. Numer. Methods Fluids 2003, 43, 1329–1354. [Google Scholar] [CrossRef]
  17. Liang, Q. Flood simulation using a well-balanced shallow flow model. J. Hydraul. Eng. 2010, 136, 669–675. [Google Scholar] [CrossRef]
Figure 1. Sketch of the problem and notations; side view (left) and top view (right).
Fluids 06 00026 g001
Figure 2. The energy curves E ( h ) , (left) the subcritical case, and (right) the supercritical case.
Fluids 06 00026 g002
Figure 3. (Left) Illustration of channel width b ( x ) , and (right) its transformation [ b ] 1 / b 2 1 .
Fluids 06 00026 g003
Figure 4. The energy curve k ( ( h ) as a function of 1 / b 2 1 : (left) the subcritical case and (right) the supercritical case.
Fluids 06 00026 g004
Figure 5. Various flow over a bump through a constant channel width for 10 x 10 , for cases (a) subcritical, (b) smooth transcritical, (c) transcritical with shock, (d) supercritical.
Fluids 06 00026 g005
Figure 6. Various steady flows in a rectangular channel with a contraction for 10 x 10 , for cases (a) subcritical, (b) smooth transcritical, (c) transcritical with shock, (d) supercritical.
Fluids 06 00026 g006
Figure 7. Plot the surface h ( x , t ) at subsequent times of a drainage simulation in a channel with a bump and contraction. The color scale indicates the horizontal velocity of u ( x , t ) .
Fluids 06 00026 g007
Figure 8. (a) Top view of the channel with a strong contraction used in experiment 1. (b) Side view of the channel with a triangular obstacle used in experiment 2. Locations of the four gauges along the channel are indicated by crosses: Gauge 1 (blue), Gauge 2 (green), Gauge 3 (magenta), and Gauge 4 (brown).
Fluids 06 00026 g008
Figure 9. Water levels at four wave gauges, showing the comparison between the MCS-scheme (blue), experiments [3] (red), and 2d-numerical results [17] (green).
Fluids 06 00026 g009
Figure 10. Water levels at four wave gauges, showing the comparison between the MCS-scheme (blue), experiments [3] (green), and 2d-numerical results [17] (red).
Fluids 06 00026 g010
Table 1. The root mean square error (RMSE) between the numerical fluid height and the analytical solution.
CaseFlow TypeRMSE-Error
FlowSubcritical0.00016
overSupercritical0.00034
a bumpSmooth transcritcal0.00111
Transcritical with shock0.00641
FlowSubcritical0.00008
throughSupercritical0.00209
a contractionSmooth transcritical0.00114
Transcritical with shock0.01211
Publisher’s Note: MDPI stays neutral with regard to jurisdictional claims in published maps and institutional affiliations.