Article

Rheology Methods as a Tool to Study the Impact of Whey Powder on the Dough and Breadmaking Performance of Wheat Flour

LEAF-Linking Landscape, Environment, Agriculture and Food, Instituto Superior de Agronomia, Universidade de Lisboa, Tapada da Ajuda, 1349-017 Lisboa, Portugal
*
Author to whom correspondence should be addressed.
Fluids 2020, 5(2), 50; https://doi.org/10.3390/fluids5020050
Submission received: 28 February 2020 / Revised: 9 April 2020 / Accepted: 11 April 2020 / Published: 14 April 2020
(This article belongs to the Special Issue Advances in Experimental and Computational Rheology, Volume II)

Abstract

:
Considering the nutritional value, whey is an excellent ingredient for the development of food products, in line with the concept of a circular economy for the reuse of industry by-products. The main objective of this work was to evaluate the impact of the whey addition on the rheology of wheat flour dough and breadmaking performance, using both empirical and fundamental methods. Different levels of commercial whey powder (0%, 12%, 16% and 20% w/w) were tested in a bread formulation previously optimized. Dough mixing tests were performed using Micro-doughLab and Consistograph equipment, to determine the water absorptions of different formulations and evaluate empirical rheology parameters related to mixing tolerances. Biaxial extension was applied by the Alveograph to simulate fermentation during the baking process. Fermented doughs were characterized in a Texturometer using penetration and extensibility tests, and by small amplitude oscillatory shear (SAOS) measurements, a fundamental rheology method, in a Rheometer applying frequency sweeps. Loaf volume and firmness were used to study the breadmaking quality. Despite a negative impact on the empirical rheology parameters of the dough and poorer baking results, the use of this by-product should be considered for nutritional and sustainability reasons. In addition, significant correlations (r2 > 0.60) between the dough rheology parameters obtained from the empirical measurements were established. Changes in the gluten structure were not accurately detected by the SAOS measurements and Texture Profile Analysis of the doughs, and a correlation between fundamental and empirical measurements was not found. Consistograph or Micro-doughLab devices can be used to estimate bread firmness. Extensional tests in the Texturometer, using SMS/Kieffer Dough and Gluten Extensibility Rig, may predict loaf volume.

1. Introduction

Considering the large amounts of whey produced all the years by the cheese industry, coupled with its high organic matter composition, namely lactose and proteins, leading to high chemical oxygen demand when disposed into the effluents, whey has been considered an important pollution problem and several strategies have been developed to add value to this by-product, including bringing it back to the food value-chain, as in circular economy principles [1,2].
As whey contains some important components, such as lactose, proteins and minerals, it is recognized as a valuable source of high-grade proteins, mainly β-lactoglobulin and α-lactalbumin, which constitute ca. 50% and 20% of the total protein content, respectively; the remainder is accounted for by immunoglobulins, bovine serum albumin, protease peptones and other minor proteins [3,4]. The excellent functional properties of whey proteins have been recognized, namely gelation and binding properties; therefore, whey is widely used as a functional ingredient in many formulated bakery and dairy foods [2,5,6]. In addition to proteins, cheese whey is also rich in lactose; thus, its biotechnological value as a fermentation substrate has also been explored, namely to produce bioethanol, biogas and lactic acid [2,7,8].
There are several studies about the incorporation of whey in traditional bread [9,10,11,12,13,14,15,16,17], revealing an increase of total mineral content, calcium, magnesium, phosphorus, potassium and zinc contents and also lactose and lactic acid, followed by a positive effect on crust color, sweet and yeast flavor, expressed as a positive sensory impact. However, a negative impact on the development of the gluten matrix was also verified, expressed as a softening in the dough system, by the reduction of the viscoelastic moduli values [16,17]. More recently, the use of whey proteins on the mimetic effect of gluten, for the development of gluten-free dough, has also been investigated [18,19,20,21,22].
The incorporation of other protein sources into wheat flour is a market tendency, but it is a major technological challenge since the wheat flour gluten-forming proteins (glutenin and gliadin), responsible for the viscoelastic dough structure, may be perturbed either by a dilution effect of the gluten proteins or/and by interfering in the intermolecular linkages of the protein matrix. This matrix is the three-dimensional network formed by gluten, which surrounds the starch granules and retains the air incorporated during the mixing process and the carbon dioxide (CO2) produced by yeast fermentation. If a large amount of lactose, proteins, or fibers is incorporated in wheat flour, the amount of water necessary to obtain the desirable mechanical properties of the dough changes [16,23,24]. The mineral content of whey also influences the dough formation properties of gluten proteins and may improve both association or dissociation of dough components [10].
Many rheology devices have been used by cereal technologists and researchers to predict the flour performance throughout the whole bread processing—during mixing and kneading, fermentation, molding, fermentation and baking steps. For this, empirical techniques are still indispensable and recognized as standard methods [25]. The empirical methods include the following instruments: Farinograph, Mixograph, Extensography, Alveography, Amylograph, Mixolab and Texturogram. Fundamental rheology techniques are also used to study flour dough systems, by means of static or dynamic measurements. The dynamic oscillatory rheology involving small deformations (SAOS) is being preferred to study the structural and fundamental properties of the wheat dough [26,27]. Both fundamental and empirical methods present some disadvantages. In the baking area, the empirical rheology methods are especially prominent to study the influence of flour constituents, and additives, on dough behavior, and are commonly used by the industry.
This work is part of a project that aims to optimize the healthy bread composition and technological processing by determining the maximum content of whey to be incorporated in traditional bread production, keeping the mechanical behavior of the dough and sensory appealing of the resulting bread. Four types of empirical instruments, Micro-doughLab, Consistograph, Alveograph and Texturometer, were employed to study the rheology properties of wheat dough enriched with whey powder. Fundamental SAOS measurements were evaluated as well, and the obtained results from these different types of tests are discussed and compared to estimate dough performance during processing and future bread properties. Bread quality properties like texture (firmness) and volume were also determined.

2. Material and Methodology

2.1. Materials

The ingredients used for the preparation of the bread doughs were the following: wheat flour (Granel T65, Portugal) with a minimum of 8.0% gluten (db) and falling number higher than 220 s, commercial whey powder (Lactogal S.A., Portugal), dehydrated yeast (Fermipan, France), commercial sugar and salt, SSL-E481-sodium stearoyl-2 lactylate (Puratos, Portugal) and distilled water. Whey powder has 74.0 g of lactose, 12.0 g protein, 1.4 g lipids and 1.3 g of salt per 100 g of the product, with a moisture content of 11.3 g/100 g, considering the information provided by the supplier.

2.2. Methodology

Wheat flour was partially replaced by different amounts of whey powder—0% (Control), 12%, 16% and 20% w/w. The amount of water was added according to the values found in Micro-doughLab mixing tests, at a 14% moisture basis, as shown in Table 1. The moisture content of the flour and whey powder was determined in a moisture infra-red determination balance (ADAM PMB 202).
For texture and oscillatory measurements, doughs were prepared using a bread formulation. The other ingredients were the same for all formulations: yeast (4.0 g), salt (1.7 g), sugar (1.0 g) and SSL (0.5 g) in relation to 100 g of wheat flour + whey powder, according to a previously optimized formulation [23,24].
The preparation of the bread doughs was carried out in a thermal processor (Bimby-Vorwerk, Carnaxide, Portugal). First, yeast was activated in warm water in the processor cup, for 30 s at position 3 at 37 °C. The solid ingredients were added and homogenized during 60 s in position 6, and subsequent kneading during 120 s. The dough was placed in a rectangular bread container (5.0 cm × 20.0 cm × 8.5 cm), previously sour and floured, followed by fermentation during 60 min at 37 °C (optimum time/temperature of yeast activity previously optimized) in an electric oven (Arianna XLT133, Cadoneghe, Italy). After fermentation, doughs were characterized by means of texture assays and fundamental oscillatory rheology. For breadmaking tests (loaf volume and crumb firmness), the dough was baked at 160 °C for 30 min. Breads were analyzed after cooling for 2 h. Three loaves of each formulation were prepared.

2.2.1. Micro-doughLab

The Micro-doughLab 2800 (Perten Instruments, Sidney, Australia) was used to determine the optimum water absorption capacity to reach a peak of 130 mN.m, using 4.00 ± 0.01 g sample at 14% moisture basis, according to the AACC method 54.70-01: High-speed Mixing Rheology of Wheat Flour Using the DougLab, modified for Micro-doughLab. Sample and water weights were corrected from sample moisture content. Manufacturer’s rapid mixing protocol was used, mixing the wheat flour and whey at a constant 120 rpm speed and temperature of 30 °C for 10 min. Measurements were repeated at least three times for each sample. As a result, a mixing curve was obtained that provides the dough´s mixing properties—peak resistance (mN.m), dough development time (s), stability (s), softening (mN.m) and peak energy (Wh/kg).

2.2.2. Consistograph

The Consistograph (AlveoLAB, Chopin Technologies, Cedex, France) was used to determine the water absorption capacity and the physical properties of the wheat flour/whey dough systems, according to the AACC 54−50.01 method. First, an amount of water, based on the initial moisture content of the flour + whey, is added in order to reach a constant hydration level (76.47% moisture on a dry-matter basis). The peak pressure recorded during kneading is used to calculate the water absorption of the flour sample at a target pressure of 2200 ± 100 mm H2O. Then, the subsequent test is performed at the adapted hydration level previously determined. Maximum pressure (mbar), time to reach maximum pressure (s), tolerance to kneading (s), and consistency of the dough after 250 and 450 s (mbar) were obtained. Measurements were repeated at least three times for each sample.

2.2.3. Alveograph

To determine the resistance of doughs to biaxial extension, the Alveograph (AlveoLAB, Chopin Technologies, Cedex, France) was used according to the AACC method 54.30-02. The optimum water absorption values determined in the Consistograph test were used (adapted hydration conditions). Doughs were prepared by mixing flour and whey with salted water and forming calibrated pieces of dough. After 20 min of resting time, the system inflates the test pieces to the point of rupture and records the pressure in the bubble as a function of time. In this model, temperature and hygrometry conditions are automated and fully controlled, and the inverted bubble is more spherical and closer to the ideal conditions of the test. Overpressure or dough´s tenacity (mmH2O), extensibility (mm), P/L ratio and the work or deformation energy (10−4 J) were calculated. For each sample, five dough pieces were tested.

2.2.4. Small Amplitude Oscillatory Shear Measurements

SAOS measurements were performed in a controlled stress rheometer (Haake MARS III Thermo Fisher Scientific, Waltham, MA, USA ) equipped with a UTC-Peltier and fitted with a serrated parallel plate system with 20 mm diameter and 2 mm gap. After kneading, the dough was shaped into small balls and fermented in the oven. The fermented samples were placed between the plate sensor and the dough surface exposed was coated with paraffin oil to prevent drying and allowed to rest 30 min before testing. Stress and frequency sweep tests were performed at 5 ± 1 °C to prevent fermentation during tests. The stress sweep test at 6.28 rad/s was always performed prior to the frequency sweep, for the determination of the linear viscoelastic zone. The viscoelastic properties of the dough were determined from the frequency sweep tests, applying a sinusoidally varying shear stress of 10 Pa over an angular frequency range of 0.001 to 100 rad/s. Two doughs of each formulation were prepared, separately, and tests were performed at least once in each sub-sample, corresponding to three repetitions in each dough sample.

2.2.5. Texture

Texture Profile Analysis

TPA was carried out in a temperature controlled room at 20 ± 1 °C, using a Texturometer TA.XTplus (Stable Micro Systems, Surrey, UK) equipped with a 5 kg load cell and a cylindrical acrylic probe of 10 mm diameter (p/10). Fermented doughs were placed in cylindrical containers with 25 mm height × 65 mm diameter and fermented before testing. TPA in penetration mode at 1 mm·s−1 of crosshead speed, 3 s of waiting time and 15 mm distance. The same samples prepared for SAOS measurements were used for texture, corresponding to three repetitions in each dough sample. Firmness (N), adhesiveness (N·s) and cohesiveness were the main representative parameters calculated from the texturograms.

SMS/Kieffer Dough and Gluten Extensibility Rig

For the uniaxial extensional tests, the SMS/Kieffer Dough and Gluten Extensibility Rig for the TA.XTplus was used, as described by Buresová et al. [28], with some modifications. The dough was molded into rolls and placed on the Teflon mold, forming test pieces with a length of 5 cm. The doughs were tested after resting for 10 min (t0) and 30 min (t30) at 30 °C. The force required to stretch the sample was recorded as a function of time using a test speed of 1.0 mm·s−1 and distance of 70 mm. The peak force—resistance to extension R (N), distance corresponding to this peak—extensibility E (mm), and ratio number R/E (N·mm−1) are the most important parameters. The test was repeated at least four times for each sample.

Puncture Test

Bread crumb was measured 2 h after baking by means of a puncture test using a cylindrical acrylic probe of 19 mm diameter (p/19) at 2 mm·s−1 crosshead speed and 12 mm distance. Loaves were sliced by hand, 20 mm thick. Measurements were repeated four times for each sample, 2 h after baking (t0) and after two days of storage (t48 h). Firmness (N) was the texture parameter used to discriminate different bread samples.

2.2.6. Volume

Volume of the bread was measured using rapeseed displacement method AACC 10-05.01. In order to compare different breads, the same weight of ingredients, in relation to 300 g of wheat flour in mixture with whey powder, was used to prepare all the breads, using the formulations presented in Table 1. All the samples were evaluated in triplicate.

2.2.7. Statistical Analysis

The analysis of variance (one-way ANOVA) of the experimental data was performed using Origin Pro 8.0 software, followed by Tukey’s test. Correlation analysis was performed by using STATISTICA (version 10.0). The significance level was set to 95% (p < 0.05).

3. Results and Discussion

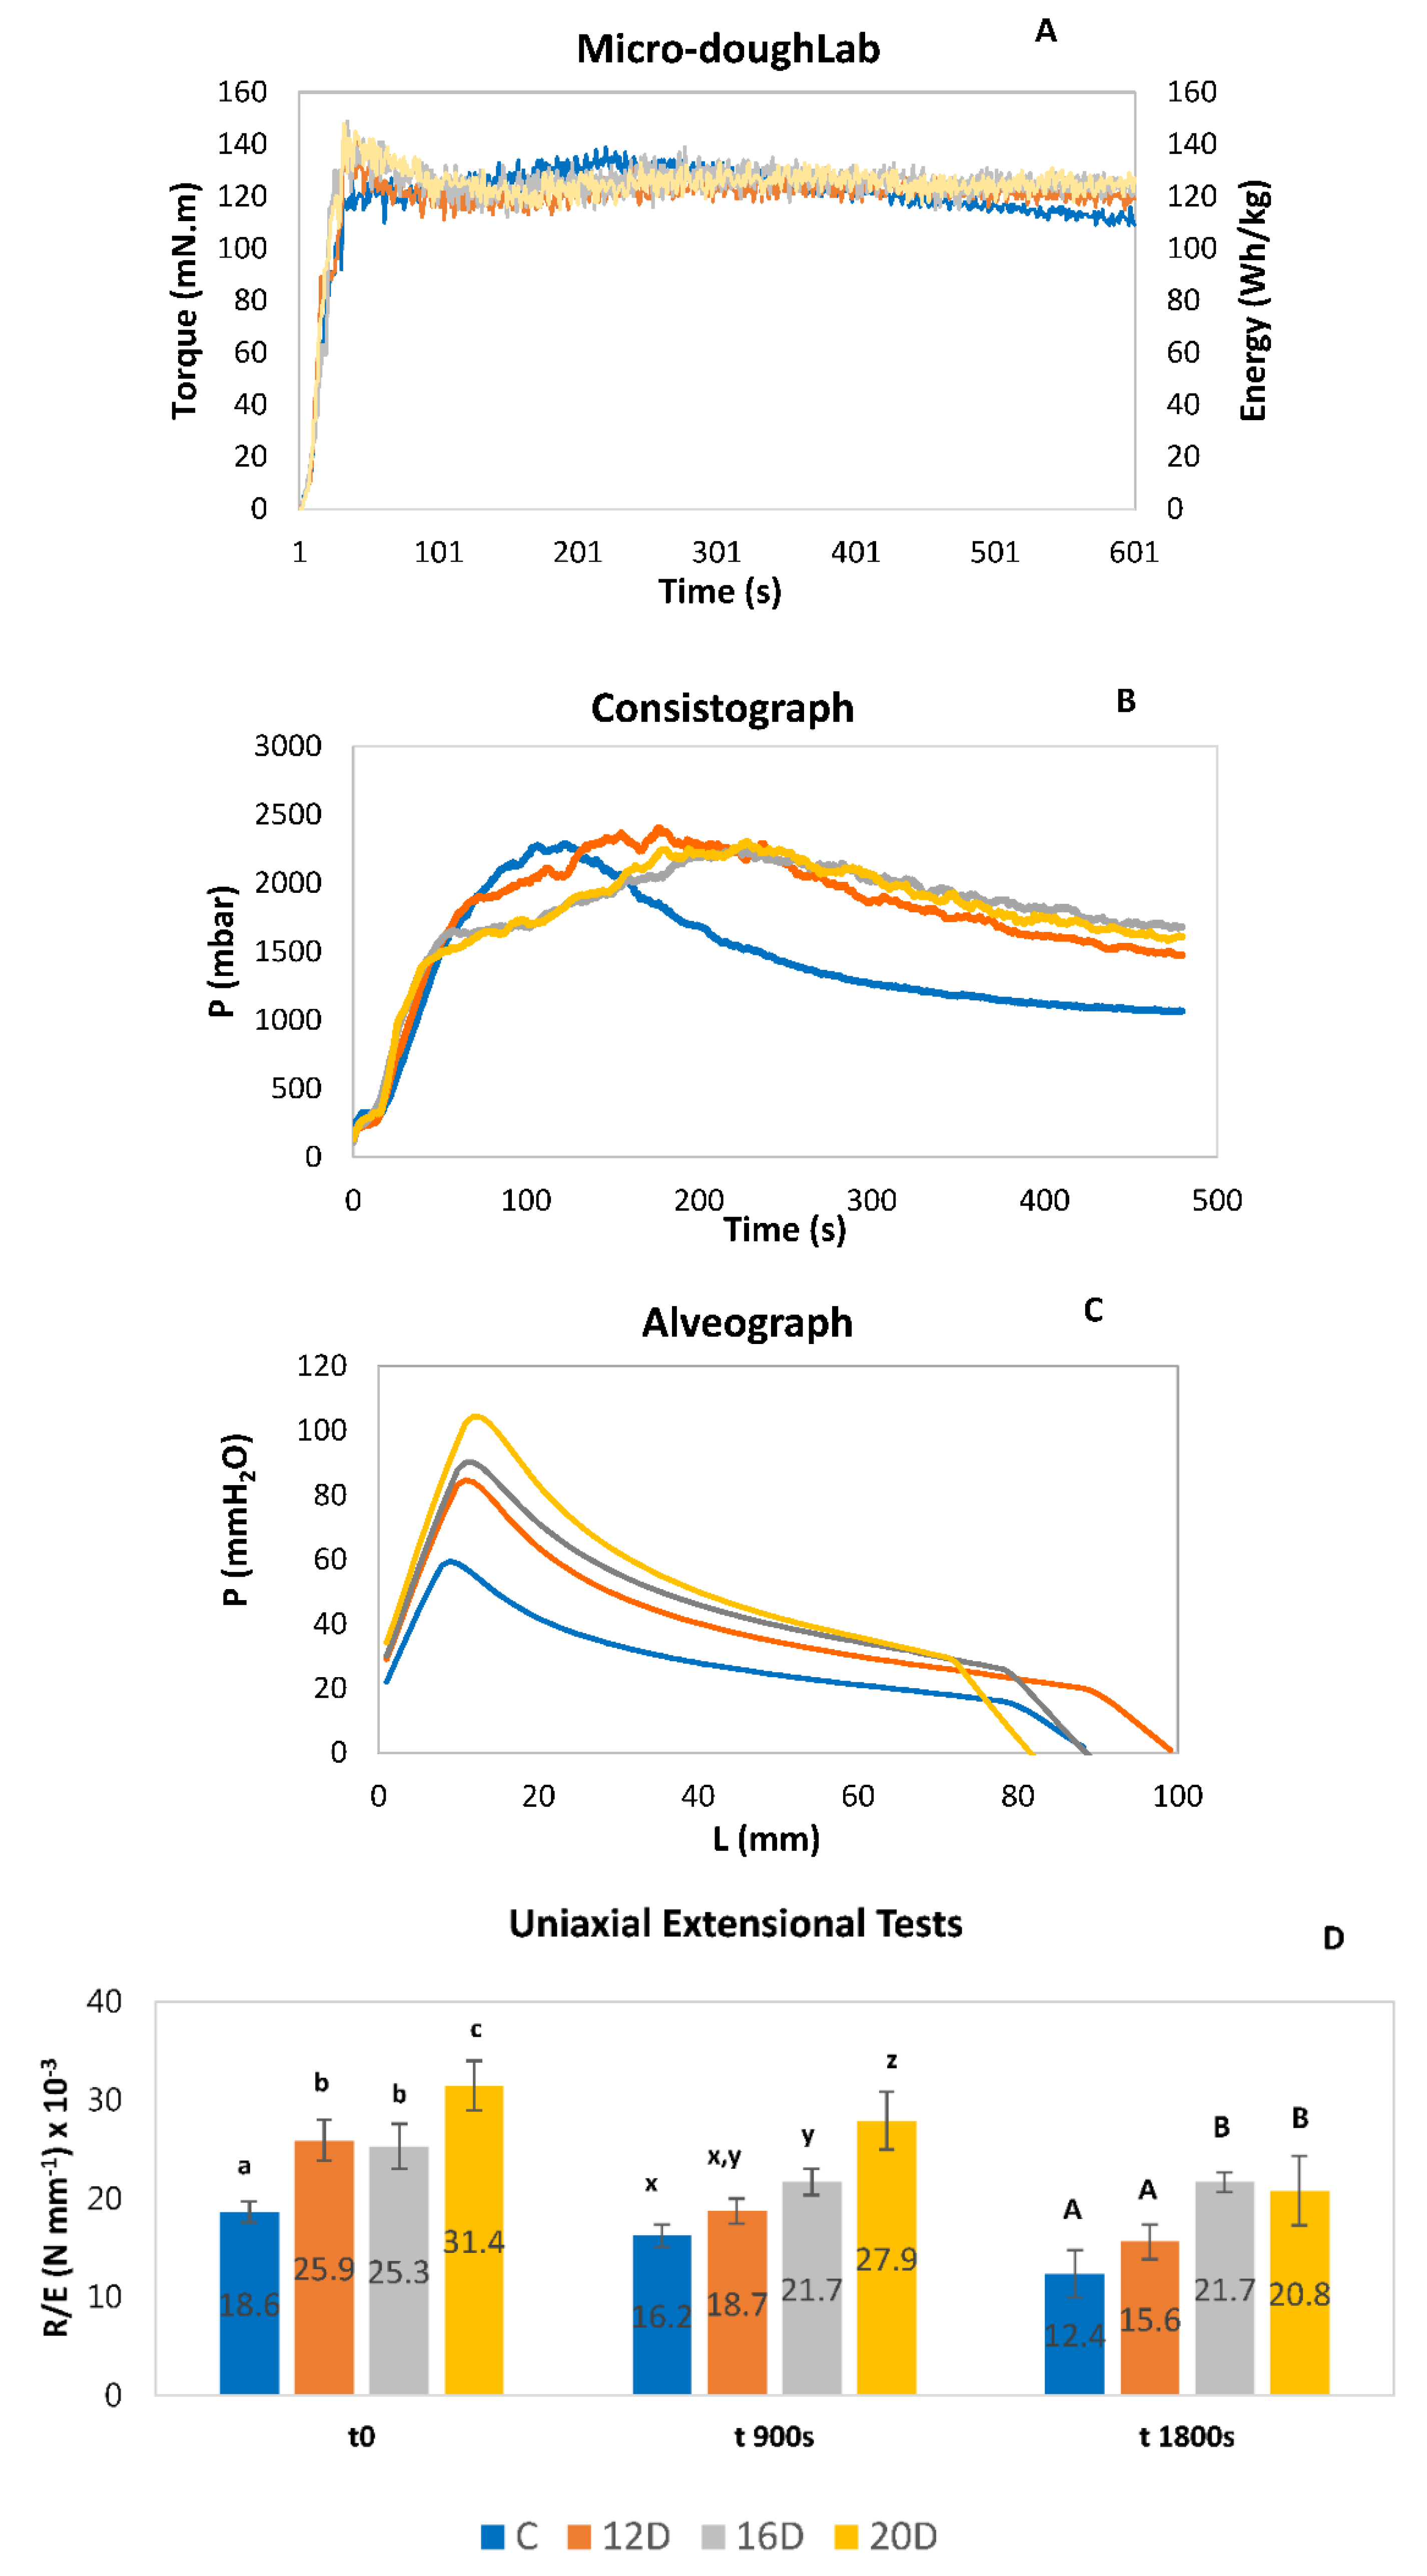
3.1. Empirical Rheology of Dough

Figure 1 and Table 2 show the results obtained using empirical rheology equipment to characterize wheat doughs incorporated with different percentages of whey powder (0%—Control, 12%, 16% and 20% w/w). There was a decrease of the water absorption values obtained using Micro-doughLab and Consistograph when adding whey, decreasing dough development time (DDT), softening (DSO), and peak energy (PE), but increasing dough stability (DS), time to reach Prmax, tolerance to kneading (Tol) and dough consistency after 250 and 450 s.
Gélinas et al. [9] used fermented dairy products for bread and obtained the lowest water absorption value when whey (fermented or not) was used, and higher values of peak time and dough stability were measured in a Farinograph. In another study, the replacement of wheat flour with 5–15% whey powder concentrate also showed higher Farinograph stability and lower water absorption values [13]. Madenci and Bilgiçli [15] and Zhou et al. [17] also found a decrease in water absorption replacing wheat flour by whey protein, explaining that whey incorporation inhibited the hydration of granular starch and wheat proteins [17]. Zhou et al. [17] found that Mixolab dough stability time, an indicator of dough strength, decreased compared to the control for substitution levels of whey protein between 5% and 30%. They suggested that whey inhibits the gluten network structure due to the dilution effect of gluten and to the water competition between gluten, starch and whey. However, in several studies, the water absorption increased in the samples in which whey was added, and a negative impact on mixing properties of bread dough was observed [10,12].
Concerning Alveograph results (Figure 1C and Table 2), one can see that doughs with higher levels of whey powder (16D and 20D) presented the highest tenacity and deformation energy and the lowest extensibility. From the P/L ratio values, it is possible to know about the elastic resistance of the dough to biaxial extension and the potential to produce bread [17,29]. When this value is within the range of 0.40 to 0.80, dough has balanced gluten, being suitable to produce breads, and P/L values lower than 0.4 indicates a very extendable dough. P/L values of the doughs enriched with high levels of whey (16D and 20D) were higher than 1.50, an indicator of a very strong dough, not suitable for bread production.
Regarding the extensibility tests in the Texturometer (Figure 1D and Table 2), an increase in dough resistance to extension (Rmax) with increasing whey powder concentration can be observed, while the extensibility before dough proofing (Emax) remained practically constant. The results for Rmax confirm the findings of previous studies carried out with whey ingredients, in which higher resistance values were obtained in an Extensograph in relation to control dough [12,13,15]. Erdogdu-Arnoczky et al. [10] found that the incorporation of whey solids did not affect the volume of CO2 produced during proofing measured by a Rheofermentometer, but the dough ruptured earlier than the control, indicative of a weakened structure. The results of the present study show that whey addition exerted an effect on all doughs (before and after fermentation), increasing R/E modulus. This value is defined as the change of strain as a function of stress and is important in evaluating the balance between dough elasticity and extensibility. R/E varied from 18.6 × 10⁻³ N·mm−1 for control dough before fermentation (t0), typical of wheat, to 25.3 to 31.4 × 10⁻³ N·mm−1, similar to the values reported by Buresová et al. [28] for corn, millet, quinoa and rice. However, when compared to the wheat control dough, the parameters obtained from the Texture Profile Analysis of the doughs with whey powder addition did not show significant differences (p > 0.05).

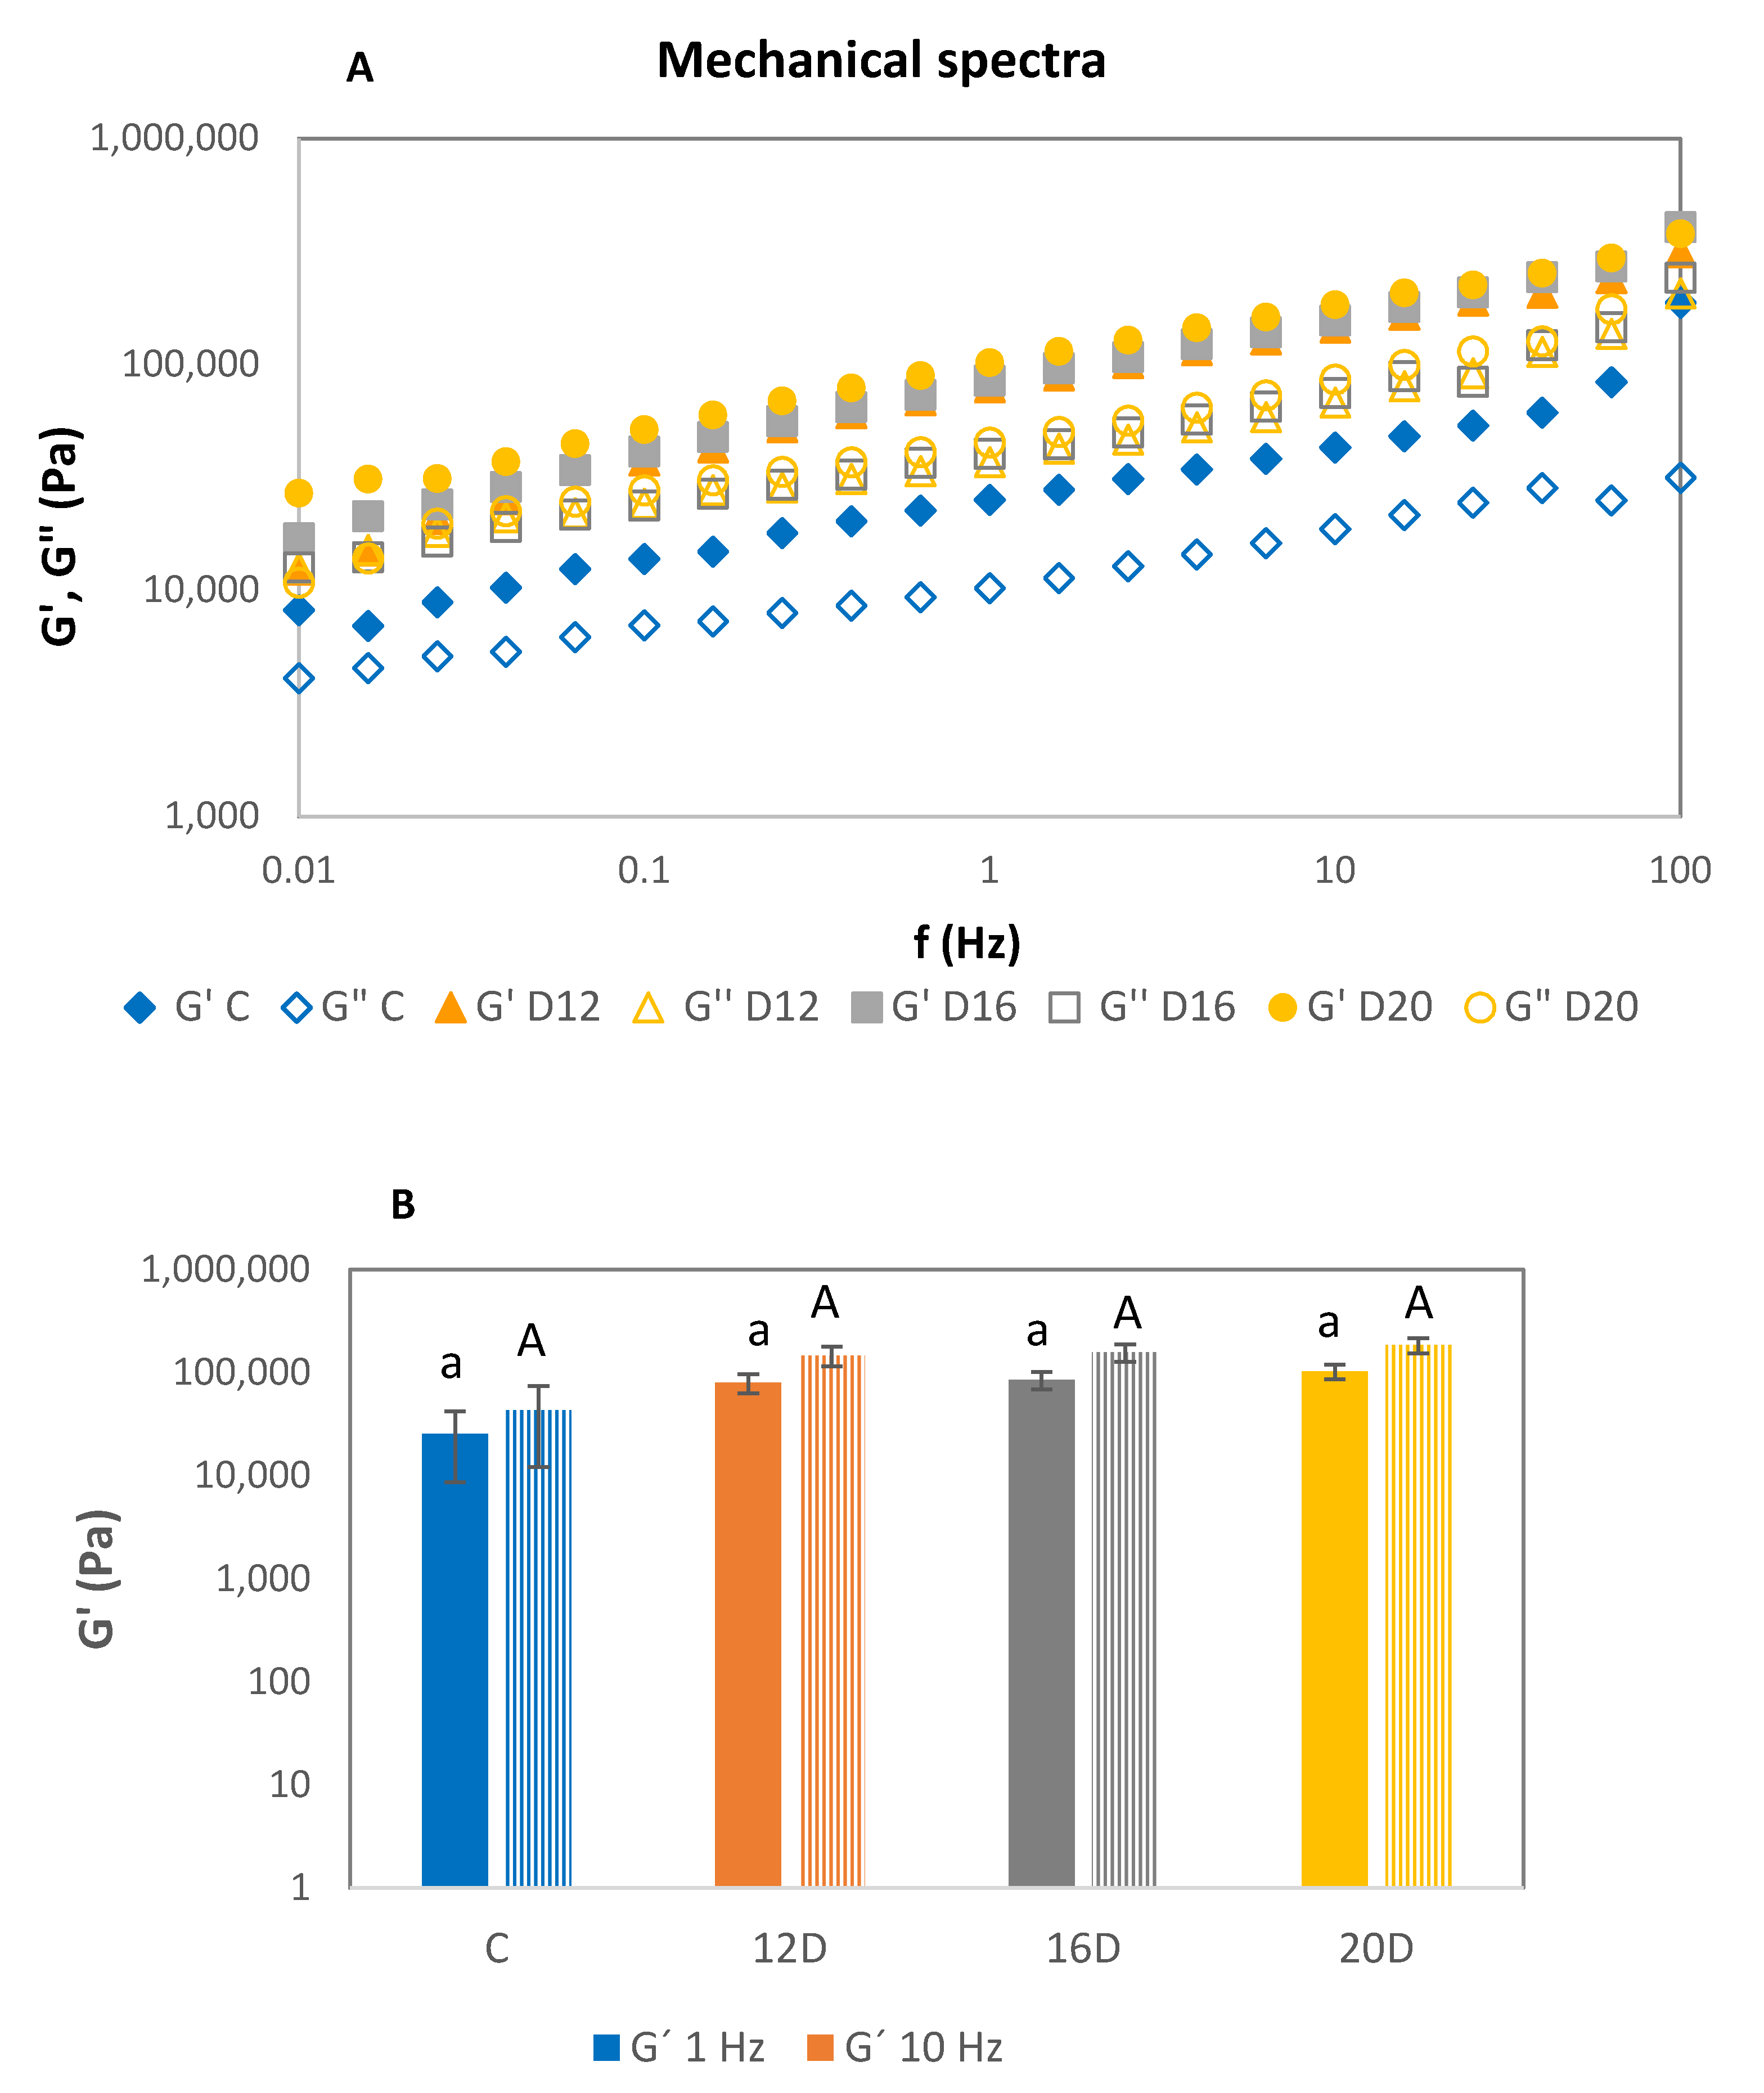
3.2. Fundamental Rheology of Dough

Fermented doughs have a viscoelastic behavior, with G′ higher than G″, and both values dependent on the frequency. A crossover of storage and loss moduli is observed at low frequencies (Figure 2). Based on G′ values at 1 Hz and 10 Hz, the addition of whey exerted a limited effect on the dynamic viscoelastic properties, since there were no significant differences (p > 0.05) between doughs with different composition. These results are consistent with the TPA parameters of the dough.
McCann and Day [30], studying commercial wheat flours with different levels of protein, stated that the high phase volume of starch granules leads to the domination of starch–starch interactions over the protein phase. Therefore, the differences in the viscoelastic behavior of dough proteins are overshadowed by the high volume or starch, and changes in gluten structure are not accurately detected by the small deformation measurements. In addition, for wheat dough with whey protein, Zhou et al. [17] showed that viscoelastic moduli decreased and tanδ increased when increasing the whey protein proportion, indicating a weakened gluten network. This last study is in contradiction with the present findings and this should be due to different concentrations and experimental procedures used. In the present study, it is possible to observe a slight increase in the viscoelastic functions from control to the whey doughs; however, these were not statistically significant (p < 0.05). Therefore, we did not find a negative effect of the whey protein addition on the viscoelastic properties of dough, probably because the levels of whey protein addition were low and differences on G′ and G″ values were overshadowed by a high starch volume. Therefore, SAOS measurements were not accurate to detect differences between wheat doughs incorporated with different levels of the commercial whey powder. Contrary to the study mentioned [17], whey powder with only 12% of protein and not whey protein (over 76% protein) was used, and the difference in protein addition can explain these different results.

3.3. Breadmaking Properties

To study the relation between overall bread quality parameters and raw materials, the firmness and the volume of bread loaves were evaluated. For bread crumb differing in composition, crumb firmness increased with whey addition and there was a negative impact on loaf volume (Table 3).
Erdogdu-Arnoczky et al. [10] reported that crumb softness and loaf volume increased with heat-treated acid whey protein addition. However, whey is known to have a negative effect in wheat bread loaves volume [12,13,16,31]. Zhou et al. [17] obtained a lower bread volume, increasing whey protein from 0% to 10%, but when whey content was higher than 20 %, bread volume was even higher than that of wheat bread control. They concluded that the level of the protein source plays an important role. For high whey levels, higher than gluten content, the heat induced whey protein gel became the dominant phase of the dough structure and gave strength to the expanding cells, resulting in higher loave volume. Wronkowska et al. [16] suggested the interaction between soluble whey proteins and the gluten proteins, weakening the elasticity of the gluten matrix structure. Moreover, a more rigid structure is obtained due to calcium, potassium and lactose, present in whey powder in high concentrations. According to the results in Table 3, it is possible to observe a trend on stiffening of the breads with the incorporation of whey, comparing to the control. However, it was not possible to establish a direct relationship between the volume reduction and the whey incorporation content.
There have been contradictory reports about the effect of whey on dough and bread quality, resulting from different interactions with wheat flour components. Those differences result from the different nature of the whey products varying from liquid or dried whole whey or whey protein concentrates or permeates, which are very different in composition. Furthermore, the baking method also affects the functionality of whey [15]. Therefore, it is crucial to study the functionality of the available whey products and their impact on the required applications in the bakery industry. Impact of different whey products on the technological performance of wheat dough is dependent on the whey level and composition.

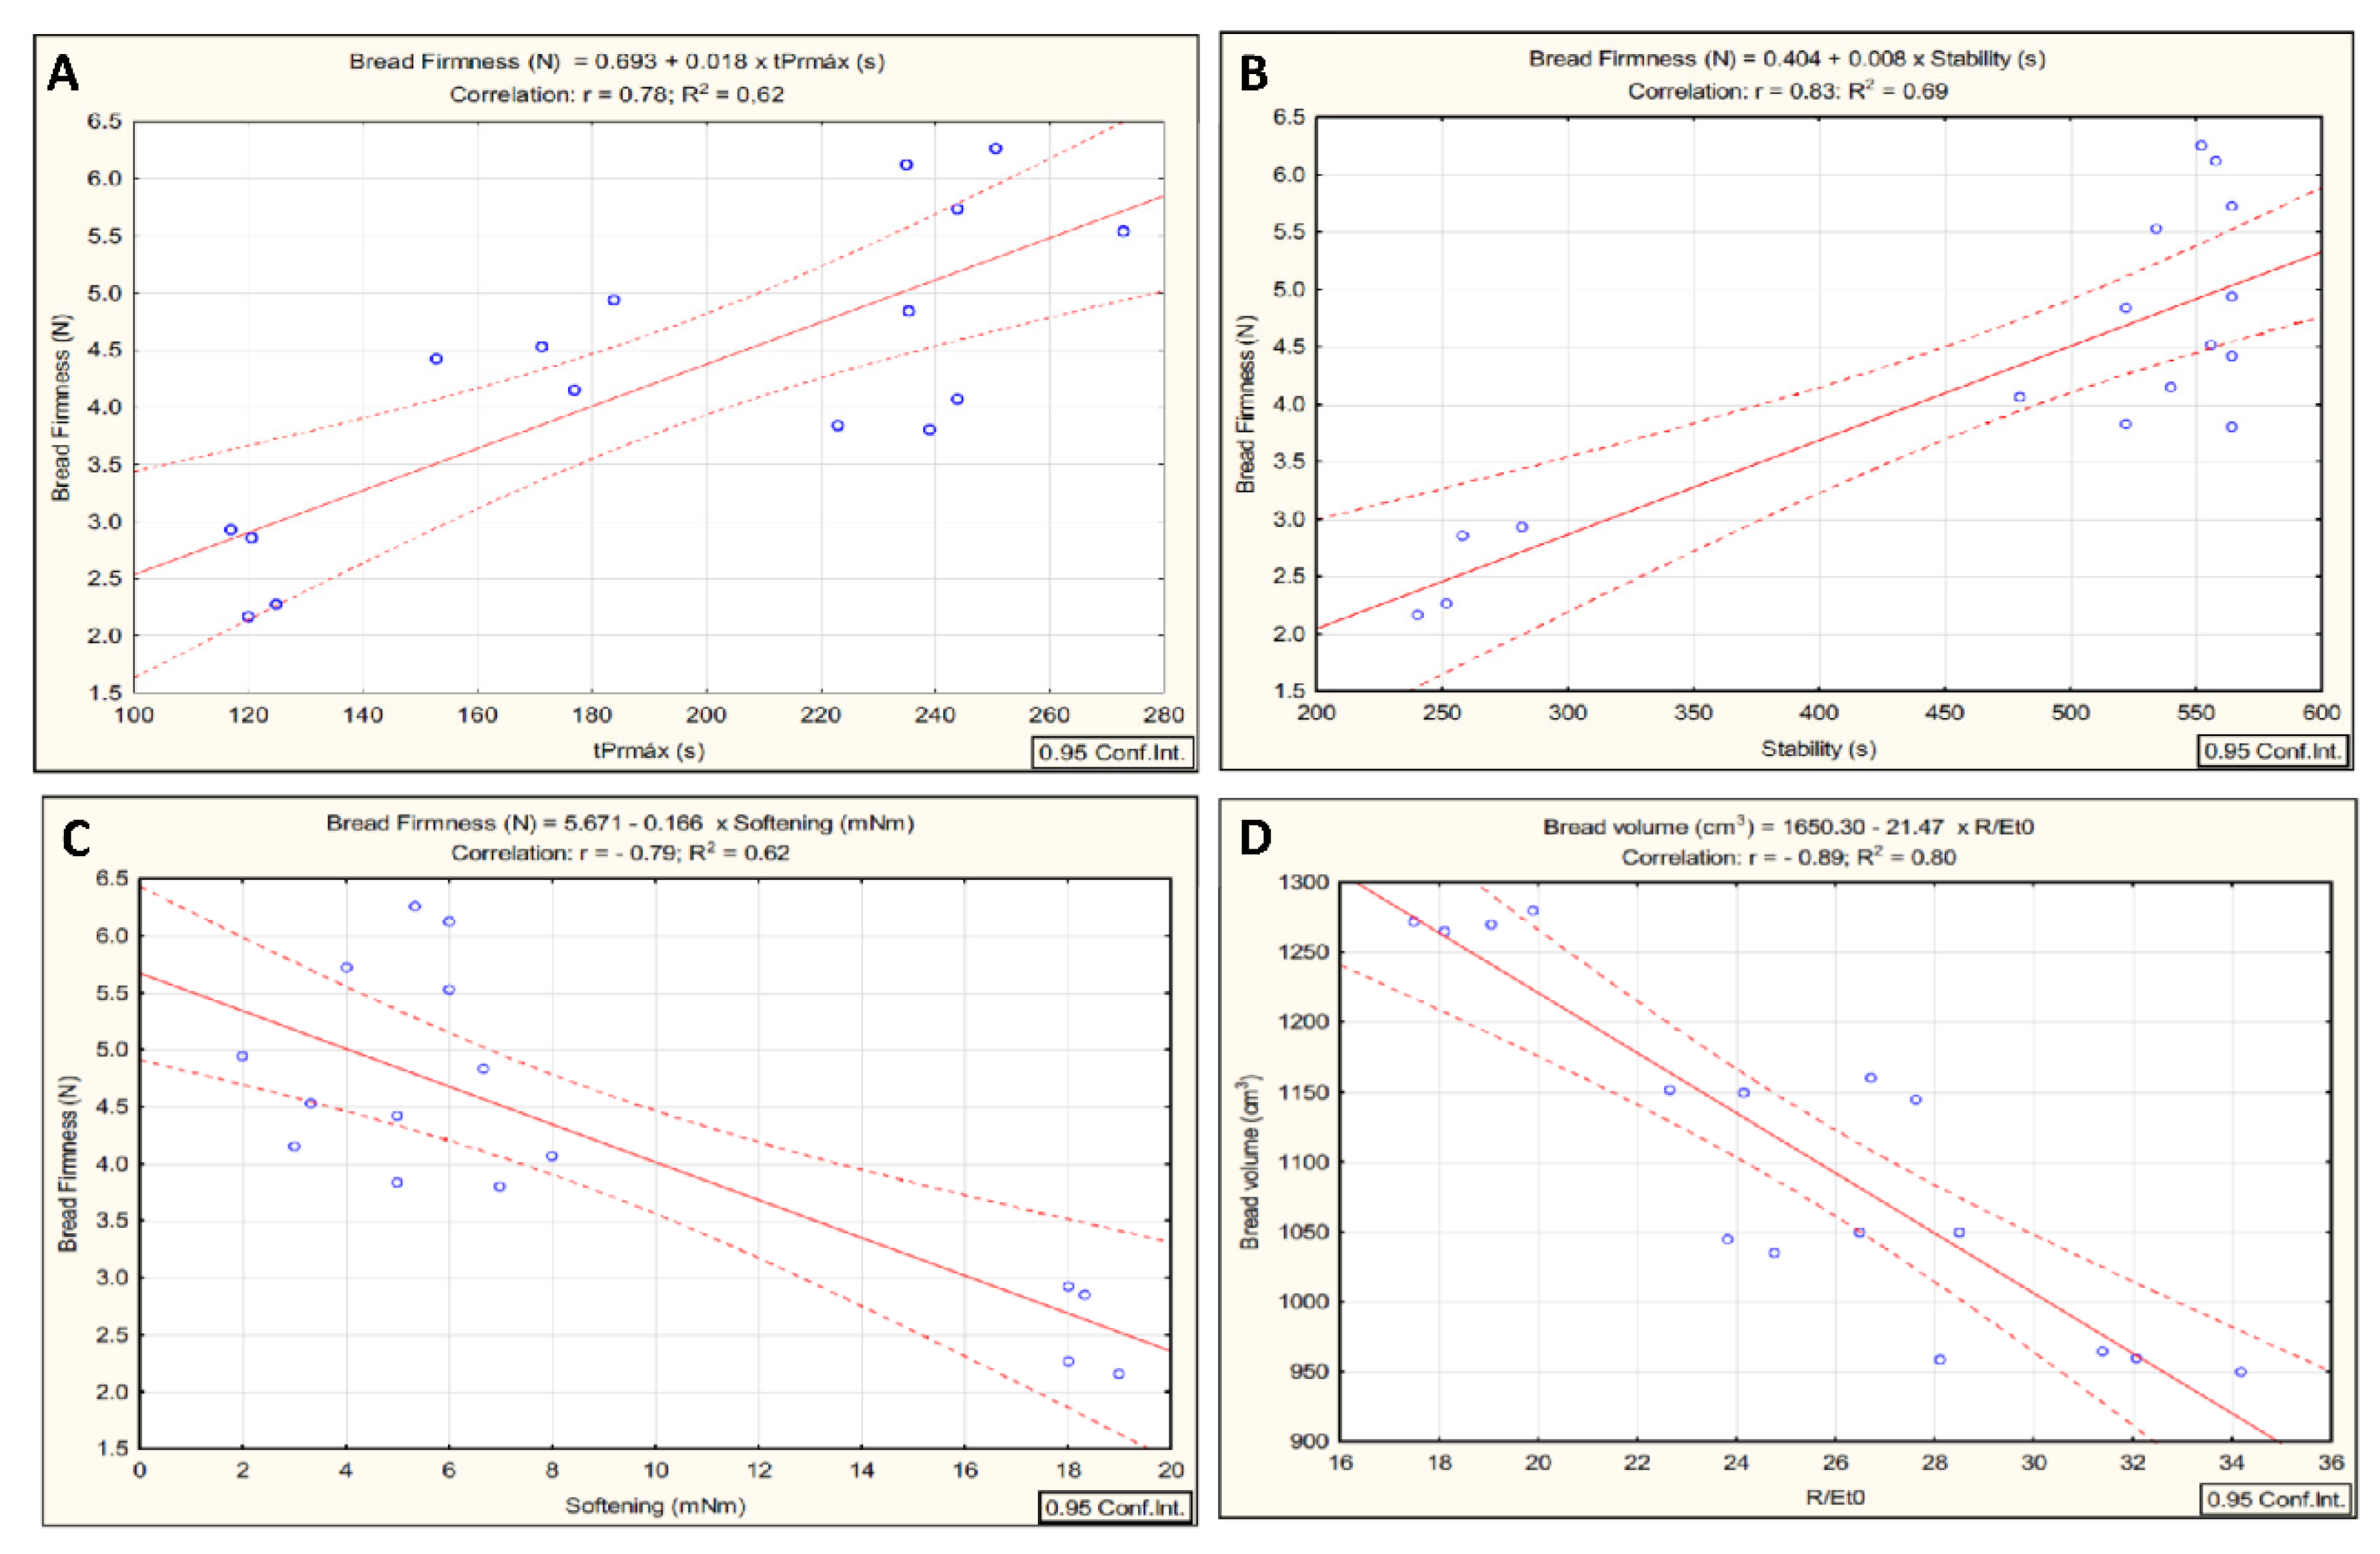
3.4. Correlations between Parameters Obtained from Empirical and Fundamental Rheology

Using correlation analysis, the relationships between empirical and fundamental rheology properties of dough, with different amounts of whey powder incorporation were obtained. Only significant dependences (r2 > 0.60) are presented in Table 4 and Figure 3.
Viscoelastic moduli of the doughs after proofing, obtained from fundamental SAOS measurements, are not correlated with the empirical rheology parameters and with breadmaking properties (firmness and volume). Other researchers studying wheat flour doughs suggested that the values for the dynamic moduli are not the most important factor determining bread making performance. There was no direct relationship between the dynamic moduli or tan δ and loaf volume [32].
Significant interdependences (r2 > 0.60) within empirical rheology parameters of wheat dough samples were found (Table 4). Micro-doughLab parameters obtained from the mixture curves and Consistograph parameters are significantly correlated, and this relation was particularly relevant for dough stability (DS) vs. dough consistency after 250 and 450 s (D250 and D450). Some Micro-doughLab parameters, dough stability (DS) and softening (DSO), showed a significant positive correlation with dough tenacity (P) and energy used for the biaxial deformation (W) during the Alveograph test. Nevertheless, Micro-doughLab parameters are not correlated with texture parameters calculated from TPA and extensibility tests. As expected, considering that Micro-doughLab and Consistograph are both mixing devices, Consistograph parameters (tPrmax, D250 and D450) are also positively correlated with Alveograph P and W values. A positive relationship was also found between some Consistograph (tPrmax and D250) and Alveograph (P) parameters with the resistance to extension before dough fermentation (Rmax).
It was possible to establish correlations between empirical rheology dough properties and breadmaking performance. In Figure 3, one can see the bivariate scatterplots of significant (r2 > 0.60) dependences—bread firmness vs. time to reach the maximum pressure (tPrmax), bread firmness vs. dough stability, bread firmness vs. dough softening, and bread volume vs. R/E modulus.
Matos and Rosell [31] found high correlation coefficients between dough Mixolab rheological parameters, namely dough consistency during mixing, and crumb hardness of rice-based gluten free bread. High extensional properties are a requisite for high wheat bread volumes, resulting in high crumb porosity, which causes a soft crumb texture [33]. In gluten free doughs, loaf volume was found to be in positive correlation with dough resistance to extension and dough extensibility under uniaxial deformation [28], in close agreement with the present results (Figure 3D).

4. Conclusions

In order to understand dough behavior during all breadmaking stages, different empirical rheological devices are used to imitate real processing conditions, which is very time consuming and requires a large amount of sample. The relationships between the parameters obtained by empirical devices and dough rheology and bread attributes can be useful to predict the behavior of the dough and provide important information for the bread making industry. Based on the findings of the present study, Micro-doughLab mixing parameters have a significant correlation with Consistograph and Alveograph data, and Consistograph with Alveograph values. The parameters obtained from Consistograph and Alveograph are significantly correlated with R/E extracted from extensibility tests using the Texturometer. Consistograph or Micro-doughLab devices can be used to estimate bread firmness and extensional tests of the dough may predict the volume of wheat loaves. Despite a negative impact on the empirical rheology parameters of the dough and poorer baking results, the use of this by-product should be considered for nutritional and sustainability reasons.

Author Contributions

C.M. was responsible for data acquisition, analysis and interpretation and for drafting the article. M.C.N. contributed to the data acquisition and interpretation and redaction of the manuscript. The study was designed and planned by I.S. and A.R., who revised the final version of the manuscript. All authors have read and agreed to the published version of the manuscript.

Funding

National funds from the Portuguese Foundation for Science and Technology (FCT) through the research unit UID/AGR/04129/2013-LEAF; PhD grant (Christine Macedo) from the University of Pará-Brazil.

Acknowledgments

This work was supported by Queijo Saloio S.A. Dairy Industry.

Conflicts of Interest

None of the authors have potential financial or other conflicts of interest to disclose.

References

  1. Prazeres, A.; Carvalho, F.; Rivas, J. Cheese whey management: A review. J. Environ. Manag. 2012, 110, 48–68. [Google Scholar] [CrossRef] [PubMed]
  2. Lappa, I.K.; Papadaki, A.; Kachrimanidou, V.; Terpou, A.; Koulougliotis, D.; Eriotou, E.; Kopsahelis, N. Cheese whey processing: Integrated biorefinery concepts and emerging food applications. Foods 2019, 8, 347. [Google Scholar] [CrossRef] [PubMed] [Green Version]
  3. Madureira, A.; Pereira, C.; Gomes, A.; Pintado, M.; Malcata, F. Bovine whey proteins – overview on their main biological properties. Food Res. Int. 2007, 40, 1197–1210. [Google Scholar] [CrossRef]
  4. Korhonen, H. Milk-derived bioactive peptides: From science to applications. J. Funct. Foods 2009, 1, 177–187. [Google Scholar] [CrossRef]
  5. Kinsella, J.E.; Whitehead, D.M. Proteins in whey: Chemical, physical, and functional properties. Adv. Food Nutr. Res. 1989, 33, 343–438. [Google Scholar]
  6. Fang, T.; Guo, M. Physicochemical, texture properties, and microstructure of yogurt using polymerized whey protein directly prepared from cheese whey as a thickening agent. J. Dairy Sci. 2019, 102, 7884–7894. [Google Scholar] [CrossRef]
  7. Hadiyanto, H.; Ariyanti, D.; Aini, A.P.; Pinundi, D.S. Optimization of ethanol production from whey through fed-batch fermentation using Kluyveromyces marxianus. Energy Procedia 2014, 47, 108–112. [Google Scholar] [CrossRef] [Green Version]
  8. Murari, C.S.; Machado, W.R.C.; Schuina, G.L.; Del Bianchi, V.L. Optimization of bioethanol production from cheese whey using Kluyveromyces marxianus URM 7404. Biocatal. Agric. Biotechnol. 2019, 20, 101182. [Google Scholar] [CrossRef]
  9. Gélinas, P.; Audet, J.; Lachange, O.; Vachon, M. Fermented dairy ingredients for bread: Effects on dough rheology and bread characteristics. Cereal Chem. 1995, 72, 151–154. [Google Scholar]
  10. Erdogdu-Arnoczky, N.; Czuchajowska, Z.; Pomeranz, Y. Functionality of whey and casein in fermentation and breadbaking by fixed and optimized procedures. Cereal Chem. 1996, 73, 309–316. [Google Scholar]
  11. Kenny, S.; Wehrle, K.; Arendt, C.S.E.K. Incorporation of dairy ingredients into wheat bread: Effects on dough rheology and bread quality. Eur. Food Res. Technol. 2000, 210, 391–396. [Google Scholar] [CrossRef]
  12. Bilgin, B.; Daglioglu, O.; Konyali, M. Functionality of bread made with pasteurized whey and/or buttermilk. Ital. J. Sci. 2006, 3, 277–286. [Google Scholar]
  13. Indrani, D.; Prabhasankar, P.; Rajiv, J.; Rao, G.V. Influence of whey protein concentrate on the rheological characteristics of dough, microstructure and quality of unleavened flat bread (parotta). Food Res. Int. 2007, 40, 1254–1260. [Google Scholar] [CrossRef]
  14. Asghar, A.; Anjum, F.M.; Allen, J.C.; Daubert, C.R.; Rasool, G. Effect of modified whey protein concentrates on empirical and fundamental dynamic mechanical properties of frozen dough. Food Hydrocoll. 2009, 23, 1687–1692. [Google Scholar] [CrossRef]
  15. Madenci, A.B.; Bilgiçli, N. Effect of whey protein concentrate and buttermilk powders on rheological properties of dough and bread quality. J. Food Qual. 2014, 37, 117–124. [Google Scholar] [CrossRef]
  16. Wronkowska, M.; Jadacka, M.; Soral-Smietana, M.; Zander, L.; Dajnowiec, F.; Banaszczyk, P.; Jelinski, T.; Szmatowicz, B. Acid whey concentrated by ultrafiltration a tool for modeling bread properties. LWT Food Sci. Technol. 2015, 61, 172–176. [Google Scholar] [CrossRef]
  17. Zhou, J.; Liu, J.; Tang, X. Effects of whey and soy protein addition on bread rheological property of wheat flour. J. Texture Stud. 2018, 49, 38–46. [Google Scholar] [CrossRef] [PubMed]
  18. van Riemsdijk, L.E.; van der Goot, A.J.; Hamer, R.J.; Boom, R.M. Preparation of gluten-free bread using meso-structured whey protein particle system. J. Cereal Sci. 2011, 53, 355–361. [Google Scholar] [CrossRef]
  19. Kittisuban, P.; Ritthiruangdej, P.; Suphantharika, M. Optimization of hydroxypropylmethylcellulose, yeast b-glucan, and whey protein levels based on physical properties of gluten-free rice bread using response surface methodology. LWT Food Sci. Technol. 2014, 57, 738–748. [Google Scholar] [CrossRef]
  20. Sahagún, M.; Gómez, M. Assessing influence of protein source on characteristics of gluten-free breads optimising their hydration level. Food Bioprocess Technol. 2018, 11, 1686–1694. [Google Scholar] [CrossRef]
  21. Pico, J.; Reguilón, M.P.; Bernal, J.; Gómez, M. Effect of rice, pea, egg white and whey proteins on crust quality of rice flour-corn starch based gluten-free breads. J. Cereal Sci. 2019, 86, 92–101. [Google Scholar] [CrossRef]
  22. Tomić, J.; Torbica, A.; Belović, M. Effect of non-gluten proteins and transglutaminase on dough rheological properties and quality of bread based on millet (Panicum miliaceum) flour. LWT Food Sci. Technol. 2020, 118, 108852. [Google Scholar] [CrossRef]
  23. Graça, C.; Fradinho, P.; Sousa, I.; Raymundo, A. Impact of Clorella vulgaris addition on rheology wheat dough properties. LWT Food Sci. Technol. 2018, 89, 466–474. [Google Scholar] [CrossRef]
  24. Nunes, M.C.; Graça, C.; Vlaisavljevic, S.; Tenreiro, A.; Sousa, I.; Raymundo, A. Microalgae cell disruption: Effect on the bioactivity and rheology of wheat bread. Algal Res. 2020, 45, 101749. [Google Scholar] [CrossRef]
  25. Dobraszczyk, B.J.; Morgenstern, M.P. Rheology and the breadmaking process. J. Cereal Sci. 2003, 38, 229–245. [Google Scholar] [CrossRef]
  26. Song, Y.; Zeng, Q. Dynamic rheological properties of wheat flour dough and proteins. Trends Food Sci. Technol. 2007, 18, 132–138. [Google Scholar] [CrossRef]
  27. Singh, S.; Singh, N. Relationship of polymeric proteins and empirical dough rheology with dynamic rheology of dough and gluten from different wheat varieties. Food Hydrocoll. 2013, 33, 342–348. [Google Scholar] [CrossRef]
  28. Buresová, I.; Krácmar, S.; Dvoráková, P.; Streda, T. The relationship between rheological characteristics of gluten-free dough and the quality of biologically leavened bread. J. Cereal Sci. 2014, 60, 271–275. [Google Scholar] [CrossRef]
  29. Al-Attabi, Z.H.; Merghani, T.M.; Ali, A.; Rahman, M.S. Effect of barley flour addition on the physico-chemical properties of dough and structure of bread. J. Cereal Sci. 2017, 75, 61–68. [Google Scholar] [CrossRef]
  30. McCann, T.H.; Day, L. Effect of sodium chloride on gluten network formation, dough microstructure and rheology in relation to breadmaking. J. Cereal Sci. 2013, 57, 444–452. [Google Scholar] [CrossRef]
  31. Matos, M.E.; Rosell, C.M. Quality indicators of rice-based gluten-free bread-like products: Relationships between dough rheology and quality characteristics. Food Bioprocess Technol. 2013, 6, 2331–2341. [Google Scholar] [CrossRef] [Green Version]
  32. Janssen, A.M.; van Vliet, T.; Vereijken, J.M. Fundamental and empirical rheological behaviour of wheat flour doughs and comparison with bread making performance. J. Cereal Sci. 1996, 23, 43–54. [Google Scholar] [CrossRef]
  33. Kieffer, R.; Wieser, H.; Henderson, M.H.; Graveland, A. Correlations of the breadmaking performance of wheat flour with rheological measurements on a micro-scale. J. Cereal Sci. 1998, 27, 53–60. [Google Scholar] [CrossRef]
Figure 1. Curves obtained with Micro-doughLab (A), Consistograph (B) and Alveograph (C) and R/E values obtained from the extensional tests in the Texturometer (Kieffer dough rig) along fermentation (t0, t 900 s and t 1800 s) (D). C: control dough without whey; 12D: dough with 12% whey; 16D: dough with 16% whey; 20D: dough with 20% whey. Error bars indicate the standard deviations from the repetitions. Different letters (a, b, c or x, y, z or A, B) correspond to significant differences (one-way ANOVA, p < 0.05).
Fluids 05 00050 g001
Figure 2. Mechanical spectra (A) and values of G′ at 1Hz obtained after dough fermentation (B). G′ (storage modulus—filled symbol), G″ (loss modulus—open symbol). C: control dough without whey; 12D: dough with 12% whey; 16D: dough with 16% whey; 20D: dough with 20% whey. Error bars indicate the standard deviations from the repetitions. Different letters (a, A) in the same graph correspond to significant differences (one-way ANOVA, p < 0.05).
Fluids 05 00050 g002
Figure 3. Correlations between breadmaking properties and dough rheology parameters (p < 0.05). (A): Bread firmness (Texturometer) vs. tPrmax (Consistograph); (B): Bread firmness (Texturometer) vs. Dough stability (Micro-doughLab); (C): Bread firmness (Texturometer) vs. Dough softening (Micro-doughLab); (D): Bread volume vs. R/E (t0) (extensional tests in the Texturometer).
Fluids 05 00050 g003
Table 1. Bread dough samples formulation and respective codes.
Ingredients (g/100 g)Doughs
Control (C)12% Whey (12D)16% Whey (16D)20% Whey (20D)
Wheat flour100.088.084.080.0
Whey powder0.012.016.020.0
Water Absorption (14% moisture basis)52.239.438.236.4
Table 2. Rheology parameters * obtained from Micro-doughLab mixture curves, Consistograph, Alveograph and Texturometer (Texture Profile Analysis and Extensibility tests). C: control dough without whey; 12D: dough with 12% whey; 16D: dough with 16% whey; 20D: dough with 20% whey. For each equipment, different letters (a, b, c) in the same column correspond to significant differences (one-way ANOVA, p < 0.05).
Micro-dougLabWA
(%)
P
(mN.m)
DDT
(s)
DS
(s)
DSO
(mN.m)
PE
(Wh/kg)
C52.2130 ± 1.5234 ± 0.3 a258 ± 0.3 a18.3 ± 0.6 a15.0 ± 1.4 a
12D39.4128 ± 2.5222 ± 2.3 a558 ± 0.2 b3.3 ± 1.5 b15.5 ± 11.0 a
16D38.2133 ± 0.654 ± 0.1 b552 ± 0.3 b5.3 ± 1.1 b2.9 ± 0.3 b
20D36.4133 ± 2.354 ± 0.1 b522 ± 0.7 b6.7± 1.5 b3.0 ± 0.1 b
ConsistographWA
(%)
Prmax
(mbar)
tPrmax
(s)
Tol
(s)
D250
(mbar)
D450
(mbar)
C50.42204 ± 75121 ± 4 a129 ± 1 a1403 ± 69 a1262 ± 232 a
12D39.62298 ± 2171 ± 16 b246 ± 20 b2132 ± 87 b1538 ± 61 a,b
16D38.02203 ± 51251 ± 20 c307 ± 73 b2194 ± 46 b1755 ± 106 b
20D36.22235 ± 64235 ± 11 c261 ± 19 b2223 ± 72 b1686 ± 94 b
AlveographWA
(%)
P
(mm H2O)
L
(mm)
P/LW
(10-4 J)
-
C50.466.0 ± 1.2 a78.4 ± 1.6 a,b0.8 ± 0.1 a158.7 ± 9.5 a-
12D39.692.7 ± 3.0 b85.5 ± 1.1 a1.1 ± 0.1 a239.2 ± 12.5 b-
16D38.0109.7 ± 13.771.6 ± 2.6 b,c1.5 ± 0.4 b258.3 ± 10.3 b-
20D36.2109.8 ± 6.460.8 ± 2.5 c1.8 ± 0.5 b232.8 ± 13.7 b-
TexturometerWA
(%)
Rmax t0
(N)
Emax t0
(mm)
Firmness
(N)
Adhesiveness
(N.s)
Cohesiveness
C52.20.26 ± 0.029 a13.93 ± 0.83 a0.72 ± 0.30 a6.89 ± 0.93 a0.78 ± 0.16 a
12D39.40.36 ± 0.054 b13.83 ± 1.12 a1.01 ± 0.13 a8.63 ± 0.40 a0.87 ± 0.10 a
16D38.20.41 ± 0.029 b,c16.38 ± 0.37 b0.83 ± 0.09 a8.63 ± 0.73 a0.81 ± 0.04 a
20D36.40.48 ± 0.03715.16 ± 0.57 a,b0.68 ± 0.07 a5.59 ± 2.56 a0.60 ± 0.14 a
* WA—water absorption. Micro-doughLab parameters: P–peak resistance; DDT–dough development time; DS—dough stability; DSO—dough softening; PE—peak energy. Consistograph parameters: Prmax—maximum pressure; tPrmax—time to reach Prmax; Tol—tolerance to kneading; D250 e D450—pressure after 250 and 450 s. Alveograph parameters: P—tenacity; L—extensibility; P/L—ratio between tenacity and extensibility; W—work or deformation energy. Extensibility tests: Rmax t0—resistance to extension before fermentation; Emax t0—extensibility before fermentation.
Table 3. Values of crumb firmness and volume obtained for breads. C: control bread without whey; 12D: bread with 12% whey; 16D: bread with 16% whey; 20D: bread with 20% whey. Different letters (a, b, c, d) in the same column correspond to significant differences (one-way ANOVA, p < 0.05).
SampleFirmness (N)Volume (cm3)
t0t48 h
C2.55 ± 0.39 a4.68 ± 1.19 a1272 ± 8 a
12D4.51 ± 0.33 b7.66 ± 1.93 b1045 ± 9 b
16D5.91 ± 0.34 c6.89 ± 1.03 a,b1152 ± 8 c
20D4.14 ± 0.48 b6.35 ± 0.78 a,b958 ± 8 d
Table 4. Correlations between dough rheology parameters obtained from empirical tests (p < 0.05).
InstrumentMicro-doughLabConsistographAlveographTexturometer (Extensibility)
Micro-doughLab-DDT = 455 − 1.599 tPrmax (r2 = 0.71)
DS = 127 + 1.461 Tol (r2 = 0.69)
DS = −230 + 0.353 D250 (r2 = 0.87)
DS = −244 + 0.459 D450 (r2 = 0.87)
DSO = 24 − 0.067 Tol (r2 = 0.66)
DSO = 40 − 0.016 D250 (r2 = 0.61)
PE = 31 − 0.110 tPrmax (r2 = 0.65)
DS = −42 + 5.418 P (r2 = 0.71)
DS = −63 + 2.377 W (r2 = 0.76)
DSO = 31 − 0.237 P (r2 = 0.61)
DSO = 33 − 0.108 W (r2 = 0.70)
Not significant (r2 < 0.60)
Consistograph--tPrmax = −34 + 2.405 P (r2 = 0.79)
D250 = 523 + 15.424 P (r2 = 0.77)
D250 = 567 + 6.320 W (r2 = 0.72)
D450 = 726 + 8.786 P (r2 = 0.65)
tPrmax = 8 + 494 Rmaxt0 (r2 = 0.65)
D250 = 804 + 3137 Rmaxt0 (r2 = 0.62)
D250 = 576 + 56 Rmaxt0 (r2 = 0.63)
Alveograph---P = 26 + 184 Rmaxt0 (r2 = 0.65)
Texturometer (Extensibility)----

