Article

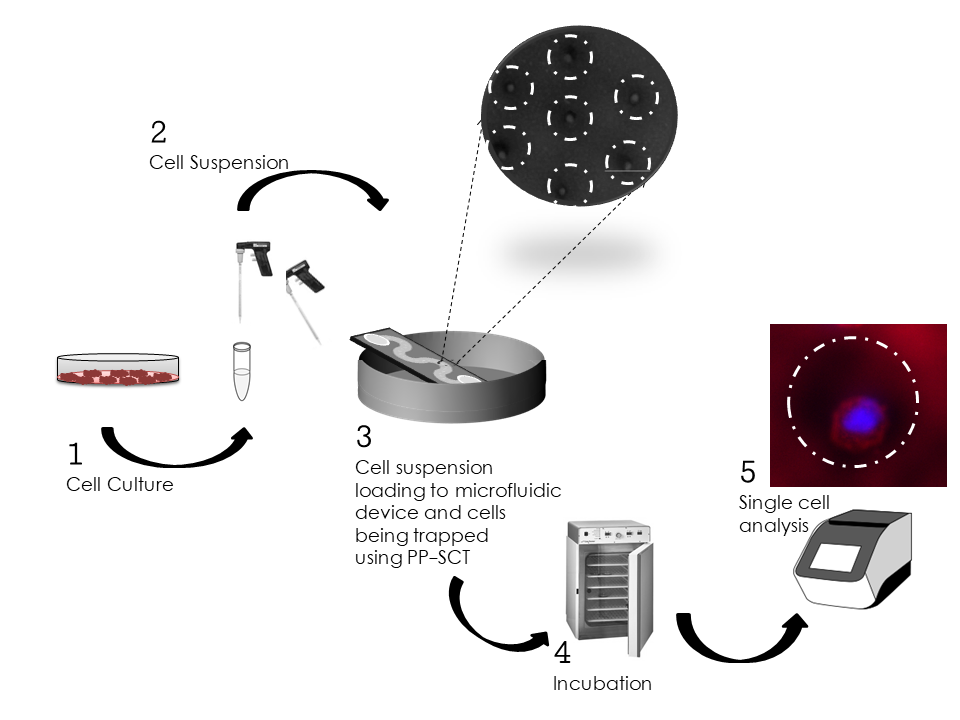
Pipette Petri Dish Single-Cell Trapping (PP-SCT) in Microfluidic Platforms: A Passive Hydrodynamic Technique

by
Vigneswaran Narayanamurthy
1,2,*,
Tze Pin Lee
3,
Al’aina Yuhainis Firus Khan
4,
Fahmi Samsuri
1,
Khairudin Mohamed
3,
Hairul Aini Hamzah
2 and
Madia Baizura Baharom
2
1
Faculty of Electrical and Electronics Engineering, University Malaysia Pahang Pekan, Pekan, Pahang 26600, Malaysia
2
Kulliyyah of Medicine, International Islamic University Malaysia, Kuantan, Pahang 25200, Malaysia
3
Nanofabrication and Functional Materials Research Group, School of Mechanical Engineering, University Science Malaysia, Engineering Campus, Nibong Tebal, Penang 14300, Malaysia
4
Kulliyyah of Allied Health Science, International Islamic University Malaysia, Kuantan, Pahang 25200, Malaysia
*
Author to whom correspondence should be addressed.
Fluids 2018, 3(3), 51; https://doi.org/10.3390/fluids3030051
Submission received: 20 June 2018 / Revised: 7 July 2018 / Accepted: 22 July 2018 / Published: 24 July 2018
(This article belongs to the Special Issue Experimental and Numerical Studies in Biomedical Engineering)

Abstract

:
Microfluidics-based biochips play a vital role in single-cell research applications. Handling and positioning of single cells at the microscale level are an essential need for various applications, including genomics, proteomics, secretomics, and lysis-analysis. In this article, the pipette Petri dish single-cell trapping (PP-SCT) technique is demonstrated. PP-SCT is a simple and cost-effective technique with ease of implementation for single cell analysis applications. In this paper a wide operation at different fluid flow rates of the novel PP-SCT technique is demonstrated. The effects of the microfluidic channel shape (straight, branched, and serpent) on the efficiency of single-cell trapping are studied. This article exhibited passive microfluidic-based biochips capable of vertical cell trapping with the hexagonally-positioned array of microwells. Microwells were 35 μm in diameter, a size sufficient to allow the attachment of captured cells for short-term study. Single-cell capture (SCC) capabilities of the microfluidic-biochips were found to be improving from the straight channel, branched channel, and serpent channel, accordingly. Multiple cell capture (MCC) was on the order of decreasing from the straight channel, branch channel, and serpent channel. Among the three designs investigated, the serpent channel biochip offers high SCC percentage with reduced MCC and NC (no capture) percentage. SCC was around 52%, 42%, and 35% for the serpent, branched, and straight channel biochips, respectively, for the tilt angle, θ values were between 10–15°. Human lung cancer cells (A549) were used for characterization. Using the PP-SCT technique, flow rate variations can be precisely achieved with a flow velocity range of 0.25–4 m/s (fluid channel of 2 mm width and 100 µm height). The upper dish (UD) can be used for low flow rate applications and the lower dish (LD) for high flow rate applications. Passive single-cell analysis applications will be facilitated using this method.

Graphical Abstract

1. Introduction

Cytology has been extensively studied since the invention of the microscope. However, in recent years, microfluidics has predominantly come into play for single-cell analysis (SCA) due to the development of modern fabrication technologies and tools [1,2,3]. The increase of sensitivity of many analytical systems in cell and fluid handling are attributed to the microfluidics technology, which has pushed the SCA to an advanced level. The number of articles published on SCA has increased manifold as compared to past decades. The main reason for the ascendancy of using SCA is because it will reduce the biological errors from the target cell population [4]. SCA acts as a tool to clarify molecular mechanisms and pathways revealing the nature of cell heterogeneity. Moreover, each cell exhibits different cell cycle stages, protein, and gene expressions [5]. Apart from that, SCA facilitates rare cells or events, scarce, precious samples, and single-cell precision in populations.

1.1. Microfluidics

Single cells are to be trapped and isolated to perform single-cell investigations [6,7,8,9,10]. Microfluidics has come out as a powerful tool to study the complexities of cells [11]. Apart from the quality of results, the reduction in time, savings in space, reagents and small sample volumes involved (on the order of microliters) are some of the remarkable discoveries made using microfluidics technology [4]. Several approaches [12,13,14,15,16,17,18,19,20,21,22] were utilized in microfluidics facilitating single-cell trapping which can be broadly classified as contact-based and contactless. Various cell trapping methods have been developed using different approaches including chemical, gel, hydrodynamic, dielectrophoresis, magnetic, laser, and acoustics [23,24,25,26]. Every method has its merits and demerits. Usually, the process requires auxiliaries, like a pump or a pressure-controlling system for fluid introduction and guidance. Some processes need specialized electronics or optical equipment. This specialized auxiliary equipment is not commonly used in medical or biological laboratories, therefore, inducing additional access-related obstacles for operation. The area density of single-cell arrays is reduced significantly due to the space occupation by the auxiliary parts or the devices. Usually, the design structures of the microfluidic devices require the fabrication of many parts including valves, multiple layers, and channels, which are complicated [27,28,29]. Thereby the practical applications in clinics and general biological laboratories are limited due to these downsides [24]. These downsides have led to the need for the development of a hydrodynamic trapping technique where the trapping is performed using the design itself by involving unsophisticated basic laboratory instruments for single cell measurements. The hydrodynamic trapping technique is also capable of preserving and handling the cells which may be affected due to the presence of an external field/force. Apart from the simplicity of the process, the natural state of the separated particles can be of use for several other further studies.

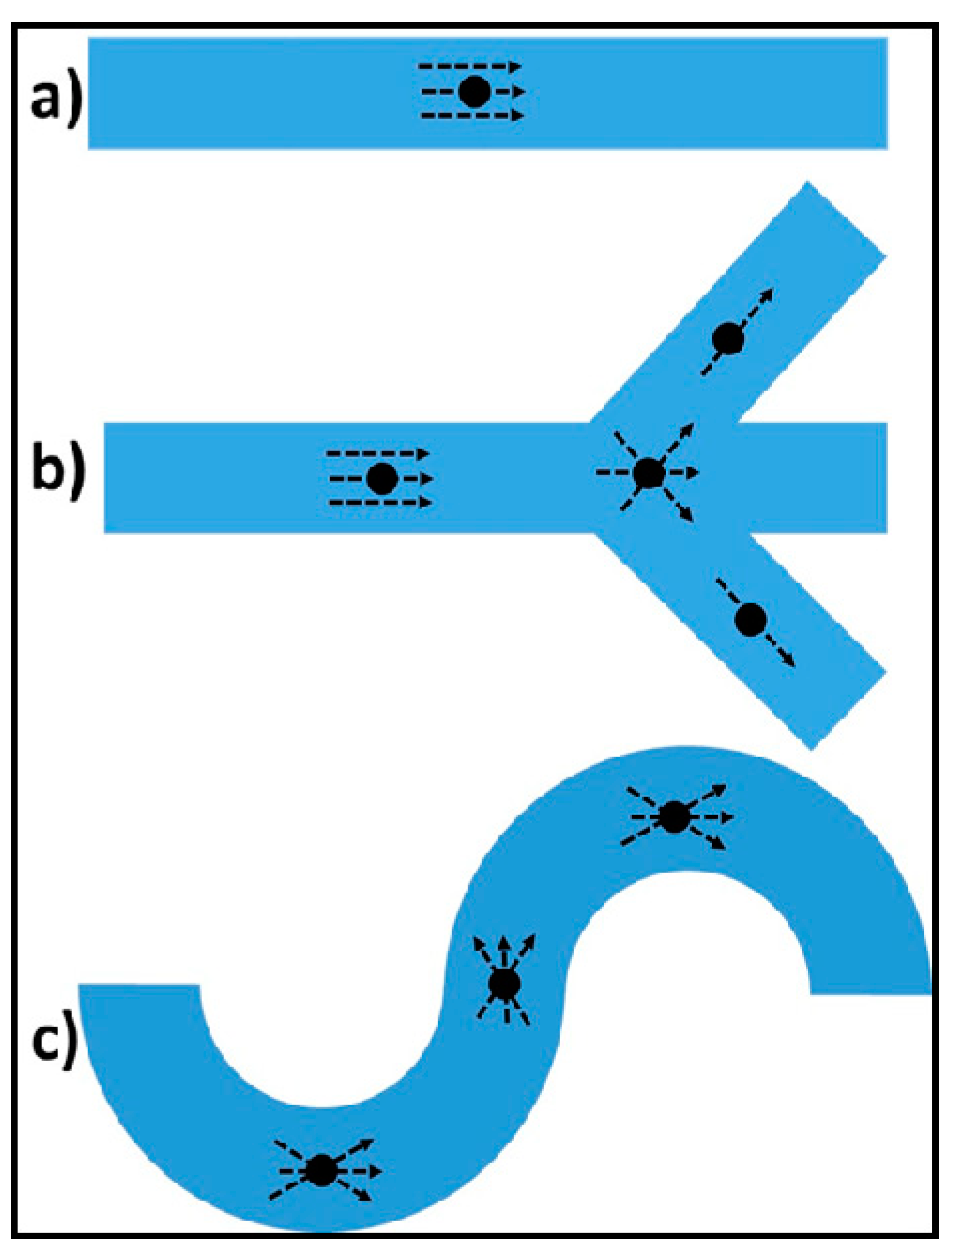
1.2. Hydrodynamic Trapping

In hydrodynamic trapping approach, the target particles from the main flow are separated using the mechanical obstacles or barriers. Once separated, the target particles are retained in hydrodynamic trapping sites where various investigations can be performed. Walls and pores are the typically-used particle trapping structures, arrays of these trapping pattern structures can be fabricated to capture the single cells. SCA using labeling techniques can improve significantly the specificity and sensitivity. The most common label is a fluorescent molecule, which is used to visualize the analyte. Therefore, the combination of microfluidic platforms and multimodal spectroscopy opens the gate for next-generation single-cell studies. With that combo, SCA with defined stimulation of cells and analysis of cell responses can be performed simultaneously for as many different bio-molecules as possible. This will also address several current needs and demands for technologies identified in the literature to pursue SCA [5,30]. Thus, the field is a matter of interest for analytical and diagnostic aspects.
Several researchers are working on hydrodynamic-based single-cell trapping [24,26,31,32,33,34,35]. New smart methods and platforms facilitating multiple measurements on individual cells are entailed. Development of a platform, concurrently having high throughput and resolution with less expertise requirement remains a challenge. The intent here is to facilitate a less complex microfluidic device, which helps in vertical cell trapping based on the design and technique itself. Additionally, the process involving unsophisticated basic laboratory instruments for single-cell measurements, which are compatible with conventional fluorescence imaging modalities are the current needs of SCA platforms. In this article a simple, but efficient, pipette Petri dish single-cell trapping technique (PP-SCT) is demonstrated. This topic can also be termed as tilt trapping (TT). The PP-SCT technique only involves basic lab equipment—as the name suggests, a pipette and a Petri dish—thereby its implementation and application scope is very wide. Thus, this method can be easily implemented for single-cell analysis without the need of complex auxiliaries.
In 2005, Rettig and Folch demonstrated the optimization of high single-cell trapping in microwells by deriving a relation between well depth, well diameter, and settling time [12]. In 2010, Park et al. demonstrated the microwell design analysis for efficient single-cell capture (SCC) [14]. In 2013, Karimi et al. reported an overview of the cell/particle sorting techniques using hydrodynamic effects in microchannels [36]. To the best of our knowledge, none of the studies in the literature have investigated the relative efficiency of hydrodynamic-based fluid channel designs on SCC. In this article, the effects of fluid channel design and microwell array design orientation for single-cell trapping efficiency using the PP-SCT technique has been investigated. Three designs were considered straight channel, branched channel, and serpent shaped channel. A simple, but efficient, microfluid dynamics-based passive technique, capable of vertical cell trapping with high SCC for short-term SCA study was demonstrated.

2. Methods

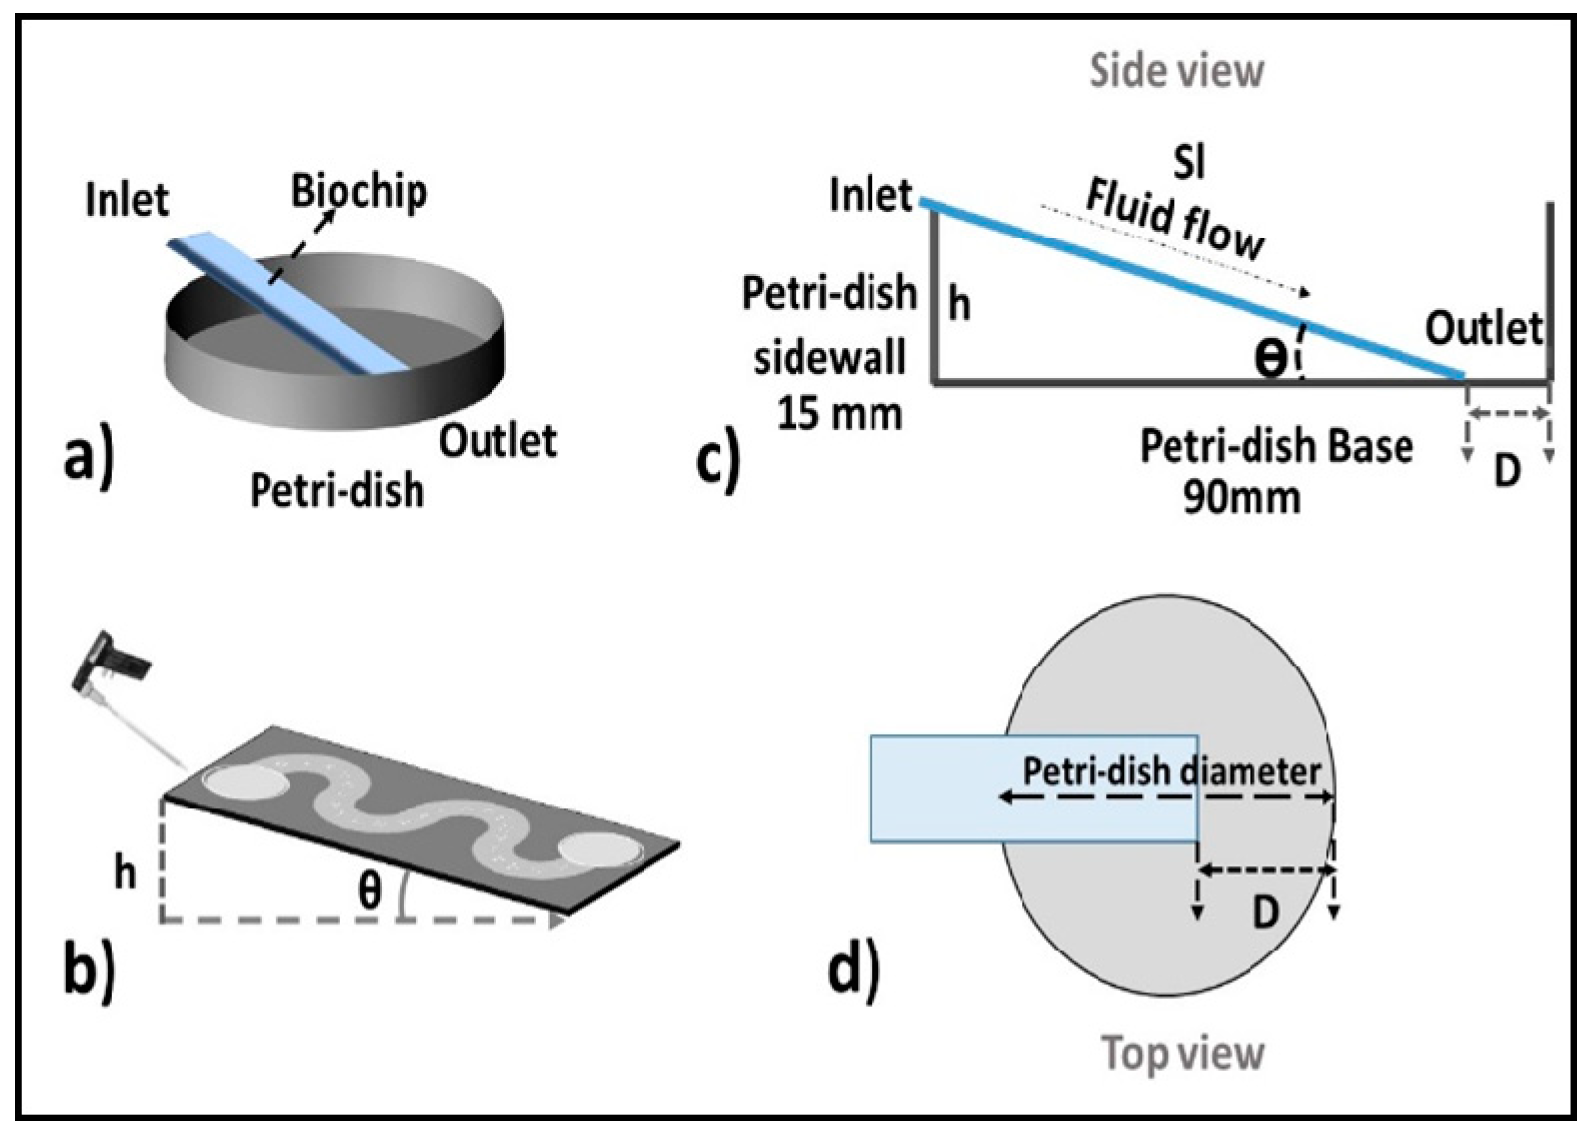
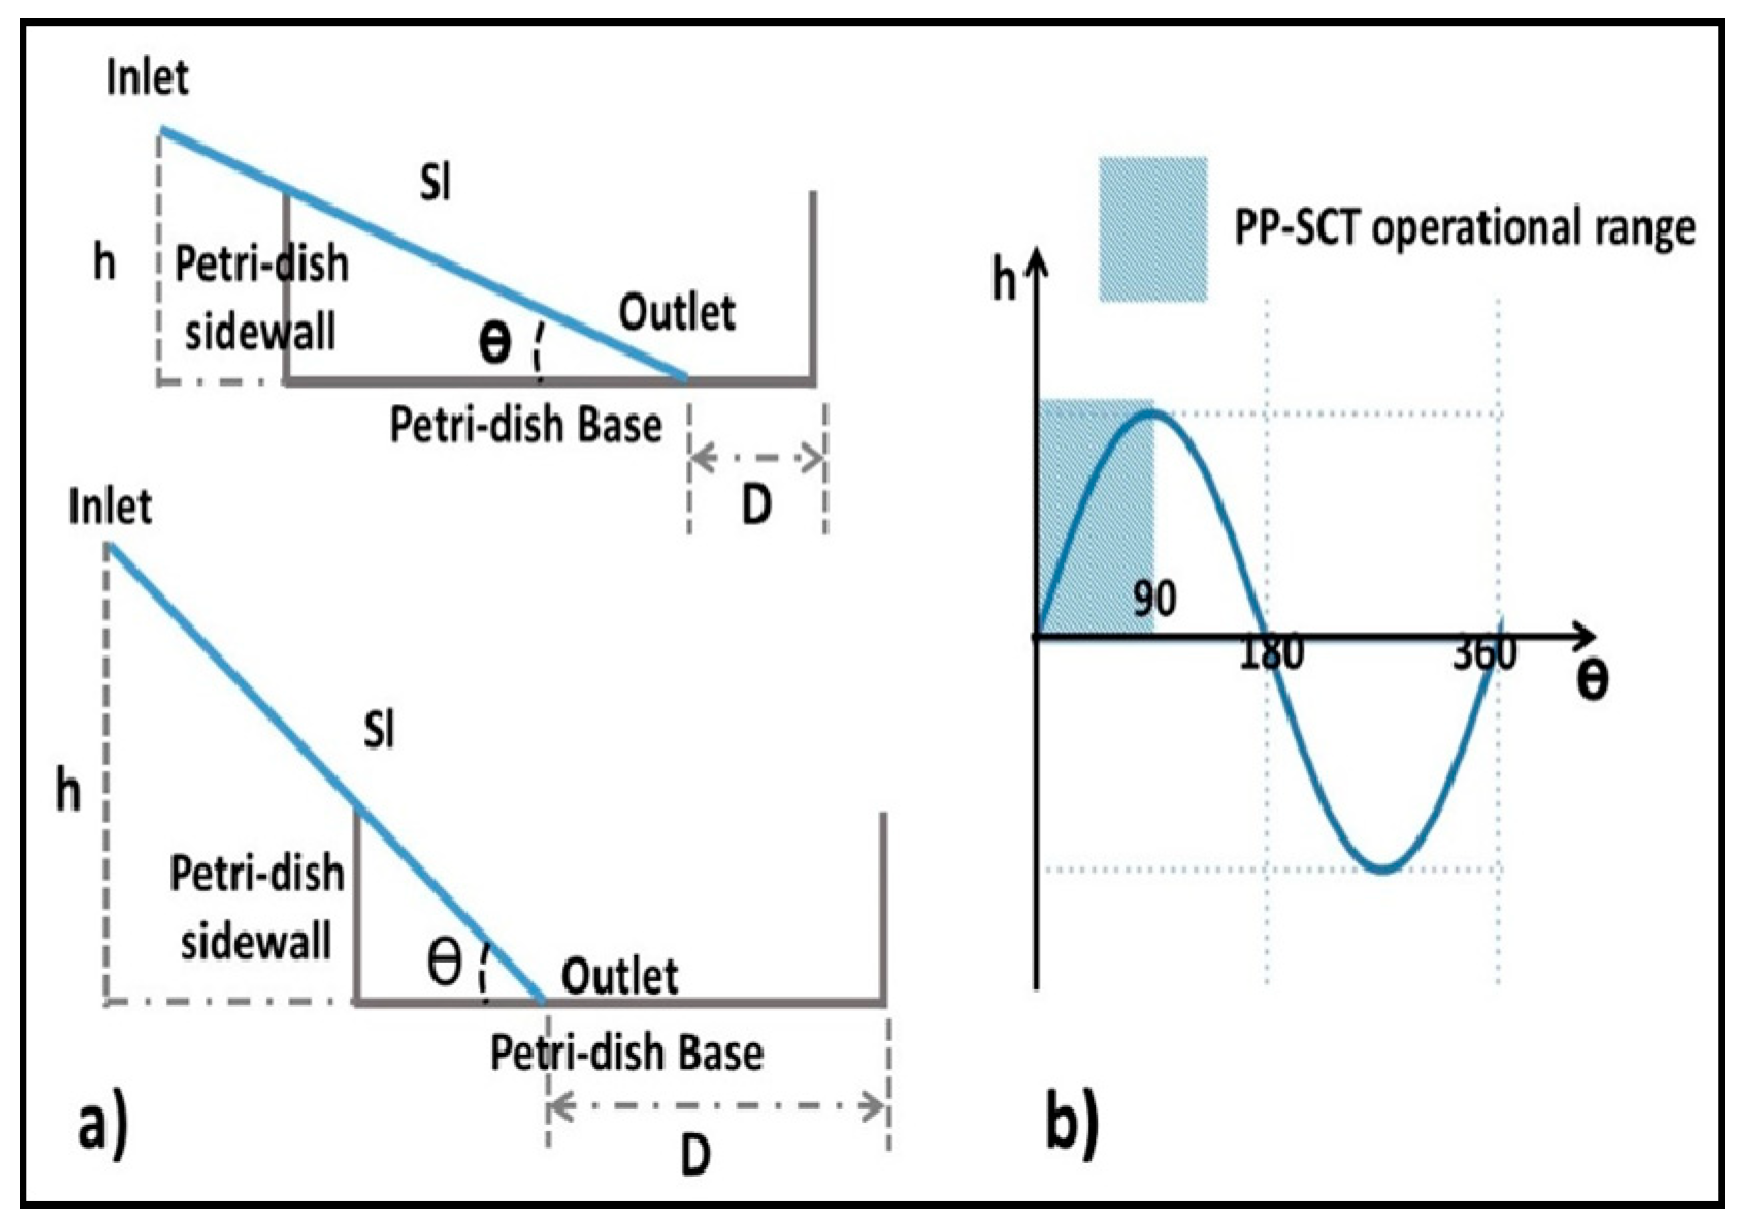
2.1. Concept and Design Criteria

Figure 1 shows the illustration of the PP-SCT technique. In this technique, the inlet edge of the biochip is placed over the side wall of the Petri dish, and the outlet edge is placed inside the Petri dish base along its diameter. When the biochip is moved externally to the Petri dish, the angle and height of the inlet are varied. In this research, a glass slide biochip 3 inches × 1 inches in size, and standard Petri dishes of 90 mm × 15 mm (Sigma, St Louis, MO, USA) were considered. Petri dishes have a lower dish (LD) around 87 mm × 15 mm and an upper dish (UD) around 90 mm × 7 mm. The cell suspension was pipetted out into the inlet well, which flows through the channel to be collected at the outlet well. During the process, the cell gets captured in the microwell array. Biochip designs with the straight channel, branched channel and serpent fluid channel were designed, fabricated and investigated. Figure 2 shows the shape of different fluid channels considered. Sticky tape can be used to lock the biochip position with the Petri dish during the process, if operated at extreme ranges.
Considering a fluid flow from an elevated height to a lower height, by law of conservation of energy, fluid velocity (V) at the outlet neglecting the frictional losses can be given as:
V = √(2g(h1 − h2))
In the above equation, g is the gravitational constant. Position 1 and position 2 corresponds to the inlet and outlet, and h1 and h2 correspond to the inlet and outlet elevated height, respectively. Flow rate (Q) can be given as:
Q = A × V
where A is the cross-sectional area of the fluid channel and V is the fluid velocity. Both the fluid velocity and flow rate are adjustable through alteration of the elevation head, which can be simply done by altering the D in the PP-SCT method. Θ ∝ D ∝ h (for θ values between 0° and 90°). Figure 3 shows the varying operational modes of the PP-SCT technique and its characteristics.

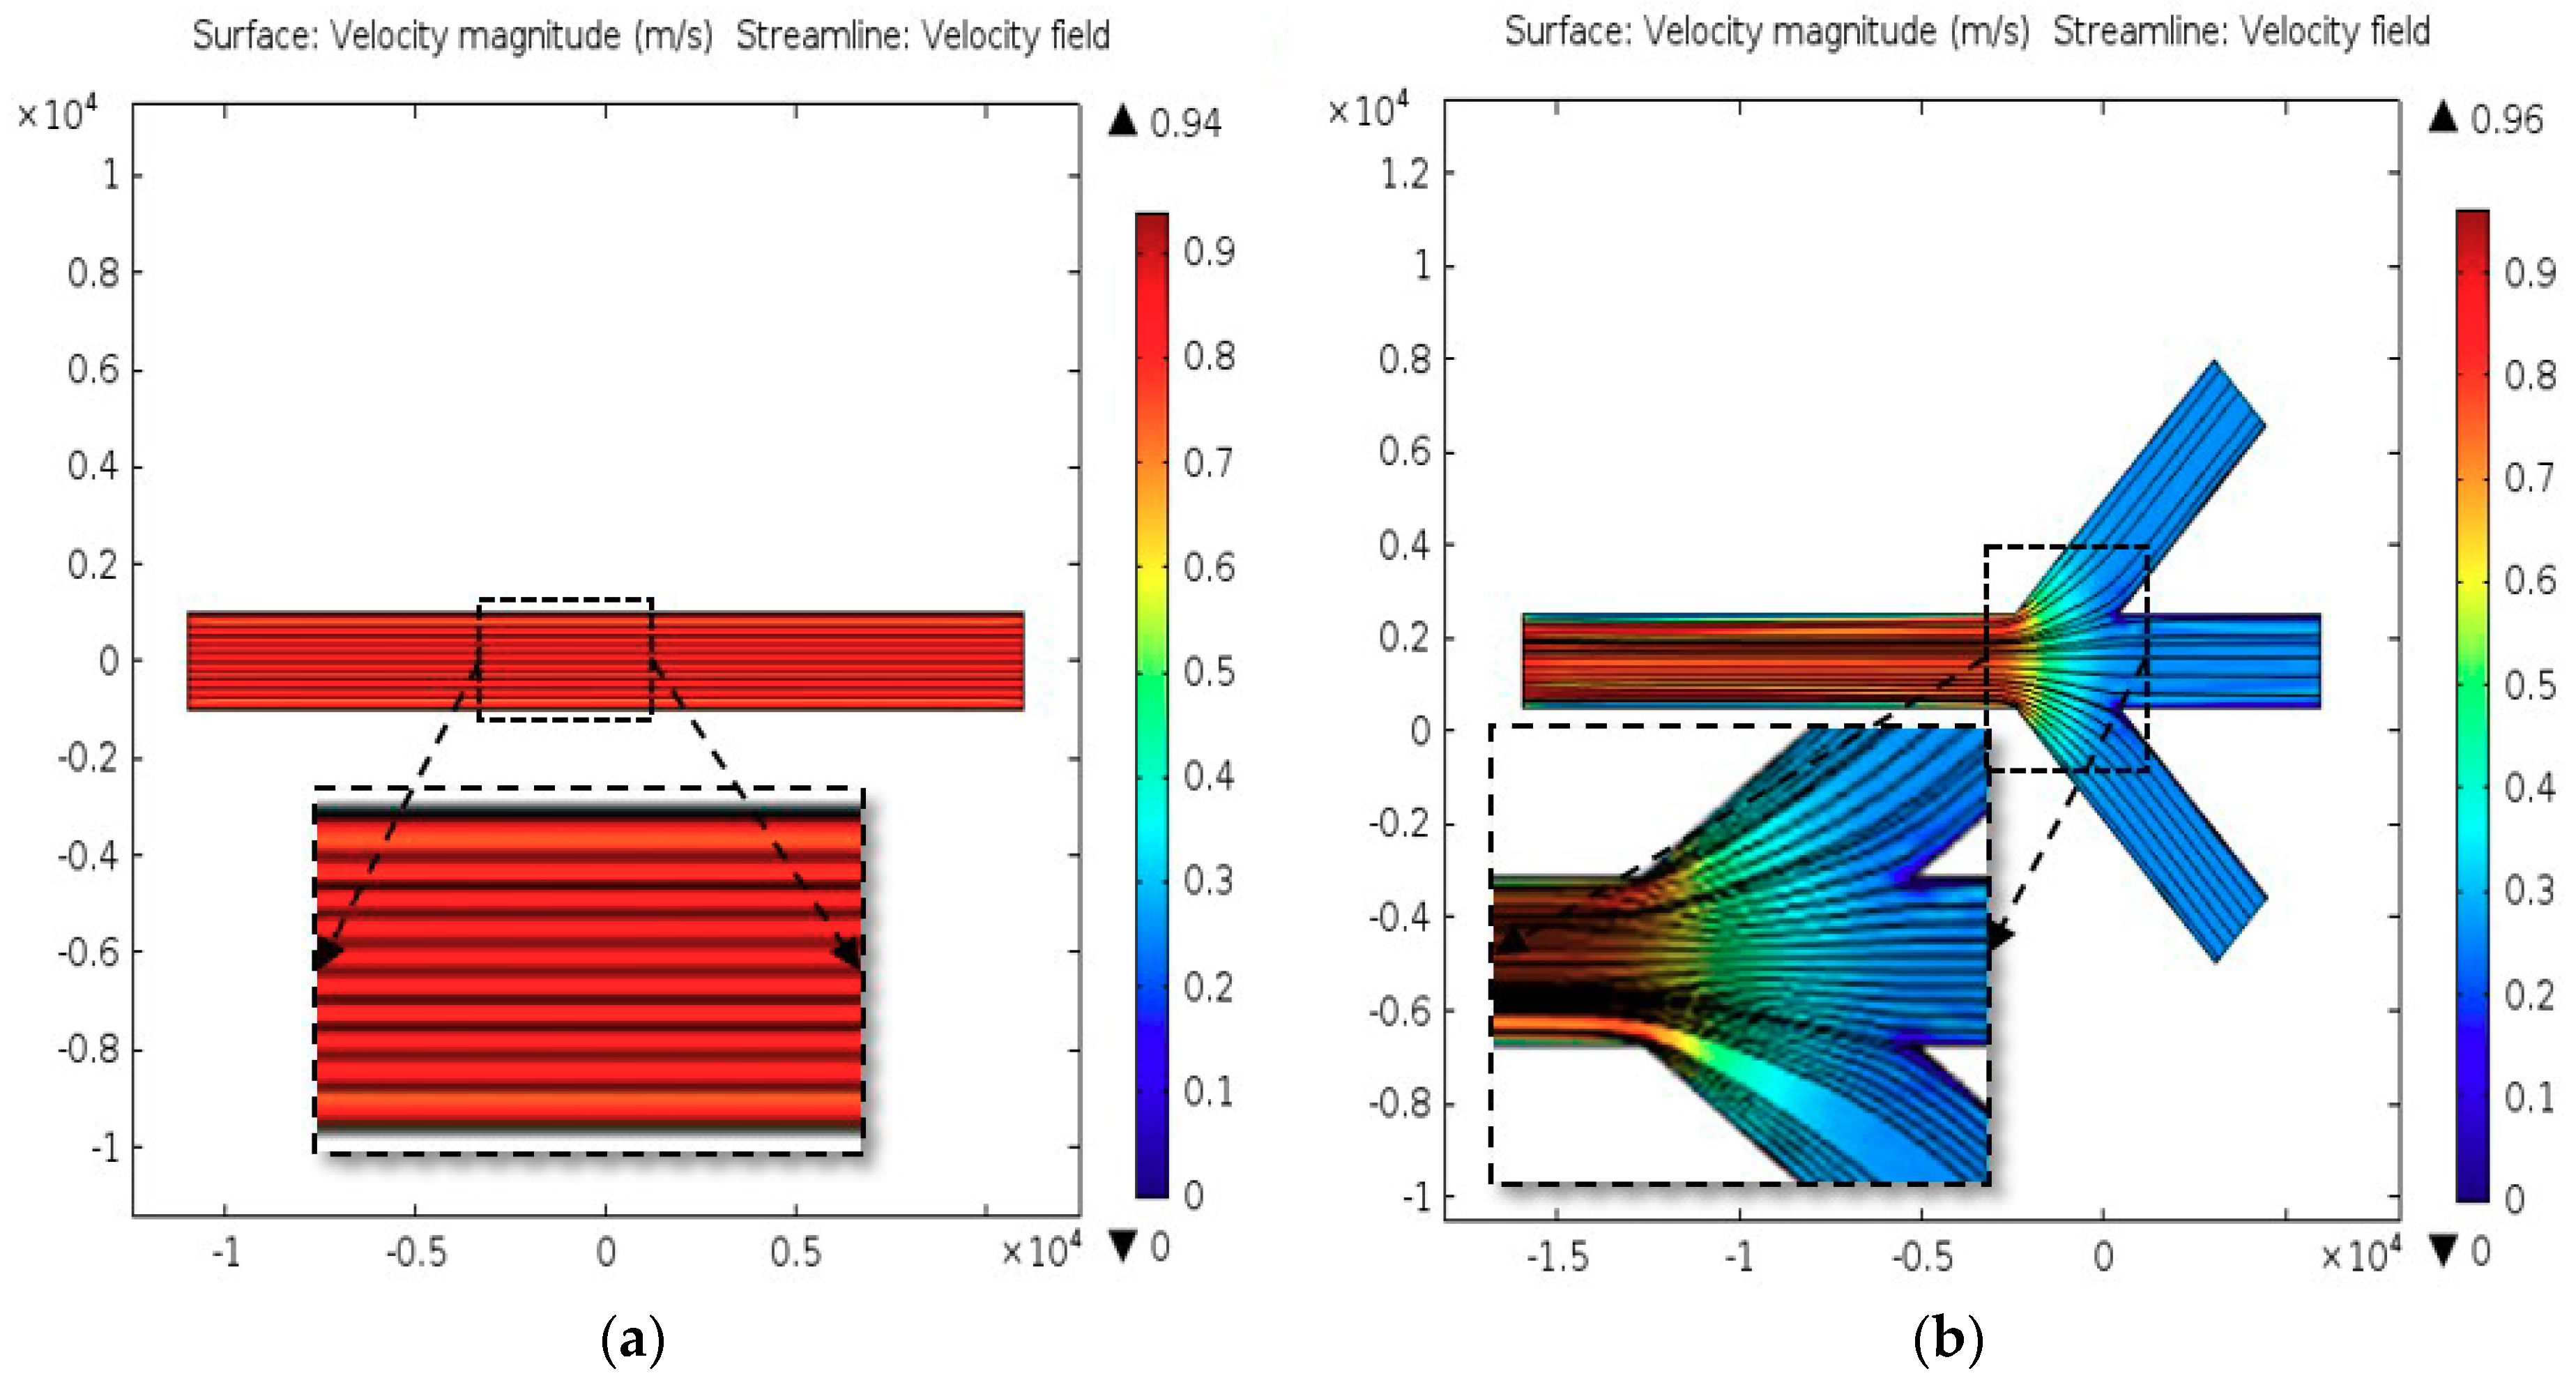
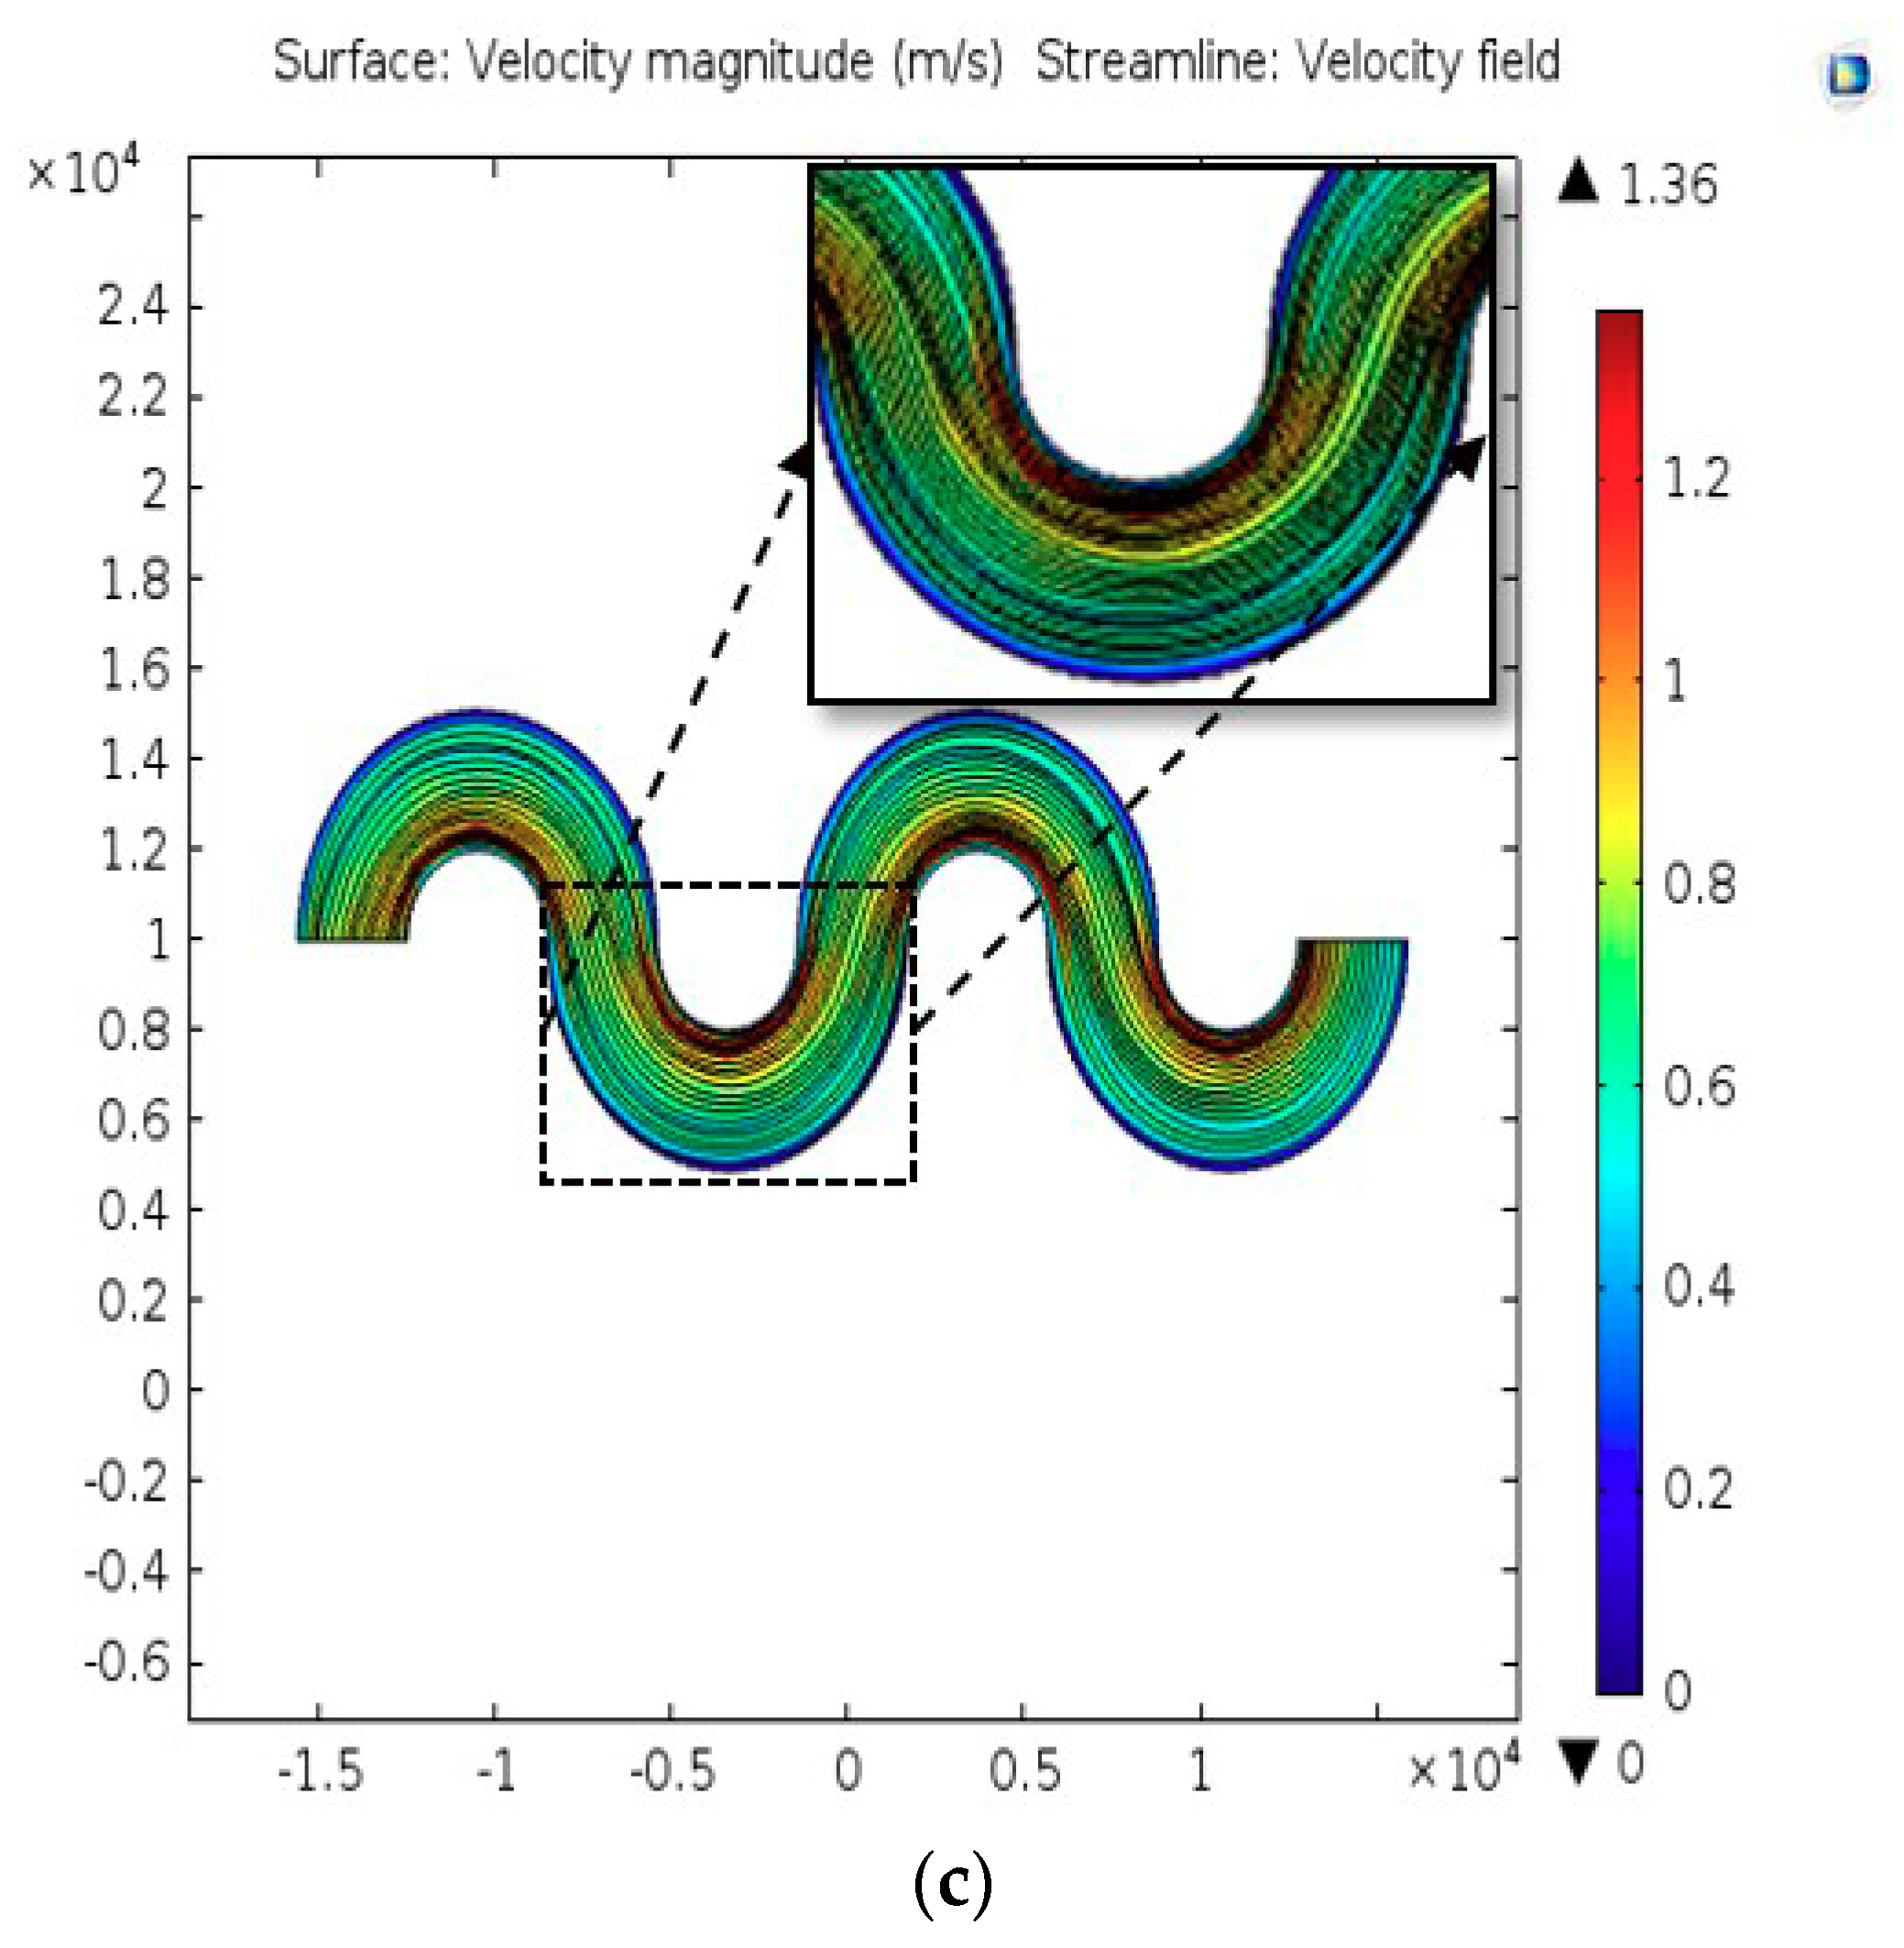
2.2. Computational Analysis

PP-SCT was modeled and simulated using Comsol Multiphysics solver (version 5.0, COMSOL AB., Burlington, MA, USA). The simulation was carried out using water as the flow material. Newtonian and single-phase fluid models were considered, by taking into account the law of conservation of energy, Stoke’s law, and the continuity equation [37]. The Navier-Stokes equations govern the fluid motion and can be seen as Newton’s second law of motion for fluids:
ρ((∂u/∂t) + u∙∇u) = −∇p + ∇·(µ(∇u + (∇T u)) − 2/3(µ(∇·u) I)) + F
where u is the fluid velocity, ρ is the fluid density, p is the fluid pressure, and μ is the fluid dynamic viscosity. The equation includes the inertial forces, pressure forces, viscous forces, and the external forces applied to the fluid. These equations are always solved together with the continuity equation:
ρ/∂t + ∇·(ρu) = 0
The Navier-Stokes equations represent the conservation of momentum, while the continuity equation represents the conservation of mass. For incompressible flows, the continuity equation yields:
∇·u = 0
0 = −∇t p∙et − 1/2((fd·ρ/dh)|u|u) + F∙et
−∇t∙(A·ρ·µ·et) = 0
where et is the tangential unit vector along the edge.
The flow was modeled for a rectangular straight channel with a width of 2 mm and a height of 100 µm, for different angles, and its corresponding fluid velocity was plotted. During the simulation, the Darcy friction factor for the rectangular microchannel with glass surface roughness of 0.0015 mm was given as a boundary condition. A grid-independent study was carried out and the results suggest that the finer and coarser mesh can produce grid-independent solutions. As a result, the computation results are obtained using the physics-controlled grid system. Table 1 lists the properties and constants used for the simulation. The Darcy friction factor fd using the Darcy–Weisbach equation is given below:
fd = 64/Re
The Reynolds number [38,39] is given by the equation:
Re = (LVavg·ρ)/µ
where Vavg is the average fluid velocity, and L is the relevant fluid length scale, for rectangular channel:
L = 4A/P
where A and P are the cross-section area and wetted perimeter of the channel, respectively. Along with that, the gravitational volumetric force was considered.

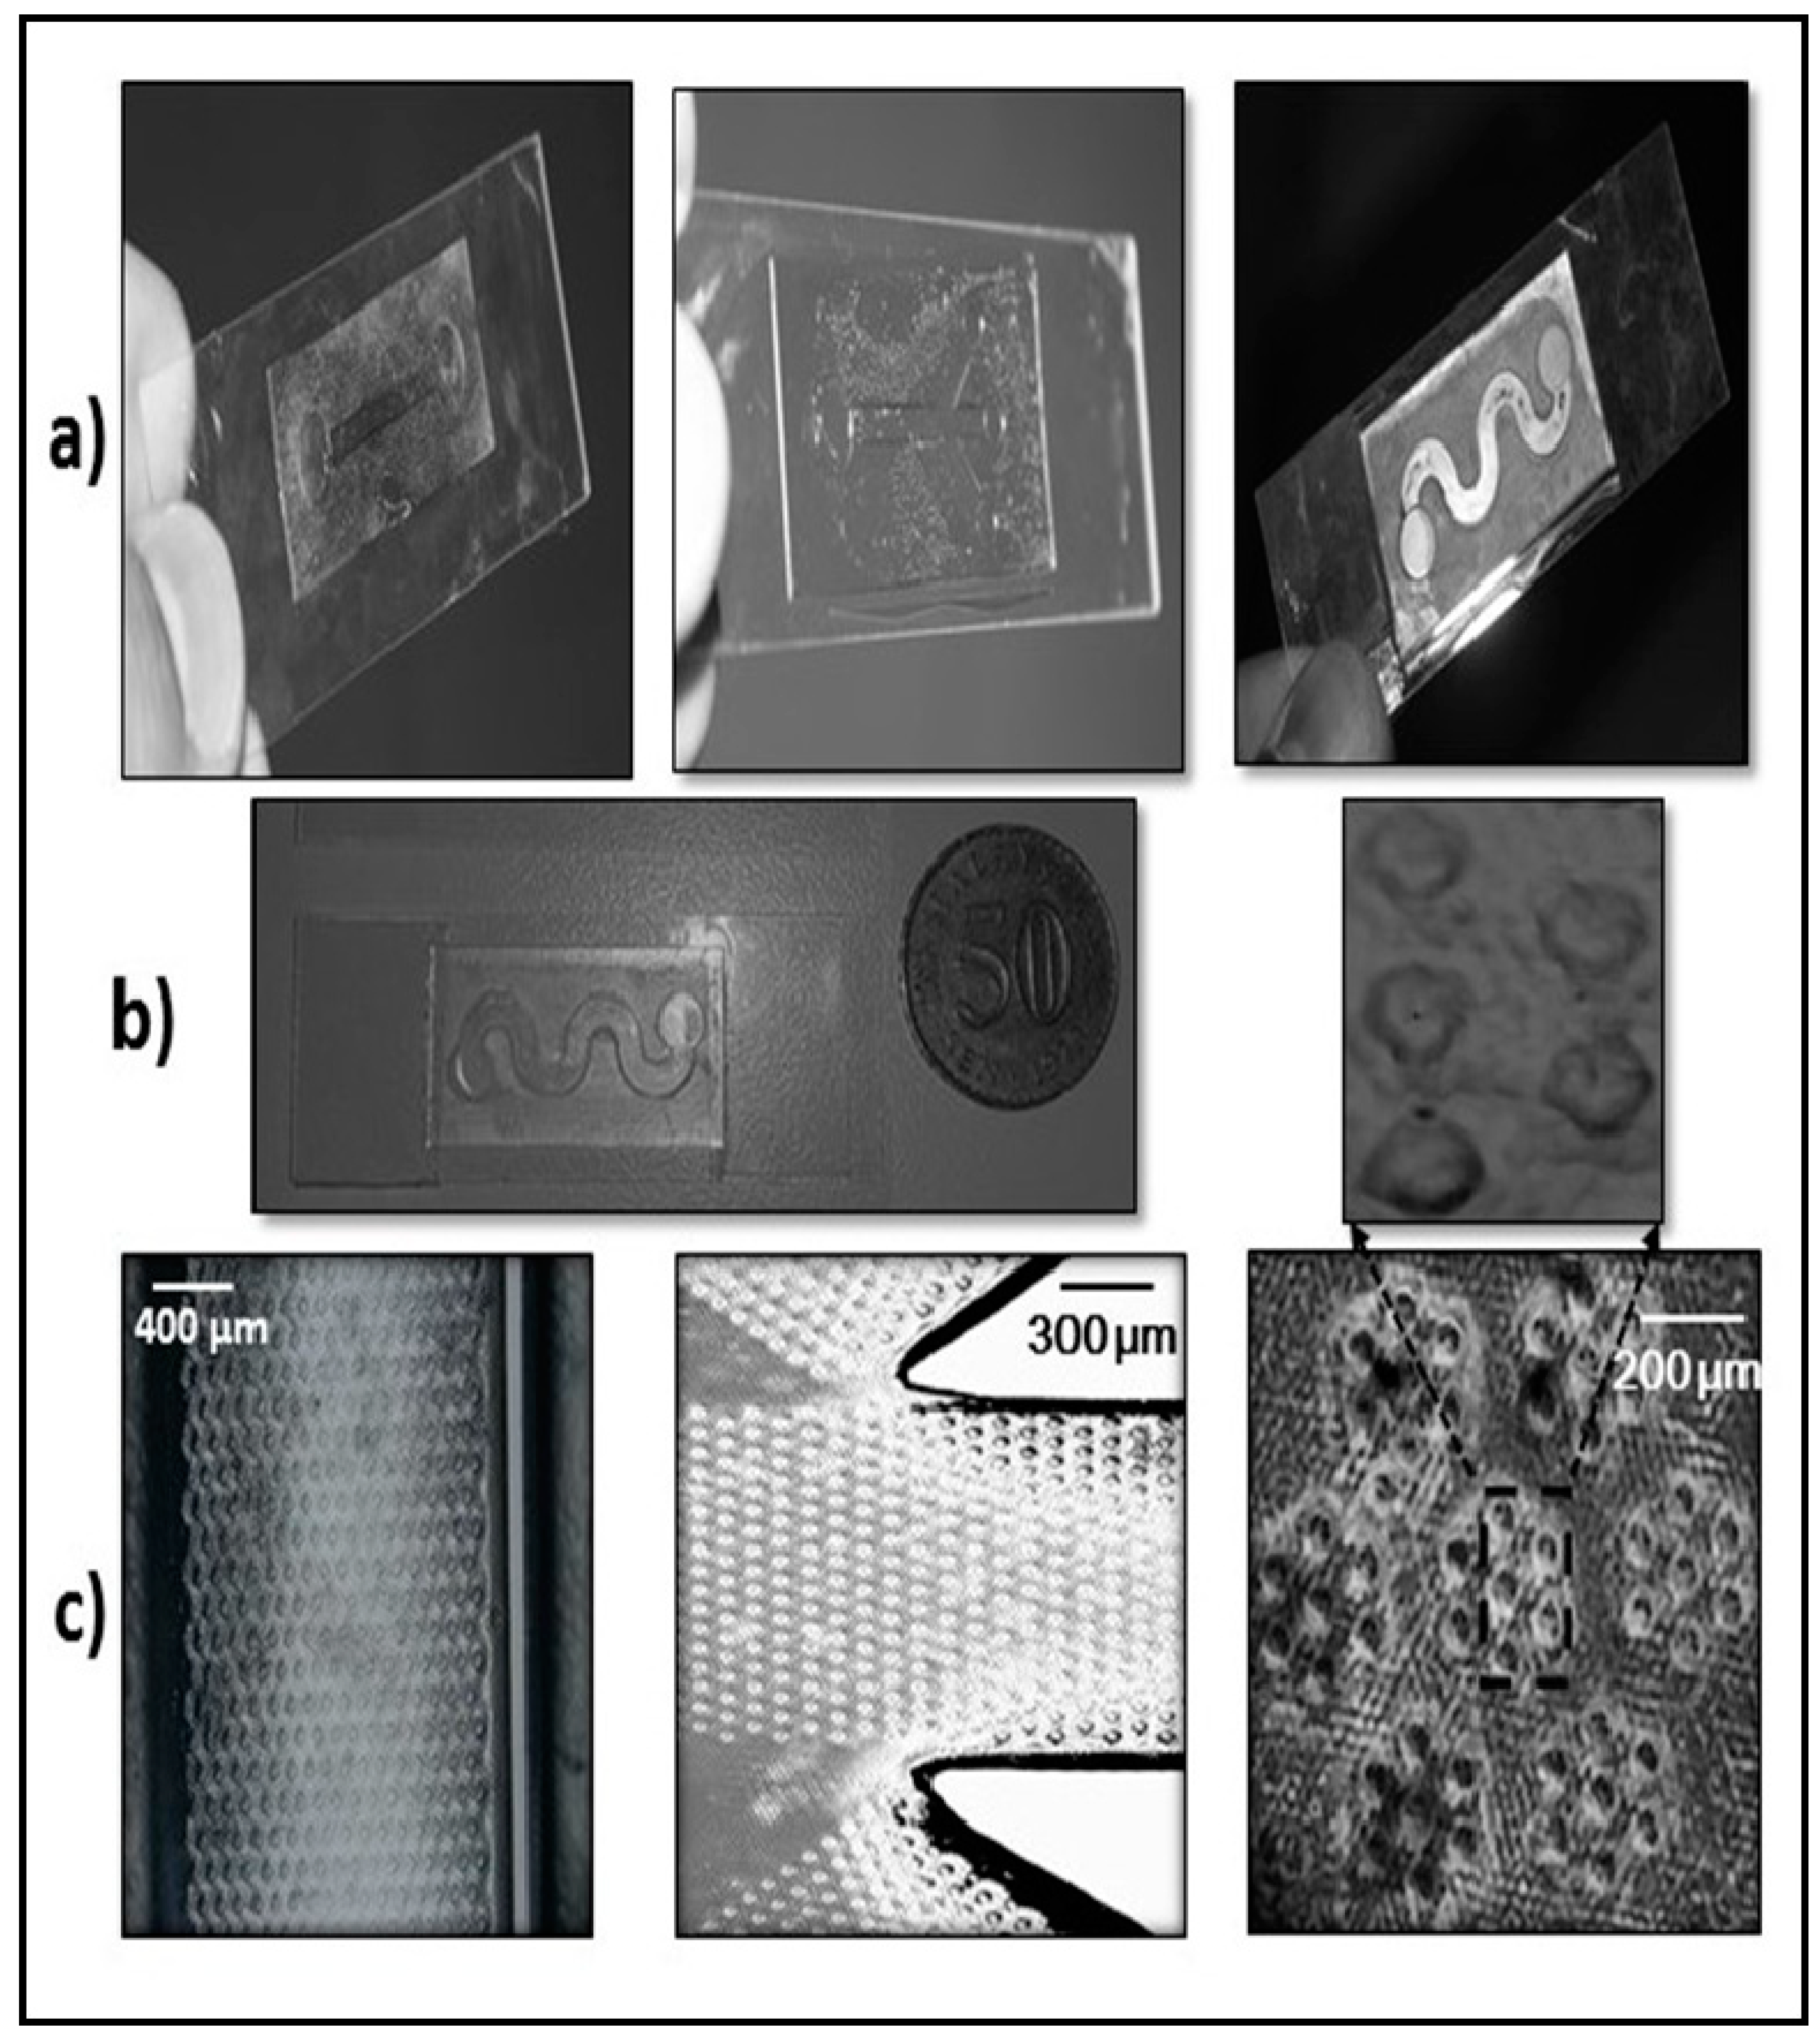
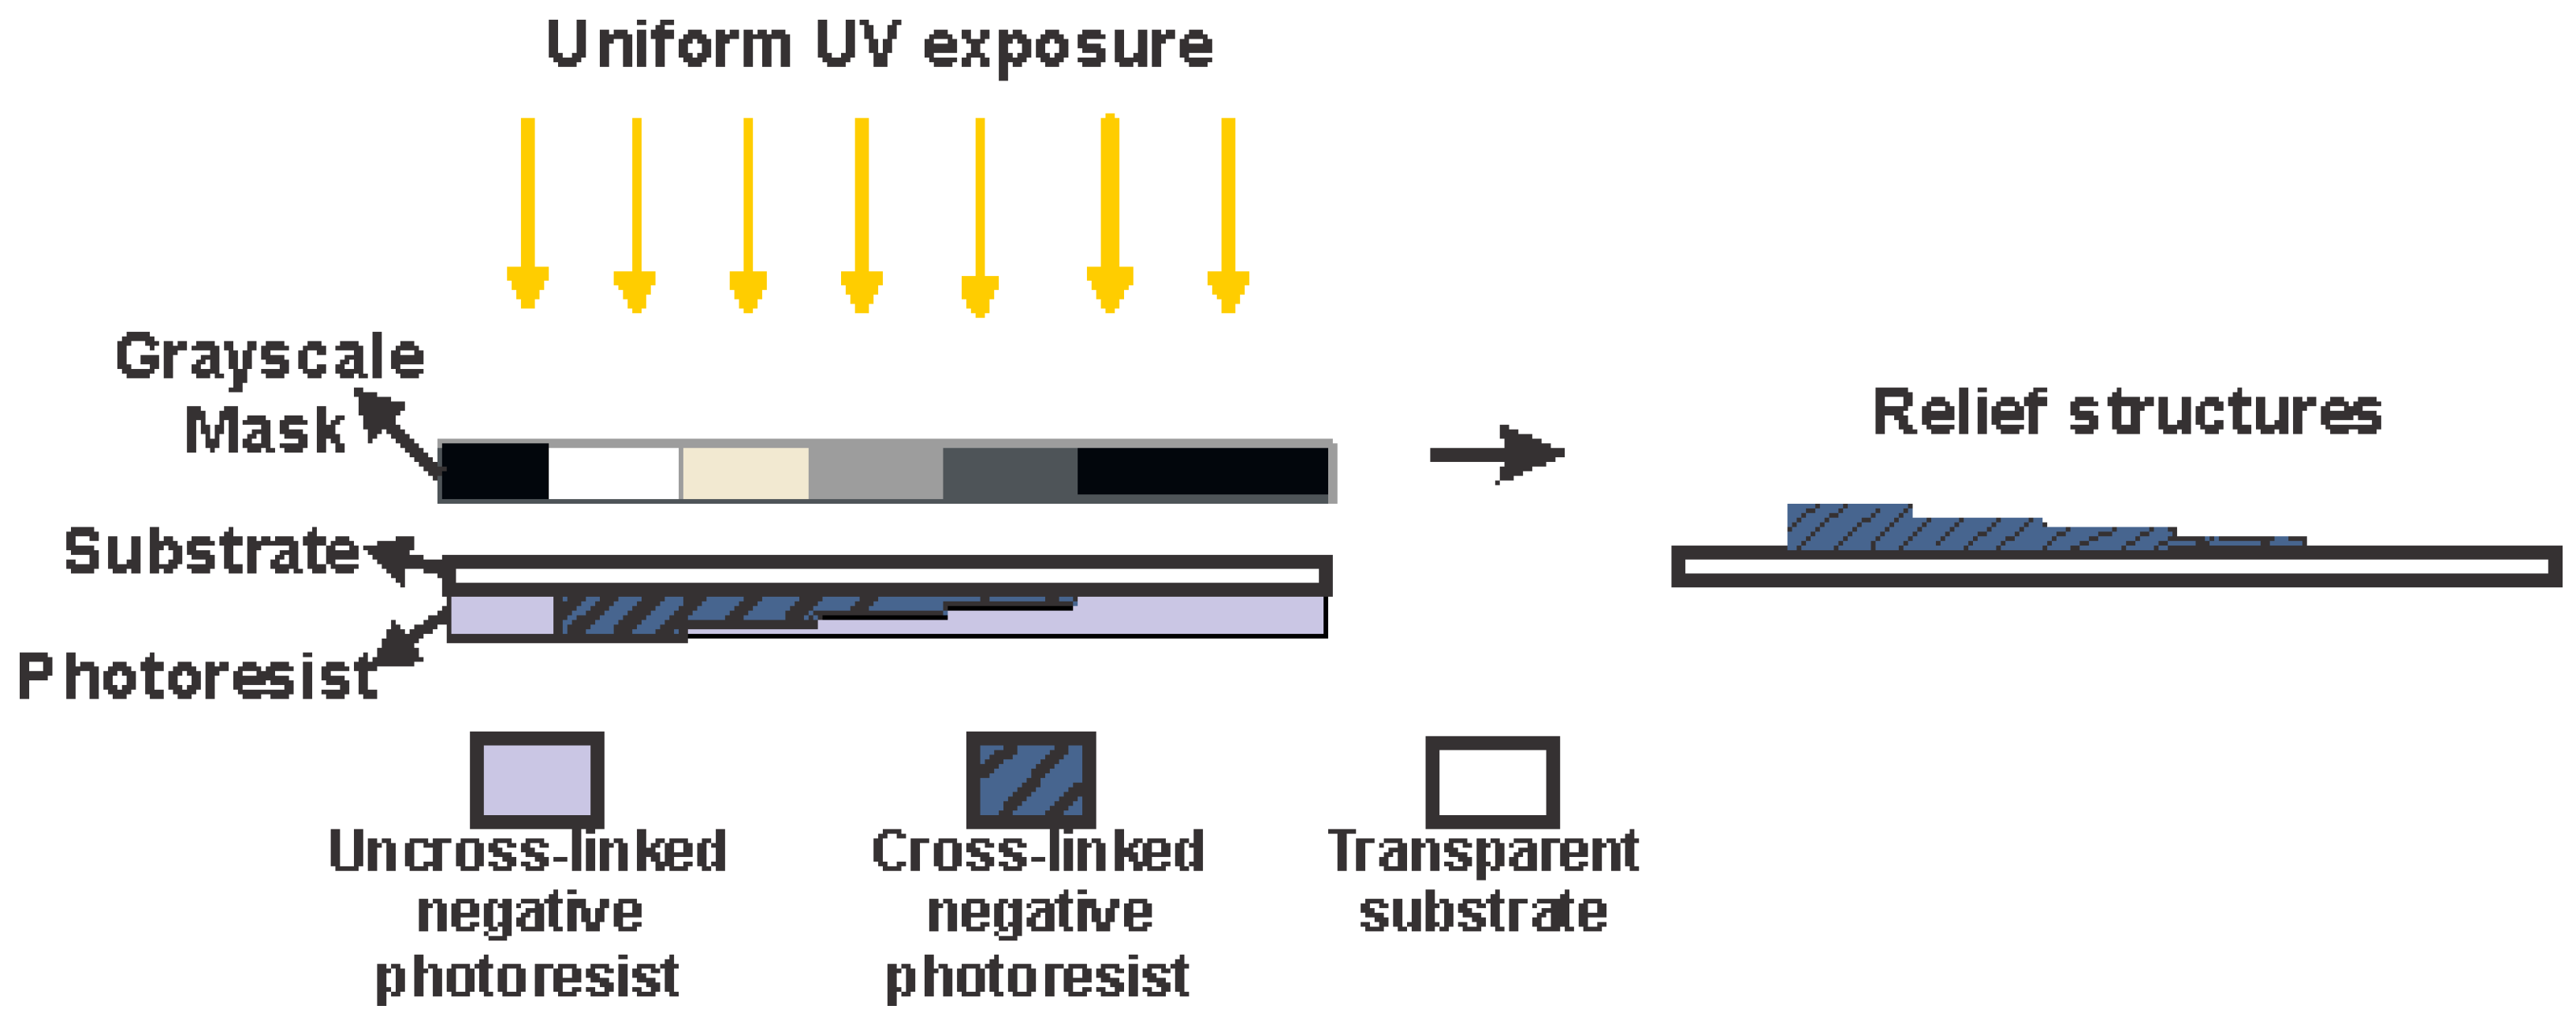
2.3. Biochip Fabrication

Biochips were fabricated using the emulsion mask grayscale photolithography process [40]. The biochip patterns were designed using CorelDraw X7. The designed pattern was drawn five times larger than the original dimension because of the 5:1 shrinking rate of the mask fabrication equipment. The percentage of grayscale concentrations were used to control the height of the developed photoresist obtained after the ultraviolet (UV) exposure process. The designed grayscale mask was printed on a transparent polyethylene terephthalate (PET) film by using the image setter technique. The printed transparent film can also be called a master mask film. To project the image from the printed master mask film in a 5:1 reduction scale onto a high-precision photo plate (Konica Minolta, Inc., Tokyo, Japan) also known as an emulsion mask, an MM605 simple mask fabrication machine (Nanometric Technology Inc., Milpitas, CA, USA) was used. The light-sensitive silver halide was coated over the emulsion mask. Due to the high light sensitivity of the emulsion mask, the whole mask exposure process was performed under dark room conditions. Before the emulsion mask exposure process, the silver halide-coated surface was placed facing towards the light source with the exposure time adjusted to 8 s. The exposed emulsion mask was immersed into an emulsion mask developer at room temperature for 2 min after the exposure process. A mixture of one part of high-resolution plate developer (CDH-100) from Konica Minolta Opto, Inc., Osaka, Japan and four parts of distilled water was used as the emulsion mask developer. To ensure the uniform development process, the immersed emulsion mask was stirred continuously. The previously-exposed silver halide had formed a high optical density metallic silver during the development process, which can function as an excellent optical filter on the emulsion mask. During the development process, the darkfield emulsion mask was created.
The 3 × 1 inch-sized microscope glass slides (DURAN Group, DWK Life Sciences GmbH, Mainz, Germany) were used as a substrate. The glass substrate was chosen due to its transparent property to produce a 3D relief surface structure by employing the back UV exposure process. The glass slides were washed to remove surface contaminants by using an ultrasonic bath (GT Sonic VGT-1613QTD, GuangDong GT Ultrasonic Co. Ltd., Guangdong, China). First, the washing process was done by an ultrasonic bath with acetone for 5 min, followed by an ultrasonic bath with methanol and isopropyl alcohol (IPA) each for 5 min. After the above washing process, the glass slides were rinsed with distilled water. Quickly after the surface washing process, 2 mL of SU-8 2010 photoresist (MicroChem, Newton, MA, USA) was dispensed and spread over the whole surface of the 3 × 1-inch glass substrate to generate a 700-µm thick SU-8 film. During this process, the coated SU-8 film was self-planarized by itself. The obtained resultants were a flat and uniform layer due to the surface tension and high mobility. The SU-8-coated glass substrate was soft baked using a conventional oven at a temperature of 95 °C for 10 h. It is essential to place all the SU-8-coated samples flat in the conventional oven to avoid any gravity force affecting the flow of the photoresist. Then, the LA4100_R1 one-side mask aligner (Sanei Electric Inc., Tokyo, Japan) was used to back expose the photoresist-coated glass substrates. Figure 4 illustrates the grayscale photolithography process. The SU-8-coated glass substrates were exposed using a 180 W mercury lamp of 365 nm for 30 s. A post-exposure bake was conducted in three steps immediately following the UV exposure process. Firstly, the exposed samples were baked at a temperature of 65 °C for 2 min on a hotplate. Secondly, the temperature of the hotplate was gradually ramped up to 95 °C for 10 min. Lastly, after 10 min of baking the hotplate was switched off while the samples were still left on top of the hotplate. The samples were then allowed to cool down gently to room temperature. This slow cooling process decreases the stress built up in the cross-linked SU-8 and, thereby, avoids cracking and deformation of patterns during the development process. The developing process was performed by immersing the exposed samples into SU-8 developer solution (MicroChem, Newton, MA, USA). The development process was enhanced by using an ultrasonic cleaner and took only 2 min to dissolve all the unexposed SU-8 photoresist from the glass substrate completely. After the first development, the developed samples were washed by using another batch of clean SU-8 developer solution, then followed by the IPA and distilled water. Finally, a stream of nitrogen gas was used to blow dry the developed samples. Fabricated biochips are shown in Figure 5. The biochip consists of a fluid channel with a width of 2 mm, and with a hexagonally positioned microwell array with a diameter around 35 µm and a depth of 30 µm. The straight channel design consists of ~3500 microwells, the branched channel design consists of ~5000 microwells, and the serpent shaped design consists of ~1100 microwells. There was a −5% change in the feature size of the fabricated biochips compared to the original design.

2.4. Cell Culture

Human A549 lung cancer cells were obtained from ATCC (Rockville, MD, USA). Cells were cultured and maintained in complete growth media (CGM) consisting of 89% Dulbecco’s Modified Eagle’s Medium (Gibco, Grand Island, NY, USA), 10% fetal bovine serum (Gibco, Grand Island, NY, USA), and 1% of penicillin-streptomycin antibiotic (Gibco, Grand Island, NY, USA). The cells were maintained at 37 °C under a humidified atmosphere, with 5% CO2 and 95% air, respectively.

2.5. Single-Cell Trapping and Cell Viability Tests

Prior to operation, the biochip was covered with a coverslip and sealed with sticky tape. Biochips were sterilized with 70% ethanol and UV for a few minutes before using. Once the grown cells attained 80% confluency, they were trypsinized with TrypLe (Gibco, Grand Island, NY, USA) and centrifuged (Eppendorf 5810, Westbury, NY, USA) at 700 rpm for 5 min. The cell pellet was resuspended in complete growth media. Cell suspension with a density of 3.5 × 10⁴ to 7.5 × 10⁴ cells/mL were mixed with Trypan Blue (Sigma-Aldrich, St Louis, MO, USA) and were pipetted down into the biochip, which was tilted at an angle of around 10–15° (D was around 16–30 mm for LD). By varying the D along with the ruler, the angle was varied accordingly. Pipetting was done gently and slowly. After the cell-suspended growth media was partially drained out from the outlet and the channels were filled with cells and growth media, the biochip was gently placed into a Petri dish and incubated. During the transfer to the Petri dish, caution was taken not to shake the biochip, as it may result in moving the cell out of the microwell before attachment. Additional growth media can be added if required after placing into Petri dish. The microwell array was observed under a microscope (Leica DM 2000 LED, Bensheim, Germany) for its trapping and viability. The overall technique was kept simple, and not much complex process handling was done on the cells. Statistical analysis was performed using GraphPad Prism 6.0. ANNOVA analysis was carried out to find the significant factors within each channel design and two-way ANNOVA analysis for comparing between channel designs. * is p < 0.01, ** is p < 0.001, *** p < 0.0001, and **** is p < 0.00001, indicating that the result is significant.

2.6. Single-Cell Fluorescent Measurement

After loading the cells, the biochip was incubated at 37 °C under a humidified atmosphere, with 5% CO2 and 95% air for 3 h for cell attachment. Once attached, the biochip was washed with the phosphate-buffered solution (PBS) to fully remove remaining media. Cells were fixed with 4% paraformaldehyde (Sigma, St Louis, MO, USA) for 30 min subsequently washed with PBS. For 5 s, cells were permeabilized using 0.1% Triton-X (Sigma, St Louis, MO, USA) and then washed with PBS. Fixed A549 cells were dyed with DAPI (Sigma, St Louis, MO, USA) and Rhodamine Phalloidin (Molecular Probe, Eugene, OR, USA) for 10 min, washed, and subsequently mounted with glycerol (Sigma, St Louis, MO, USA) for fluorescence imaging. Single-cell fluorescent measurements were made using a microscope (Nikon Eclipse TE 2000-S, Tokyo, Japan).

3. Results

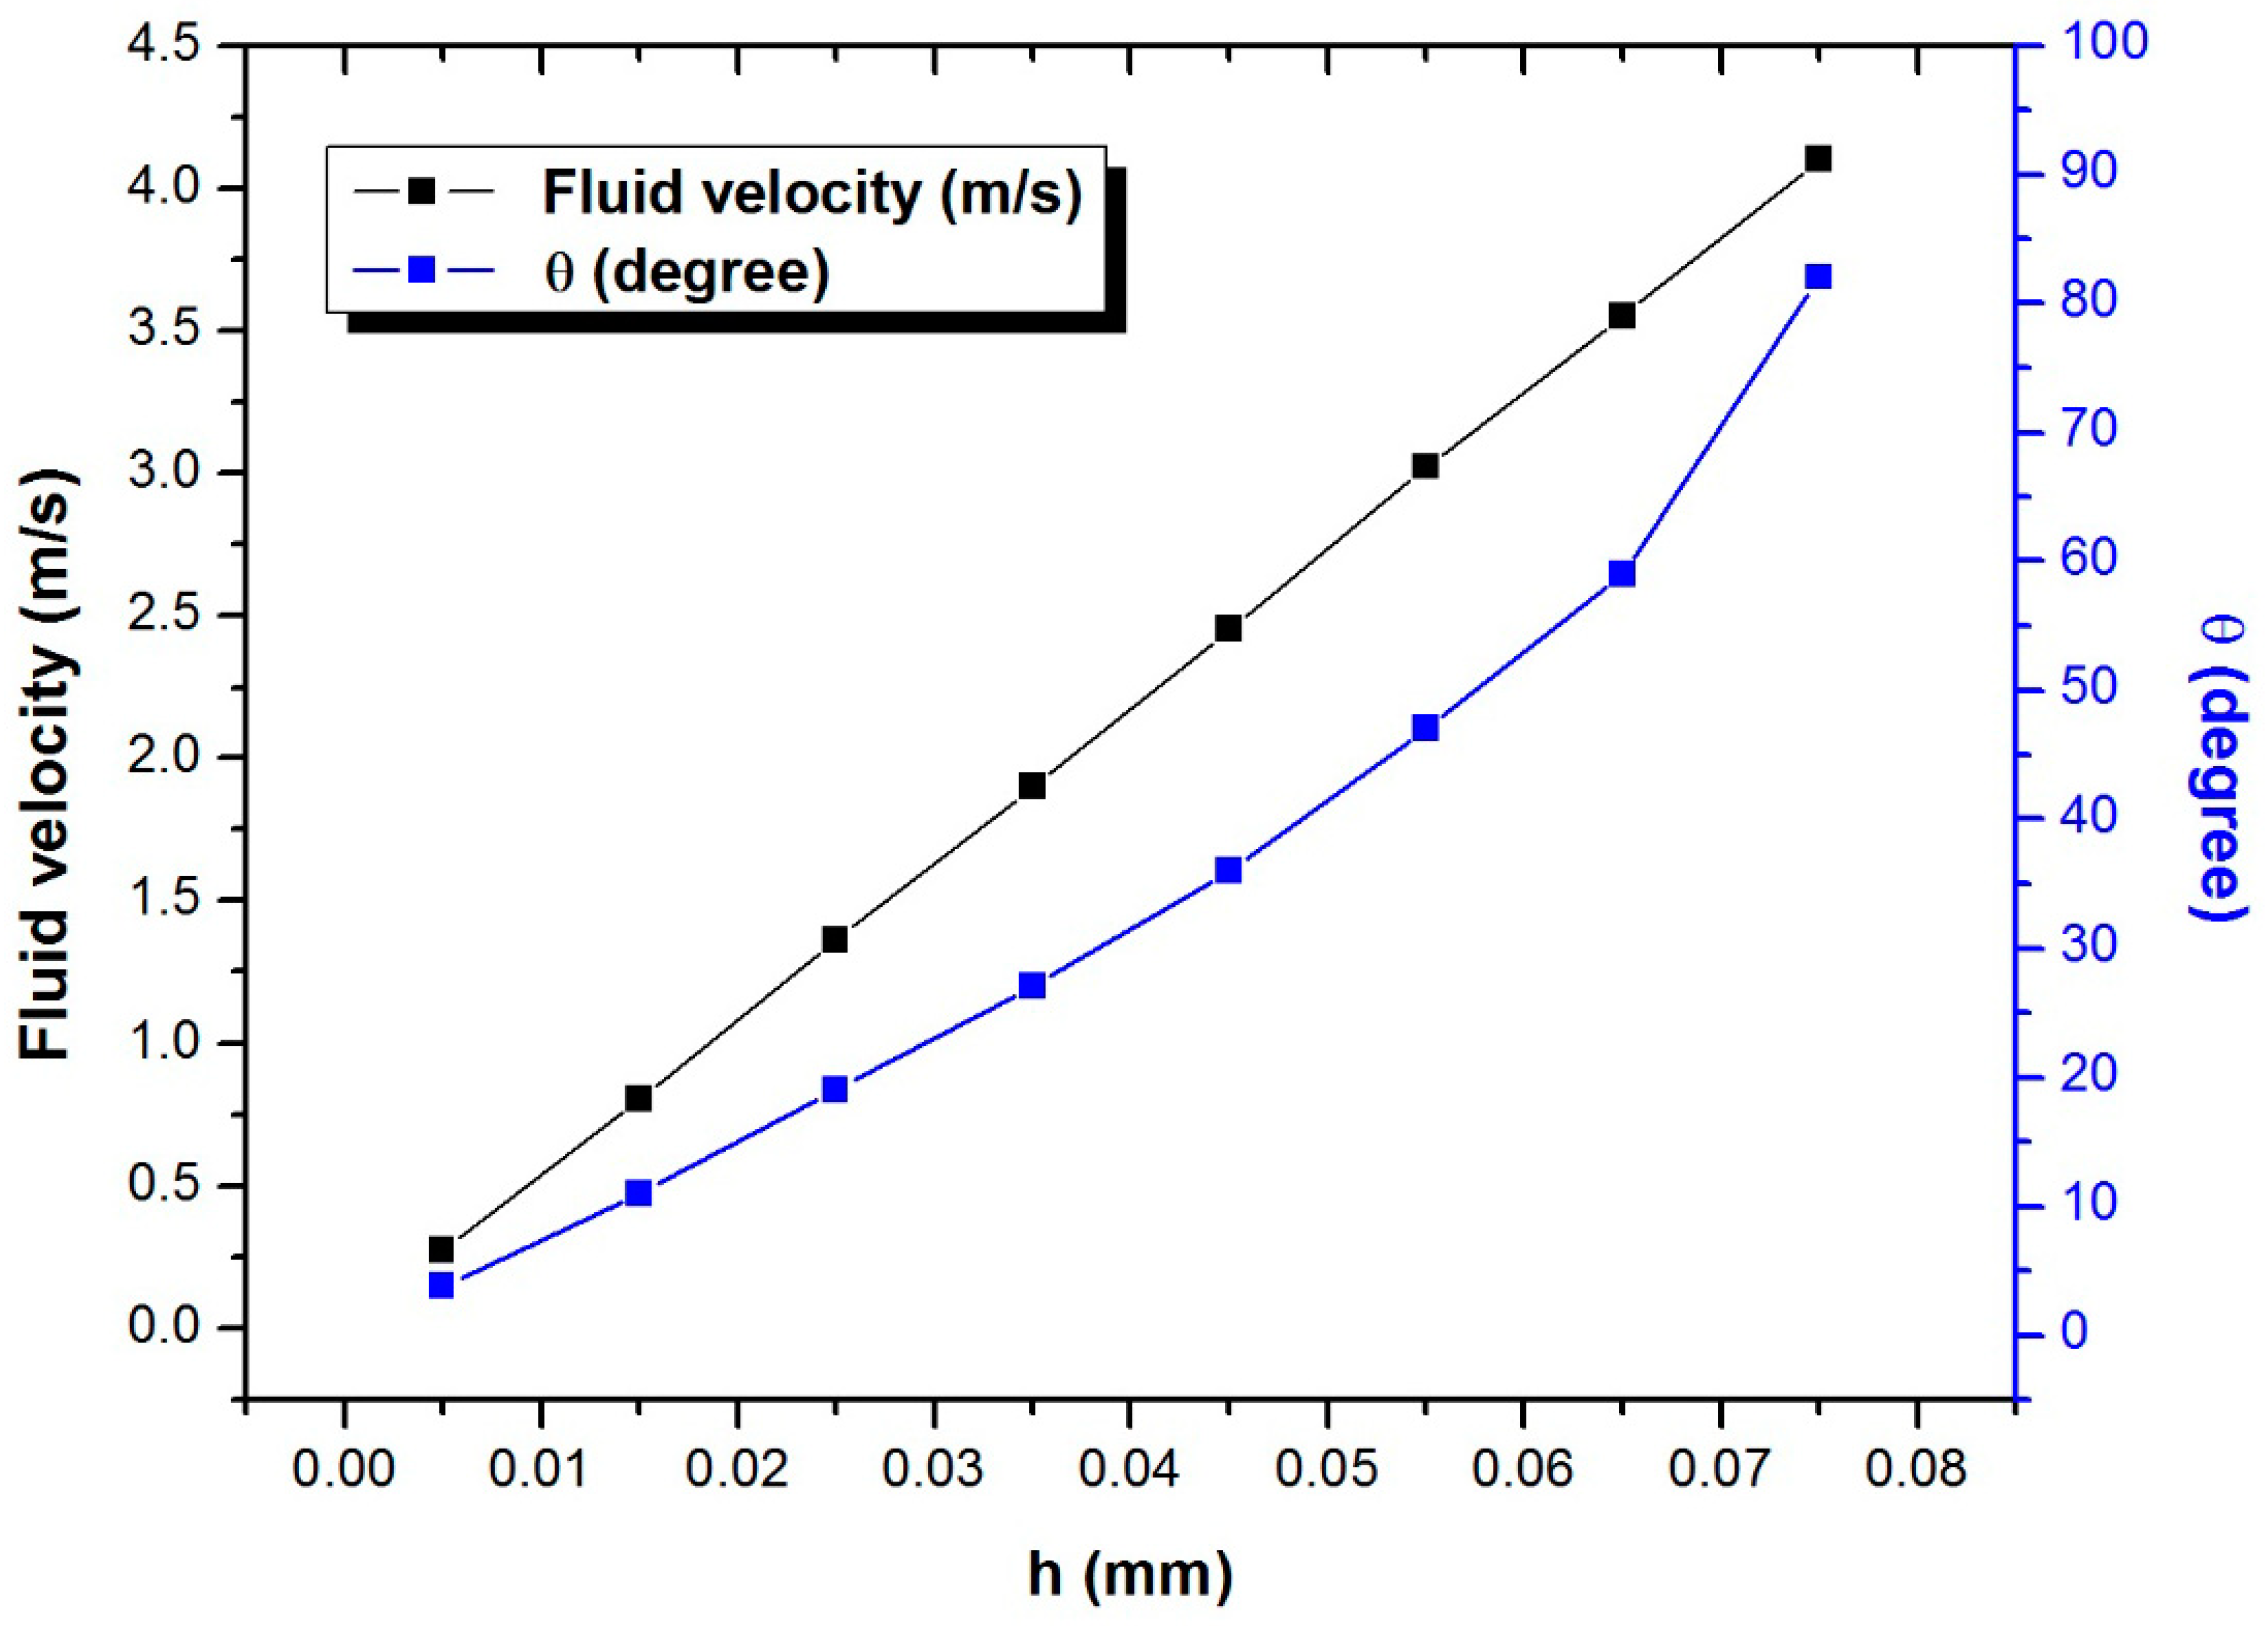
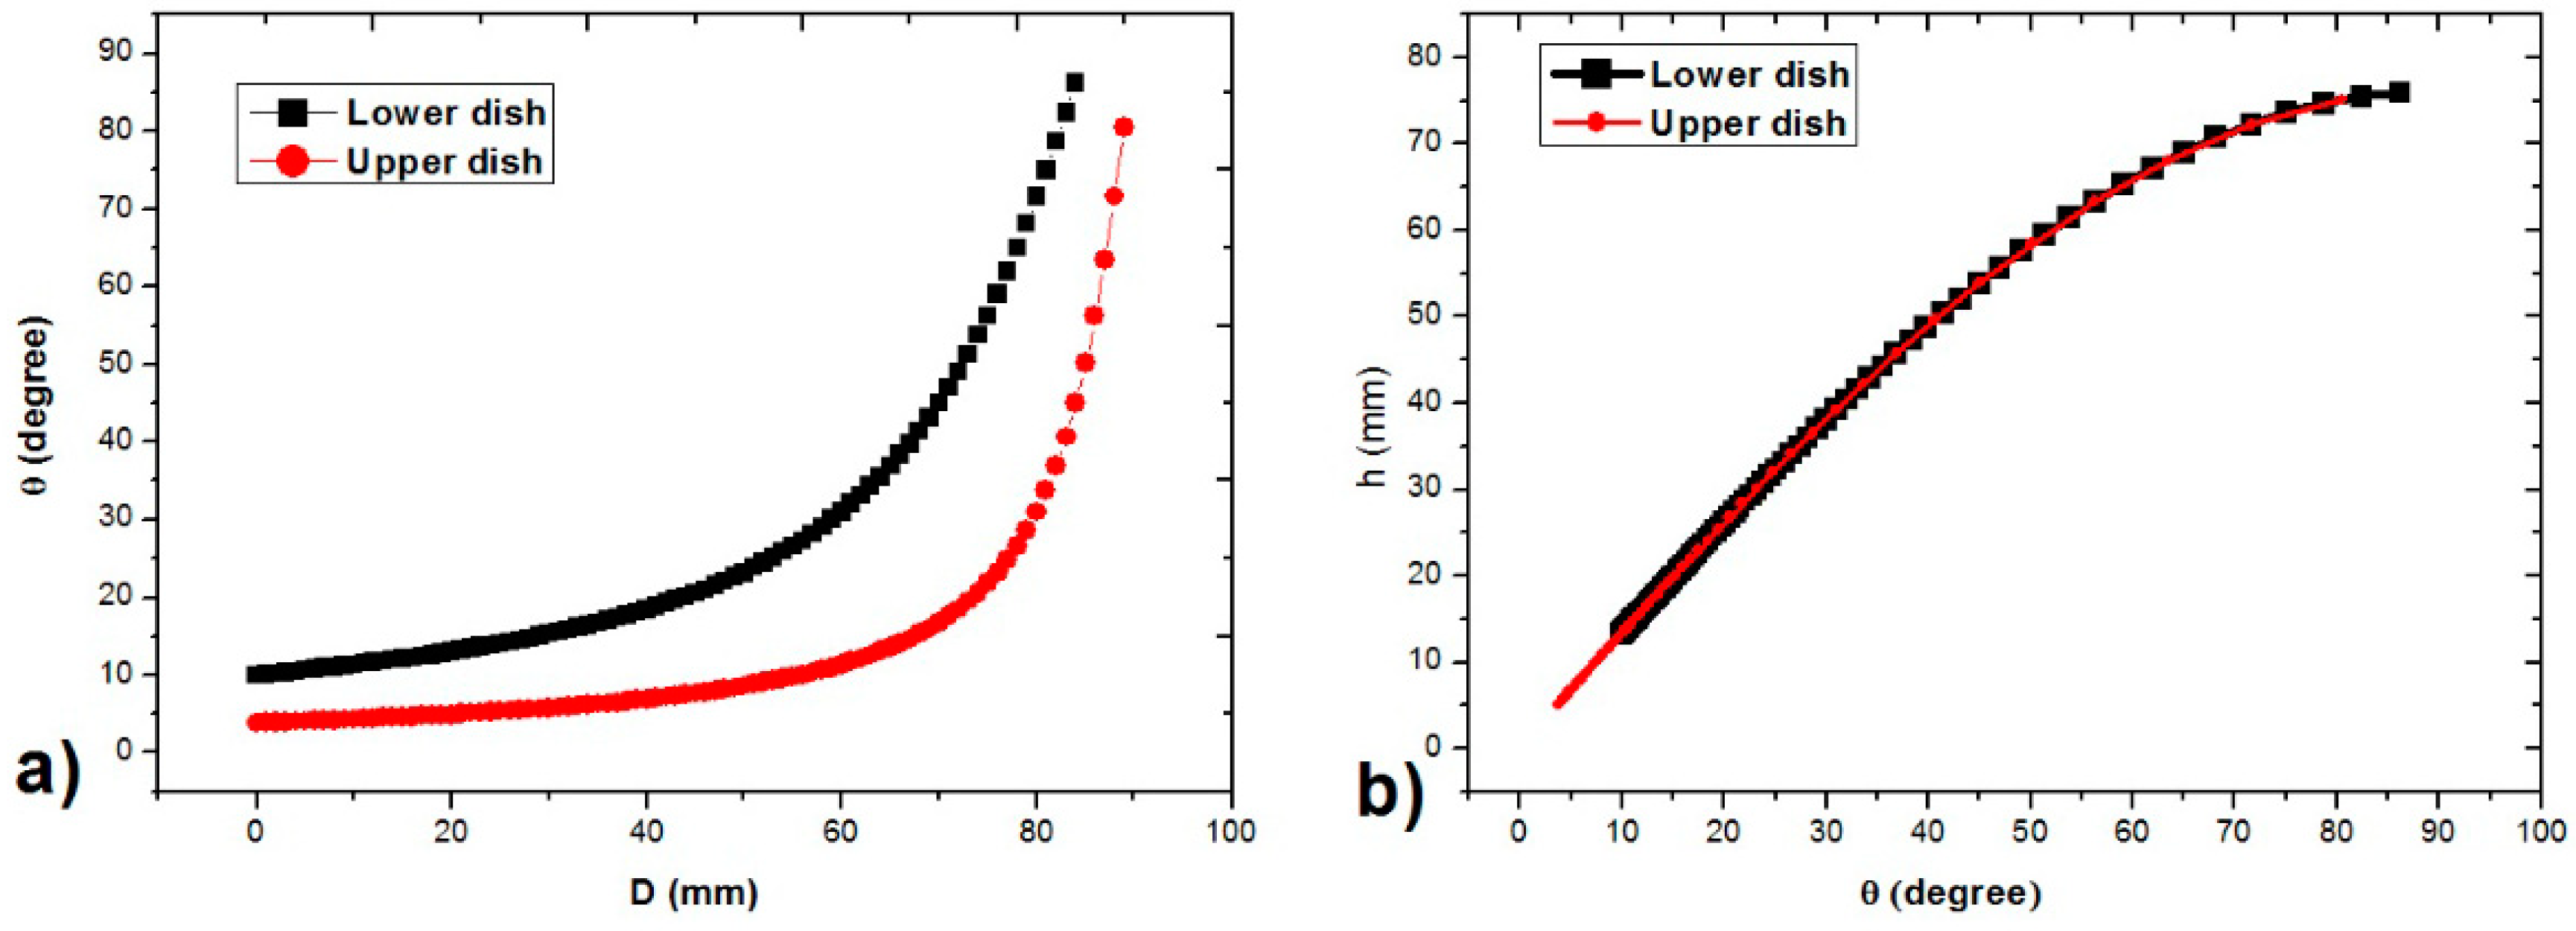
3.1. Characteristics of PP-SCT

As the D is increased, the angle (θ) and the height (h) are also increased. For a standard Petri dish of 90 mm × 15 mm and a 3 × 1-inch microscope glass slide, the scope of operation is shown in Figure 6. When D is increased beyond 50 mm for LD and 60 mm for UD, the θ and h values are increased more significantly. As h is increased, the fluid velocity was increased linearly. The fluid velocity range of around 0.25–4 m/s (a fluid channel of 2 mm width and 100 µm height) were achieved using the PP-SCT technique for the considered design, which can be either increased or decreased depending on the fluid channel design. Figure 7 shows the relationship between height, fluid velocity, and tilt angle. UD can be used for low flow rate applications and LD for high flow rate applications.

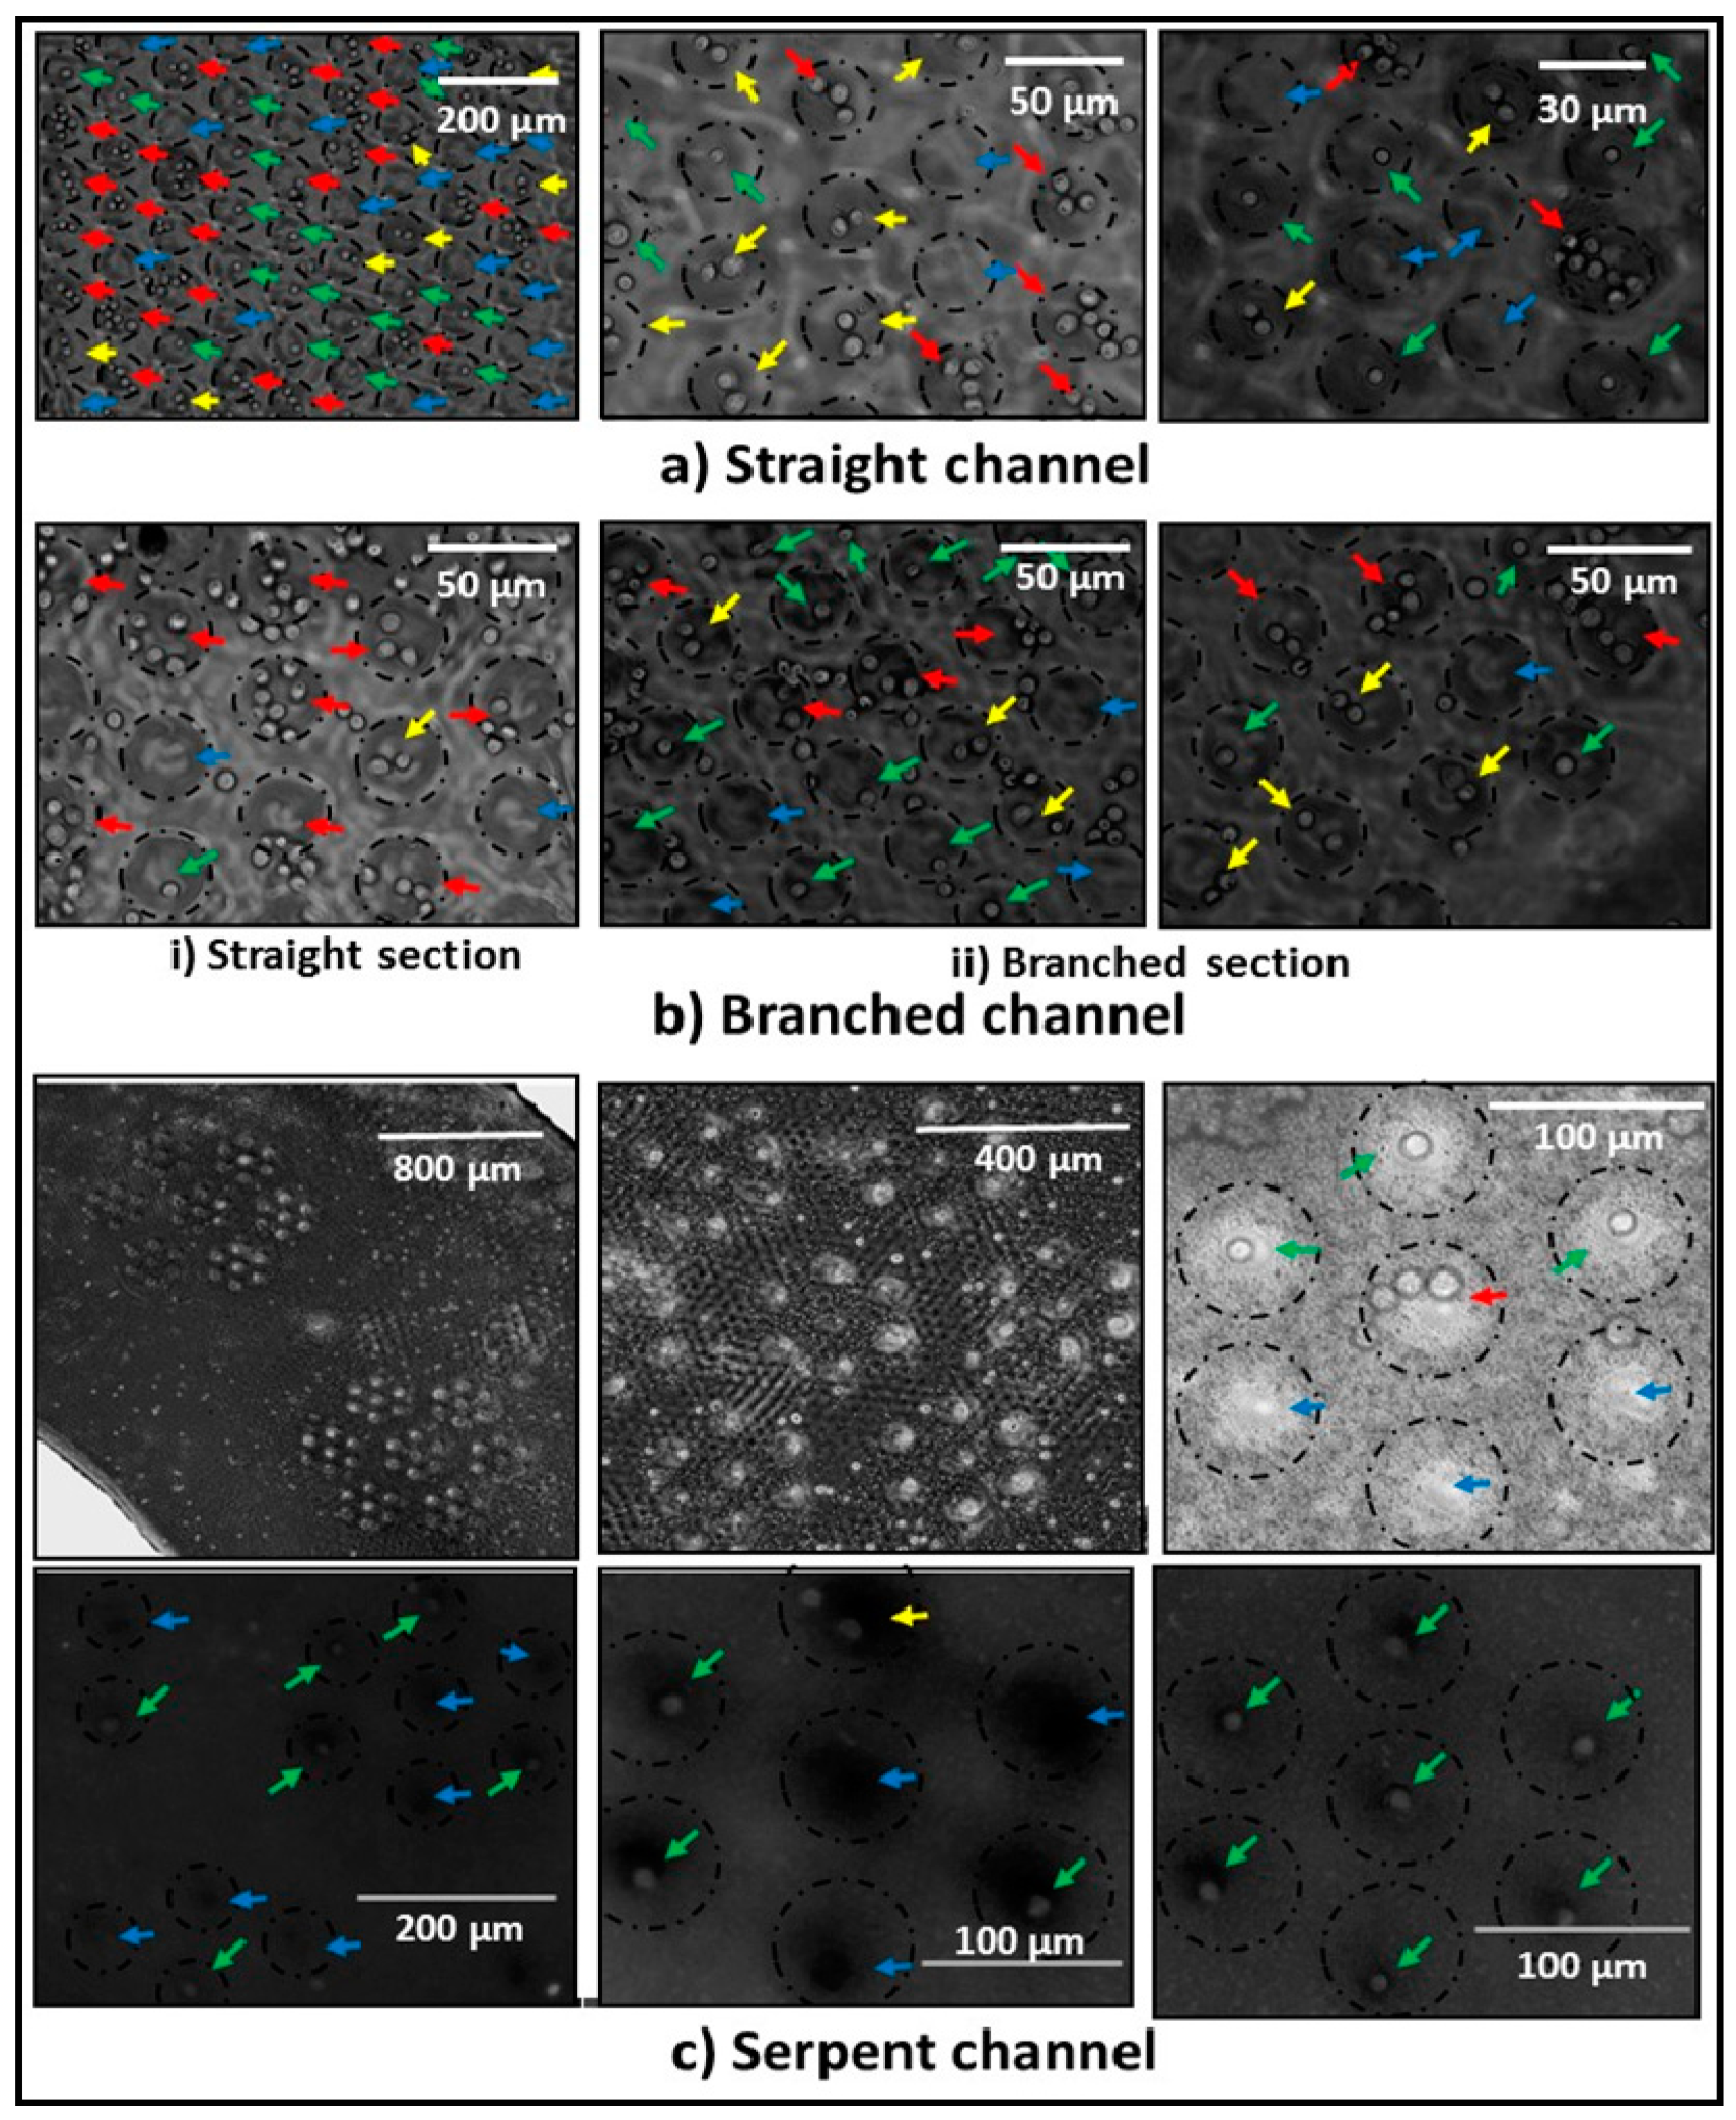
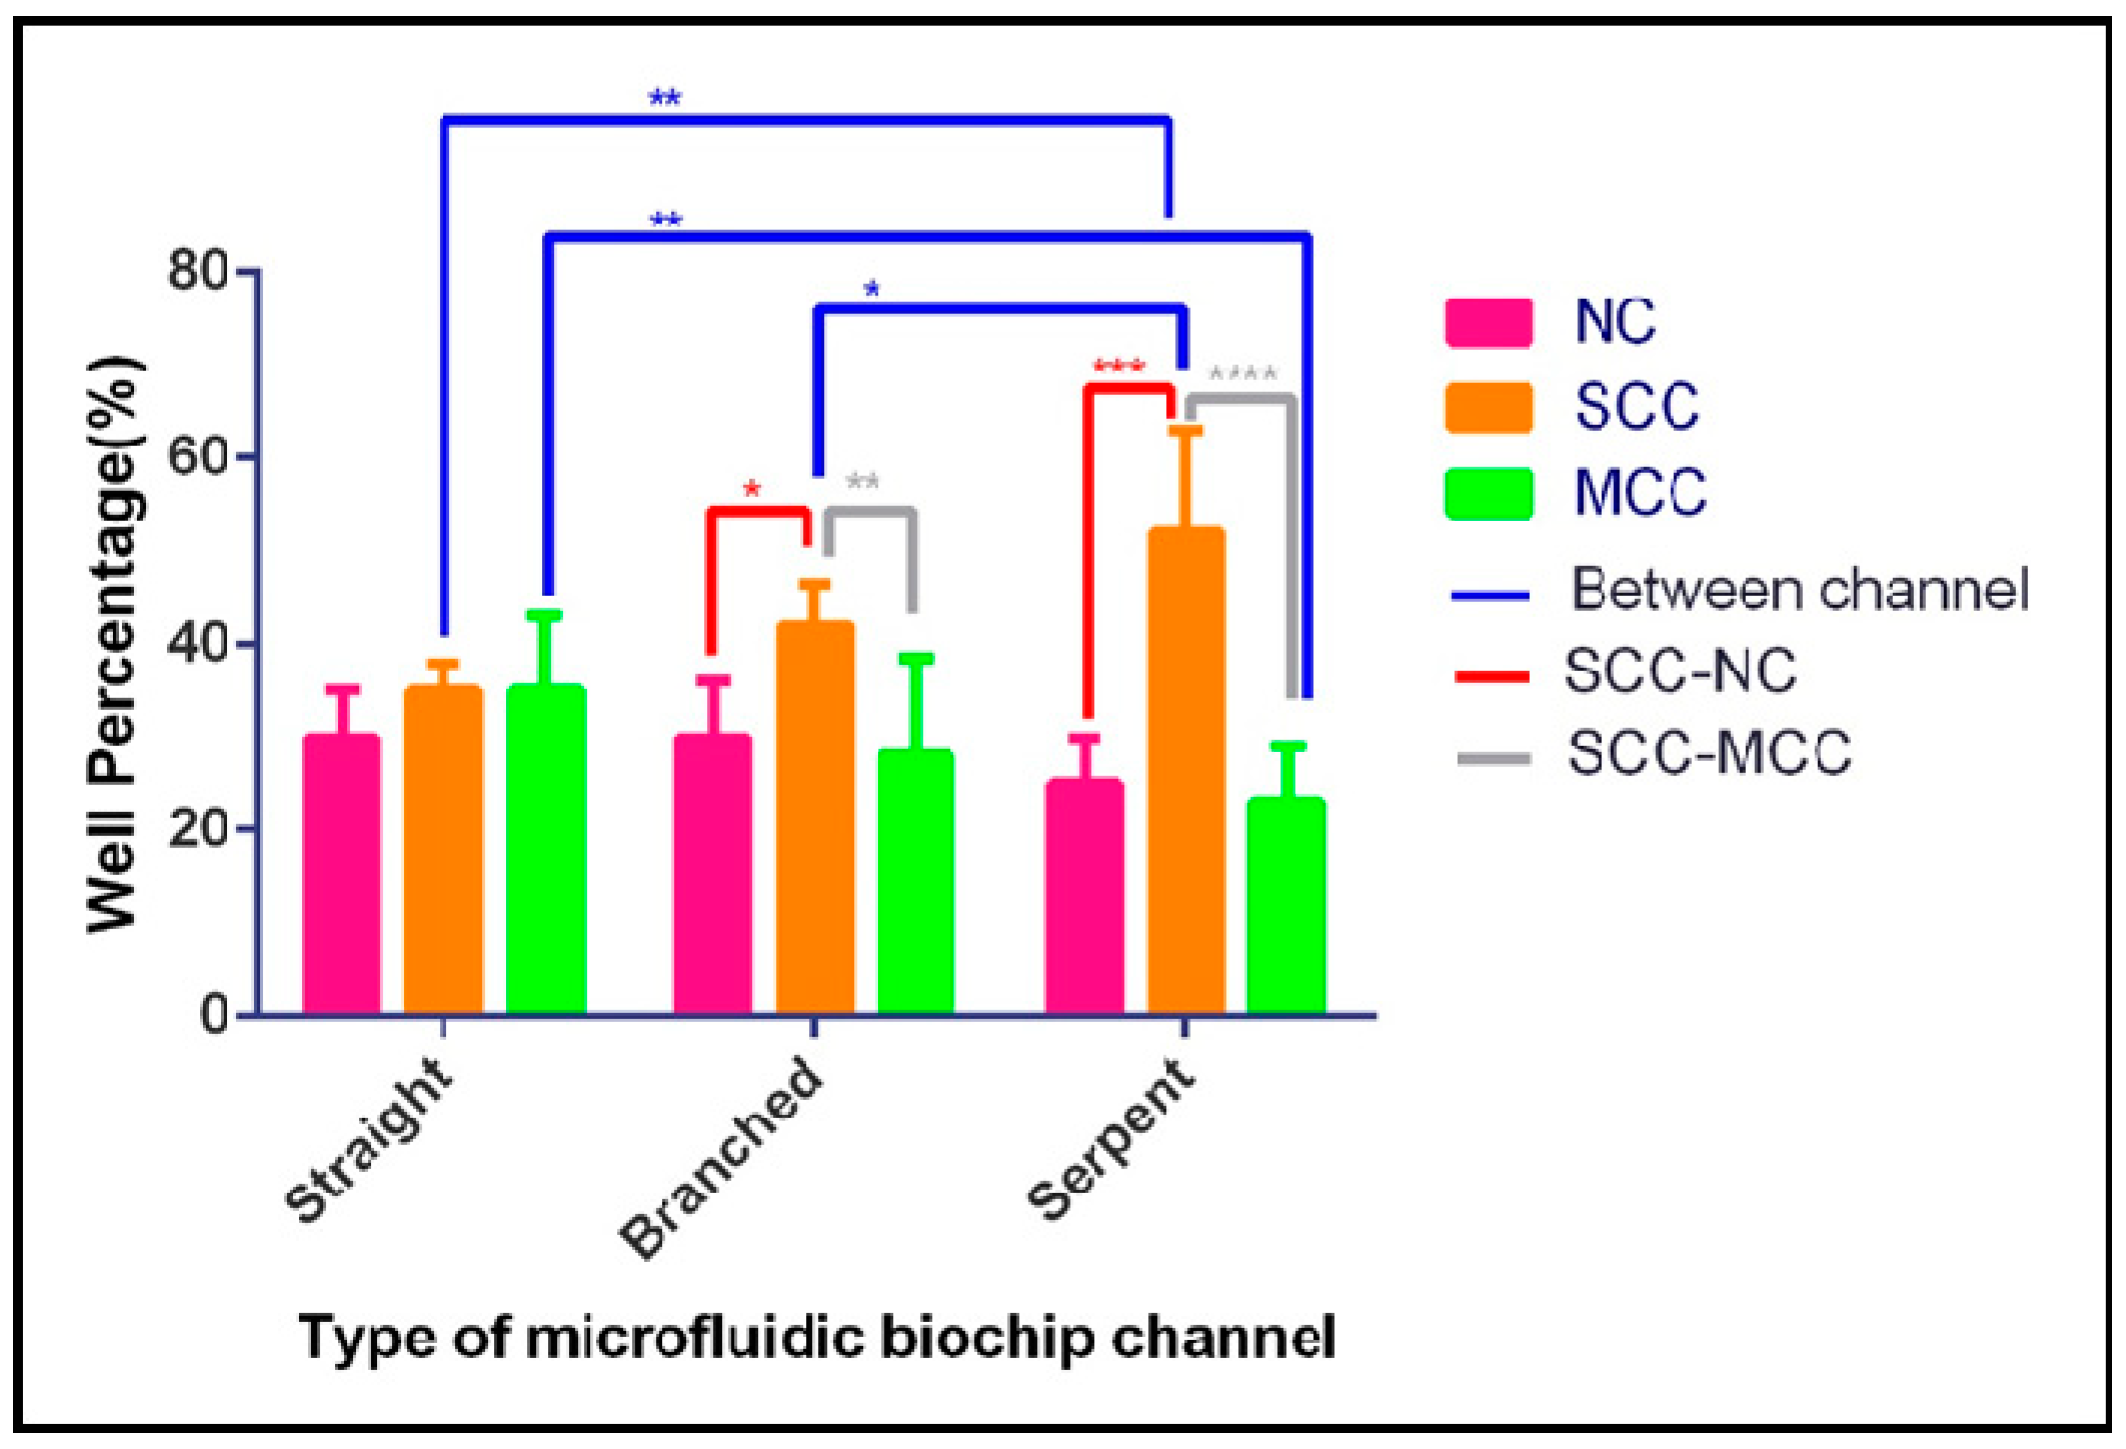
3.2. Single-Cell Trapping and Design Analysis

Streamline plots of three microfluidic channel designs are shown in Figure 8. Flow trajectories are varying in the serpent-shaped channel compared to the other two designs. Observations from three biochip designs reveal that the single-cell trapping was greater in the serpent-shaped biochip followed by the branched channel design and the straight channel design. In the serpent design, SCC was greater and MCC and NC (no capture) were lower when compared to the other two designs (refer to Figure 9 and Figure 10).

3.3. Cell Viability and Single-Cell Fluorescent Measurements

It is evidenced by the results that viable A549 cells were trapped in microwells. The cells observed were shining as the cells did not take up trypan blue (refer to Figure 11a–c). If cells were dead, it would take up the trypan blue. Almost no dead cells were observed. Single-cell fluorescence signals were observed in the demonstrated biochip. The results reveal that the A549 cells had intact morphology. The DAPI (blue) signal from the nucleus and the Rhodamine Phalloidin (red) signal from actin filaments, which holds the cytoskeleton of the cells. These results confirm that the cell shows attachment at the bottom of the microwell for short-term study (refer to Figure 11d,e).

4. Discussion

Conventional approaches involve auxiliary systems supporting microfluidic platforms which add to the complexity, lab space, and cost. Mostly the developed approaches involve experienced handling, and some involve application and exposure to electric fields and magnetic fields. The method which does not require experienced handling is in great demand. PP-SCT can be used in the environment where access to any external force or electric is absent. The biochip consists of four parts: an inlet reservoir where the cell suspension is introduced, the main channel, microwells patterned on the bottom surface of the main channel, and the outlet reservoir. Factors that are most likely to affect the cell occupancy in the PP-SCT technique include: (1) the shape of the channel; (2) the size, positioning, and orientation of microwells; (3) the size of the cells; (4) the cell concentration; (5) the biochip tilt angle; and (6) the glass slide length. These factors are to be considered while designing a hydrodynamic-based microfluidic biochip for high SCC. The scope of the PP-SCT is very wide as it is simple, cost effective, and can be readily implemented for any SCA as it does not require any additional equipment. SC-PPT also provides a varying operational range of controlling the fluid flow rate depending on the tilt angle, without involving any auxiliaries. Further, the PP-SCT technique does not harm the cells, which were evidenced by the viability tests. From the results, it is revealed that the geometry of fluid channels affects the trapping rate and efficiency of the SCC rate. There are more possibilities for trapping multiple cells in the straight and branched channel. This is because when cells travel over any regions of the straight or branched channel, they travel nearly the same distance, speed, and trajectory profile to the well, providing high chances of multiple cells being trapped anywhere in the channel. In the branched channel after the branch section, cell trapping was found to be improved. This is due to the varying trajectory profile at the branched section of the branched channel. On the contrary, the serpent channel with a hexagonally-positioned microwell array provides efficient single-cell trapping possibilities. This is due to varying trajectories of the flow in the channel as shown in the simulation results. This enables the cells to travel in the varying trajectory path with less clumping, thereby providing high SCC with the least MCC. Achieving high SCC with no or minimal NC and MCC is great if that demand can be achieved without involving specialized equipment and no auxiliary equipment would definitely add to the upside. Advantages of using vertical cell trapping when compared to lateral trapping are that the cell analytes can be treated or measured individually without clump analyte measurement. In a vertical well, single-cell analytes are preserved separately for analysis as an analogy to the conventional six-well or 96-well plate. Single-cell fluorescent images reveal that cell morphology was intact, which is suitable for short-term investigation of a single cell. This technique enables the real-time observation of single-cell measurements for analysis. Thus, these observations act as design guidelines for the PP-SCT technique for hydrodynamic-based non-auxiliary biochips in achieving high SCC. The PP-SCT technique can be combined with open tools [41] for further exploration of the single cell analysis, making it accessible and cost effective.

5. Conclusions

This article has demonstrated the PP-SCT technique, along with the design, fabrication, and analysis of a micro-fluid dynamic-based biochip for single-cell trapping. Flow rate variations can be precisely achieved using PP-SCT technique with a flow velocity range of 0.25–4 m/s (with a fluid channel of 2 mm width and 100 µm height). Characterization of three fluid channel shapes for improving SCC was performed. Observations reveal that SCC rates can be improved based on channel shape and orientation of the microwell array. SCC was around 52%, 42%, and 35% for the serpent, branched, and straight channel biochips, respectively. In this investigation it is evident that SCC can be improved significantly, based on the microchannel design, for a fixed cell density, with a similar flow rate without involving any auxiliary systems. This article further paves the way for designing nonauxiliary hydrodynamic-based microfluidics for high SCC with no, or minimal, NC and MCC. Single-cell fluorescence measurements were performed with the biochip. The PP-SCT technique investigated has wide applications in the field of single-cell microfluidic-omics technologies, such as genomics, proteomics, secretomics, and metabolomics. This result can help in designing a passive microfluidic biochip with lateral and vertical microwell arrays for efficient single-cell trapping using the PP-SCT technique. Future directions are to characterize the PP-SCT for the different angles with compatible microfluidic designs for high SCC.

Author Contributions

V.N. and F.S. designed the whole project, performed the experiments, analyzed the results, and wrote the paper. T.P.L. and K.M. contributed to the work of biochip fabrication and reviewing the article. A.Y.F.K., H.A.H., and M.B.B. contributed to the work of cell culture and fluorescence imaging.

Funding

The authors would like to thank and acknowledge the Exploratory Research Grant Scheme by the Ministry of Education, Malaysia (ERGS-MOE RDU120606).

Acknowledgments

The PDF scholarship conferred to V.N. by University Malaysia Pahang is gratefully acknowledged.

Conflicts of Interest

The authors declare no conflict of interest.

Abbreviation

PP-SCTPipette Petri dish single-cell trapping
SCCSingle-cell capture
MCCMultiple-cell capture
NCNo capture
UDUpper dish
LDLower dish
SCASingle cell analysis
PETPolyethylene terephthalate
IPAIsopropyl alcohol
CGMComplete growth media
PBSPhosphate-buffered solution

References

  1. Khoshnoud, F.; de Silva, C.W. Recent advances in mems sensor technology–biomedical applications. IEEE Instrum. Meas. Mag. 2012, 15, 8–14. [Google Scholar] [CrossRef]
  2. Kim, C.-S.; Ahn, S.-H.; Jang, D.-Y. Review: Developments in micro/nanoscale fabrication by focused ion beams. Vacuum 2012, 86, 1014–1035. [Google Scholar] [CrossRef]
  3. Vigneswaran, N.; Samsuri, F.; Ranganathan, B. Recent advances in nano patterning and nano imprint lithography for biological applications. Procedia Eng. 2014, 97, 1387–1398. [Google Scholar] [CrossRef]
  4. Wang, D.; Bodovitz, S. Single cell analysis: The new frontier in ‘omics’. Trends Biotechnol. 2010, 28, 281–290. [Google Scholar] [CrossRef] [PubMed]
  5. Dittrich, P.; Jakubowski, N. Current trends in single cell analysis. Anal. Bioanal. Chem. 2014, 406, 6957–6961. [Google Scholar] [CrossRef] [PubMed] [Green Version]
  6. Navin, N.; Hicks, J. Future medical applications of single-cell sequencing in cancer. Genome Med. 2011, 3, 31. [Google Scholar] [CrossRef] [PubMed] [Green Version]
  7. Wang, Y.; Navin, N.E. Advances and applications of single-cell sequencing technologies. Mol. Cell 2015, 58, 598–609. [Google Scholar] [CrossRef] [PubMed]
  8. Occhetta, P.; Malloggi, C.; Gazaneo, A.; Redaelli, A.; Candiani, G.; Rasponi, M. High-throughput microfluidic platform for adherent single cells non-viral gene delivery. RSC Adv. 2015, 5, 5087–5095. [Google Scholar] [CrossRef] [Green Version]
  9. Fujita, H.; Esaki, T.; Masujima, T.; Hotta, A.; Kim, S.H.; Noji, H.; Watanabe, T.M. Comprehensive chemical secretory measurement of single cells trapped in a micro-droplet array with mass spectrometry. RSC Adv. 2015, 5, 16968–16971. [Google Scholar] [CrossRef]
  10. Sun, H.; Olsen, T.; Zhu, J.; Tao, J.; Ponnaiya, B.; Amundson, S.A.; Brenner, D.J.; Lin, Q. A bead-based microfluidic approach to integrated single-cell gene expression analysis by quantitative rt-pcr. RSC Adv. 2015, 5, 4886–4893. [Google Scholar] [CrossRef] [PubMed]
  11. Whitesides, G.M. The origins and the future of microfluidics. Nature 2006, 442, 368–373. [Google Scholar] [CrossRef] [PubMed]
  12. Rettig, J.R.; Folch, A. Large-scale single-cell trapping and imaging using microwell arrays. Anal. Chem. 2005, 77, 5628–5634. [Google Scholar] [CrossRef] [PubMed]
  13. Di Carlo, D.; Wu, L.Y.; Lee, L.P. Dynamic single cell culture array. Lab Chip 2006, 6, 1445–1449. [Google Scholar] [CrossRef] [PubMed]
  14. Park, J.Y.; Morgan, M.; Sachs, A.N.; Samorezov, J.; Teller, R.; Shen, Y.; Pienta, K.J.; Takayama, S. Single cell trapping in larger microwells capable of supporting cell spreading and proliferation. Microfluid. Nanofluid. 2010, 8, 263–268. [Google Scholar] [CrossRef] [PubMed]
  15. Kobel, S.; Valero, A.; Latt, J.; Renaud, P.; Lutolf, M. Optimization of microfluidic single cell trapping for long-term on-chip culture. Lab Chip 2010, 10, 857–863. [Google Scholar] [CrossRef] [PubMed]
  16. Wang, Y.; Shah, P.; Phillips, C.; Sims, C.E.; Allbritton, N.L. Trapping cells on a stretchable microwell array for single-cell analysis. Anal. Bioanal. Chem. 2012, 402, 1065–1072. [Google Scholar] [CrossRef] [PubMed]
  17. Banaeiyan, A.A.; Ahmadpour, D.; Adiels, C.B.; Goksör, M. Hydrodynamic cell trapping for high throughput single-cell applications. Micromachines 2013, 4, 414–430. [Google Scholar] [CrossRef]
  18. Huang, L.; Chen, Y.; Chen, Y.; Wu, H. Centrifugation-assisted single-cell trapping in a truncated cone-shaped microwell array chip for the real-time observation of cellular apoptosis. Anal. Chem. 2015, 87, 12169–12176. [Google Scholar] [CrossRef] [PubMed]
  19. Ashok, P.C.; Dholakia, K. Optical trapping for analytical biotechnology. Curr. Opin. Biotechnol. 2012, 23, 16–21. [Google Scholar] [CrossRef] [PubMed]
  20. Wu, M.; Singh, A.K. Single-cell protein analysis. Curr. Opin. Biotechnol. 2012, 23, 83–88. [Google Scholar] [CrossRef] [PubMed]
  21. Li, M.; Xu, J.; Romero-Gonzalez, M.; Banwart, S.A.; Huang, W.E. Single cell raman spectroscopy for cell sorting and imaging. Curr. Opin. Biotechnol. 2012, 23, 56–63. [Google Scholar] [CrossRef] [PubMed]
  22. Lee, G.-H.; Kim, S.-H.; Ahn, K.; Lee, S.-H.; Park, J.Y. Separation and sorting of cells in microsystems using physical principles. J. Micromech. Microeng. 2015, 26, 013003. [Google Scholar] [CrossRef]
  23. Johann, R.M. Cell trapping in microfluidic chips. Anal. Bioanal. Chem. 2006, 385, 408–412. [Google Scholar] [CrossRef] [PubMed]
  24. Nilsson, J.; Evander, M.; Hammarström, B.; Laurell, T. Review of cell and particle trapping in microfluidic systems. Anal. Chim. Acta 2009, 649, 141–157. [Google Scholar] [CrossRef] [PubMed]
  25. Lo, S.-J.; Yao, D.-J. Get to understand more from single-cells: Current studies of microfluidic-based techniques for single-cell analysis. Int. J. Mol. Sci. 2015, 16, 16763–16777. [Google Scholar] [CrossRef] [PubMed]
  26. Valizadeh, A.; Khosroushahi, A.Y. Single-cell analysis based on lab on a chip fluidic system. Anal. Methods 2015, 7, 8524–8533. [Google Scholar] [CrossRef]
  27. Shi, Q.; Qin, L.; Wei, W.; Geng, F.; Fan, R.; Shin, Y.S.; Guo, D.; Hood, L.; Mischel, P.S.; Heath, J.R. Single-cell proteomic chip for profiling intracellular signaling pathways in single tumor cells. Proc. Natl. Acad. Sci. USA 2012, 109, 419–424. [Google Scholar] [CrossRef] [PubMed]
  28. Kim, H.S.; Devarenne, T.P.; Han, A. A high-throughput microfluidic single-cell screening platform capable of selective cell extraction. Lab Chip 2015, 15, 2467–2475. [Google Scholar] [CrossRef] [PubMed]
  29. Eyer, K.; Kuhn, P.; Hanke, C.; Dittrich, P.S. A microchamber array for single cell isolation and analysis of intracellular biomolecules. Lab Chip 2012, 12, 765–772. [Google Scholar] [CrossRef] [PubMed]
  30. Shirai, M.; Taniguchi, T.; Kambara, H. Emerging applications of single-cell diagnostics. Top. Curr. Chem. 2012, 336, 99–116. [Google Scholar]
  31. Yi, C.; Li, C.-W.; Ji, S.; Yang, M. Microfluidics technology for manipulation and analysis of biological cells. Anal. Chim. Acta 2006, 560, 1–23. [Google Scholar] [CrossRef]
  32. Kim, S.M.; Lee, S.H.; Suh, K.Y. Cell research with physically modified microfluidic channels: A review. Lab Chip 2008, 8, 1015–1023. [Google Scholar] [CrossRef] [PubMed]
  33. Bhagat, A.A.S.; Bow, H.; Hou, H.W.; Tan, S.J.; Han, J.; Lim, C.T. Microfluidics for cell separation. Med. Biol. Eng. Comput. 2010, 48, 999–1014. [Google Scholar] [CrossRef] [PubMed]
  34. Burger, R.; Ducrée, J. Handling and analysis of cells and bioparticles on centrifugal microfluidic platforms. Expert Rev. Mol. Diagn. 2012, 12, 407–421. [Google Scholar] [CrossRef] [PubMed]
  35. Cetin, B.; Özer, M.B.; Solmaz, M.E. Microfluidic bio-particle manipulation for biotechnology. Biochem. Eng. J. 2014, 92, 63–82. [Google Scholar] [CrossRef]
  36. Karimi, A.; Yazdi, S.; Ardekani, A. Hydrodynamic mechanisms of cell and particle trapping in microfluidics. Biomicrofluidics 2013, 7, 021501. [Google Scholar] [CrossRef] [PubMed]
  37. Batchelor, G.K. An Introduction to Fluid Dynamics; Cambridge University Press: Cambridge, UK, 1967; Volume 515, p. 13. [Google Scholar]
  38. Stokes, G.G. On the Effect of the Internal Friction of Fluids on the Motion of Pendulums; Pitt Press: Pittsburgh, PA, USA, 1851; Volume 9. [Google Scholar]
  39. Reynolds, O. An experimental investigation of the circumstances which determine whether the motion of water shall be direct or sinuous, and of the law of resistance in parallel channels. Proc. R. Soc. Lond. 1883, 35, 84–99. [Google Scholar] [CrossRef]
  40. Lee, T.P.; Mohamed, K. 3D Microfabrication Using Emulsion Mask Grayscale Photolithography Technique; IOP Conference Series: Materials Science and Engineering; IOP Publishing: Bristol, UK, 2016; p. 012032. [Google Scholar]
  41. Kuznetsov, S.; Doonan, C.; Wilson, N.; Mohan, S.; Hudson, S.E.; Paulos, E. Diybio things: Open source biology tools as platforms for hybrid knowledge production and scientific participation. In Proceedings of the 33rd Annual ACM Conference on Human Factors in Computing Systems, Seoul, Korea, 18–23 April 2015; ACM: New York, NY, USA, 2015; pp. 4065–4068. [Google Scholar]
Figure 1. (a,b) Illustration of pipette Petri dish single-cell trapping (PP-SCT); (c,d) shows the side and top view, respectively, where θ is the tilt angle, h is the height of the inlet, D is the distance between biochip outlet side edge to the Petri dish wall along the diameter, and Sl is glass slide length.
Fluids 03 00051 g001
Figure 2. Fluid channel shapes (a) straight channel; (b) branched channel, and (c) serpent-shaped channel.
Fluids 03 00051 g002
Figure 3. (a) Shows the varying operational position using the PP-SCT technique; (b) shows the relation between the angles of elevation to the inlet elevations (height), and height follows the sine wave with respect to the angle.
Fluids 03 00051 g003
Figure 4. Illustration of the grayscale photolithography process.
Fluids 03 00051 g004
Figure 5. (a) Fabricated biochips; (b) biochip scale with a Malaysian 50 sen coin used as a reference; and (c) a microwell array on the fabricated biochip, images taken from an infinite focus measurement system (ALICONA, Graz, Austria).
Fluids 03 00051 g005
Figure 6. (a) Graph plot showing the relationship between D and θ; (b) a graph showing the relationship between θ and h. This shows the scope of the operation of the lower and upper dish.
Fluids 03 00051 g006
Figure 7. Graph plot showing the relationship between h, θ, and fluid velocity. Fluid velocity was obtained from the simulation study corresponding to the 2 mm fluid channel with a 100 µm height.
Fluids 03 00051 g007
Figure 8. Streamline flow velocity profile in three fluid channels, the inset shows the close-up view of (a) the straight channel, (b) the branched channel, and (c) the serpent-shaped channel.
Fluids 03 00051 g008aFluids 03 00051 g008b
Figure 9. Trapped A549 cells in (a) the straight channel design; (b-i) the straight section in the branched channel design; (b-ii) the side-branched section in the branched channel design, and (c) serpent channel design. The blue arrow points to no capture, the green arrow points to SCC, the yellow arrow points to dual-cell capture, and the red arrow points to three or more cell captures. The dotted black circles were just for clarity; it did not resemble the exact scale of the biochip.
Fluids 03 00051 g009
Figure 10. Cell trapping capabilities of three channel designs with the comparison of NC, SCC, and MCC based on the study conducted. Mean and SD were plotted from five independent repeated experiments. ANNOVA analysis was done within each design to find the significant parameters and two-way ANNOVA analysis was done comparing the designs to find the significant parameters. It can be seen that in the serpent design NC and MCC are the least, and SCC is the maximum in comparison to the others.
Fluids 03 00051 g010
Figure 11. (ac) shows the cell viability test (cells did not take up the trypan blue) on the straight channel, branched channel, and serpent channel, respectively; (d) the fluorescence signal from the nucleus (DAPI) of single cells being captured in the serpent channel; and (e) single-cell cytoskeleton (fluorescence image) after 3 h of incubation from loading to the serpent channel biochip, showing the blue signal from the nucleus (DAPI) and red from the actin (Rhodamine Phalloidin).
Fluids 03 00051 g011
Table 1. Properties, constants, and boundary conditions used for the simulation.
ComponentsPropertyValue/Equation
Fluid (water)Dynamic Viscosity (mu)8.90 × 10⁻⁴ (Pa·s)
Density (rho)997 (kg/m3)
ChannelChannel Surface RoughnessGlass (0.0015 mm)
Initial ValuesPressure101,325 (Pa)
Tangential Velocity0 m/s
Volume Forcex0 (N/m3)
y(−g_const) * pfl.rho (N/m3)
PressureInlet101,325 (Pa)
Outlet101,325 (Pa) + (5(mm)) * g_const * pfl.rho
pfl is the fluid flow physics model in Comsol, g_const is the gravitational constant, * indicates the multiplication and . indicates model based properties used in Comsol.

