Article

A Study on the Optimization and Sensitivity Analysis of Cuttings Transport in Large-Diameter Boreholes

1
CNPC Engineering Technology R&D Company Limited, Beijing 102206, China
2
Petro China Southwest Oil & Gasfleld Company, Chengdu 610057, China
3
College of Petroleum Engineering, Northeast Petroleum University, Daqing 163318, China
*
Author to whom correspondence should be addressed.
Fluids 2025, 10(8), 187; https://doi.org/10.3390/fluids10080187
Submission received: 16 June 2025 / Revised: 7 July 2025 / Accepted: 21 July 2025 / Published: 22 July 2025
(This article belongs to the Special Issue Digital Technologies for Oil Recovery and Sustainability)

Abstract

In the drilling process of ultra-deep wells with large-diameter boreholes, the transport and deposition behavior of cuttings plays a critical role in maintaining wellbore cleanliness and ensuring operational safety. Due to the geometry of enlarged boreholes and their complex annular flow characteristics, conventional single-parameter control methods often fail to achieve effective cuttings transport. This study aims to identify the dominant influencing factors and optimize key parameters by focusing on the cuttings volume fraction as a primary evaluation metric. A numerical simulation approach is employed to systematically investigate the influence of stabilizer geometry and hydraulic parameters. Five variables—drilling fluid velocity, drill pipe rotational speed, number of stabilizers, flow area, and helical angle—are selected for analysis. An initial one-factor sensitivity analysis is conducted to evaluate local impacts and to establish relative sensitivity indices, thereby identifying key variables. A variance-based global sensitivity analysis is further applied to quantify first-order effects, full-order effects, and interaction contributions, revealing nonlinear coupling and synergistic mechanisms. The results indicate that drilling fluid velocity and rotation speed exhibit the most significant first-order influences, while stabilizer-related parameters show strong interaction effects that are often underestimated by traditional methods. Based on these findings, an optimized cuttings transport scheme for large-diameter boreholes is proposed. Additionally, a multi-parameter response model for the cuttings volume fraction is developed using sensitivity-weighted analysis, offering theoretical support and methodological reference for enhancing cuttings transport performance and structural design in large-diameter borehole drilling operations.

1. Introduction

With the advancements in deep-earth energy development strategies, the exploration and development of ultra-deep oil and gas resources—exceeding 10,000 m—have gradually become a major focus in the petroleum industry. As a critical approach to accessing unconventional resources and breaking through deep drilling limits, the construction of 10,000 m ultra-deep wells faces unprecedented technical challenges. Compared with conventional deep wells, ultra-deep wells must endure greater depths, higher formation pressures, and elevated temperatures. Furthermore, large-diameter borehole sections, due to their significantly larger hole size and more complex annular geometry, lead to a marked decline in cuttings transport efficiency and more severe deposition problems. Extensive field practices and laboratory investigations [1] have demonstrated that cuttings accumulation is one of the primary barriers to effective wellbore cleaning in ultra-deep drilling. The continuous buildup of settled cuttings obstructs effective drilling fluid circulation and can induce a series of downhole complications such as bit balling, bottom-hole annular blockage, pump pressure fluctuations, and abnormal pressure drops, severely compromising the continuity and stability of the drilling process.
More critically, insufficient cuttings removal significantly increases rotary torque and drag on the drill string, thereby elevating the risk of downhole incidents such as stuck pipes, twist-off, and adhesion. Excessive cuttings buildup can also hinder subsequent operations—such as logging, cementing, and completion—leading to degraded service quality and even costly rework, which, in turn, increases overall operational risks and project costs. Therefore, thoroughly understanding the physical mechanisms governing cuttings transport and deposition in large-diameter annuli, identifying key control parameters and their coupling interactions, and developing a systematic methodology for prediction and optimization have become core scientific challenges in advancing ultra-deep drilling technology. In particular, under conditions involving strong multivariable coupling and large-scale, non-uniform annular flows, traditional single-factor control strategies and empirical design approaches are no longer adequate for ensuring efficient cuttings transport and safe drilling. There is an urgent need for mechanism-driven theoretical studies and multi-parameter collaborative optimization.
In recent years, research on the mechanisms of cuttings transport in drilling annuli has deepened, with methodologies evolving from traditional theoretical models and physical experiments to Computational Fluid Dynamics–Discrete Element Method (CFD-DEM)-based multiphase flow numerical simulations, which offer effective tools for predicting cuttings behavior under complex conditions. Early studies primarily employed empirical formulas, theoretical analysis, and laboratory testing to evaluate the effects of parameters such as hole size, drilling fluid velocity, rate of penetration (ROP), and drill pipe rotational speed on wellbore cleaning and cuttings deposition. On the experimental front, researchers used transparent annular visualization setups or scaled-down physical models to observe the cuttings trajectory, deposition, and suspension characteristics [2,3]. From a theoretical perspective, particle mechanics models and settling dynamics frameworks were developed to quantitatively assess transport capacity and critical deposition conditions.
Therefore, to accurately simulate the cuttings transport process in large-diameter annuli, several numerical methods are commonly used to model solid–liquid multiphase flows, each with distinct advantages and limitations. The main approaches include the following: The Eulerian two-fluid model (TFM) treats both phases as interpenetrating continua and is computationally efficient in simulating large-scale flows with high particle concentrations, such as cuttings transport in drilling, although it lacks particle-scale resolution. CFD-DEM coupling provides detailed particle interaction modeling by combining continuum fluid flow with discrete particle tracking, but its high computational cost limits its scalability. Smoothed Particle Hydrodynamics (SPH) is a mesh-free, fully Lagrangian method that is well suited for free-surface and large-deformation problems, although it often struggles with accuracy near boundaries in dense suspensions. The Lattice Boltzmann Method (LBM) offers excellent parallelizability and handles complex boundaries effectively but faces challenges in stability and large-scale implementation for annular drilling flows. Considering the computational demands, applicability to continuous suspension flows, accuracy, and existing validation studies, the Eulerian two-fluid model was selected in this study. It offers a balance between computational efficiency and physical fidelity for capturing the bulk transport characteristics of cuttings in the annulus.
Among various influencing factors, drilling parameters (e.g., drilling fluid velocity, drill string rotation speed) and the downhole tool structure (e.g., stabilizer configuration) have been identified as key regulators of cuttings transport behavior [4]. In particular, stabilizers—as critical components for directional control and well trajectory stabilization—affect both the stability of the drill string and the local annular flow field. Their number, spacing, blade count, and flow area directly impact the local flow distribution and cuttings trajectory [5]. Previous studies have shown that stabilizer placement, flow area, cuttings size, and rotation status significantly affect the wellbore cleaning efficiency [6]. However, most existing studies still focus on single-factor analysis, lacking systematic evaluations under multi-parameter coupling conditions. The synergistic mechanisms by which stabilizer parameters influence cuttings transport remain unclear, limiting the ability to optimize tool designs and transport strategies under ultra-deep, complex conditions.
Despite existing progress in understanding cuttings transport mechanisms, several critical challenges remain: (1) Most research relies on single-factor analyses and lack a multi-parameter coupling framework. The existing literature primarily uses the controlled variable method to analyze how factors such as drilling fluid velocity, rotation speed, and stabilizer geometry affect cuttings transport but without revealing the nonlinear coupling and interdependencies among them, making systematic parameter optimization difficult; (2) There is a lack of quantitative indices for parameter importance and a well-established sensitivity evaluation system. In complex multi-parameter systems, it is difficult to identify key control variables, leading to unclear optimization paths, experience-dependent parameter tuning, and low efficiency; (3) The predictive modeling of the cuttings volume fraction remains incomplete. Existing models fail to fully incorporate multivariable characteristics, parameter interactions, and predictive accuracy, limiting their applicability in real-world drilling engineering.
In response, this study focuses on the cuttings transport process in large-diameter sections of 10,000 m ultra-deep wells. Taking the cuttings volume fraction as the key performance indicator, five critical control variables—drilling fluid velocity, drill string rotation speed, stabilizer number, blade count, and helical angle—are selected. A numerical simulation approach is employed to systematically conduct multi-parameter sensitivity and optimization analysis. By introducing both single-factor sensitivity analysis and variance-based global sensitivity analysis [7,8], a hybrid sensitivity evaluation framework is constructed that integrates local response analysis with global parameter importance identification. This enables simultaneous exploration of the multi-parameter space and accurate modeling of the cuttings response. The study quantifies local and global effects of each parameter on the cuttings volume fraction, reveals the underlying mechanisms of structural and flow parameter influence, and identifies nonlinear coupling and synergistic effects. A multi-parameter response surface model of the cuttings volume fraction is further developed. The goal is to establish a robust, physically consistent optimization framework that can guide field applications in ultra-deep well drilling, particularly in scenarios where flow rate enhancement alone is constrained.

2. Methodology

2.1. Mathematical Models

This study employs the Eulerian two-fluid method to simulate the two-phase flow of drilling fluid and cuttings within the annulus. In this approach, the drilling fluid and cuttings are treated as two continuous and interacting phases, with separate continuity and momentum equations established for each phase to accurately capture the dynamics and interactions between them. For the drilling fluid and cuttings within the annulus [9], the continuity and momentum equations are respectively established for each phase [10,11].
Continuity equation:
α l ρ l t + α l ρ l u l = 0
α s ρ s t + α s ρ s u s = 0
Momentum equation:
α l ρ l u l t + α l ρ l u l u l = α l p + α l τ + α l ρ l g β v l v s
α s ρ s u s t + α s ρ s u s u s = α s p p s + α s τ + α s ρ s g + β v 1 v s
In the equations, the subscripts l and s denote the drilling fluid and cuttings, respectively; α represents the volume fraction; ρ is the density in g/cm3; u is the velocity vector; p is the pressure in Pa; ps is the solid phase pressure in Pa; τ is the stress tensor in N/m2; g is the gravitational acceleration in m/s2; and β is the interphase momentum transfer coefficient.
The expression for the solid phase pressure ps is given as [12]:
p s = α s ρ s Θ s + 2 ρ s ( 1 + e s s ) α s 2 g 0 , s s Θ s
In the equation, ess denotes the coefficient of restitution for particle collisions; Θs represents the granular temperature in m2/s2; and g0,ss is the radial distribution function, which is expressed as follows:
g 0 , s s = 1 α s α s , max 1 3 1
The expression for the granular temperature Θs is given as follows:
Θ s = 1 3 u s , i u s , i
In the dual-phase model, the solid-phase viscosity is composed of collisional viscosity, kinetic viscosity, and frictional viscosity [13,14]:
μ s = μ s , c o l + μ s , k i n + μ s , f r
The expressions for the collisional viscosity μs,col, motion viscosity μs,kin, and friction viscosity μs,fr are given as follows:
μ s , c o l = 4 5 α s ρ s d s g 0 , s s 1 + e s s Θ s π 1 / 2 α s
μ s , k i n = 10 ρ s d s Θ s π 96 α s 1 + e s s g 0 , s s 1 + 4 5 g 0 , s s α s 1 + e s s 2 α s
μ s , f r = p s sin ϕ 2 I 2 D
Within the formulas, ds represents the particle diameter in meters.
Volume viscosity characterizes the dissipative resistance encountered by granular materials when undergoing volumetric deformation, such as compression or dilation, during transport processes. This parameter plays a crucial role in describing the energy dissipation associated with particle-phase compressibility in dense suspensions. As formulated by Lun et al. [15], the mathematical representation of volume viscosity is given by
λ S = 4 3 α S 2 ρ S d s g 0 , s s 1 + e s s Θ S π 1 / 2
To evaluate the interphase momentum transfer between the solid and liquid phases, the Huilin–Gidaspow model [16] is employed. This approach effectively blends the Ergun equation with the Wen–Yu correlation to capture a broad range of flow regimes. The corresponding expression is formulated as
β Huilin - Gidaspow = φ β Ergun + ( 1 φ ) β Wen & Yu
φ = arctan 262.5 α s - 0.2 π + 0.5
When α 1 0.8 ,
β Ergun   = 150 α s 1 α 1 μ 1 α 1 d s 2 + 1.75 ρ 1 α s u s u 1 d s
When α 1 > 0.8 ,
β Wen & Yu = 3 4 C D α s α 1 ρ 1 u s - u 1 d s α 1 - 2.65
The drag coefficient CD is calculated as follows [17]:
C D = 24 R e s 1 + 0.15 R e s 0.687 R e s 1000 0.44 R e s > 1000
The particle Reynolds number Res is defined as [18]:
R e s = ρ 1 d s u s u 1 μ 1
The stress tensor expressions for insoluble sediments and brine are as follows:
τ l ¯ ¯ = μ l u l + u l T 2 3 u l I ¯ ¯
τ s ¯ ¯ = μ s u s + u s T + ζ s 2 3 μ s u s I ¯ ¯
In the equation, I represents the unit vector; μl and μs are the fluid viscosity and shear viscosity, respectively, in Pa·s; and ζs is the solid-phase volume viscosity in Pa·s.

2.2. Model Structure and Boundary Conditions

To accurately simulate the fluid–cuttings coupling behavior during cuttings transport in large-diameter wellbores, a three-dimensional concentric annular geometry was established, comprising the drill pipe, stabilizers, and borehole wall. The computational domain was constructed based on field parameters from ultra-deep well operations [19,20], ensuring both representativeness and engineering relevance. The total model length was set to 24 m, with a borehole inner diameter of 400 mm and a drill pipe outer diameter of 137 mm. The annular dimensions closely approximate those typically encountered in large-hole sections of ultra-deep wells, effectively capturing the primary characteristics of cuttings transport under deep well conditions.
To investigate the influence of stabilizers on local flow disturbance and cuttings transport trajectories, the blade helical angle (α) was selected as a key control variable in the model. The helical angle is defined as the ratio of the helical pitch P to the unwrapped length of the helical path abc, i.e., α = arctan P 2 π R , as illustrated in Figure 1. Stabilizers with three, four, and five-blade configurations were modeled, with the blades distributed helically along the axial direction to simulate the real-world guiding effect of stabilizers on fluid rotation and cuttings redirection.
To balance simulation accuracy and computational efficiency, the stabilizer blades were geometrically simplified while retaining the primary features that influence the flow-field structure and the shape of the flow passage. The flow area and helical angle were set as adjustable parameters to facilitate comparative analysis under multiple operating conditions.
Figure 2 presents the overall structure of the geometric model and an enlarged view of the stabilizer section. This model provides a stable physical boundary and geometric foundation for the subsequent multiparameter sensitivity analysis and investigation of cuttings transport behavior.
Before conducting numerical simulations of cuttings transport, a mesh-independence test and time-step sensitivity analysis were performed to ensure a balance between computational reliability and efficiency. Considering the complex annular geometry of the large-diameter borehole section and the presence of strong shear and turbulence in localized flow fields, mesh generation was designed to ensure both boundary-layer resolution and global convergence.
Four sets of mesh–time-step combinations were tested, and the solid volume fractions within the computational domain were systematically compared to evaluate their influence on numerical stability, as illustrated in Figure 3. Under a fixed time step of 0.001 s, the simulation results with a number of elements of 498,156 and 365,489 were compared. The maximum deviation in the cuttings volume fraction during the steady-state stage was found to be less than 0.5%, indicating that the coarser mesh already provided sufficient accuracy and convergence. Considering that further mesh refinement would significantly increase the computational cost, a mesh count of 365,489 and a time step of 0.001 s were ultimately selected for the simulations. Twenty iterations were executed per time step to ensure convergence in unsteady processes and the accurate resolution of particle dynamics.
Considering the relatively regular geometry of the annular region between the wellbore and the drill pipe, as well as the predominant flow direction, a structured hexahedral mesh was employed in the wellbore, drill pipe, and the main annular flow domain. Hexahedral meshes offer high numerical stability and convergence efficiency, making them particularly suitable for resolving the primary flow patterns and particle transport behavior in large-diameter annuli [21].
In contrast, the stabilizer region features helical blade surfaces with complex geometry, which makes the generation of high-quality structured meshes challenging. To accurately capture local flow disturbances and shear-induced vortex structures, unstructured tetrahedral meshes were applied in the stabilizer blade regions, with local mesh refinement to improve resolution [20]. Transitional zones were introduced to match the structured and unstructured mesh interfaces, ensuring a smooth transition and maintaining numerical stability.
Standard wall functions were used to model the turbulent boundary layer near solid walls. Boundary-layer mesh refinement was applied to both the drill pipe and wellbore walls to enhance the resolution of the wall shear stress and near-wall velocity profiles. Figure 4 illustrates the hybrid mesh layout of the entire computational domain. The structured hexahedral mesh in the main region appears to be uniformly distributed, while the tetrahedral refinement around the stabilizer blades provides accurate local detail, achieving a good balance between computational accuracy and efficiency.

2.3. Model Verification

To verify the accuracy and applicability of the developed numerical model for simulating cuttings transport in large-diameter annuli, the experimental solid volume-fraction data in vertical large-diameter annuli, as reported by Han et al. [22], were selected as benchmark values. In the numerical simulation validation process, to ensure consistency with Han’s experimental conditions, no stabilizers were included in the simulation model, allowing for a direct comparison and validation of the numerical results against the experimental data. The specific data are shown in Figure 5. Corresponding numerical simulation cases were conducted using the Eulerian two-fluid framework.
In the referenced experiments, by adjusting the circulation rate, the mass and volume fractions of cuttings discharged at the annulus outlet at different times were measured, yielding the variation pattern of cuttings cleaning efficiency under different flow velocities. Figure 5 presents a comparison between the numerically predicted cuttings volume fraction and the experimentally measured results. The results indicate that the cuttings volume fraction reached a steady state after 100 s, with the simulation results showing good agreement with the experimental data, with an average error of 9.38%. The comparison confirms that the numerical model accurately captures the liquid–solid two-phase flow behavior in the annulus and produces reliable results, validating its feasibility for subsequent simulation analyses.

3. Analysis and Discussion of Simulation Results

Before conducting the systematic sensitivity analysis, this study first employed numerical simulation to individually examine the effects of five primary control parameters—the drilling fluid velocity, drill pipe rotational speed, stabilizer blade helical angle, number of stabilizer blades, and stabilizer flow area—on the distribution of the rock cuttings volume fraction in the large-diameter wellbore annulus. The aim was to reveal the fundamental patterns of cuttings transport characteristics under independent parameter variations, thereby providing a foundational basis for subsequent multi-factor sensitivity analysis and optimization research.
To ensure the reliability and reproducibility of the numerical simulation, key physical parameters related to the drilling fluid and cuttings were defined based on representative field conditions. The drilling fluid was assumed to be incompressible and Newtonian, with a density of 1330 kg/m3 and a dynamic viscosity of 30 mPa·s, reflecting typical water-based drilling fluids used in large-diameter vertical wells. The solid phase, representing rock cuttings, was modeled as spherical particles with a mean diameter of 3 mm and a density of 2650 kg/m3. All parameters were held constant across the simulation cases to isolate the effects of structural and operational variables—such as flow velocity, drill pipe rotation, and stabilizer configuration—on cuttings transport behavior.

3.1. Effect of the Drilling Fluid Velocity on the Solid Volume Fraction

The velocity of the drilling fluid serves as the dominant parameter governing the axial transport intensity of the fluid within the annular space. Variations in this velocity directly influence both the trajectory and the efficiency with which cuttings are mobilized and conveyed along the wellbore. As depicted in Figure 6, which presents the distribution trends of the cuttings volume fraction under varying flow velocities in a large-diameter wellbore configuration, the simulation outcomes reveal a clear pattern: increasing the flow velocity leads to a substantial reduction in the cuttings volume fraction measured at the outlet section and the annulus. This indicates a notable enhancement in the fluid’s ability to suspend and transport cuttings, thereby improving the overall wellbore cleaning performance.
As the flow velocity increases, the momentum transfer from the liquid phase to the deposited cuttings is enhanced. This dynamic interaction between the drilling fluid and the solid phase plays a critical role in controlling the cuttings transport behavior within the annular space. On one hand, higher flow velocities significantly increase the lifting and shear forces acting on the cuttings, allowing particles to overcome gravitational and adhesive forces to achieve resuspension, thereby reducing deposition and retention. This resuspension mechanism is particularly effective in minimizing the formation of localized cuttings beds, which are commonly associated with inefficient hole cleaning and elevated operational risks.
On the other hand, the scouring ability of the fluid improves with increased velocity, enabling more effective removal of settled cuttings along the wellbore wall. This enhancement reduces the likelihood of persistent accumulation zones and promotes a more uniform distribution of suspended solids. Additionally, stronger fluid disturbances intensify the turbulent energy in the flow field, further improving the transport and mixing of solid particles throughout the annulus.
The combined effect of these mechanisms leads to a marked improvement in cuttings transport efficiency under high-velocity conditions. The specific effects of increasing the flow velocity on the cuttings volume fraction and spatial distribution are quantitatively illustrated in Figure 7, highlighting the key role of hydraulic parameters in optimizing annular cleaning performance.

3.2. Effect of the Drill Pipe Rotational Speed on the Solid Volume Fraction

The rotation speed of the drill pipe indirectly affects the cuttings transport process by inducing rotational flow and disturbance within the annulus, as shown in Figure 8. This induced swirl modifies the secondary flow structure in the annular region, leading to more complex flow patterns and enhanced fluid–particle interactions. The simulation results indicate that as the drill pipe rotational speed increases, the solid volume fraction of the cuttings gradually decreases, demonstrating that higher rotational speeds can effectively enhance solid–liquid mixing and promote cuttings suspension. The rotational motion strengthens the circumferential component of the velocity field, which is superimposed onto the axial flow and contributes to increased turbulence intensity and vortex shedding, both of which favor the disruption of settled cuttings.
However, when the rotation speed continues to increase beyond a certain threshold, the reduction in the solid volume fraction tends to level off. This is mainly due to intensified turbulent shear at higher speeds, which may cause the localized accumulation of solid particles. These stagnant or recirculating regions can act as traps for particles, offsetting the benefits of increased turbulence. The corresponding cross-sectional views are shown in Figure 9. As the rotational speed increases, the cuttings distribution transitions from a stratified pattern to a more dispersed and symmetric profile, although some concentration zones persist near the wall at high speeds. These observations highlight the importance of balancing rotation-induced turbulence with flow field stability in order to achieve optimal cuttings transport performance in large-diameter boreholes.

3.3. Effect of the Stabilizer on the Solid Volume Fraction

As shown in Figure 10, the geometric structure of the stabilizer plays a significant regulatory role in cuttings transport behavior within large-diameter wellbore annuli, primarily by altering the local flow field and the efficiency of cuttings disturbances. The stabilizer, acting as a mechanical flow modifier, directly influences the turbulence generation and the flow reattachment zones around its blades, thereby governing the interaction between the fluid motion and solid particles. This interaction becomes increasingly critical in large-borehole scenarios, where the annular space is wide and prone to cuttings settlement under gravity-dominated flow conditions. The simulation results show that when the stabilizer’s flow area is moderate, it effectively enhances local flow disturbances, thereby generating strong shear layers and resuspension zones that help reduce the local cuttings volume fraction. Conversely, if the flow area is excessively large, the flow-blocking effect of the stabilizer weakens, resulting in an insufficient disturbance intensity, which reduces its ability to lift deposited cuttings and leads to decreased transport efficiency. This diminished shear production limits the upward migration of cuttings, particularly in low-shear boundary zones, increasing the risk of localized deposition and inefficient hole cleaning downstream.
Similarly, an appropriately chosen blade helical angle introduces a beneficial circumferential flow component to the axial main flow, which helps optimize cuttings transport paths and improves the distribution uniformity and suspension of solid particles. However, an overly large helical angle may lead to dominant rotational flow in the annulus, thereby weakening the axial transport capacity and inducing unfavorable flow separation and stagnant zones.
The number of stabilizers also has a non-negligible impact on the cuttings carrying process. Increasing the number of stabilizers helps generate multiple disturbance zones along the annulus, enhancing the frequency of cuttings resuspension and promoting better flow uniformity, which is favorable for cuttings migration. Nevertheless, an excessive number of stabilizers can lead to a sharp rise in flow resistance and pressure loss, potentially causing cuttings accumulation between stabilizers and ultimately impairing the hole-cleaning performance. Moreover, excessive stabilizer obstructions may disrupt the continuity of the axial velocity profile, inducing velocity drops and flow deceleration in the inter-stabilizer zones, which further reduce the mobilization efficiency of particles in those regions.
Therefore, the stabilizer design should comprehensively consider the balance among the flow-through capacity, disturbance efficiency, and pressure drop to ensure high-efficiency cuttings transport while maintaining favorable hydraulic conditions and flow-field stability within the wellbore.

4. Sensitivity Analysis of Simulation Parameters

Sensitivity analysis is essential for identifying key parameters affecting cuttings transport. The commonly used approaches include the following: (1) Local (one-at-a-time; OAT) sensitivity analysis: This involves perturbing one input parameter at a time while keeping others constant. This method is simple but does not capture interaction effects among variables; (2) Variance-based global sensitivity analysis (e.g., Sobol, FAST) [23]: This quantifies both the main effects and interaction effects of parameters on the output variance. It is computationally intensive but provides comprehensive sensitivity indices such as first-order, total-order, and interaction coefficients. This method was adopted in this study to evaluate complex nonlinear coupling among multiple drilling parameters; (3) Screening methods (e.g., the Morris method): This is designed for high-dimensional problems with limited computational resources. It provides qualitative rankings of input importance but lacks detailed variance decomposition; (4) Surrogate model-based methods (e.g., Gaussian Process, Polynomial Chaos Expansion): These methods fit a surrogate model and analyze its response surface. While efficient for expensive models, accuracy depends on the surrogate quality. In this study, variance-based global sensitivity analysis (VBGSA) using the Monte Carlo method was employed due to its ability to comprehensively capture both the main effects and interaction effects of key structural and flow parameters. The method is well suited for moderately complex models with limited input dimensionality (five factors in this case) and aligns with the study’s goal of identifying optimal parameter combinations under multi-factor coupling.
To quantitatively evaluate the influence of multiple interacting variables on cuttings transport outcomes, this study employs the variance-based global sensitivity analysis (VBGSA) method to assess the response of the solid-phase volume fraction [24]. This approach quantifies the output variance induced by perturbations in input parameters, allowing identification of both the main and interaction effects. It is particularly effective in revealing the relative importance of coupled factors in nonlinear systems.

4.1. Variance-Based Global Sensitivity Analysis Method

In a k-dimensional unit hypercube Ω k = ( X | 0 x i 1 , i = 1 , , k ) , a square-integrable function is defined as follows:
Y = f ( X 1 , X 2 , X k )
The function Y is expanded using High-Dimensional Model Representation (HDMR) as follows:
Y = f 0 + i f i + i j > i f i j + f 12 k
Equation (22) contains a total of 2k terms, where f0 is a constant term, f i = f i ( X i ) , f i j = f i j ( X i , X j ) , and so on in the same manner. All the terms in the above decomposition are orthogonal, i.e., f ( x i ) f ( x j ) d x i d x j = 0 , and these terms can be calculated by the conditional expectations of Y, namely
f 0 = E ( Y ) f i = E Y X i E ( Y ) f i j = E Y X i , X j f i f j E ( Y )
The variance calculation of Equation (22) yields
V ( Y ) = i V i + i j > i V i j + + V 12 k
Dividing both sides by V(Y), we obtain
1 = i S i + i j > i S i j + i j > i 1 > j S i j 1 + + S 12 k
In Equation (25), Si and STi are the Sobol sensitivity indices [25,26]. Specifically, Si represents the first-order sensitivity index, which quantifies the contribution of the variation in parameter Xi to the output variance. STi denotes the total-order sensitivity index, capturing the contribution of Xi, including its interactions and those of other variables with the output variance. Therefore, the following relationship holds:
S i S T i
The first-order and full-order sensitivity indices are specifically defined as follows:
S i = i V i V ( Y )  
S T i = 1 V E Y X ~ i V ( Y )
In Equation (28), X~I denotes all input variables except Xi.

4.2. Sensitivity Coefficient Calculation

Using the Monte Carlo method [27] to calculate sensitivity coefficients, first define the sample matrices A and B [28]:
A = x 1 ( 1 ) x 2 ( 1 ) x i ( 1 ) x k ( 1 ) x 1 ( 2 ) x 2 ( 2 ) x i ( 2 ) x k ( 2 ) x 1 ( N 1 ) x 2 ( N 1 ) x i ( N 1 ) x k ( N 1 ) x 1 ( N ) x 2 ( N ) x i ( N ) x k ( N )
B = x k + 1 ( 1 ) x k + 2 ( 1 ) x k + i ( 1 ) x 2 k ( 1 ) x k + 1 ( 2 ) x k + 2 ( 2 ) x k + i ( 2 ) x 2 k ( 2 ) x k + 1 ( N 1 ) x k + 2 ( N 1 ) x k + i ( N 1 ) x 2 k ( N 1 ) x k + 1 ( N ) x k + 2 ( N ) x k + i ( N ) x 2 k ( N )
In the above matrices A and B, N represents the number of samples, and xi(1), xi(2)xi(N) represent the N sampled values of the parameter xi. Then k is the number of input parameters. Matrices A and B represent two independent and identically distributed samples, ensuring the statistical validity of the sensitivity index calculations. By replacing one column of matrix A with the corresponding column from matrix B to create hybrid matrices, the contribution of each individual input parameter to the model output can be assessed, enabling accurate estimation of both first-order and total-effect sensitivity indices. Next, define the matrix Ci, which is constructed by taking all the columns from matrix B except for the i-th column, which is replaced by the i-th column from matrix A:
C i = x k + 1 ( 1 ) x k + 2 ( 1 ) x i ( 1 ) x 2 k ( 1 ) x k + 1 ( 2 ) x k + 2 ( 2 ) x i ( 2 ) x 2 k ( 2 ) x k + 1 ( N 1 ) x k + 2 ( N 1 ) x i ( N 1 ) x 2 k ( N 1 ) x k + 1 ( N ) x k + 2 ( N ) x i ( N ) x 2 k ( N )
Based on matrices A, B, and Ci, the corresponding model outputs are obtained as follows:
y A = f ( A ) y B = f ( B ) y C i = f C i
The first-order sensitivity coefficient Si and the full-order sensitivity coefficient STi are obtained as follows:
S i = V E Y X i V ( Y ) = 1 N j = 1 N y A ( j ) y C i ( j ) 1 N 2 j = 1 N y A ( j ) j = 1 N y B ( j ) 1 N j = 1 N y A ( j ) 2 f 0 2
S T i = 1 V E Y X ~ i V ( Y ) = 1 1 N j = 1 N y B ( j ) y C i ( j ) f 0 2 1 N j = 1 N y A ( j ) 2 f 0 2
where f 0 2 = 1 N j = 1 N y A ( j ) 2 .

4.3. Sensitivity Analysis Results

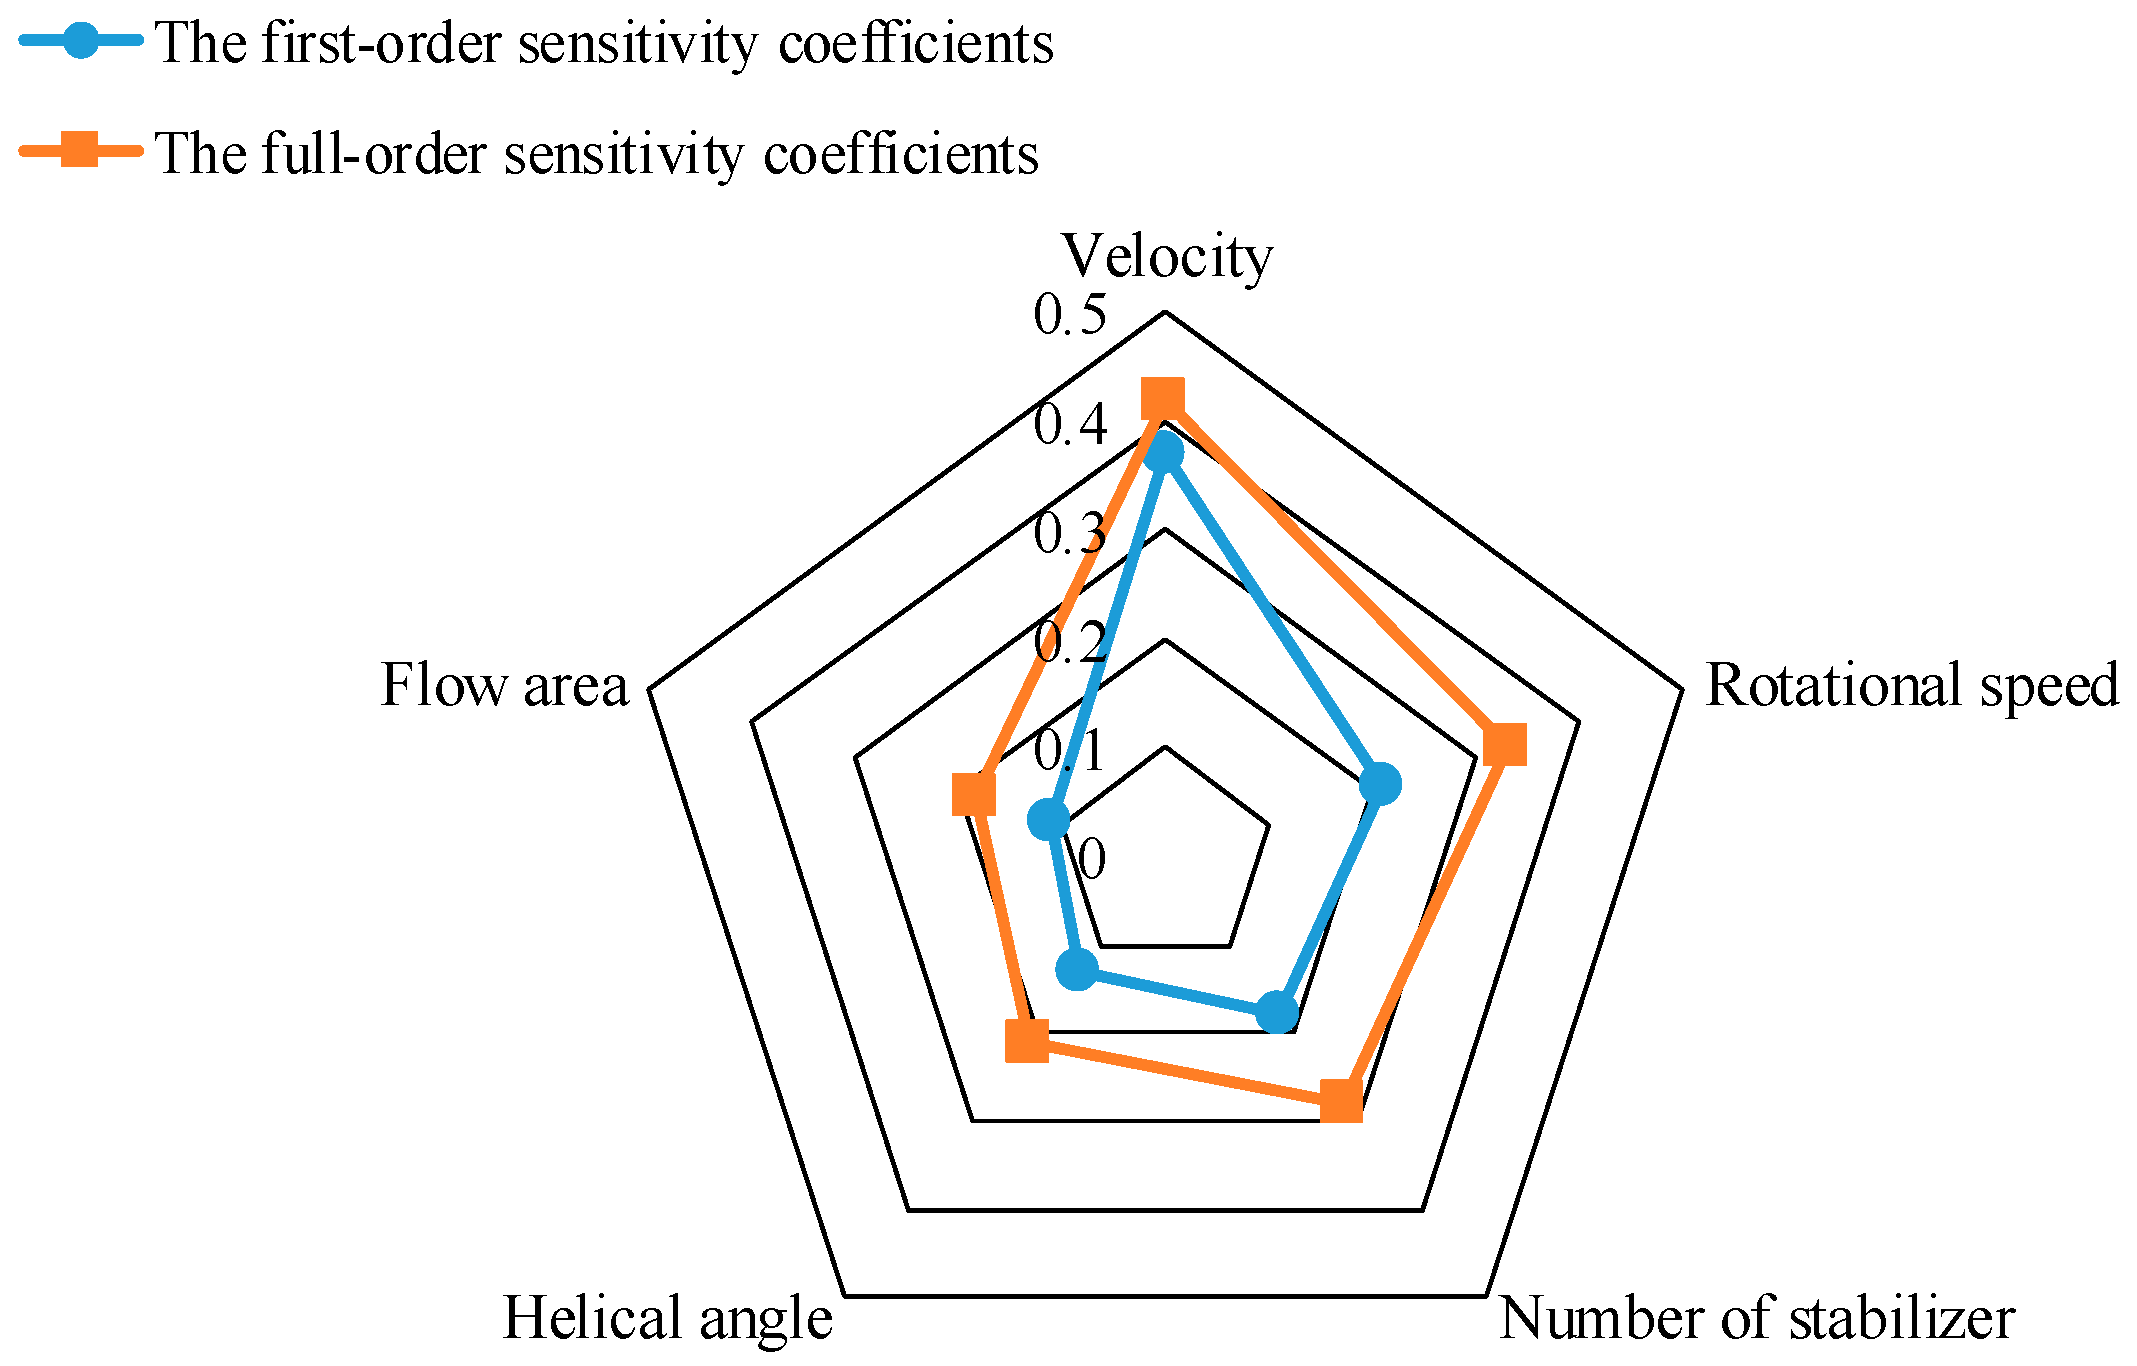
To quantitatively reveal the influence of each design variable on the cuttings volume fraction, this study employs a variance-based global sensitivity analysis method to calculate both the first-order and total-order sensitivity indices for five parameters: flow velocity, drill pipe rotational speed, number of stabilizers, flow area, and helical angle. The analysis results are presented in Figure 11.

4.3.1. First-Order Sensitivity Coefficient Analysis

The sensitivity analysis reveals that drilling fluid velocity is the dominant influencing factor, with a first-order sensitivity coefficient of 0.37, indicating its leading role in determining the cuttings volume fraction. Under the condition of a large-diameter vertical well without a cuttings bed, the annular flow field is relatively uniform, and the cuttings transport efficiency mainly depends on the enhancement of axial flow velocity. As the drilling fluid velocity increases, the velocity of the drilling fluid in the annulus rises accordingly, resulting in a significant increase in both shear stress and lift force, which promotes the upward transport of suspended cuttings toward the surface. Additionally, higher drilling fluid velocities intensify particle–fluid interfacial disturbances, facilitating a more uniform spatial redistribution of cuttings within the annular flow. This effectively reduces local zones of high cuttings concentration and improves the distribution profile of the cuttings volume fraction at the outlet section. The simulation results indicate that, with other parameters held constant, variations in the flow velocity alone can cause a substantial reduction in the cuttings volume fraction, confirming its primary influence in hole-cleaning control under the studied conditions.
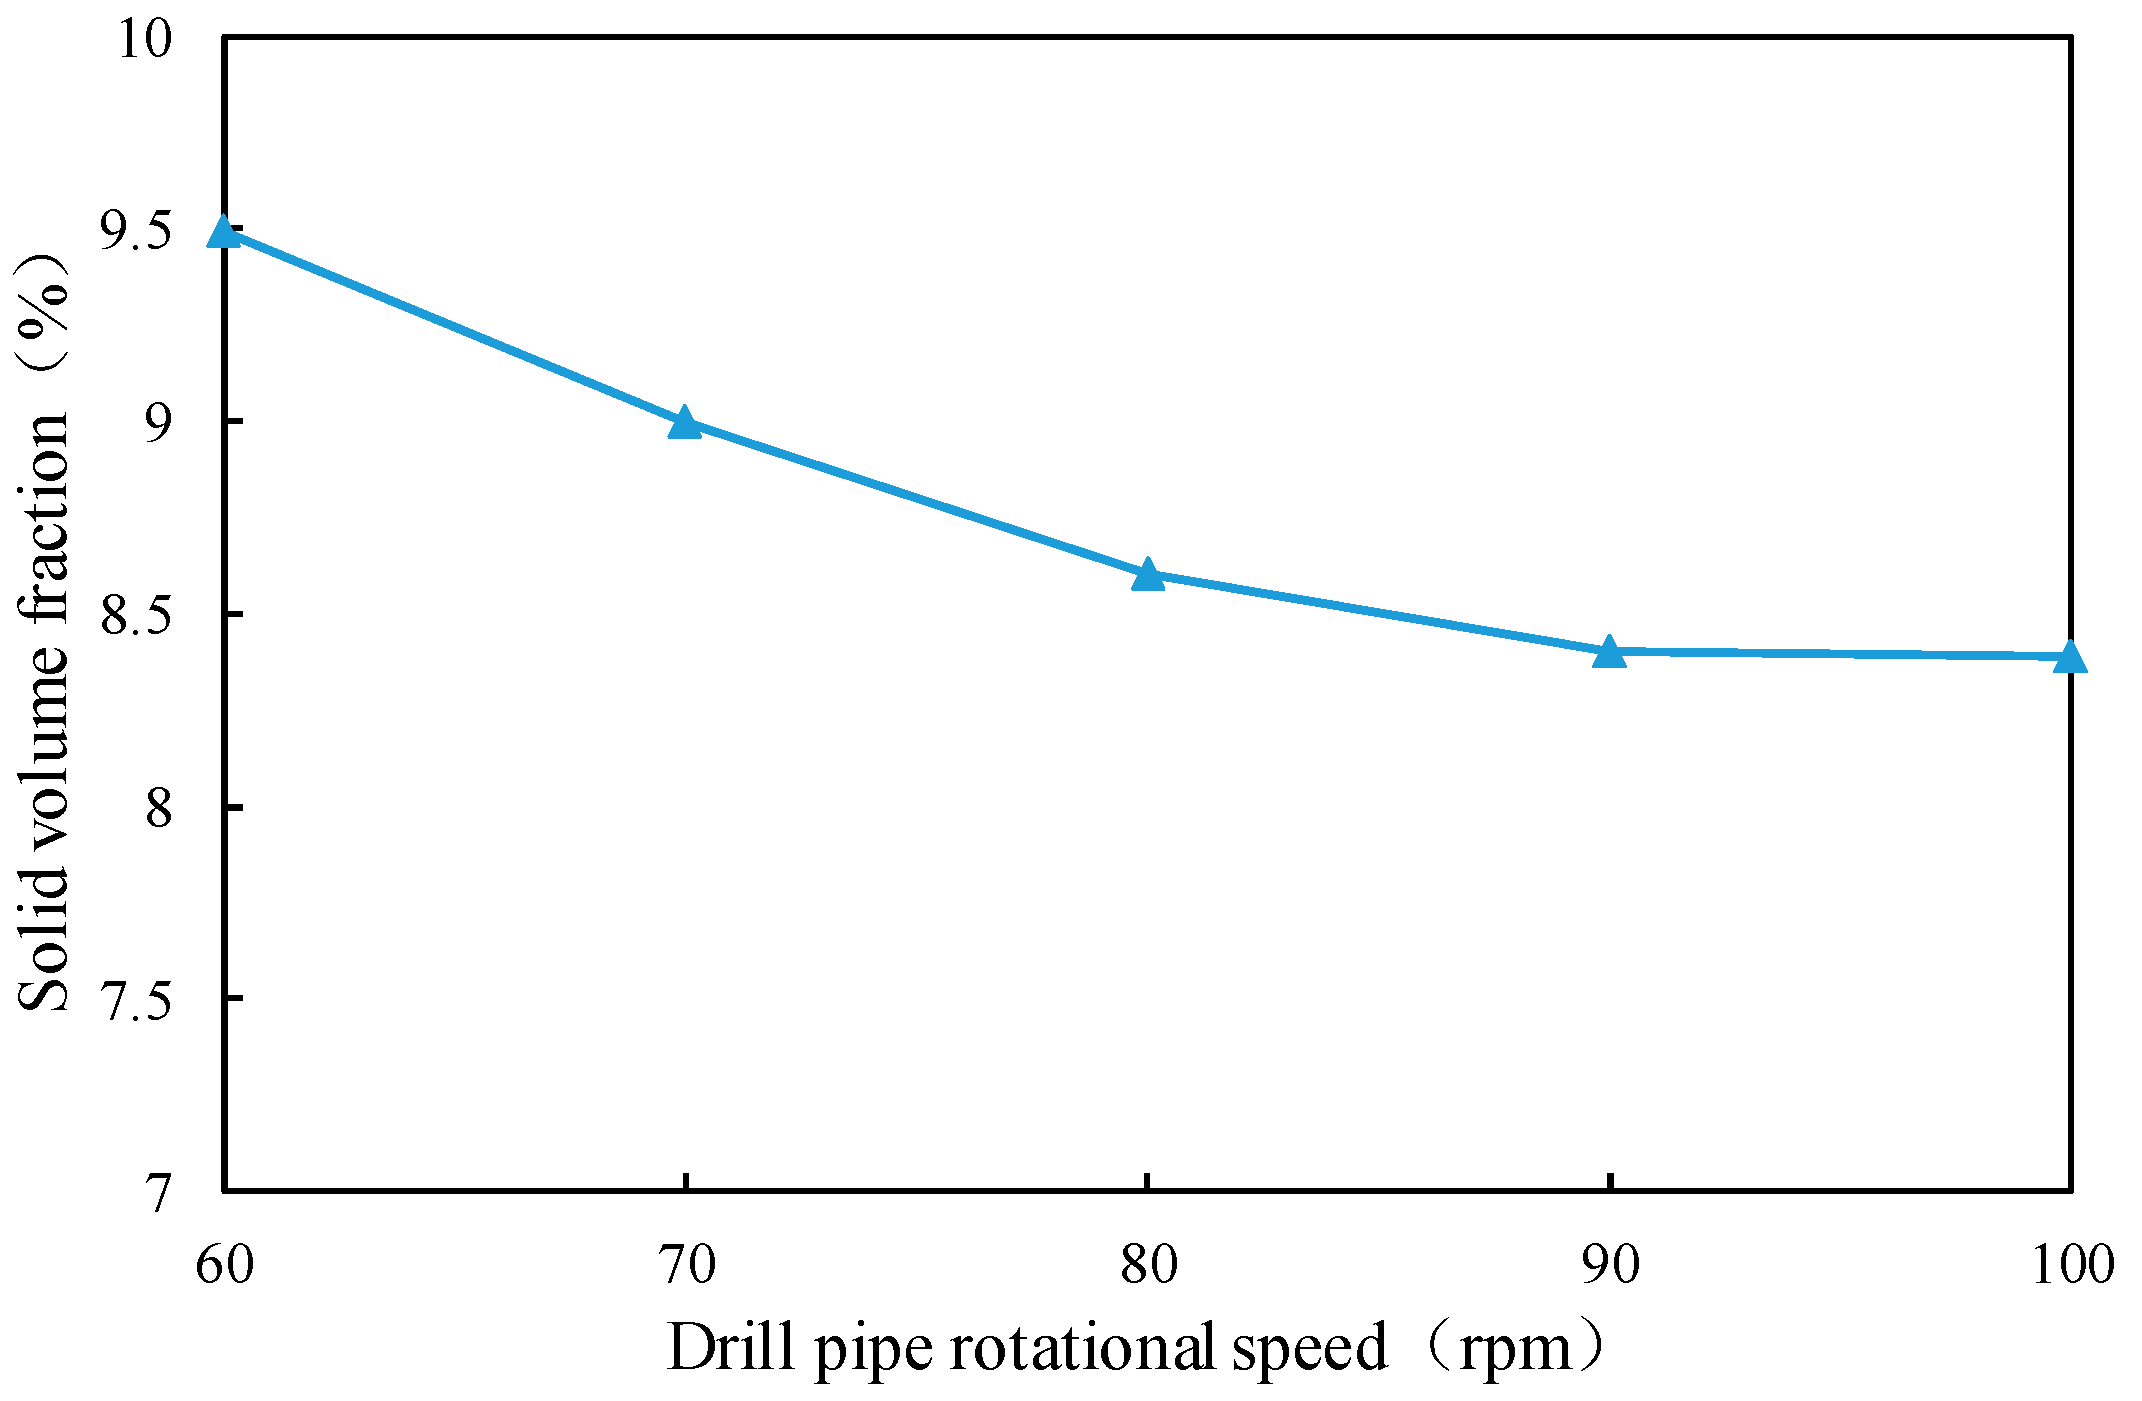
The drill pipe rotational speed enhances radial and tangential flow components by inducing secondary flows and helical vortices within the annulus, thereby altering the cuttings’ transport trajectories and residence time. Under moderate to high rotational conditions, the cuttings exhibit more complex motion patterns due to intensified flow disturbances, which help to disrupt axial accumulation trends and improve the cuttings transport capacity at the outlet cross-section. The first-order sensitivity coefficient for rotational speed is 0.21, indicating that it is the second most influential factor after the drilling fluid velocity. However, its effect is more susceptible to modulation by the wellbore diameter and stabilizer-induced disturbances, making it less consistent compared with the influence of the drilling fluid velocity.
The number of stabilizers influences the uniformity of the local flow field by altering the distribution of obstructions and the disturbance frequency within the annulus. A reasonable number of stabilizers can induce periodic disturbances in the drilling fluid, thereby promoting the dispersed transport of cuttings. However, excessive stabilizers may introduce additional hydraulic resistance, resulting in local low-velocity recirculation zones that hinder cuttings transport. The first-order sensitivity coefficient is 0.18, indicating a significant independent regulatory effect within an appropriate configuration range.
The helical angle governs the stabilizer’s flow-guiding capability and the intensity of the tangential swirl it induces. A moderate helical angle can generate stable spiral disturbances, facilitating the detachment of cuttings from near-wall regions and their migration into the mainstream flow. Conversely, an excessive helical angle may lead to intensified flow diversion and energy dissipation, thereby reducing the cuttings transport efficiency. The sensitivity coefficient is 0.13, suggesting a moderate independent contribution with a nonlinear response trend.
The flow area determines the acceleration or contraction effects of the drilling fluid as it passes through the stabilizer region. A smaller flow area results in stronger local acceleration, which enhances shear forces and the disturbance frequency, thereby improving cuttings transport dynamics. However, an overly small flow area may induce excessive velocity fluctuations and an increased pressure drop, leading to transient low-velocity zones that weaken the cuttings suspension capacity. The sensitivity coefficient is 0.11, which, although lower than the previous three parameters, still indicates an independent regulatory potential and should be optimized according to operational conditions.

4.3.2. Full-Order Sensitivity Coefficient Analysis

Compared with first-order sensitivity coefficients, full-order sensitivity coefficients are capable of capturing hidden nonlinear responses and coupling enhancement mechanisms among parameters, thus providing a more realistic reflection of the system’s sensitivity under high-dimensional perturbation spaces.
In the full-order analysis, the drilling fluid velocity still exhibits the highest sensitivity, with a full-order sensitivity coefficient of 0.42, which is slightly higher than its first-order sensitivity coefficient of 0.37. This indicates that the influence of this parameter on the cuttings volume fraction is primarily due to its own independent effect while also involving interactions with other factors. In particular, when coupled with the rotational speed, a strengthened cuttings transport channel may form, enhancing flow-field disturbances and improving the particle detachment capability. Additionally, under conditions of larger stabilizer helical angles or smaller flow areas, the driving effect of a high velocity becomes especially pronounced, reinforcing the stability of the cuttings transport path.
The full-order sensitivity coefficient for the rotational speed is significantly higher than its first-order counterpart, indicating that its nonlinear and interaction effects on cuttings transport cannot be ignored. At a certain drilling fluid velocity level, a moderate increase in rotation speed can induce intense secondary swirling structures in the annulus, increasing the frequency of particle agitation and altering the residence-time distribution. When interacting with stabilizer quantity and the helical angle, it can significantly change the local shear force distribution and particle trajectory structure, resulting in a synergistic enhancement effect. Especially under complex annular geometries or frequent stabilizer-induced disturbances, the vorticity generated by rotation plays a key role in particle detachment.
The full-order sensitivity coefficient for the stabilizer quantity also exceeds its first-order value, highlighting its amplified coupling mechanism in regulating cuttings transport. When interacting with the rotation speed and drilling fluid velocity, it can significantly modulate the local flow structure and adjust the scale and distribution of the particle resuspension region. Too few stabilizers lead to insufficient disturbances, while too many cause overlapping interference, obstructing the main flow path. Therefore, its optimal configuration should be synergistically optimized with other variables.
The full-order sensitivity coefficient for the helical angle increases from 0.13 (first-order) to 0.21, revealing a clear nonlinear response trend. This effect is particularly evident in two types of interactions: when coupled with rotation speed, a moderate helical angle can induce enhanced swirling vortex structures, significantly increasing the frequency of cuttings disturbance; when co-regulated with the flow area, it can modify the fluid bypass mode, establish stable cuttings transport paths, and improve the uniformity of particle suspension.
Although the flow area of the stabilizer remains the least sensitive in the full-order analysis, its sensitivity increases from 0.11 (first-order) to 0.18. This suggests that its impact on cuttings transport is mainly realized through synergistic disturbances with the drilling fluid velocity and helical angle. A small area, when coupled with high velocity, can form a high-shear transport zone; a larger area, when combined with a high helical angle, can stabilize vortex structures, enhancing the stability of particle distribution.
The comparative analysis of the first-order and full-order sensitivity coefficients reveals that each influencing factor exhibits a distinct yet significant contribution to the response of the cuttings volume fraction, highlighting the system’s typical nonlinear characteristics and coupling mechanisms under high-dimensional perturbations. Firstly, the drilling fluid velocity consistently serves as the primary dominant factor, holding the highest weight in both first-order sensitivity (direct effect) and full-order sensitivity (including all interaction effects) analyses. This indicates that whether under single-factor perturbation or in joint variation with other parameters, the drilling fluid velocity exerts the most direct and significant impact on the cuttings transport behavior. Fundamentally, this is because the drilling fluid velocity determines the axial velocity and shear intensity in the annular main flow zone, directly controlling the drilling fluid’s cuttings carrying capacity, making it the core driving factor for maintaining borehole cleanliness and operational stability. Secondly, the drill pipe rotational speed and the number of stabilizers form the secondary dominant factors. Their full-order sensitivity coefficients are significantly higher than their first-order values, suggesting that their influence lies not only in their independent contributions but also in their complex nonlinear coupling with other variables (e.g., drilling fluid velocity and stabilizer parameters). For instance, a high rotation speed enhances annular swirling and the flow-disturbance frequency, and in conjunction with a suitable stabilizer arrangement, it can create an intensified cuttings carrying zone. Meanwhile, the number of stabilizers plays a synergistic amplification role by altering local flow-disturbance frequencies and suppressing cuttings sedimentation. Therefore, in engineering optimization, the combined configuration of rotation speed and stabilizer count should be a key focus in achieving structure–flow dynamic matching and coupling. Lastly, although the stabilizer helical angle and the flow area appear as secondary factors in the first-order sensitivity coefficient analysis, their full-order sensitivity coefficients increase significantly, indicating that their impact on cuttings transport primarily stems from interactions with other parameters. Under conditions of a moderate helical angle or a suitably constrained flow area, the reconstruction of local vortex structures and bypass flow channels can effectively enhance the fluid encapsulation and shear capability of cuttings, thereby indirectly improving cuttings transport efficiency. Neglecting their nonlinear coupling characteristics may lead to the formation of cuttings retention zones and reduced cleaning efficiency. Therefore, in parameter design and tuning, these stabilizer parameters should not be optimized in isolation but should, instead, be adjusted collaboratively based on global response and interaction effects.
In conclusion, this study suggests that the drilling fluid velocity should be used as the primary control parameter, rotation speed and the number of stabilizers as cooperative control factors, and stabilizer structural parameters (helical angle and flow area) as responsive adjustment tools. A multi-factor coupled optimization model should be established to achieve efficient and stable cuttings transport and borehole-cleaning performance. This provides theoretical support and an optimization pathway for stabilizer design and drilling fluid parameter matching under large-diameter borehole conditions.

4.3.3. Sensitivity Analysis Model Validation

To ensure the accuracy and credibility of the variance-based sensitivity analysis results derived from the Monte Carlo method, a multi-step verification approach was adopted, incorporating reduced-order modeling [29], local perturbation testing [30], and engineering consistency comparison.
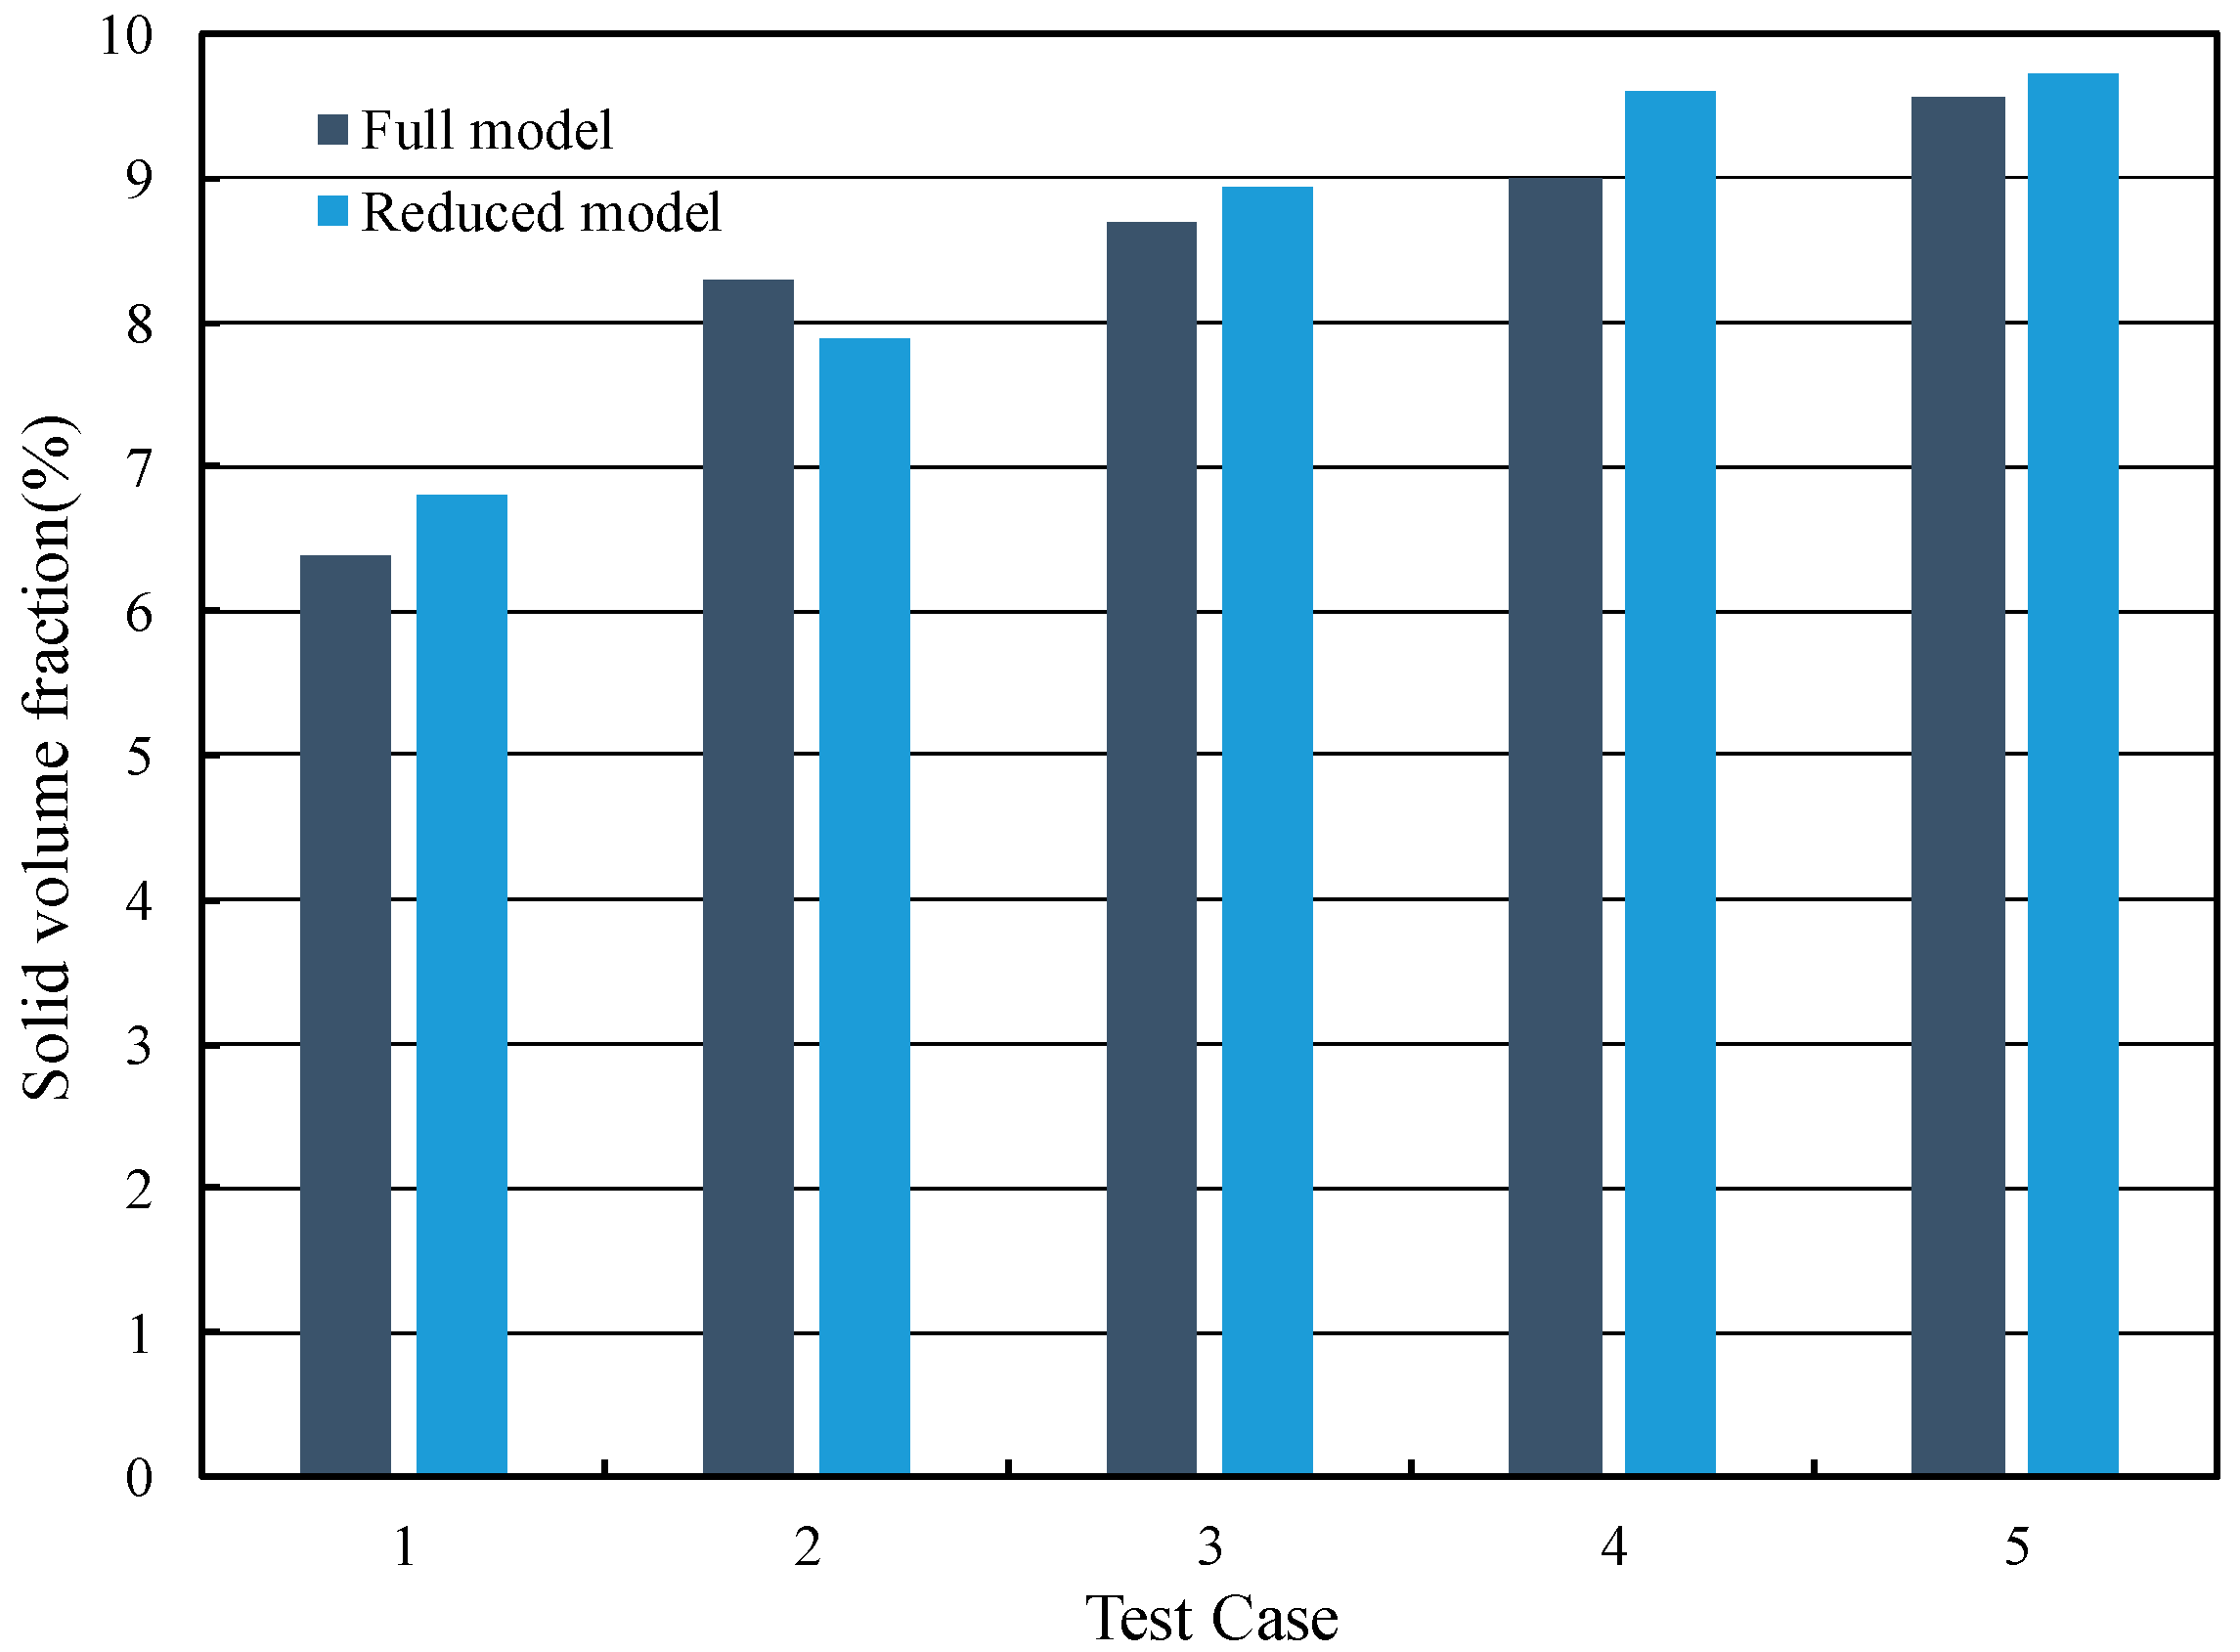
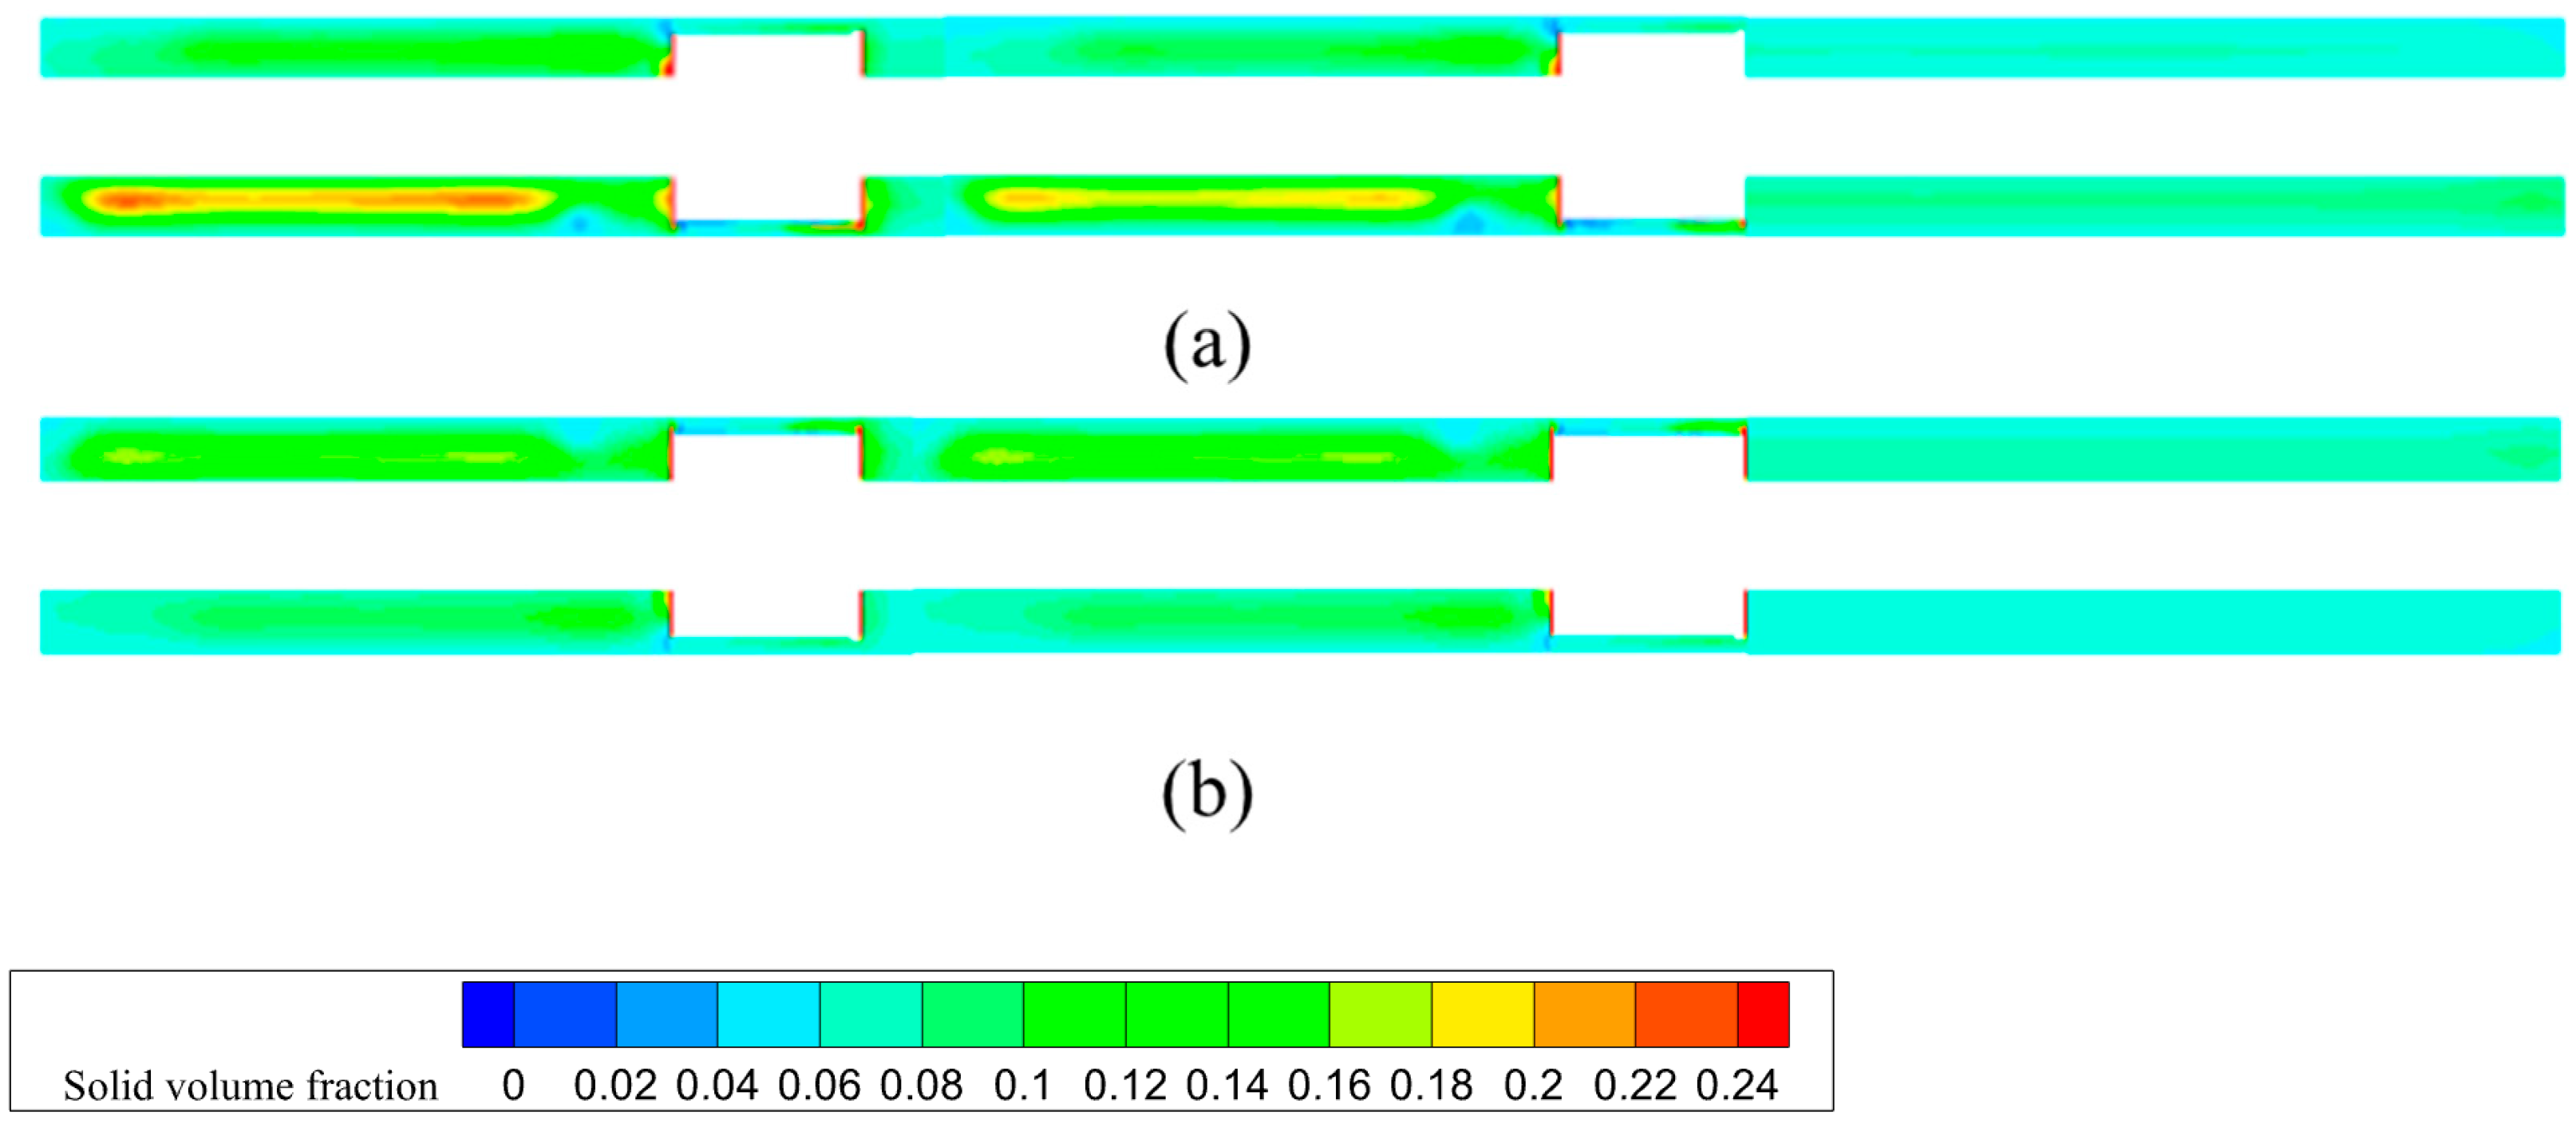
Firstly, a reduced-order model was constructed by retaining only the top three parameters exhibiting the highest total-order sensitivity indices—namely, drilling fluid velocity, drill pipe rotational speed, and number of stabilizers—while the remaining two parameters (stabilizer helical angle and flow area) were fixed at their mean values. Then, multiple sets of simulation tests were conducted under different parameter conditions to obtain the solid volume fraction of the simplified model. As shown in Figure 12, numerical simulations conducted using this simplified model demonstrated that the predicted solid volume fraction deviated by less than 5.9% from that of the full model across the sampled parameter space. This low deviation confirms that the dominant parameters captured by the sensitivity analysis are sufficient to characterize the key behavior of the system.
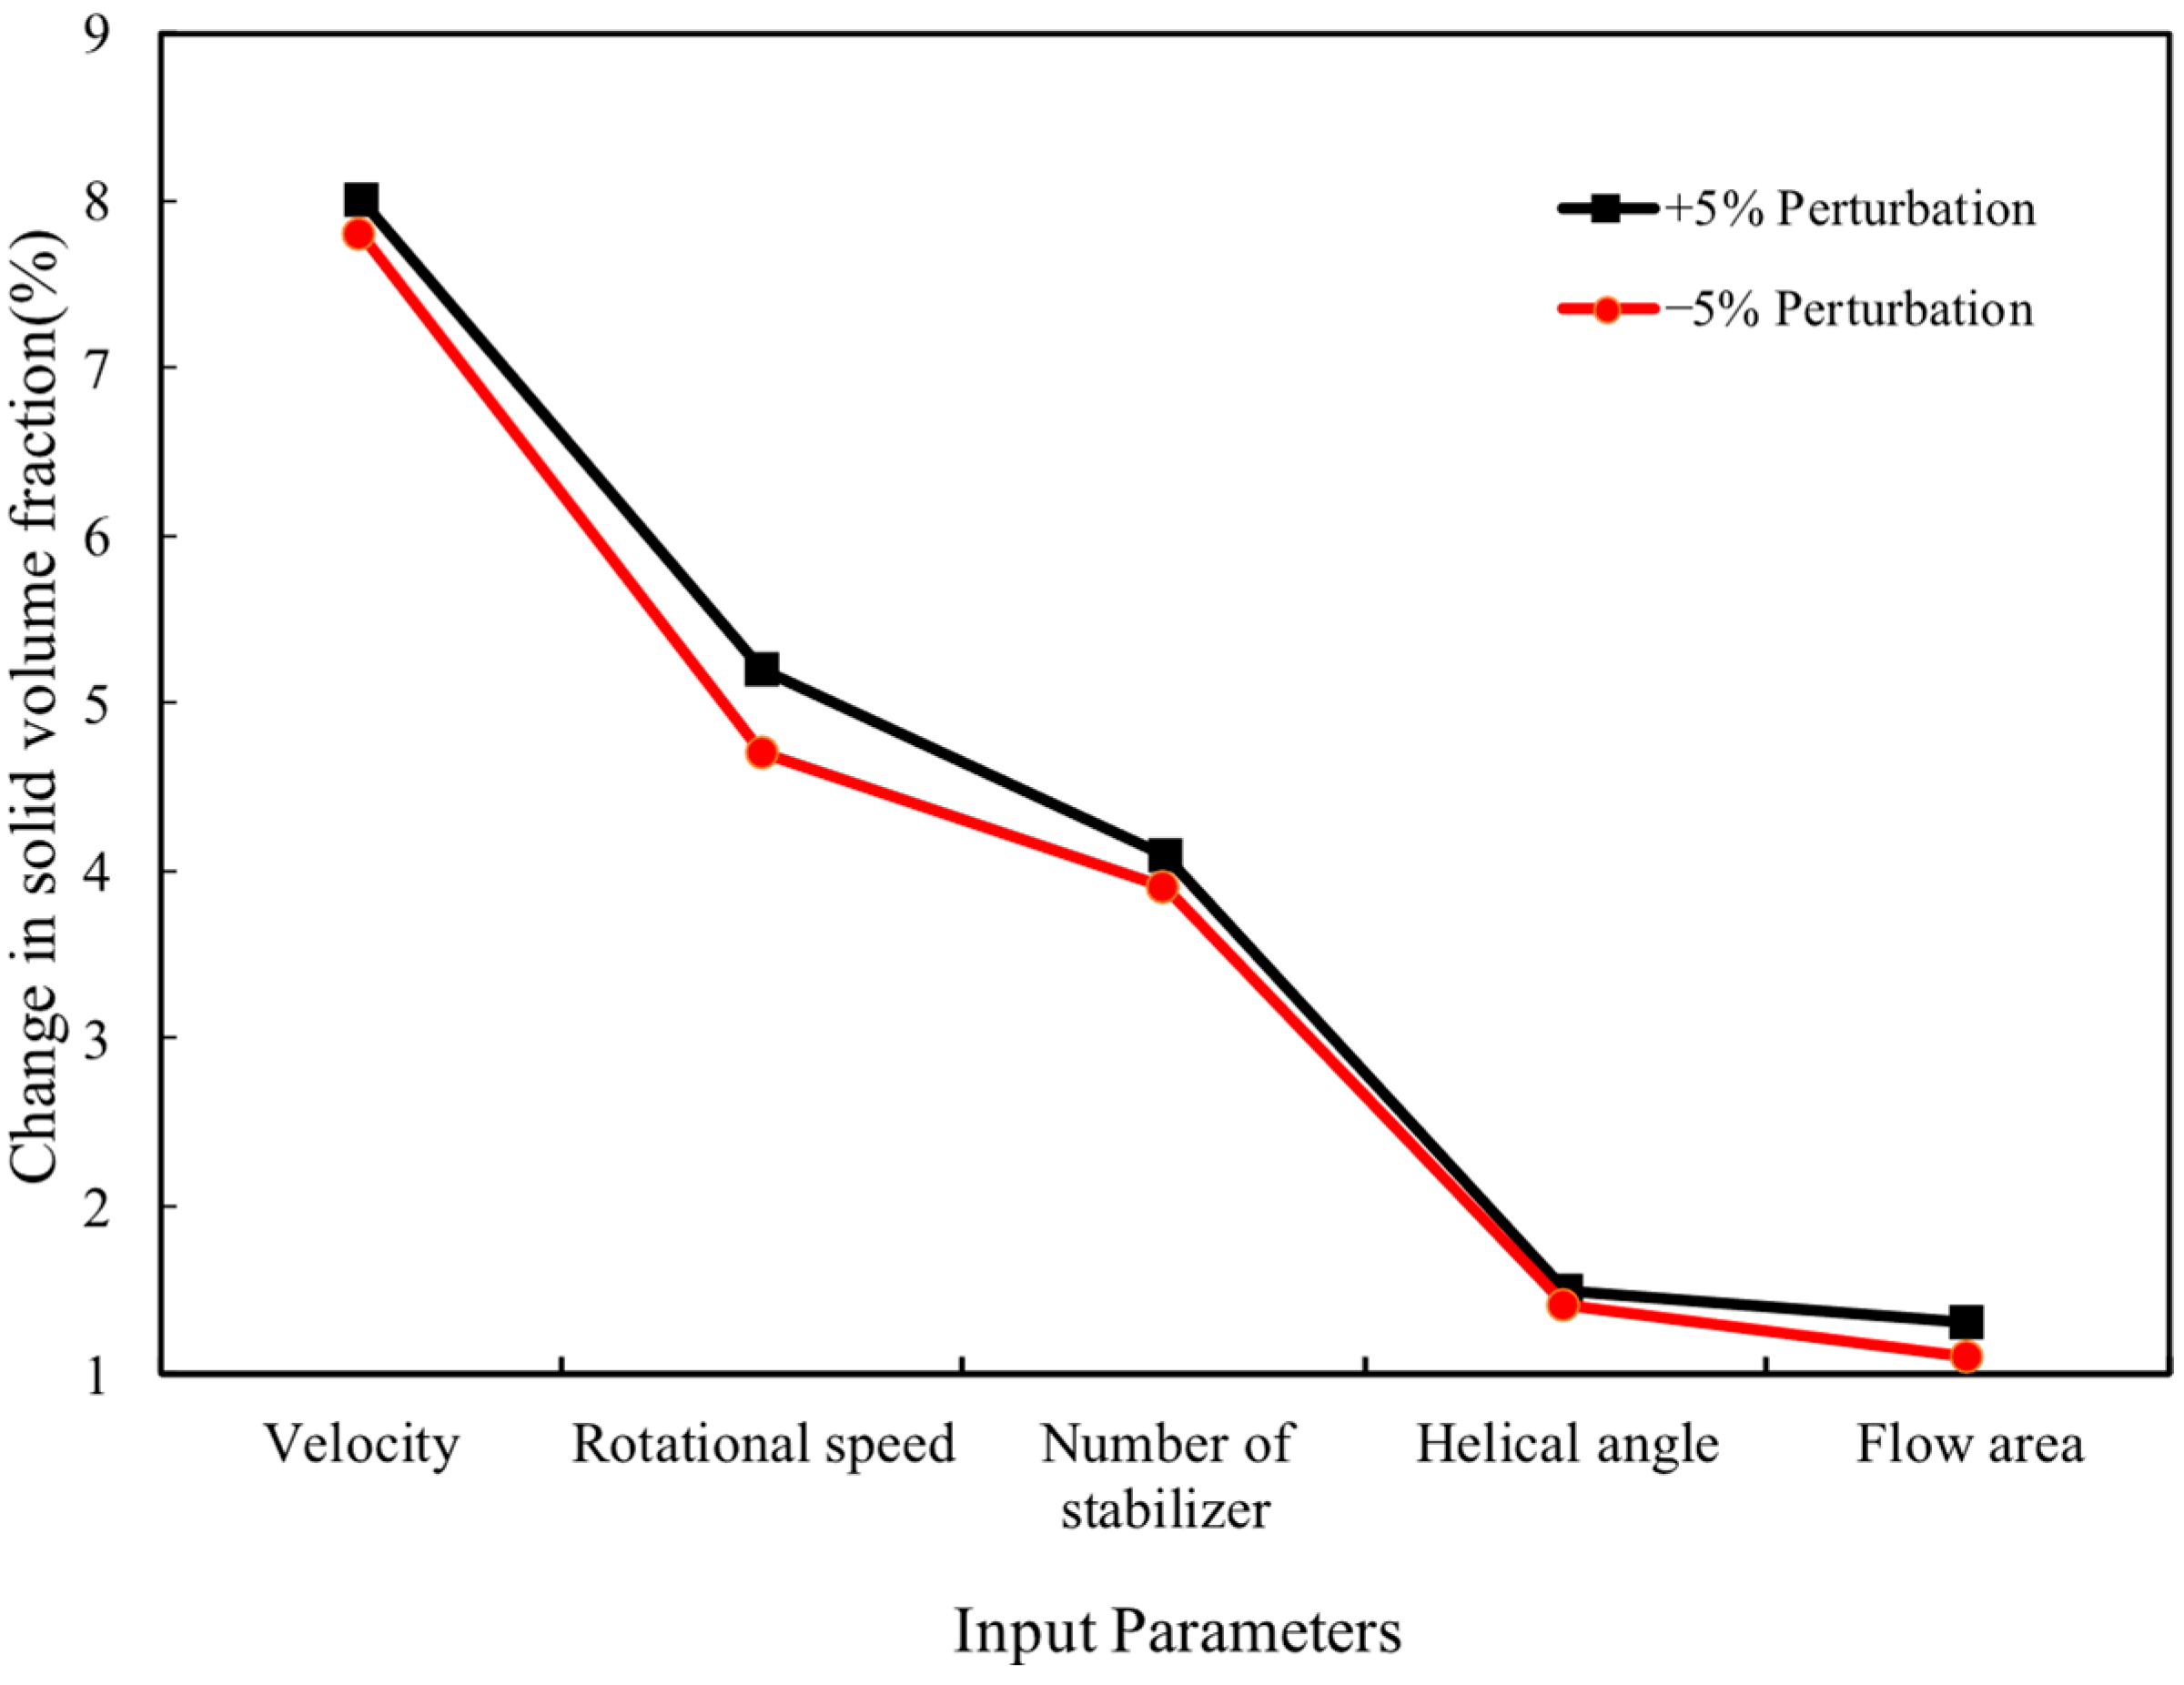
Secondly, a local perturbation test was conducted to validate the consistency of the sensitivity rankings. Each input parameter was independently perturbed by ±5% around its nominal value while holding the others constant. As shown in Figure 13, the resulting changes in the solid volume fraction exhibited a trend consistent with the sensitivity coefficients: parameters with high first-order sensitivity coefficients led to substantial output variations, while those with low coefficients induced negligible changes. This further validates the ranking reliability and the local responsiveness of the model.
Lastly, the parameter influence trends identified through the sensitivity analysis were compared with existing field knowledge and published studies. The findings—particularly the dominant role of flow rate and rotational speed [31,32]—are consistent with previous conclusions in large-diameter borehole-cleaning research, thus reinforcing the engineering plausibility of the sensitivity-derived results.
This comprehensive verification confirms that the applied sensitivity analysis methodology not only offers robust mathematical insights but also aligns with physical behavior and practical drilling experience.

4.3.4. Interactions Among Parameters

Within the variance-based global sensitivity analysis framework, besides the first-order sensitivity coefficients used to quantify the independent contribution of single factors to the response variable (in this study, the solid volume fraction), the interaction effect terms are also calculated to reveal the coupling relationships among factors and their combined effects on the system output. The specific results are shown in Figure 14.
The variance-based global sensitivity analysis results reveal pronounced interaction and coupling effects among the five controlling parameters influencing the cuttings volume fraction. The interaction sensitivity indices are as follows: The drill pipe rotational speed exhibits the highest interaction sensitivity index at 0.12, indicating that its synergistic effects with other parameters substantially enhance the cuttings transport efficiency. Particularly, when coupled with an appropriate drilling fluid velocity and stabilizer configuration, complex secondary flow structures and intensified shear zones are generated, significantly improving cuttings suspension and transport. The stabilizer quantity’s interaction sensitivity index is 0.10, signifying that in conjunction with the flow velocity and rotational speed, it effectively extends the perturbation domain and intensifies localized flow disturbances, thereby amplifying the cuttings carrying capacity. Under elevated rotational speeds, multiple stabilizers markedly augment the disturbance region and shear stress distribution, aiding in the mitigation of cuttings deposition. The interaction indices for the stabilizer helical angle and flow area are 0.08 and 0.07, respectively. Despite their comparatively lower first-order effects, these parameters play critical roles in modulating the flow structures responsible for cuttings transport under combined operational conditions. An optimally selected helical angle promotes stable helical shear flows, while a suitably sized bypass area enhances localized cuttings transport efficiency. Their impacts on the solid volume fraction are strongly contingent on their interactive coupling with other parameters. Specifically, under conditions of sufficiently high flow velocity, moderate rotational speed, and appropriate stabilizer count, the helical angle and flow area facilitate the formation of coherent vortex structures and directional shear flows, which enhance particle dispersion and transport. Conversely, isolated adjustment of these parameters may induce uneven flow disturbances or localized low-velocity zones detrimental to cuttings removal. The drilling fluid flow velocity has an interaction sensitivity index of 0.05. Although comparatively low, at high flow velocities, it synergizes with stabilizer disturbances to substantially expand the effective transport zone and suppress cuttings accumulation.
In summary, except for drilling fluid velocity, the remaining parameters exhibit significant nonlinear interaction effects. Notably, the coupling between rotational speed and stabilizer structural parameters exerts a decisive influence on cuttings transport dynamics. Therefore, multi-parameter synergistic optimization strategies are essential for effective design and operational control.

4.4. Optimization Analysis of Cuttings Transport in Large-Diameter Wellbores

Based on the combined results of single-factor analyses and variance-based global sensitivity analyses, it is evident that the cuttings transport process in large-diameter wellbores is significantly influenced by nonlinear coupling among multiple parameters. Complex interactions exist between these factors, and thus the optimal solution for a single parameter cannot directly serve as the optimal design for the entire system. Therefore, when optimizing drilling fluid carrying parameters, full consideration must be given to the synergistic relationships between primary controlling factors and secondary variables to achieve coordinated matching among parameters, thereby improving the cuttings transport efficiency and ensuring wellbore-cleaning stability.
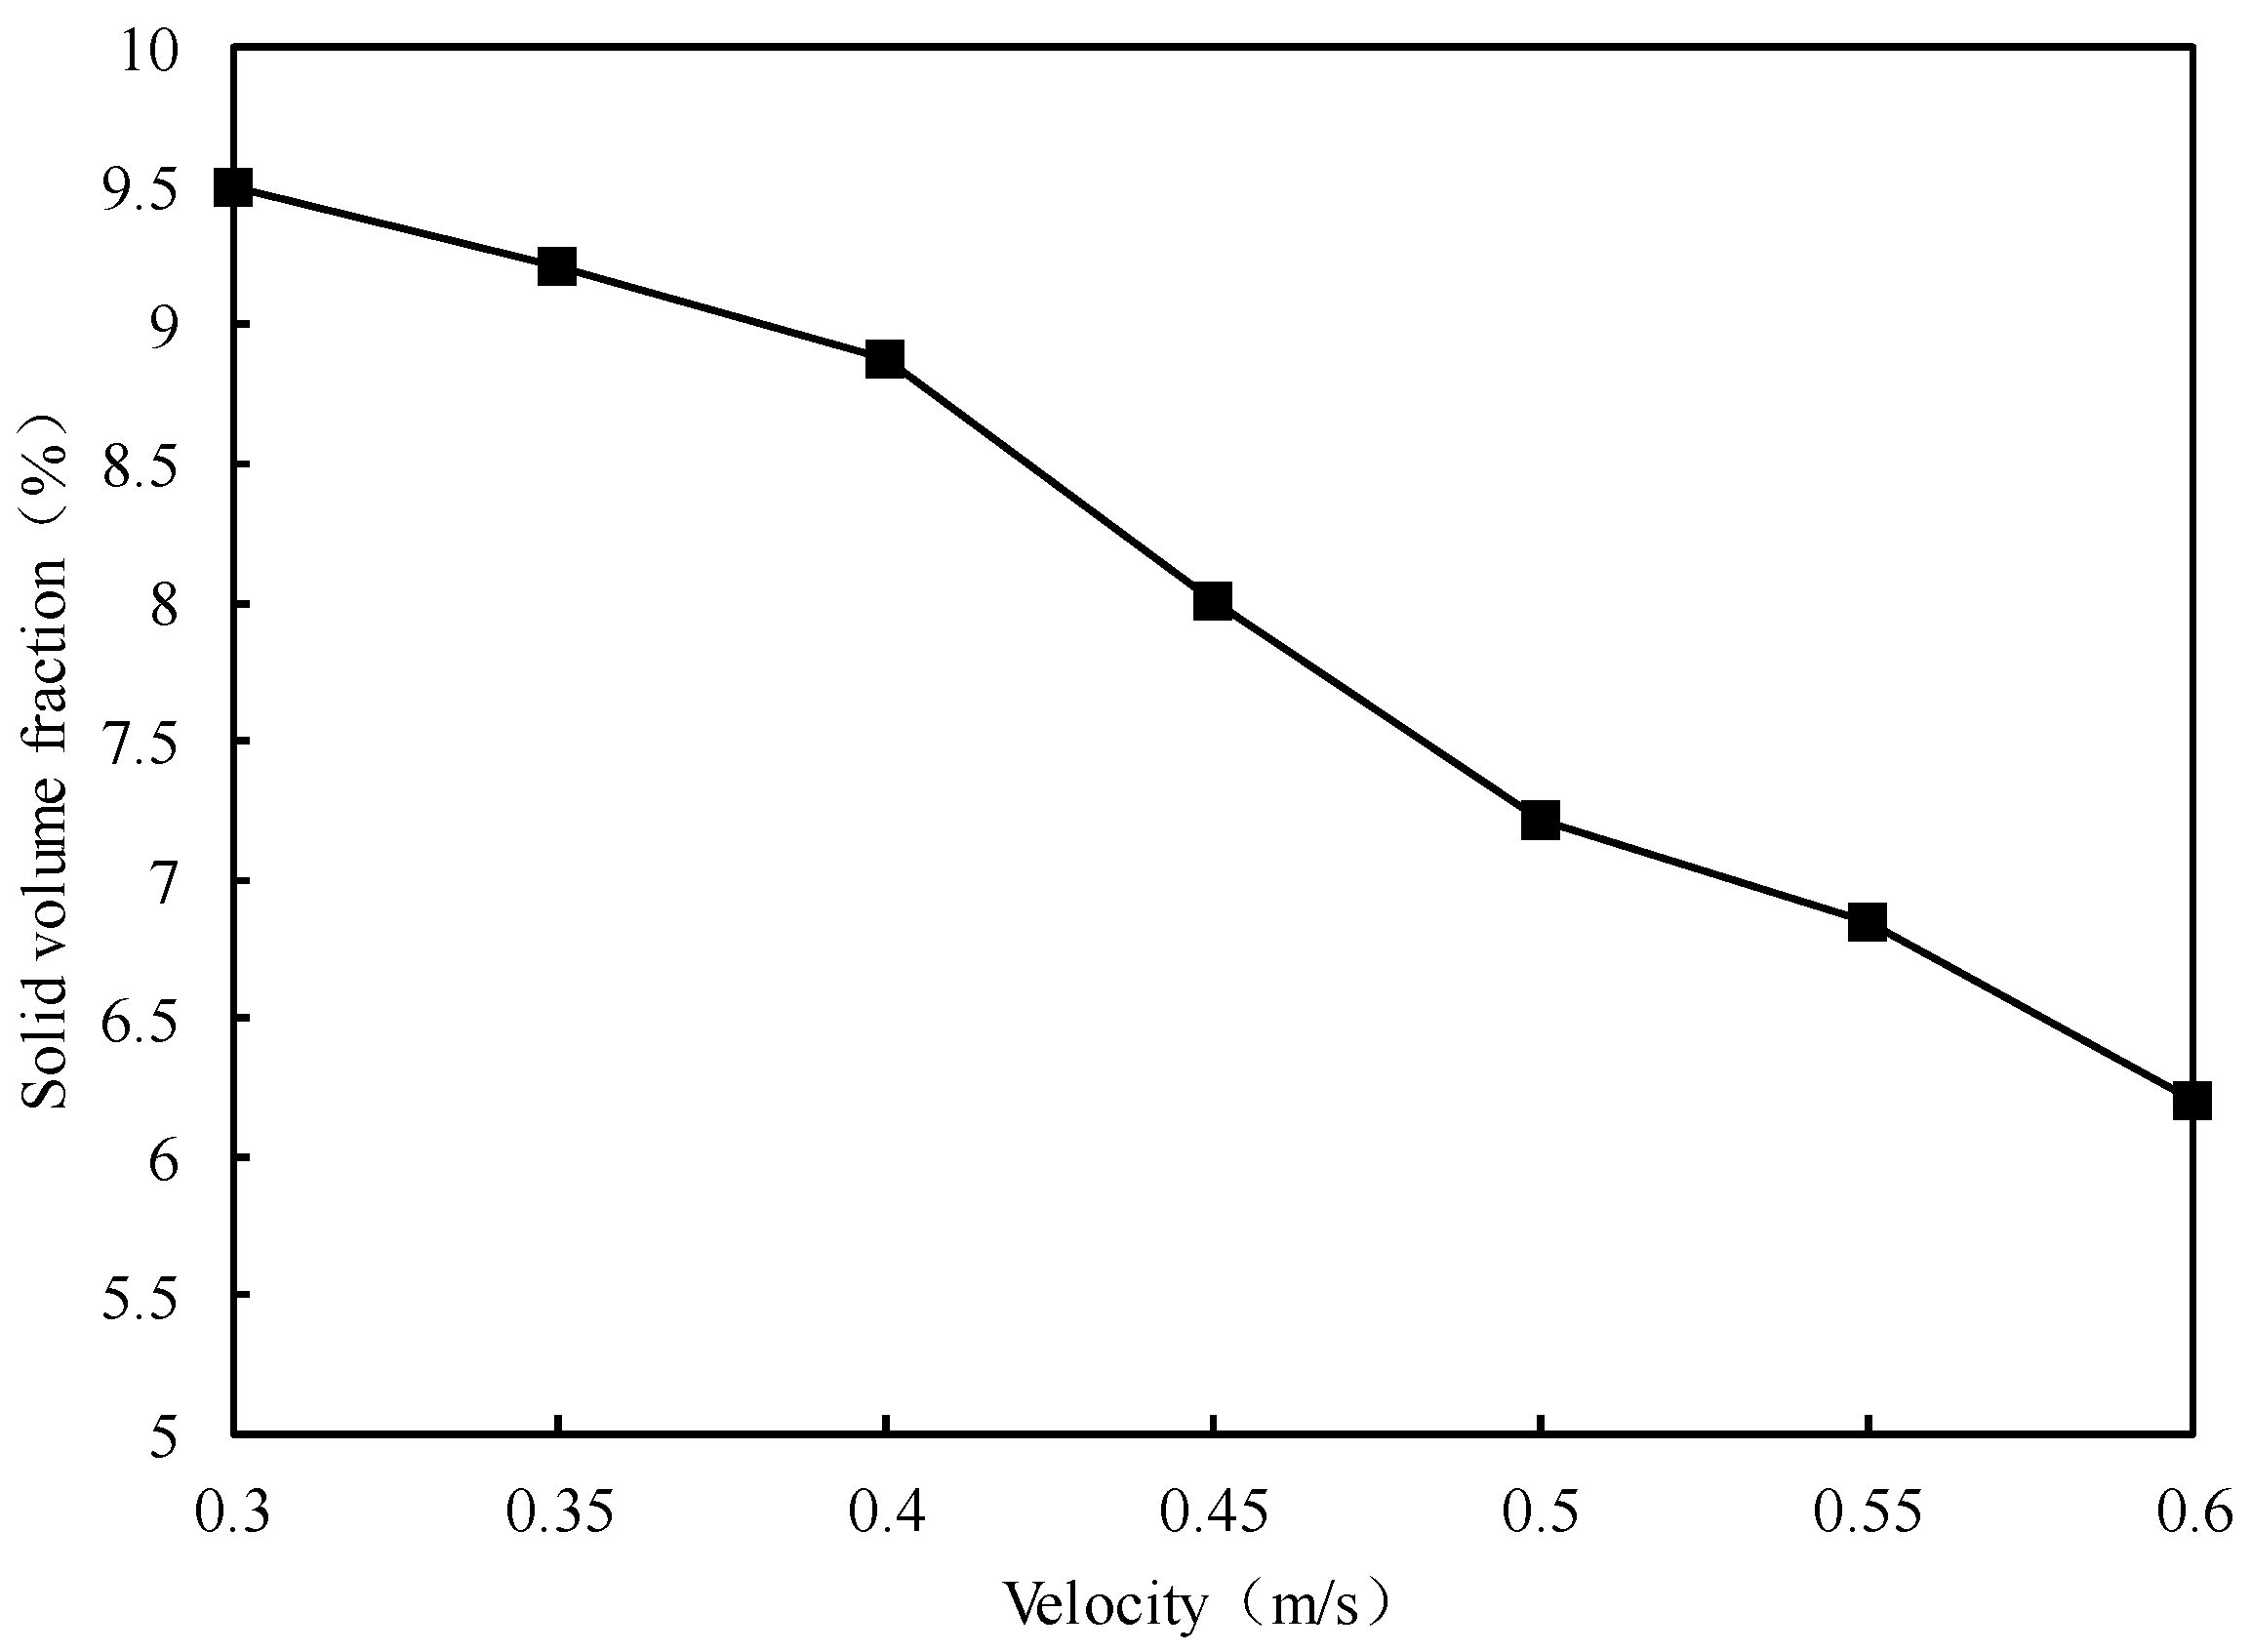
Among all the factors, drilling fluid velocity exhibits the highest first-order sensitivity coefficient and interaction sensitivity, serving as the dominant factor controlling the cuttings carrying efficiency. Higher velocities significantly enhance the fluid’s axial flushing force and vertical lifting force, effectively reducing cuttings deposition. An optimized range of 0.55–0.60 m/s is recommended to ensure the continuous and stable carrying capacity of the drilling fluid.
Drill pipe rotational speed acts as a secondary dominant variable, playing a significant role in enhancing vortex disturbances and promoting cuttings resuspension. It also shows a strong interaction coupling with stabilizer parameters—including the number, helical angle, and flow area. It is suggested to maintain the drill string rotation speed between 85–95 rpm to fully stimulate the vortex-induced carrying capacity and to strengthen fluid shear and cuttings detachment without compromising flow-field stability.
Regarding the number of stabilizers, the analysis indicates that arranging two stabilizers achieves optimal disturbance coverage and cuttings dispersion under the current wellbore geometry. Excessive stabilizers may increase the local flow resistance and pressure drop, negatively affecting the overall flow efficiency; thus, two stabilizers are recommended.
For the stabilizer helical angle, the simulation results show that its influence on cuttings transport mainly manifests through enhanced disturbances and shear intensification. Too small an angle results in insufficient disturbances, while too large an angle can cause flow deflection and local deposition. Therefore, controlling the helical angle within 25–30° is advised to effectively induce swirling flow structures and improve cuttings detachment and transport capacity.
The stabilizer flow area, as a critical geometric parameter affecting fluid passage capacity and disturbance intensity, shows a moderate influence in the interaction analysis. Selecting a flow area of 40–45% balances maintaining the disturbance intensity while avoiding excessive obstruction to the main flow path, facilitating an optimal trade-off between carrying performance and pressure-loss control.
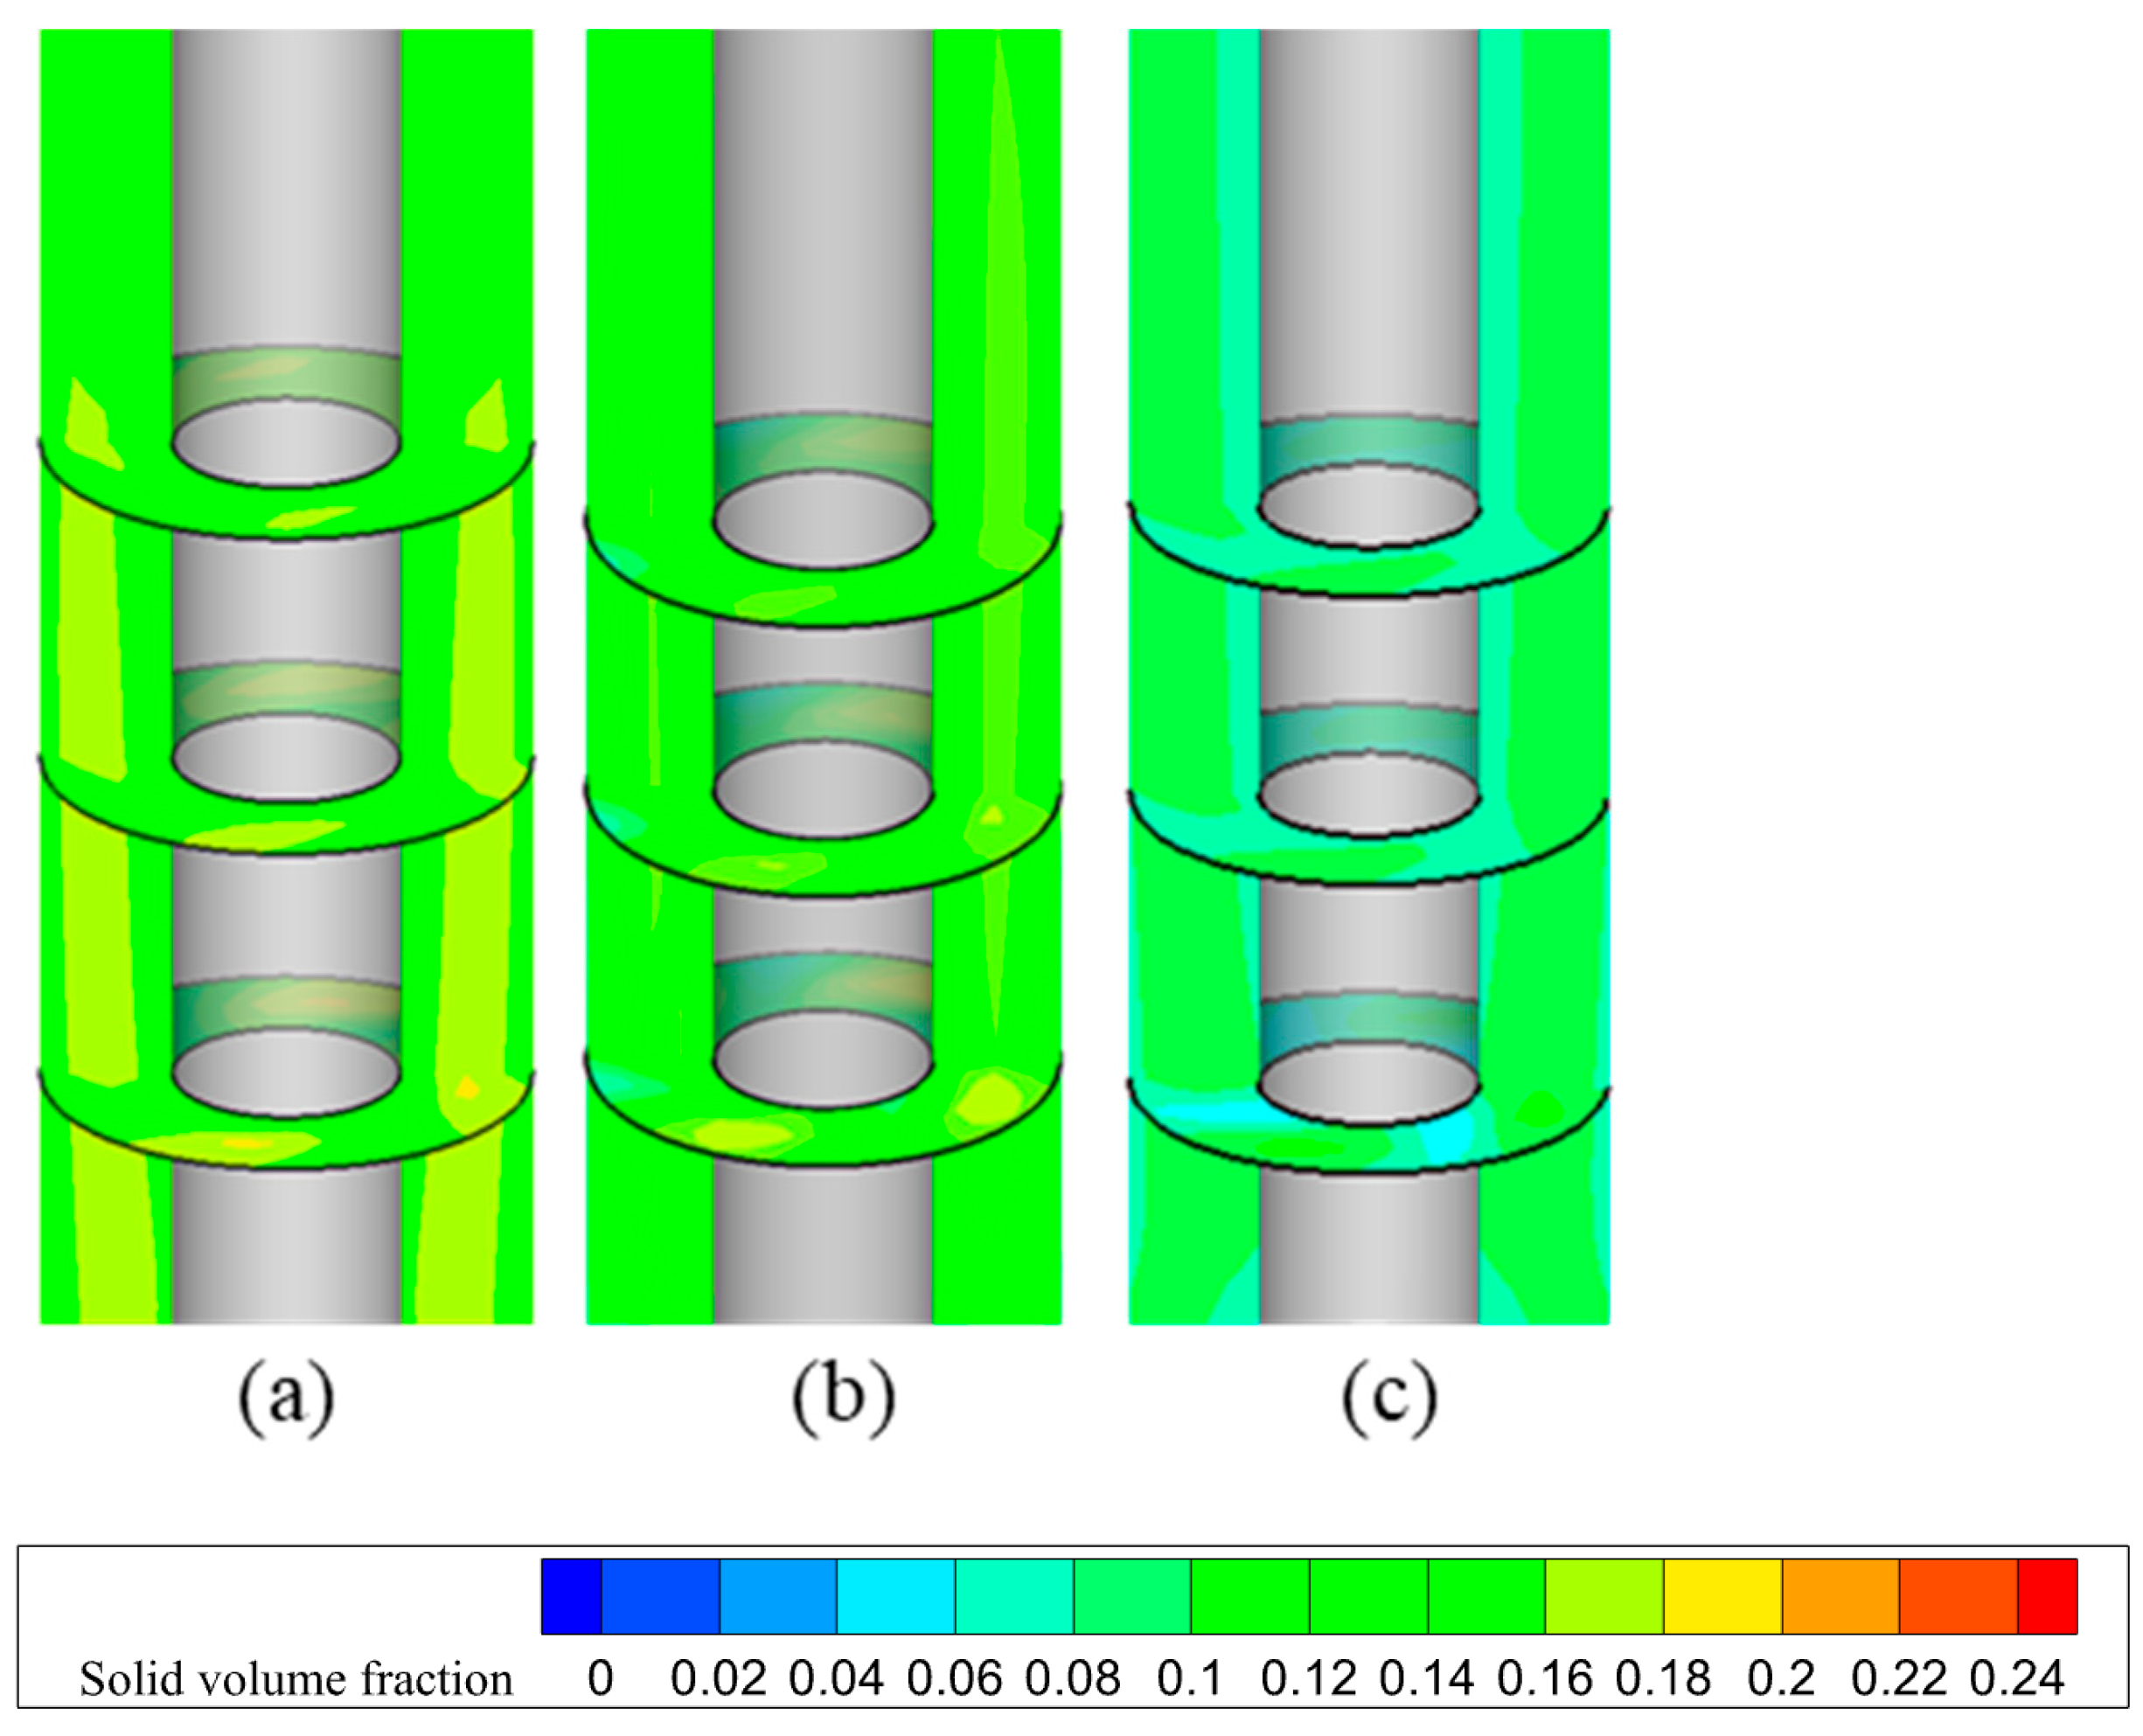
Overall, the recommended optimal parameter combination not only demonstrates excellent cuttings carrying performance at the dominant factor level but also exhibits enhanced system stability and engineering adaptability under multi-factor interaction effects. The simulation results of this combination scheme are shown in Figure 15. This scheme can provide theoretical support and a design basis for wellbore cleaning control and cuttings transport efficiency improvement in the drilling process of ultra-deep wells and large-diameter wellbores.

5. Conclusions

This study addresses critical engineering challenges such as low cuttings transport efficiency and poor wellbore cleaning in ultra-deep vertical wells with large-diameter boreholes. A three-dimensional borehole–drill pipe annulus model incorporating stabilizer-induced disturbances was developed. Numerical simulations of the cuttings transport process were conducted using the Eulerian two-fluid approach, which accurately captured the interaction between the drilling fluid and solid particles under various structural and flow conditions.
Based on the simulation outputs, a comprehensive sensitivity analysis framework was established. Firstly, single-factor simulations were conducted to observe the independent effect of each parameter on cuttings transport performance, as represented by the solid volume fraction. Then, variance-based global sensitivity analysis was performed using the same simulation data to quantify the first-order, full-order, and interaction contributions of each input parameter. This sequential approach ensured a consistent data foundation and provided both localized and holistic insights into the influence of different parameters. The main findings are summarized as follows:
(1)
Drilling fluid velocity is identified as the primary controlling parameter affecting the solid volume fraction, exhibiting the highest first-order and full-order sensitivity coefficients. It governs both the upward momentum and shear stress required for effective cuttings suspension. An optimal velocity range of 0.55–0.60 m/s is recommended to balance the transport capacity and flow stability.
(2)
The drill string rotational speed and number of stabilizers are secondary dominant factors, which are closely associated with the intensity of flow-field disturbances and demonstrate significant nonlinear interaction effects. However, at the highest interaction coefficient for this factor, optimal conditions are 85–95 rpm for the rotation speed and two stabilizers, which enhance the cuttings resuspension while maintaining acceptable pressure-drop levels.
(3)
Although the stabilizer helical angle and flow area exhibit relatively low first-order sensitivity, they show notable interaction effects. A helical angle of 25–30° and a flow area of 40–45% are recommended to enhance swirling disturbances and cuttings transport efficiency without significantly impeding the main flow path.
(4)
The sensitivity results collectively indicate that cuttings transport efficiency is governed by multi-parameter coupling rather than isolated parameter effects. The integrated analysis of first-order and full-order indices provides a more complete understanding of parameter interactions, avoiding misinterpretation from single-factor optimization alone. This also highlights the necessity of considering interaction terms when adjusting drilling parameters in complex wellbore environments.
(5)
The proposed optimal parameter configuration, derived from a unified simulation-sensitivity workflow, shows both strong simulation performance and practical applicability. It provides clear theoretical guidance and technical reference for enhancing wellbore-cleaning performance in ultra-deep wells approaching 10,000 m in depth, thereby supporting safer and more efficient deep drilling operations.

Author Contributions

Conceptualization, Q.W.; Methodology, L.L.; Software, J.Z.; Validation, J.G.; Formal analysis, X.L. and G.J.; Data curation, F.Z. and H.Y. All authors have read and agreed to the published version of the manuscript.

Funding

This research was funded by the China National Petroleum Corporation Science and Technology Project: Research on Fundamental Theory and New Technologies and Methods for Complex Oil and Gas Drilling and Completion (No. 2024DJ103); the Research and Development and Application of Multi-Parameter Measurement Drill Bits Project (No. 2025ZG58); and the PetroChina Company Limited Science and Technology Project: Research on Key Technologies for Accelerating Well Engineering and Increasing Production in Ultra-deep, Dense Marine Carbonate Rocks (No. 2023ZZ16YJ05).

Data Availability Statement

The original contributions presented in this study are included in the article. Further inquiries can be directed to the corresponding author.

Conflicts of Interest

Authors Qing Wang, Li Liu, Jiawei Zhang, Xiaoao Liu, Guodong Ji and Fei Zhou were employed by the company CNPC Engineering Technology R&D Company Limited. Author Jianhua Guo was employed by the company Petro China Southwest Oil & Gasfleld Company. The remaining authors declare that the research was conducted in the absence of any commercial or financial relationships that could be construed as a potential conflict of interest.

References

  1. Sun, J.; Yang, J.; Bai, Y.; Lyu, K.; Liu, F. Research Progress and Development of Deep and Ultra-Deep Drilling Fluid Technology. Pet. Explor. Dev. 2024, 51, 1022–1034. [Google Scholar] [CrossRef]
  2. Xiao, D.; Chen, W.; Deng, H.; Zhang, J.; Duan, M.; Xu, J.; Fang, P.; Shen, W.; Li, G. Flaky Cuttings Bed Distribution Model in a Shale Gas Horizontal Well Based on Experiment and Numerical Simulation. Energy Explor. Exploit. 2023, 41, 104–135. [Google Scholar] [CrossRef]
  3. Zhang, F.; Miska, S.; Yu, M.; Ozbayoglu, E.M.; Takach, N. Pressure Profile in Annulus: Solids Play a Significant Role. J. Energy Resour. Technol. 2015, 137, 064502. [Google Scholar] [CrossRef]
  4. Cui, F.; Zhang, S.; Chen, J.; Jia, C. Numerical Study on the Pressure Relief Characteristics of a Large-Diameter Borehole. Appl. Sci. 2022, 12, 7967. [Google Scholar] [CrossRef]
  5. Yu, Y.; Fang, P.; Zhang, B.; He, Y.; Li, G.; Xiao, D. Characteristics of Cuttings Migration with New Cuttings Removal Device in Horizontal Well. Geoenergy Sci. Eng. 2023, 231, 212379. [Google Scholar] [CrossRef]
  6. Sun, Y.; Song, X.; Zhou, M.; Xu, Z.; Zhu, Z.; Jing, S.; Xiao, H.; Qi, Y.; Li, G. Numerical Investigation of Flow Patterns in Cuttings Transport for Extended-Reach Horizontal Wells with Rotation Drillpipe. Powder Technol. 2024, 438, 119595. [Google Scholar] [CrossRef]
  7. Rahman, S.; Wei, D. Design Sensitivity and Reliability-Based Structural Optimization by Univariate Decomposition. Struct Multidisc Optim 2008, 35, 245–261. [Google Scholar] [CrossRef]
  8. Sudret, B. Global Sensitivity Analysis Using Polynomial Chaos Expansions. Reliab. Eng. Syst. Saf. 2008, 93, 964–979. [Google Scholar] [CrossRef]
  9. Ding, J.; Gidaspow, D. A Bubbling Fluidization Model Using Kinetic Theory of Granular Flow. AIChE J. 1990, 36, 523–538. [Google Scholar] [CrossRef]
  10. Mokhtari, M.; Tutuncu, A.N.; Weldu Teklu, T.W. A Numerical Modeling Study for the Impact of Casing Drilling on Wellbore Stability. In Proceedings of the SPE Unconventional Resources Conference, Calgary, AB, Canada, 5 November 2013; SPE: Calgary, AB, Canada, 2013; p. SPE-167166-MS. [Google Scholar]
  11. Ghazanfari, V.; Imani, M.; Shadman, M.M.; Amini, Y.; Zahakifar, F. Numerical Study on the Thermal Performance of the Shell and Tube Heat Exchanger Using Twisted Tubes and Al2O3 Nanoparticles. Prog. Nucl. Energy 2023, 155, 104526. [Google Scholar] [CrossRef]
  12. Walton, O.R.; Braun, R.L. Viscosity, Granular-temperature, and Stress Calculations for Shearing Assemblies of Inelastic, Frictional Disks. J. Rheol. 1986, 30, 949–980. [Google Scholar] [CrossRef]
  13. Brilliantov, N.V.; Pöschel, T. Rolling Friction of a Viscous Sphere on a Hard Plane. Europhys. Lett. 1998, 42, 511–516. [Google Scholar] [CrossRef]
  14. Mathiesen, V.; Solberg, T.; Hjertager, B.H. Predictions of Gas/Particle Flow with an Eulerian Model Including a Realistic Particle Size Distribution. Powder Technol. 2000, 112, 34–45. [Google Scholar] [CrossRef]
  15. Lun, C.K.K.; Savage, S.B.; Jeffrey, D.J.; Chepurniy, N. Kinetic Theories for Granular Flow: Inelastic Particles in Couette Flow and Slightly Inelastic Particles in a General Flowfield. J. Fluid Mech. 1984, 140, 223–256. [Google Scholar] [CrossRef]
  16. Huilin, L.; Gidaspow, D.; Bouillard, J.; Wentie, L. Hydrodynamic Simulation of Gas–Solid Flow in a Riser Using Kinetic Theory of Granular Flow. Chem. Eng. J. 2003, 95, 1–13. [Google Scholar] [CrossRef]
  17. Schiller, A.N.L. Uber Die Grundlegenden Berechnungen Beider Schwerkraftaufbereitung. Z. Ver. Dtsch. Ing. 1933, 77, 318–320. [Google Scholar]
  18. Cioncolini, A.; Cassineri, S.; Duff, J.; Curioni, M.; Scenini, F. Micro-Orifice Single-Phase Flow at Very High Reynolds Number. Exp. Therm. Fluid Sci. 2018, 91, 35–40. [Google Scholar] [CrossRef]
  19. Chen, Y.; Li, W.; Wang, X.; Wang, Y.; Fu, L.; Wu, P.; Wang, Z. Research and Application of Geomechanics Using 3D Model of Deep Shale Gas in Luzhou Block, Sichuan Basin, Southwest China. Geosciences 2025, 15, 65. [Google Scholar] [CrossRef]
  20. Jing, Y.; Wang, T.; Zhang, B.; Zheng, Y.; Li, X.; Lu, N. Safety Risk Analysis of Well Control for Wellbore with Sustained Annular Pressure and Prospects for Technological Development. Chem. Technol. Fuels Oils 2025, 61, 110–119. [Google Scholar] [CrossRef]
  21. Zhang, B.; Lu, N.; Guo, Y.; Wang, Q.; Cai, M.; Lou, E. Modeling and Analysis of Sustained Annular Pressure and Gas Accumulation Caused by Tubing Integrity Failure in the Production Process of Deep Natural Gas Wells. J. Energy Resour. Technol. 2021, 144, 063005. [Google Scholar] [CrossRef]
  22. Han, S.-M.; Hwang, Y.-K.; Woo, N.-S.; Kim, Y.-J. Solid–Liquid Hydrodynamics in a Slim Hole Drilling Annulus. J. Pet. Sci. Eng. 2010, 70, 308–319. [Google Scholar] [CrossRef]
  23. Sobol′, I.M. Global Sensitivity Indices for Nonlinear Mathematical Models and Their Monte Carlo Estimates. Math. Comput. Simul. 2001, 55, 271–280. [Google Scholar] [CrossRef]
  24. Dai, H.; Ye, M. Variance-Based Global Sensitivity Analysis for Multiple Scenarios and Models with Implementation Using Sparse Grid Collocation. J. Hydrol. 2015, 528, 286–300. [Google Scholar] [CrossRef]
  25. Lai, X.; Meng, Z.; Wang, S.; Han, X.; Zhou, L.; Sun, T.; Li, X.; Wang, X.; Ma, Y.; Zheng, Y. Global Parametric Sensitivity Analysis of Equivalent Circuit Model Based on Sobol’ Method for Lithium-Ion Batteries in Electric Vehicles. J. Clean. Prod. 2021, 294, 126246. [Google Scholar] [CrossRef]
  26. Kumar, D.; Singh, A.; Kumar, P.; Jha, R.K.; Sahoo, S.K.; Jha, V. Sobol Sensitivity Analysis for Risk Assessment of Uranium in Groundwater. Env. Geochem Health 2020, 42, 1789–1801. [Google Scholar] [CrossRef]
  27. De Lataillade, A.; Blanco, S.; Clergent, Y.; Dufresne, J.L.; El Hafi, M.; Fournier, R. Monte Carlo Method and Sensitivity Estimations. J. Quant. Spectrosc. Radiat. Transf. 2002, 75, 529–538. [Google Scholar] [CrossRef]
  28. Saltelli, A. Sensitivity Analysis for Importance Assessment. Risk Anal. 2002, 22, 579–590. [Google Scholar] [CrossRef]
  29. Rezaei, A.; Nakshatrala, K.B.; Siddiqui, F.; Dindoruk, B.; Soliman, M. A Global Sensitivity Analysis and Reduced Order Models for Hydraulically-Fractured Horizontal Wells. arXiv 2018, arXiv:1812.03424v1. [Google Scholar] [CrossRef]
  30. Keramati, H.; Birgersson, E.; Kim, S.; Leo, H.L. A Monte Carlo Sensitivity Analysis for a Dimensionally Reduced-Order Model of the Aortic Dissection. Cardiovasc. Eng. Technol. 2024, 15, 333–345. [Google Scholar] [CrossRef]
  31. Zhao, J.; Huang, W.; Gao, D. Study on Flow Pattern Transition of Cuttings Transport in Extended-Reach Drilling. Geoenergy Sci. Eng. 2024, 238, 212910. [Google Scholar] [CrossRef]
  32. Zhao, J.; Huang, W.-J.; Gao, D.-L.; Li, W.-L. Coupling Analysis of Transient Cuttings Transport and Tubular Mechanical Behaviors in Extended-Reach Drilling. Pet. Sci. 2025, 22, 1252–1269. [Google Scholar] [CrossRef]
Figure 1. Schematic diagram of the stabilizer blade helical angle.
Fluids 10 00187 g001
Figure 2. Schematic diagram of the large-diameter wellbore annulus model and stabilizer structure. (a) Large-diameter vertical wellbore annulus model; (b) three-blade stabilizer; (c) four-blade stabilizer; (d) five-blade stabilizer.
Fluids 10 00187 g002
Figure 3. Mesh-independence test and time-step sensitivity analysis.
Fluids 10 00187 g003
Figure 4. Computational domain and mesh configuration used in the simulation. (a) Overall mesh layout of the large-diameter vertical well; (b) cross-sectional view of the annular computational domain; (c) mesh configuration around the stabilizer region.
Fluids 10 00187 g004
Figure 5. Validation of the present prediction against experimental results from Han [22].
Fluids 10 00187 g005
Figure 6. Relationship between the drilling fluid velocity and the solid volume fraction in a large-diameter wellbore.
Fluids 10 00187 g006
Figure 7. Cuttings distribution in the annulus under different drilling fluid flow velocities. (a) Cuttings distribution at a flow velocity of 0.3 m/s; (b) cuttings distribution at a flow velocity of 0.45 m/s; (c) cuttings distribution at a flow velocity of 0.6 m/s.
Fluids 10 00187 g007
Figure 8. Relationship between the drill pipe rotational speed and the solid volume fraction in a large-diameter wellbore annulus.
Fluids 10 00187 g008
Figure 9. Velocity contour maps in the annulus under different rotation speeds. (a) Drill pipe rotational speed at 60 rpm; (b) drill pipe rotational speed at 80 rpm; (c) drill pipe rotational speed at 120 rpm.
Fluids 10 00187 g009
Figure 10. Relationship between stabilizer parameters and the solid volume fraction in the annulus of a large-diameter wellbore.
Fluids 10 00187 g010
Figure 11. First-order and full-order sensitivity coefficients.
Fluids 10 00187 g011
Figure 12. Comparison of the solid volume fraction between the reduced model and the full model.
Fluids 10 00187 g012
Figure 13. Local sensitivity response to parameter perturbation.
Fluids 10 00187 g013
Figure 14. Interaction impact coefficients among parameters.
Fluids 10 00187 g014
Figure 15. Simulated results of solid transport in large-diameter wellbores under different optimization strategies. (a) Optimization result based on single-factor analysis; (b) optimization result based on full-order sensitivity analysis.
Fluids 10 00187 g015
Disclaimer/Publisher’s Note: The statements, opinions and data contained in all publications are solely those of the individual author(s) and contributor(s) and not of MDPI and/or the editor(s). MDPI and/or the editor(s) disclaim responsibility for any injury to people or property resulting from any ideas, methods, instructions or products referred to in the content.

