Article

Impact of Viscous Droplets on Dry and Wet Substrates for Spray Painting Processes †

1
Fraunhofer Institute for Manufacturing Engineering and Automation, 70569 Stuttgart, Germany
2
Faculty of Science, Energy and Building Services, University of Applied Sciences, 73728 Esslingen, Germany
*
Author to whom correspondence should be addressed.
This paper is an extended version of our paper published in Ye, Q.; Dreher, M.; Tiedje, O.; Shen, B.; Domnick, J. Numerical simulation of flake orientation during droplet impact on substrates in spray painting processes. In Proceedings of the ICLASS, Edinburgh, UK, 29 August–2 September 2021.
Fluids 2025, 10(5), 131; https://doi.org/10.3390/fluids10050131
Submission received: 24 February 2025 / Revised: 5 May 2025 / Accepted: 7 May 2025 / Published: 15 May 2025
(This article belongs to the Special Issue Contact Line Dynamics and Droplet Spreading)

Abstract

:
This paper presents numerical studies of the viscous droplet impact on dry and wetted solid walls for spray painting applications, focusing on air entrapment, film structure, and flake (flat pigment) orientation. The results were compared with experimental observations using various high-speed camera arrangements. For paint droplet impact on dry substrates, a dynamic contact angle model was developed and used in numerical simulations. This contact angle model was verified with experimental observations. For the droplet impact on wet surfaces, characteristic crater sizes (diameter and depth) were defined considering also the effect of the film thickness. A strong correlation with the droplet impact Reynolds number was observed. In addition, a user-defined 6DOF (6-degrees-of-freedom) solver was implemented in a CFD program to perform calculations of rigid body motions within the impacting droplet, technically relevant for the resulting effect of flakes in metallic effect paints. The developed models were applied in parameter studies to further clarify the existing dependencies on application and fluid parameters more quantitatively. The simulation results are helpful to understand and to improve painting processes with respect to the final quality parameters.

1. Introduction

The collision of liquid drops with solid surfaces occurs in many engineering applications such as spray painting, spray cooling, and ink-jet printing. This paper presents a summary of the research results of a study of spray painting using model liquids and real paint. The motivation for the investigation lies in the huge industrial demand of understanding the occurrence of air entrapment during drop impact, which may lead to so-called pinholes after drying and baking, the final wavy surface structure (also called orange peel), and the behavior of pigment during droplet impact, enabling, e.g., metallic effects of coatings, which are very popular in the automotive industry.
A lot of research has already been carried out on droplet impact dynamics. Experimental observations of the impact of liquid drops on dry solid surfaces at room temperature, including an analysis of air entrapment, have been reported extensively [1,2,3,4,5,6,7]. When using flash photographic methods and high-speed cameras in conjunction with different light settings, such as back or oblique lighting with and without light diffusers, the authors observed bubble formation at the stagnation point and assumed bubble formation because of a dimple created on the drop surface at the impact point [1,6]. In investigations using viscous drops, Thoroddsen et al. [4] found in increasing number of bubble entrapment events during the drop spreading process, resulting from the localized contact of the levitated lamella with the solid substrate, especially for intermediate values of the impact Reynolds number (Re~250–350). Similar research has also been carried out by Palacios et al. [5]. Besides myriads of air bubbles at the interface between liquid and solid, they also observed two rings of microbubbles under impacting glycerol/water drops on a dry glass surface at Reynolds and Weber numbers around the splashing/deposition threshold. They further analyzed the dependency of the behavior of the two rings of microbubbles on the drop impact velocity and the relevant dimensionless numbers.
The maximal droplet-spreading diameter that is interesting for technical applications was correlated (see [8,9]) with non-dimensional numbers, i.e., Weber and Reynolds numbers, by using experimental results. In general, large droplets, e.g., D > 500 µm, have to be used in the experiment. For smaller droplets (50–300 µm), especially of opaque liquids, which are relevant for spray painting processes, it is very difficult to obtain experimentally qualified time-resolved images of the entrapment of air bubbles by drop impingement. However, the smaller droplet size range has been considered in various numerical studies, focusing also on the air entrapment during droplet impact [10,11,12].
The impact dynamics of non-Newtonian droplets, namely yield-stress fluid droplets, have been studied experimentally [13,14] and numerically [11,12], in which the influence of the rheological parameters on the droplet spreading and recalling processes was evaluated. Furthermore, contact angle models that have to be applied in numerical simulations were studied and discussed in detail [15,16].
With regard to the droplet impact on wet solid surfaces, there are some experimental and numerical investigations [17,18,19,20,21]. Weiss and Yarin [17] have simulated the impact of droplets on liquid films using a boundary-integral method for different impingement velocity and surface tension values. Different outcomes of droplet impact on substrates were analyzed. However, in their study, the effect of viscosity was neglected. Thoroddsen and Thoraval [22] examined the dynamics of a droplet on a liquid film both experimentally and numerically using relatively large droplets (D = 4.64 mm). They also investigated the air disc formation and visualized the evolution of smaller bubbles. Microbubble entrainment on thin liquid films under droplet impacts on an inclined surface was experimentally investigated by Tran et al. [21]. They found that the formation of large-area microbubbles is driven by a thin intervening air gap and contact line instability, analogous to classic coating instabilities.
In spray coating processes with metallic-effect paints, pigments (flat, 5–40 µm broad flakes) are widely used. From practical experiences, it is already well-known that the initial pigment/flake orientation in the paint layer, primarily at the early stage of film formation and before the subsequent solvent evaporation and baking, influences the final metallic effect significantly. Therefore, it is strongly suspected that processes during viscous droplet impact have a decisive influence on pigment orientation. For a strong metallic effect, usually, a pigment orientation parallel to the substrate is desired. Droplets with high impact velocities, namely high kinetic energies, were considered to be helpful for a surface-parallel flake orientation. Studies focusing on the flake movement inside the droplet and in the film are still quite limited. Although a few predictions of flake orientation were carried out based on mathematical analysis [23] and the flow field of two-dimensional droplet impact calculation [24], the corresponding results should be further verified. Recently, a numerical study [25] of the flake orientation during droplet impact on solid surfaces was carried out. Multiple flake particles inside the droplet were applied. The effects of the initial positions of flakes on the final orientation and of the interaction between flakes were investigated.
In our previous study [26,27,28], numerical simulations of the flake orientation in viscous droplets and the film structure due to droplet impact on wet substrates were performed. However, the parameter investigations were limited. The present paper offers detailed numerical studies of viscous droplet impact on dry and wetted solid walls, focusing on air entrapment, film structure, and flake orientation. In that way, a contact angle model necessary in numerical simulations was developed for the paint droplet impact process. In addition, a user-defined 6DOF (6-degrees-of-freedom) solver was implemented in a CFD program to enable rigid body (flake) motion calculations within the impacting droplet. The developed models were applied in parameter studies to further clarify the existing dependencies on application and fluid parameters more quantitatively. Experimental studies were carried out with a high-speed camera to produce experimental observations that validates the simulation results.
The paper is structured as follows: The experimental setup and measuring technique are explained in Section 2. Section 3 provides the basic numerical methods. The simulation results of droplet impact on a dry solid wall, including validation of the dynamic contact angle model, are shown in Section 4. In Section 5, we discuss the film structure as well as the entrapped air bubbles during droplet impact on dry/wet solid walls. Section 6 provides the simulation results of the flake orientation during droplet impact on dry/wet substrates. Section 7 summarizes the present work.

2. Experimental Setup and Measuring Techniques

In this section, basic experimental setups and measuring techniques are described. The experimental studies carried out provided useful information for the validation of the following simulation results.

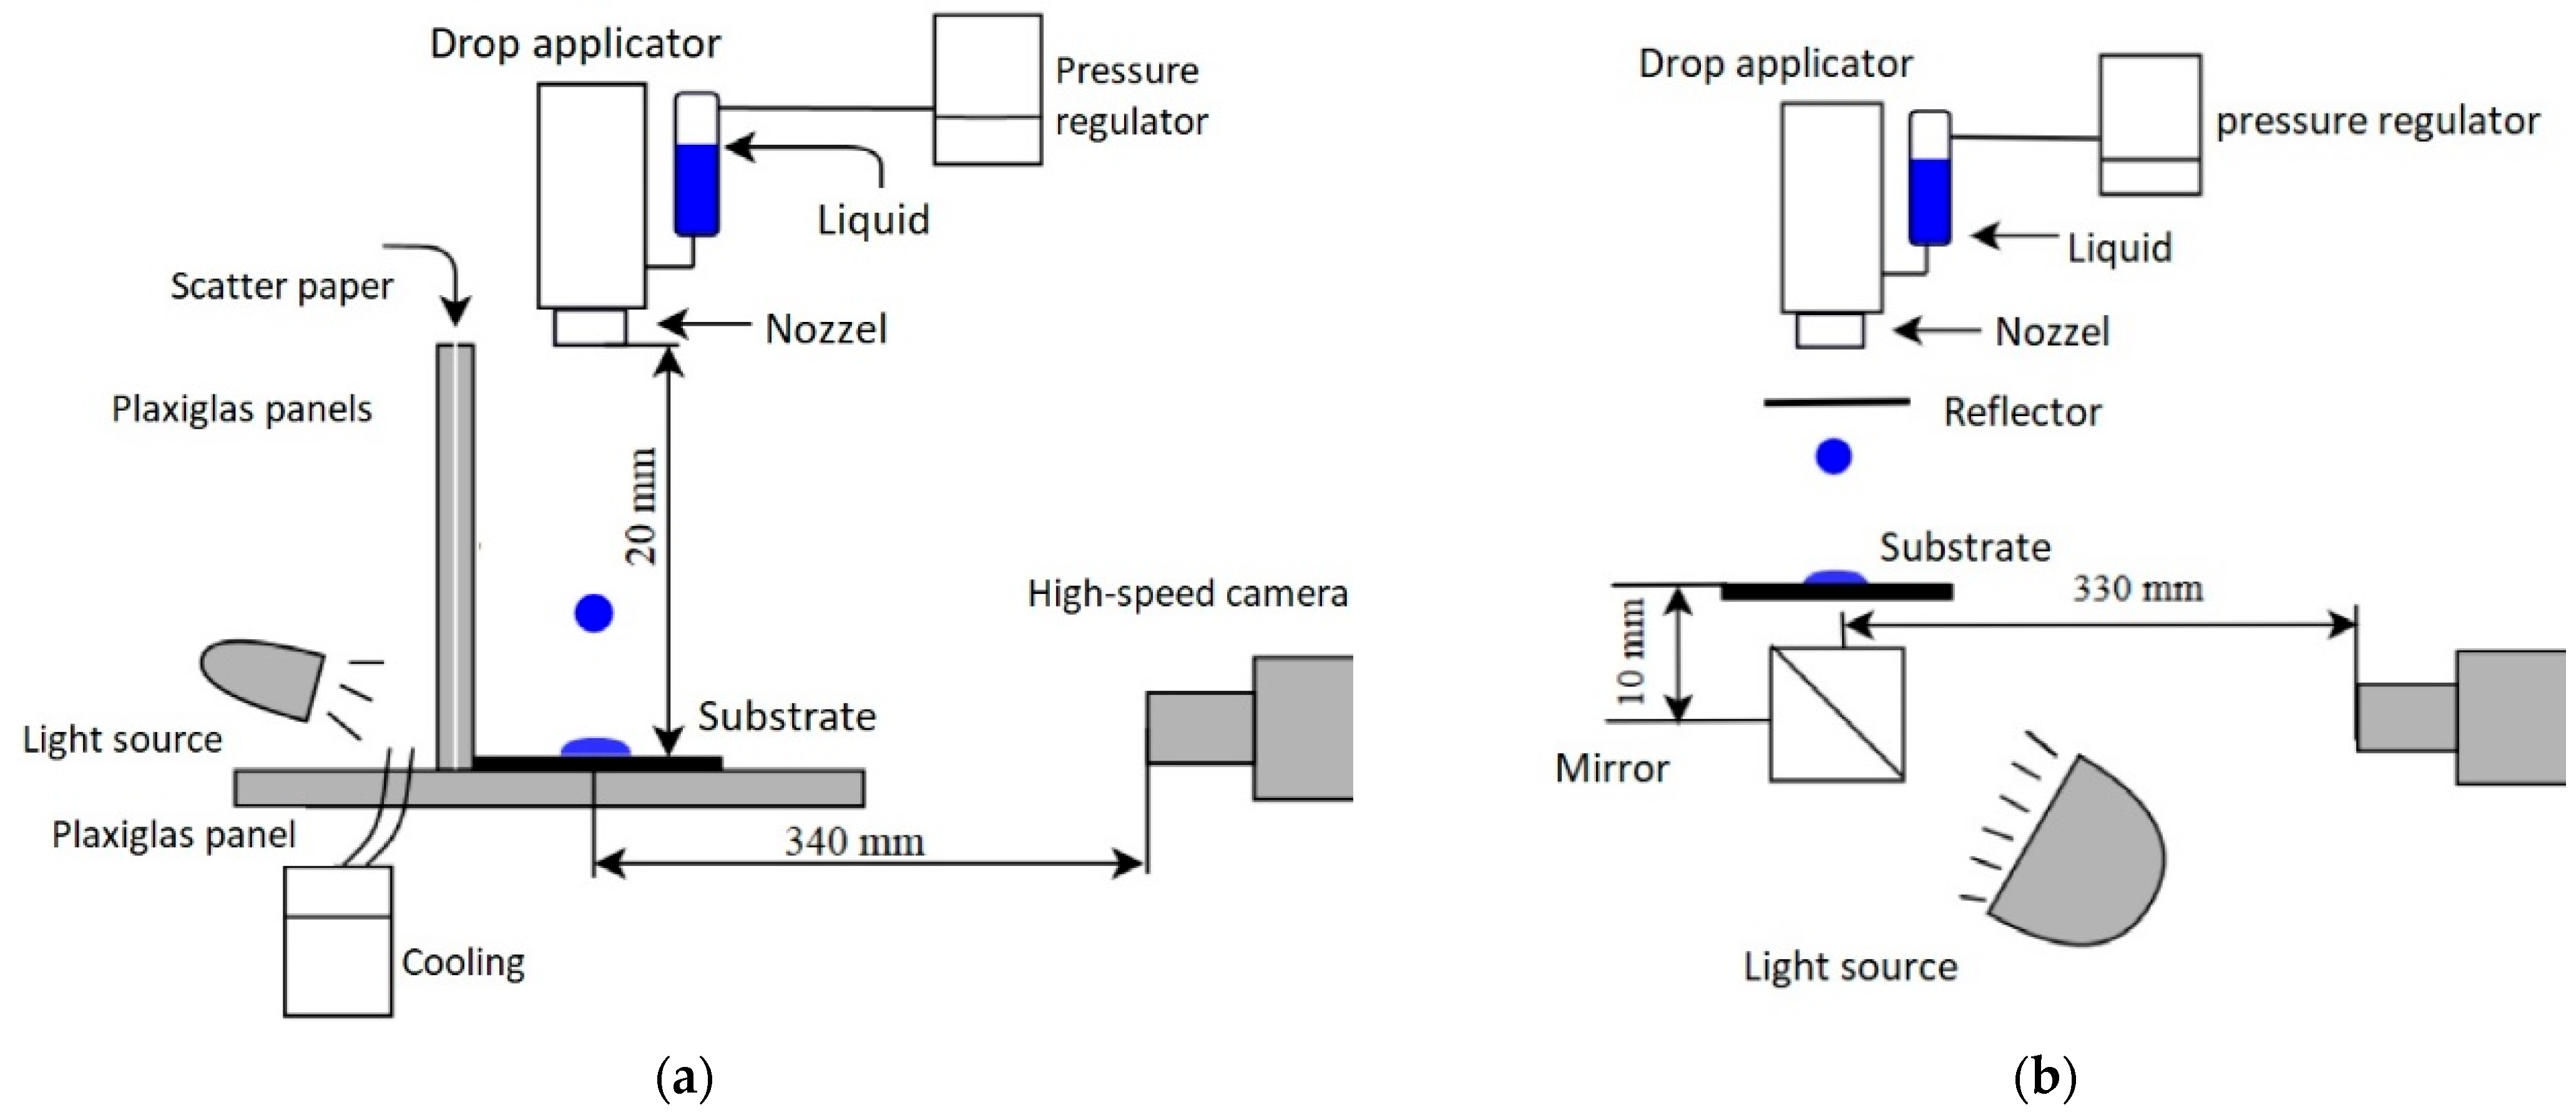
2.1. Investigations of Single Droplet Impacts on Dry Solid Walls

Viscous droplets were generated using an industrial Drop-on-Demand device, in which a piezo-valve system that generates a short dosing impulse in the range of 1 ms was applied. Details of the device can be found in [29]. When using a 200 µm nozzle diameter, well-defined droplets (D = 280–450 µm) could be generated, depending on the liquid properties and the operating conditions. Table 1 shows characteristic droplet properties that were used in our numerical study. The experimental setup is shown in Figure 1. A high-speed camera (FASTCAM SA-X, Photron, Buckinghamshire, UK, Version: Photron Fastcam Viewer 4) was applied to obtain images of the evolution of the droplet contours and to determine the impact velocities (Figure 1a). The observation of the air entrapment on the substrate (in these cases, a transparent glass plate) was carried out using the up-view setup (observation from the glass plate backside).

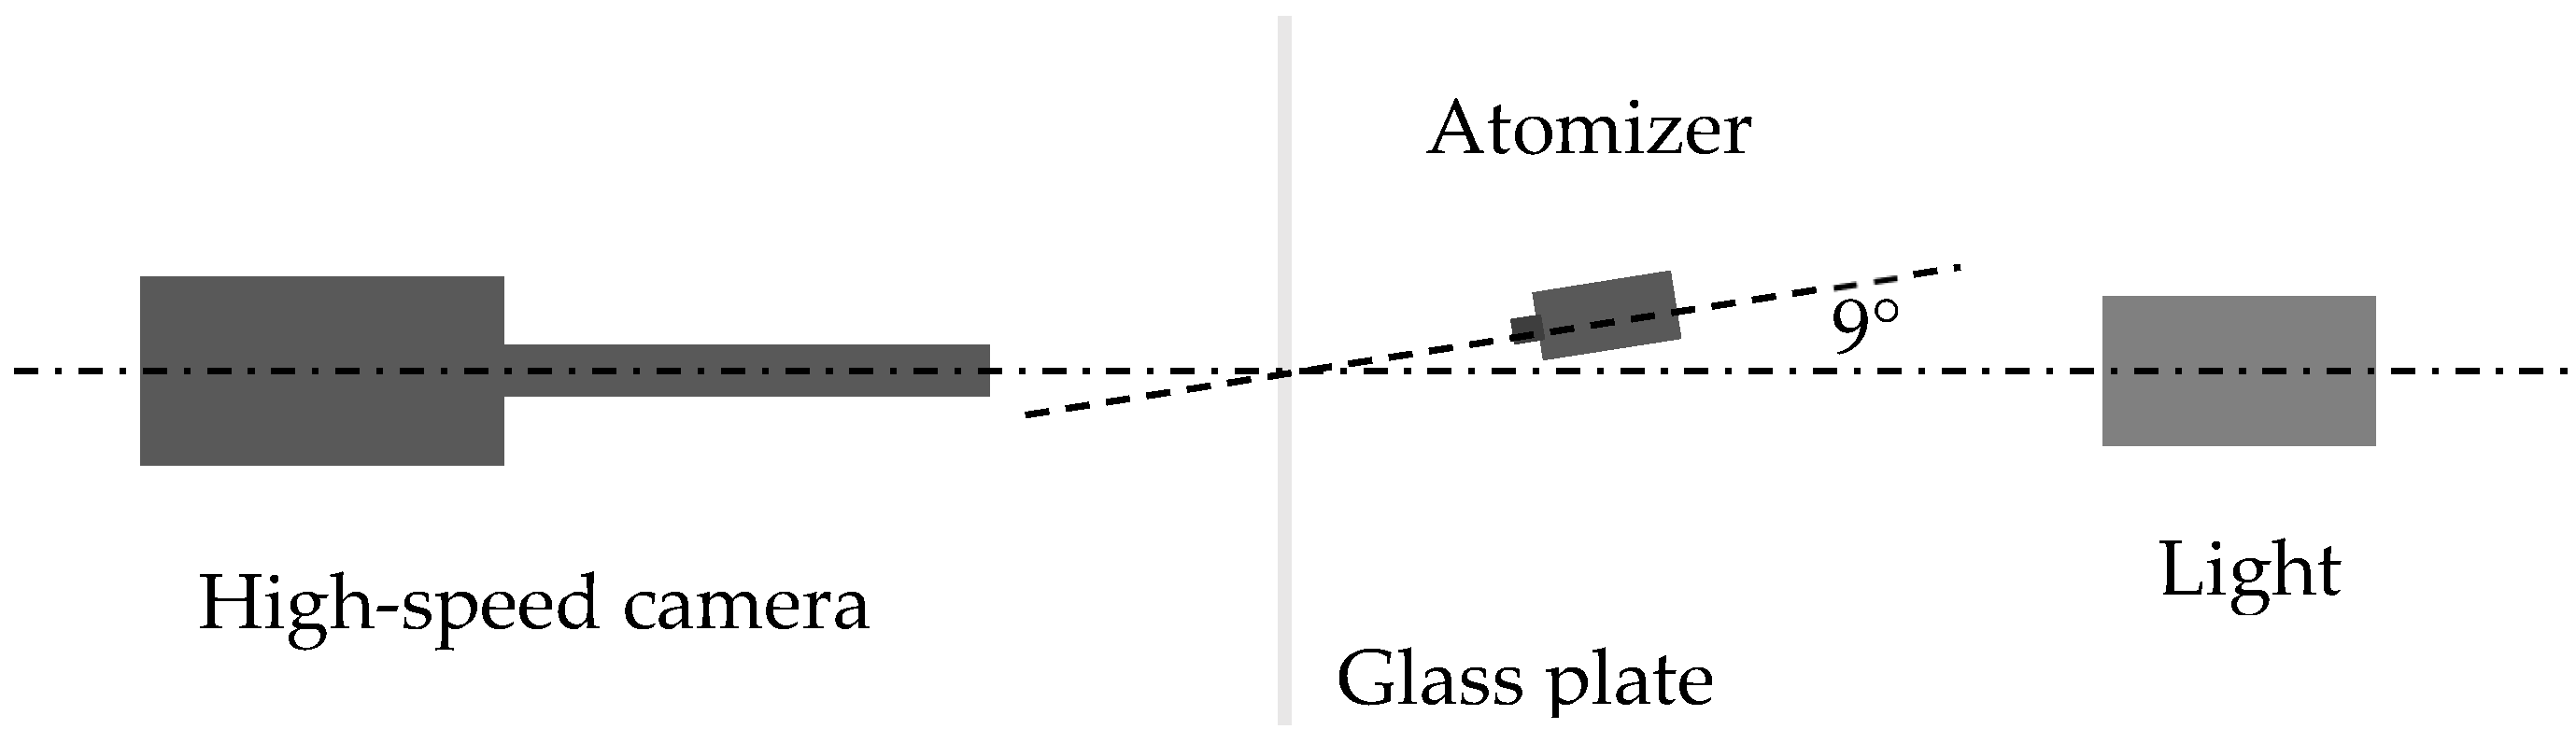
2.2. Investigations of Droplet Impact and Air Entrapment on Wetted Solid Walls Using an Atomizer

Visualization of droplet impact events on a glass plate using an industrial air atomizer was carried out with the setup shown in Figure 2. An air spray gun (SATA LPS RB 2000RP, SATA, Kornwestheim, Germany) and a solvent basecoat were applied. In the first step, a wet paint layer with a well-defined thickness was applied on the glass plate. Subsequently, the resulting droplet impact processes on the wet layer were recorded by the high-speed camera. Snapshots with an image size of approx. 1.8 mm × 1.8 mm and a 1024 × 1024 pixel resolution were analyzed. In general, many air bubbles could be observed in the paint layer. In Section 5, these visualization results will be compared to the simulation results.

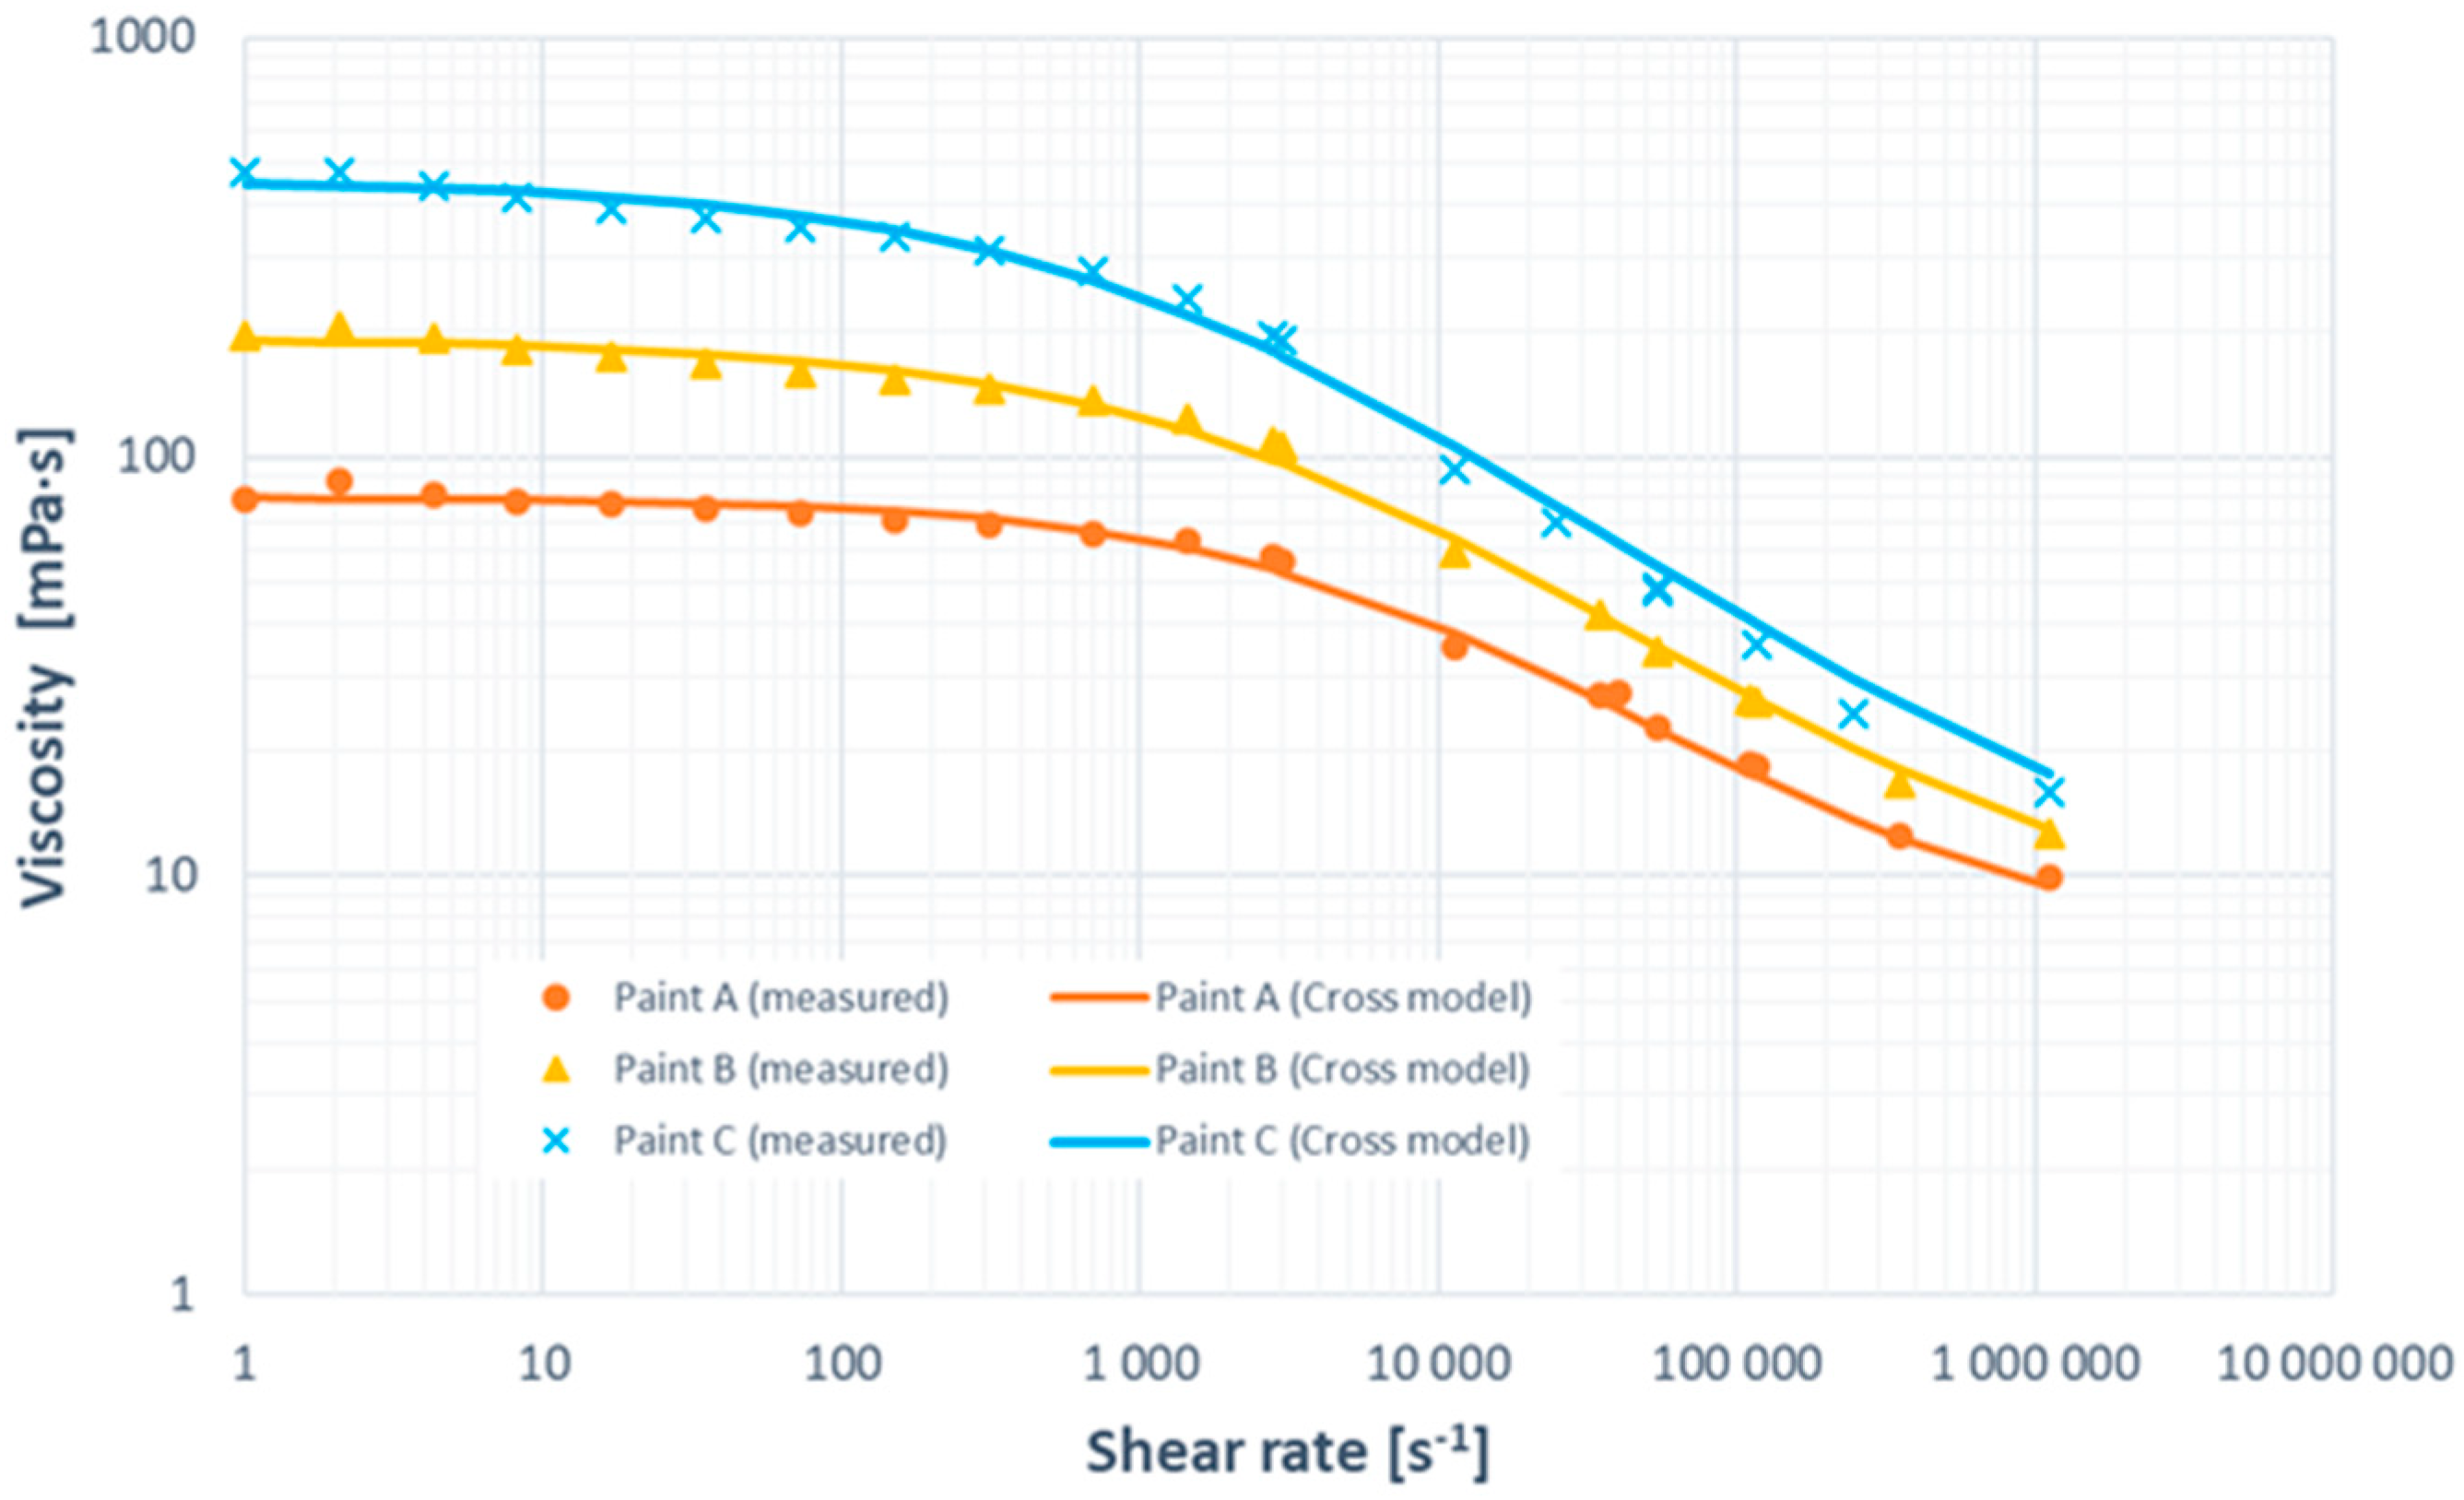
2.3. Rheological Properties of the Paint Used for Droplet Impacts on Wetted Solid Walls

Three model paints consisting of varying mass fractions of n-butyl acetate in a basic paint formulation were used in the present study. For the determination of the rheological properties, the paint material was collected from the solid wall directly after spray painting, thereby revealing the effect of solvent evaporation on the viscosity during the droplet movement between atomizer and target. The shear viscosity was experimentally measured using a rotational rheometer in the low shear rate range up to 3000 s−1 and a capillary rheometer in the high shear rate range up to 106 s−1. The measured viscosities as a function of the shear rate are illustrated in Figure 3. Like most of the water-based paint liquids used in industrial applications, the model paints show a non-Newtonian behavior, namely a shear-thinning behavior, i.e., the viscosity decreases with an increasing shear rate.
In the numerical simulations, the observed non-Newtonian behavior was considered by applying Cross models, which are also plotted in Figure 3 as solid lines.
η = η + η 0 η 1 + t · γ ˙ m
In the above equation, η and γ ˙ are the shear viscosity and the shear rate, respectively. η represents the shear viscosity when the shear rate approaches infinity, and η 0 the viscosity when the shear rate approaches zero, the so-called zero viscosity. t and m are the consistency index and flow index, respectively. Each model paint has been applied in two variants with a static surface tension of either 0.024 N/m or 0.067 N/m.

3. Basic Numerical Methods

The droplet impact and spreading process on the surface can be treated by the Volume of Fluid (VOF) method for interfacial flow problems. Hereby, two or more immiscible fluids can be modeled by solving a single set of momentum and mass equations, including the tracking of the volume fractions of each of the fluids throughout the domain. The numerical simulations in this work were carried out with the commercial CFD code ANSYS-FLUENT (Version 24) based on the finite-volume approach.
In the present application, time-dependent VOF calculations were performed using an explicit scheme. A geometric reconstruction scheme for the volume fraction discretization was used, ensuring a sharp and low-diffusive interface discretization. To accommodate surface tension effects, the CSF model with wall adhesion modeling was used. The PRESTO scheme was applied for the pressure discretization.
Cartesian grids with local mesh refinement in the relevant regions were created. As it is well-known that the VOF method is quite sensitive to the grid resolution, grid independence was verified by comparing measured and calculated spread and height factors of selected droplet impact events. D/∆x = 150 was obtained as a reasonable cell size and therefore applied around the droplet and in the liquid film on the substrate. Here, D denotes the droplet diameter and ∆x the grid size. In the far-field, coarser hexahedral meshes were used to reduce the total number of cells and the connected computational costs. For the simulation of droplet impact processes on wet solid surfaces, a relatively large computational domain had to be used. To reduce computational cells effectively, a dynamic mesh adaptation was applied, which was found to be especially necessary for large droplets. Consequently, the computational domains in the present study varied between 20 and 150 million cells. According to different simulation tasks, two-dimensional axisymmetric and 3-dimensional computational domains were applied. Further detailed important boundary conditions and models are described as follows.

3.1. Simulation of Viscous Droplet Impact on Dry Solid Surfaces

A computational domain with an extension of 2D × 2D × 1.5D was created for the simulation of droplet impacts on the dry solid surface with the flake pigment. Only a quarter of the spherical droplet was calculated using symmetric boundary conditions to reduce the total number of cells. A variable flow field calculation time step was set, considering the CFL (Courant–Friedrichs–Lewy) number to be less than 1. The resulting time steps ranged from 5 × 10⁻⁹ to 1 × 10⁻⁷ s. Based on common spray painting conditions, droplet impact velocities between 0.5 and 10 m/s were investigated. The initial droplet position was chosen to be a few micrometers above the wall surface to be able to calculate the gas flow field in the vicinity of the droplet. The pressure inside the droplet, induced by the surface tension of the liquid, was calculated and properly initialized. The remaining domain was set to ambient pressure. A dry smooth wall with no-slip boundary conditions was used.
It is well-known that the numerical description of a dynamically moving contact line or contact angle during droplet impact on dry surfaces is not trivial and therefore quite challenging. Nevertheless, the concept of dynamic contact angles is widely used in VOF simulations to accommodate the adhesion behavior. However, the applicability of the corresponding models is quite problem-dependent, including variations in liquid and substrate properties as well as changing operating parameters. Hysteresis effects of the contact line and contact angle make the model development even more difficult. For further information, refer to [11,16]. Figure 4 shows the definition of the contact angle and contact line. The static (equilibrium) contact angle θ E is defined by Young’s equation σ L G cos θ E = σ S G σ S L , which is related to the surface tension of solid/vapor σ S G and solid/liquid σ S L interfaces. The contact angle observed experimentally at a moving contact line is defined as the dynamic contact angle θ D .
We have carried out experimental observations of viscous droplet impact on dry solid surfaces, focusing on the contour evolution during the spreading and receding process phases. Based on these results, a model for the dynamic contact angle was developed, which is further used in the simulations. Equation (2) describes this model in a mathematical manner. The main problem in the simulation of droplet movement on a dry substrate is the switching mechanism from the propagation contact angle to the static contact angle. The contact line oscillates strongly in the hysteresis region, resulting in a negative velocity while the droplet is not yet in the retraction phase. With the following treatment, smooth and sensible switching can be achieved.
θ D = θ A ,     i f     v c l > 0   θ i n t = 90 ° ,     i f     v c l ¯ < δ v c l < δ ,   where     δ = 0   . 1   θ ϕ ,     i f     θ ϕ < θ A   θ E ,     i f     θ ϕ θ E    
During the spreading phase, where the contact line velocity v c l is significantly positive, a constant advancing contact angle θ A is deployed. This angle is the largest contact angle that is observed before the wetting line starts to move in the direction of the gas phase. At maximum wetting, when the contact line movement stops and the droplet usually starts to recede, an intermediate contact angle θ i n t is set. This helps to suppress contact line movements, which are in accordance with experimental observations. v c l ¯ < δ v c l < δ is the mathematic treatment to determine the hysteresis situation. An average contact line velocity v c l ¯ based on three iteration time steps was used. A δ value was defined around zero velocity. If the angle between the fluid interface and the wall, calculated by the gradient of the VOF field (∇ϕ), is smaller than the advancing contact angle, the interphase angle is set as the contact angle   θ ϕ . It is secured that this angle decreases monotonically to the static or equilibrium contact angle   θ E . On the wall cells far away from the contact line, the equilibrium contact angle θ E is used, which ensures a reasonable wetting behavior on the wall.

3.2. Simulation of Viscous Droplet Impact on Wet Solid Surfaces

A thin film with a height between 30 and 60 µm and an infinitive width was applied on the substrate. As a first step, droplet impact processes were calculated using a two-dimensional axisymmetric geometry to obtain a general insight into the behavior of the gas–liquid interface as a function of relevant dimensionless numbers, namely, Re-, Oh-, and We-numbers. As a second step, the computational domain of 8D × 8D × 3D was created for more detailed simulations of the impact of droplets that contain a flake. Clearly, the number of computational cells increased tremendously. Local grid adaption and dynamic mesh adaption were carefully performed, ensuring the necessary grid resolution. Especially in case of large droplets, e.g., 300 µm, the inhomogeneous grid region enlarged significantly due to the necessary inclusion of the crown formation and wavy structures around the impact location. A typical mesh model based on dynamic adaptation is shown in Figure 5. In this case, the mesh size around the interface between liquid and gas is set to 1 µm, while being 16 µm at a larger distance from the interface.

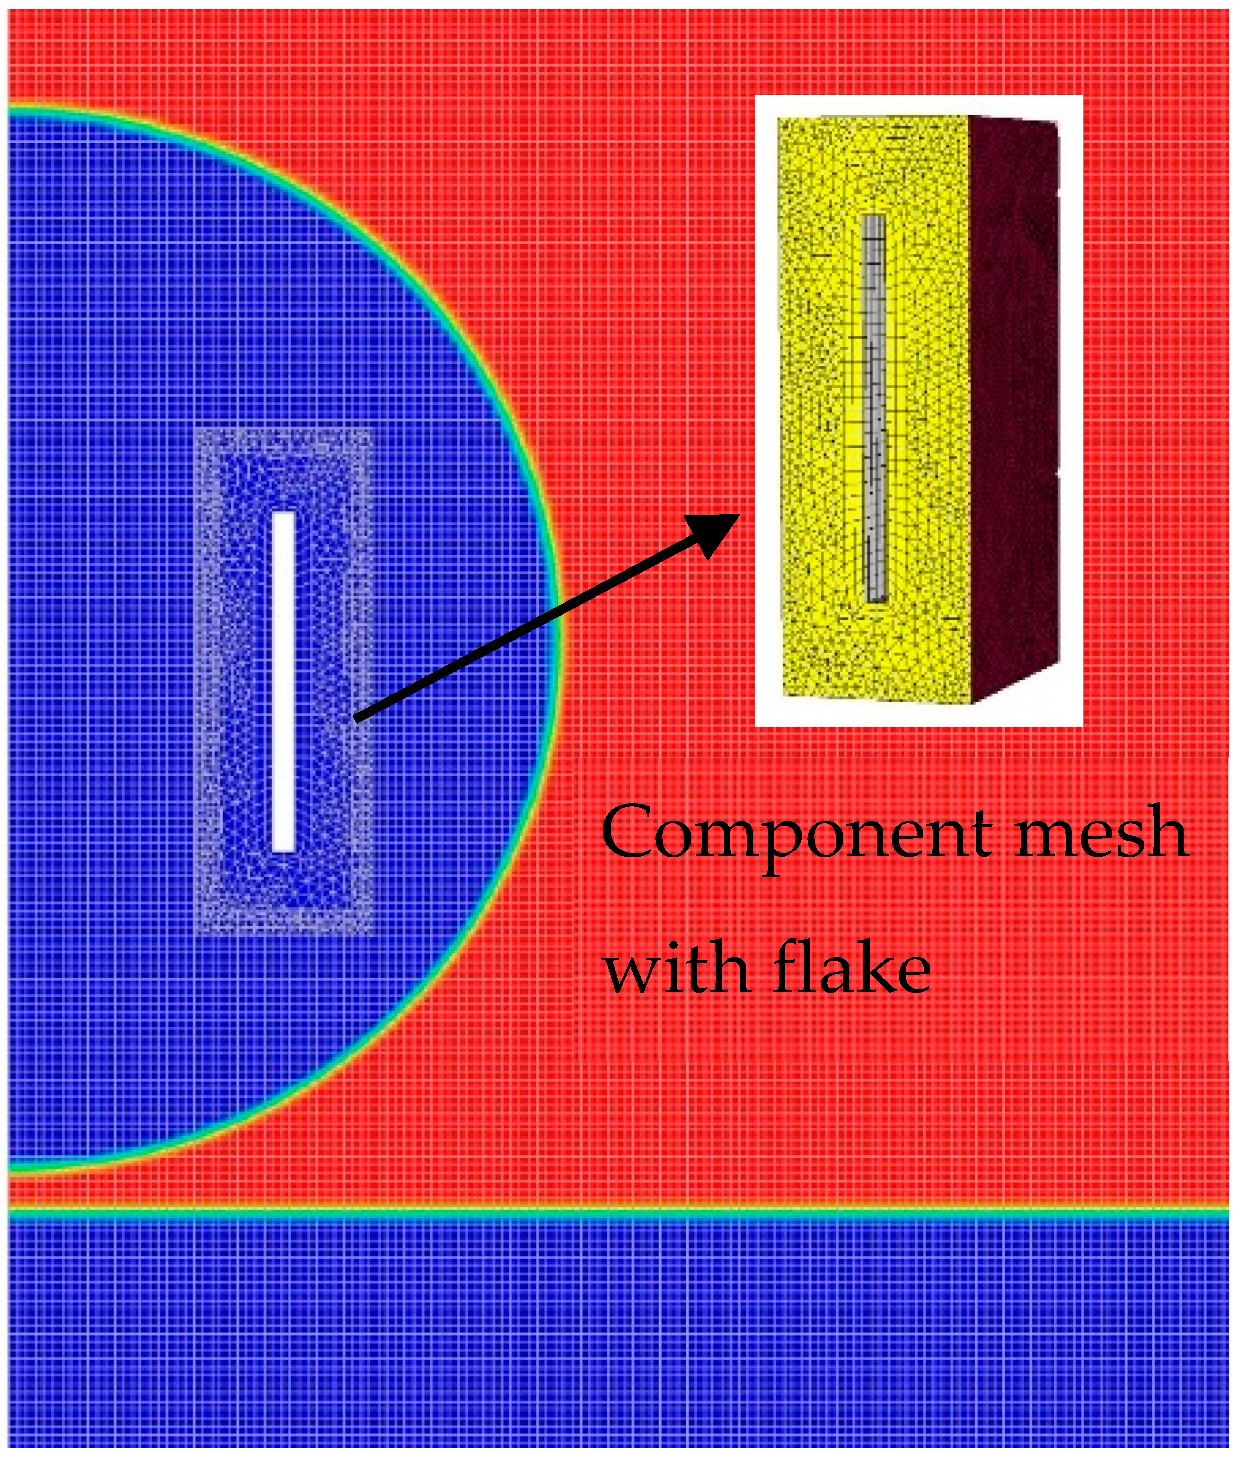
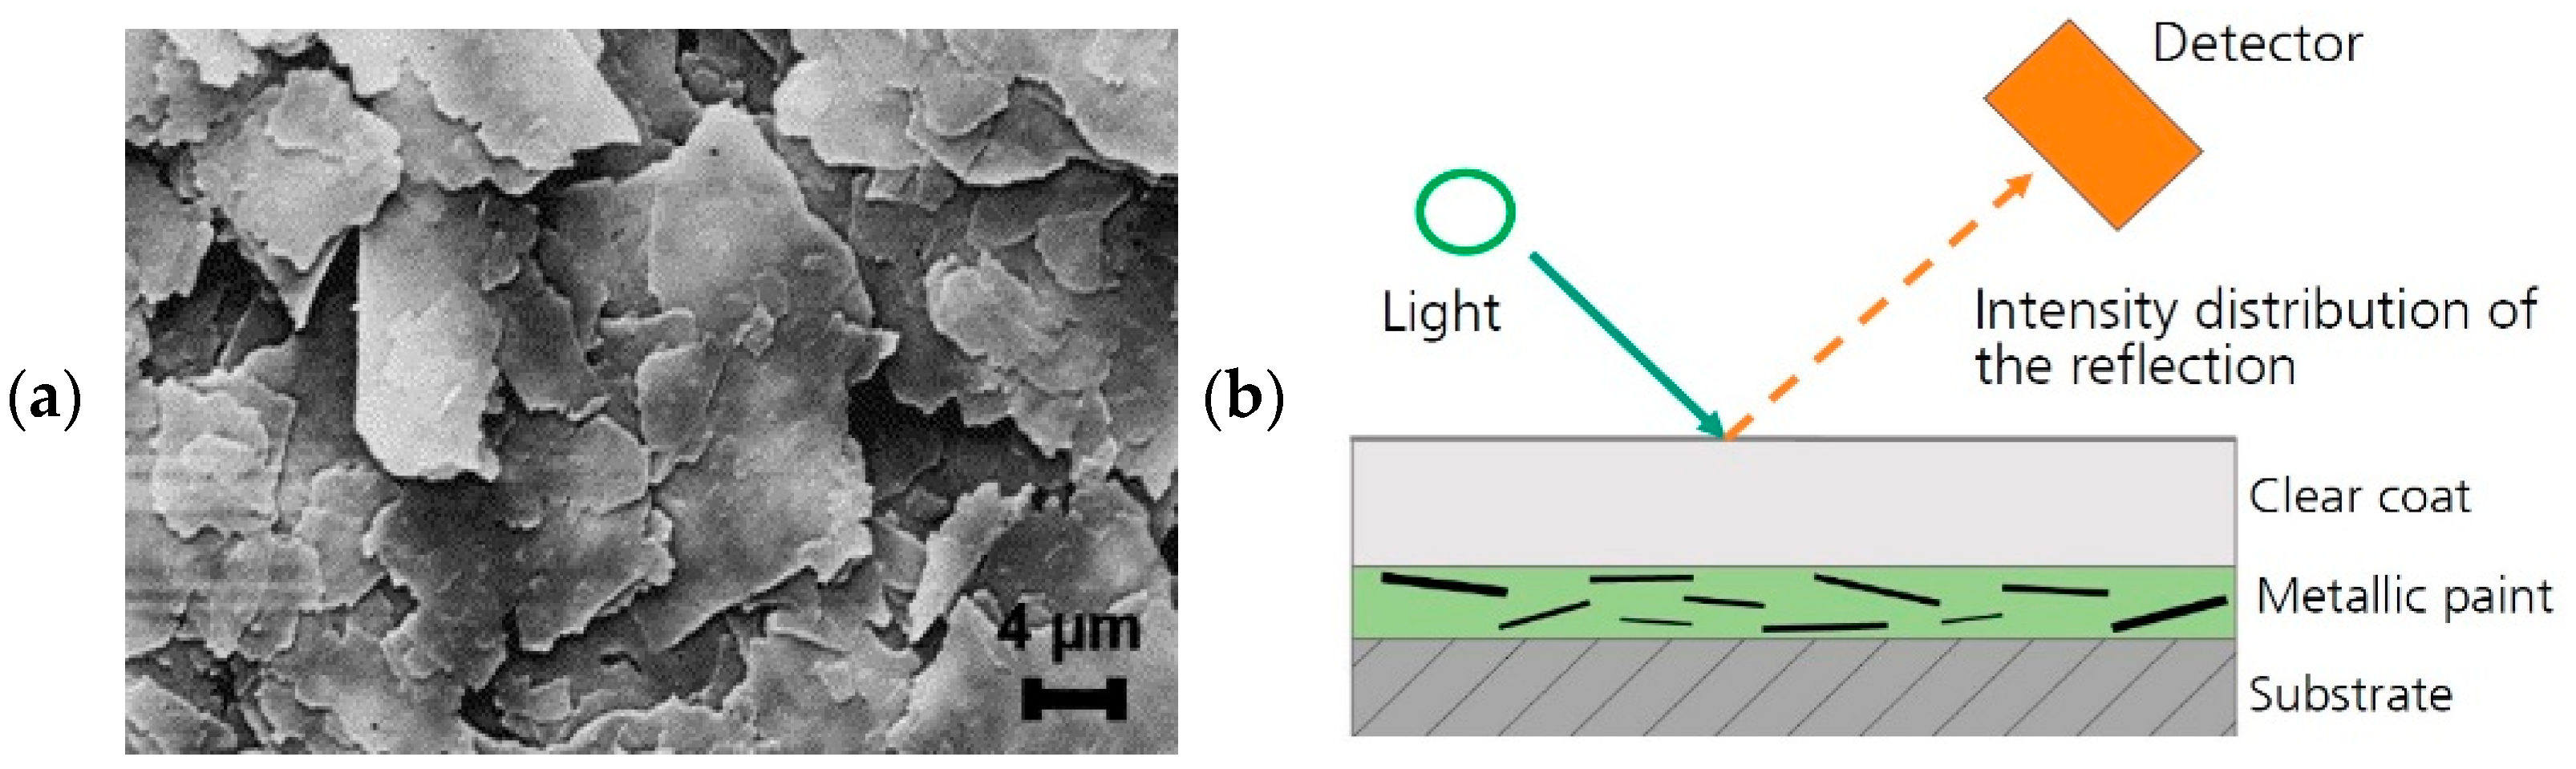
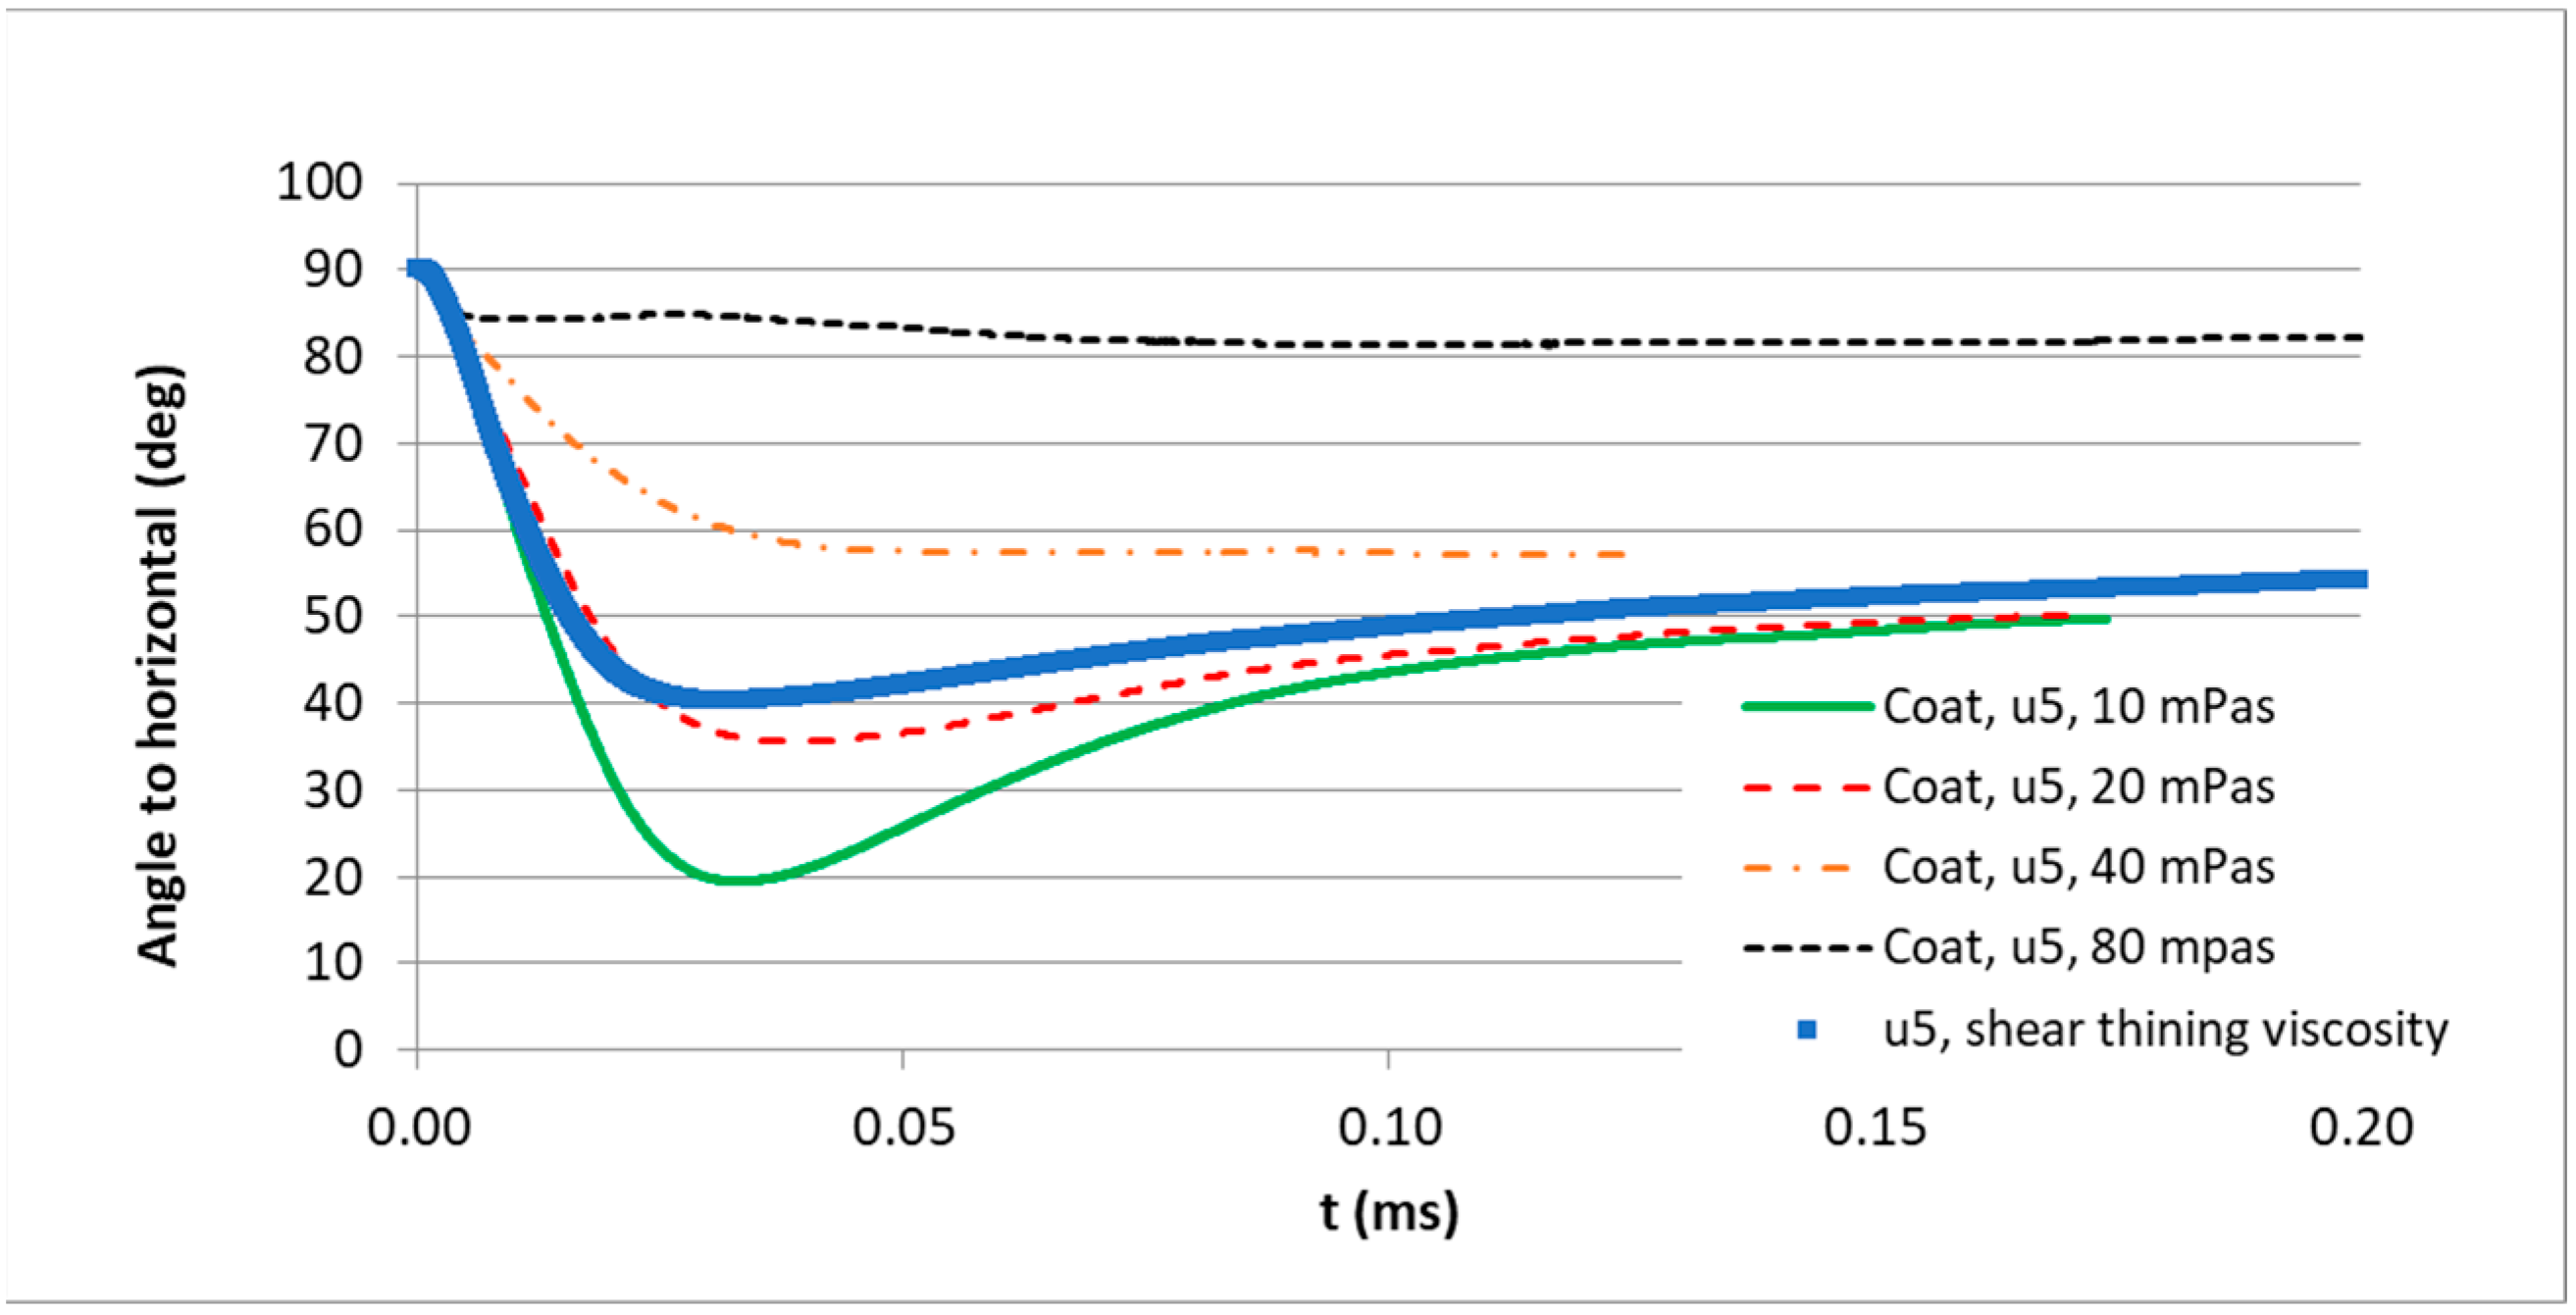
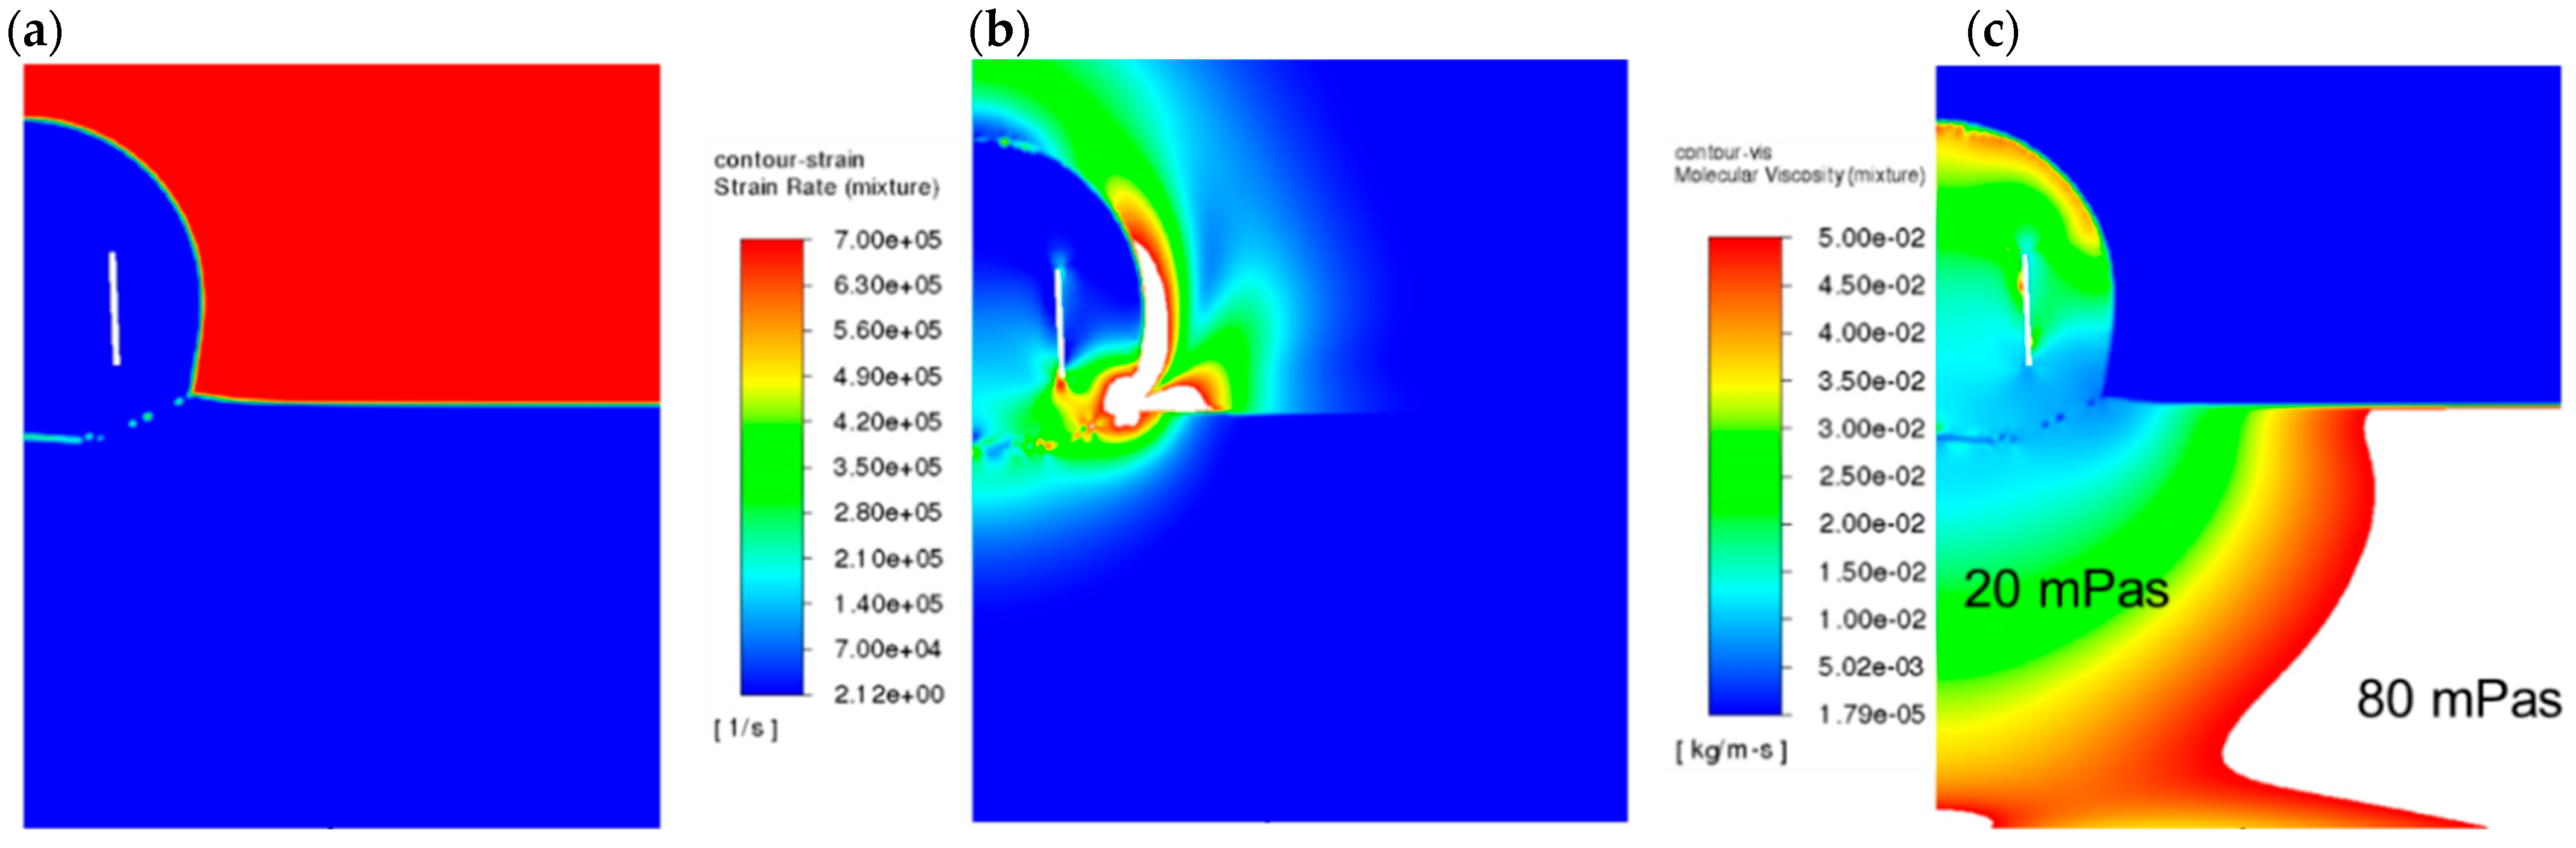
3.3. Simulation of Flake Orientation

For the simulation of the flake movement within an impacting droplet, a three-dimensional computational domain with a quarter of the spherical droplet was applied. A dynamic mesh model based on the overset meshing method included in ANSYS Fluent was applied. Hereby, a ‘component’ mesh that is linked to the flake and a ‘background’ mesh, representing the domain, are overlaid and connected via an interpolated mesh interface (Figure 6). In the present study, only a single rectangular-shaped flake in the computational domain was applied. The size of the considered flake was chosen to be 1 × 16 × 16 μm3, reasonably representing a typical aluminum flake geometry inside a metallic-effect paint. However, this small size results in corresponding moments of inertia of 1.6 × 10⁻²³ [kg·m2], which are too marginal for the actual 6DOF motion solver by ANSYS. As a consequence, a custom motion equation solver was implemented via a user-defined function (UDF), assuming rigid body motion. Therefore, the flake motion may be simplified to the movement of its center of mass and the rotation around it. Consequently, the momentum conservation (3) is calculated in the global inertial coordinate system, and the angular momentum (4) is determined in body coordinates:
v ˙ = 1 m F
ω ˙ = I 1 M ω × I ω
Here, m denotes the mass of the flake, I the inertia tensor, and F, M the flow-induced forces and moments, respectively. v ˙   and ω ˙ represent the time derivatives of the velocity and the angular velocity. In Equation (3), the sum includes pressure, viscosity, and gravitational forces. An Adams–Moulton algorithm of the fourth order with a rather complex variable time-step formulation was derived and implemented to integrate the above given ordinary differential equations (ODEs) in time. This enabled stable simulations of flake movement and orientation using a reasonable time-step size, such as dt = 1 × 10⁻⁸ to 1 × 10⁻⁷ s, which was solely adjusted by the flow solver. Table 2 shows the typical parameters applied in the present simulations. Shear thinning non-Newtonian viscosity was applied for model paints, as shown in Figure 3.

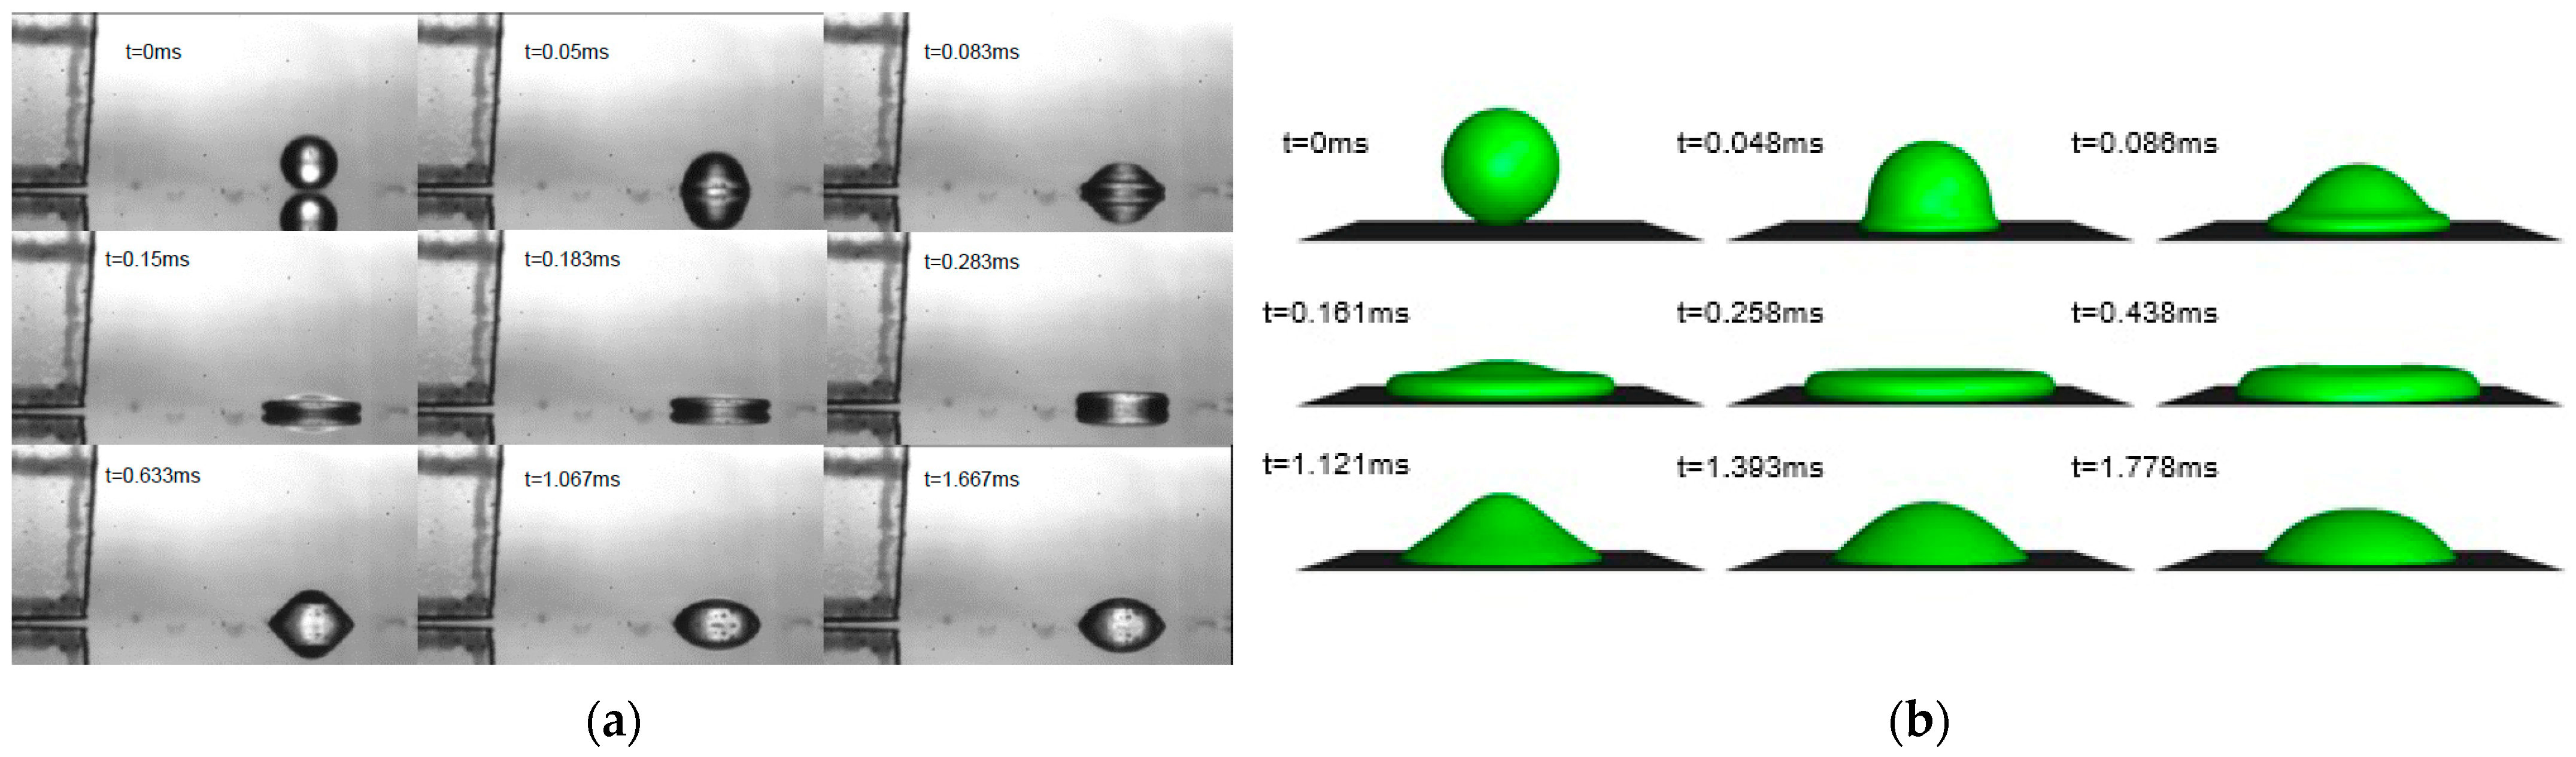
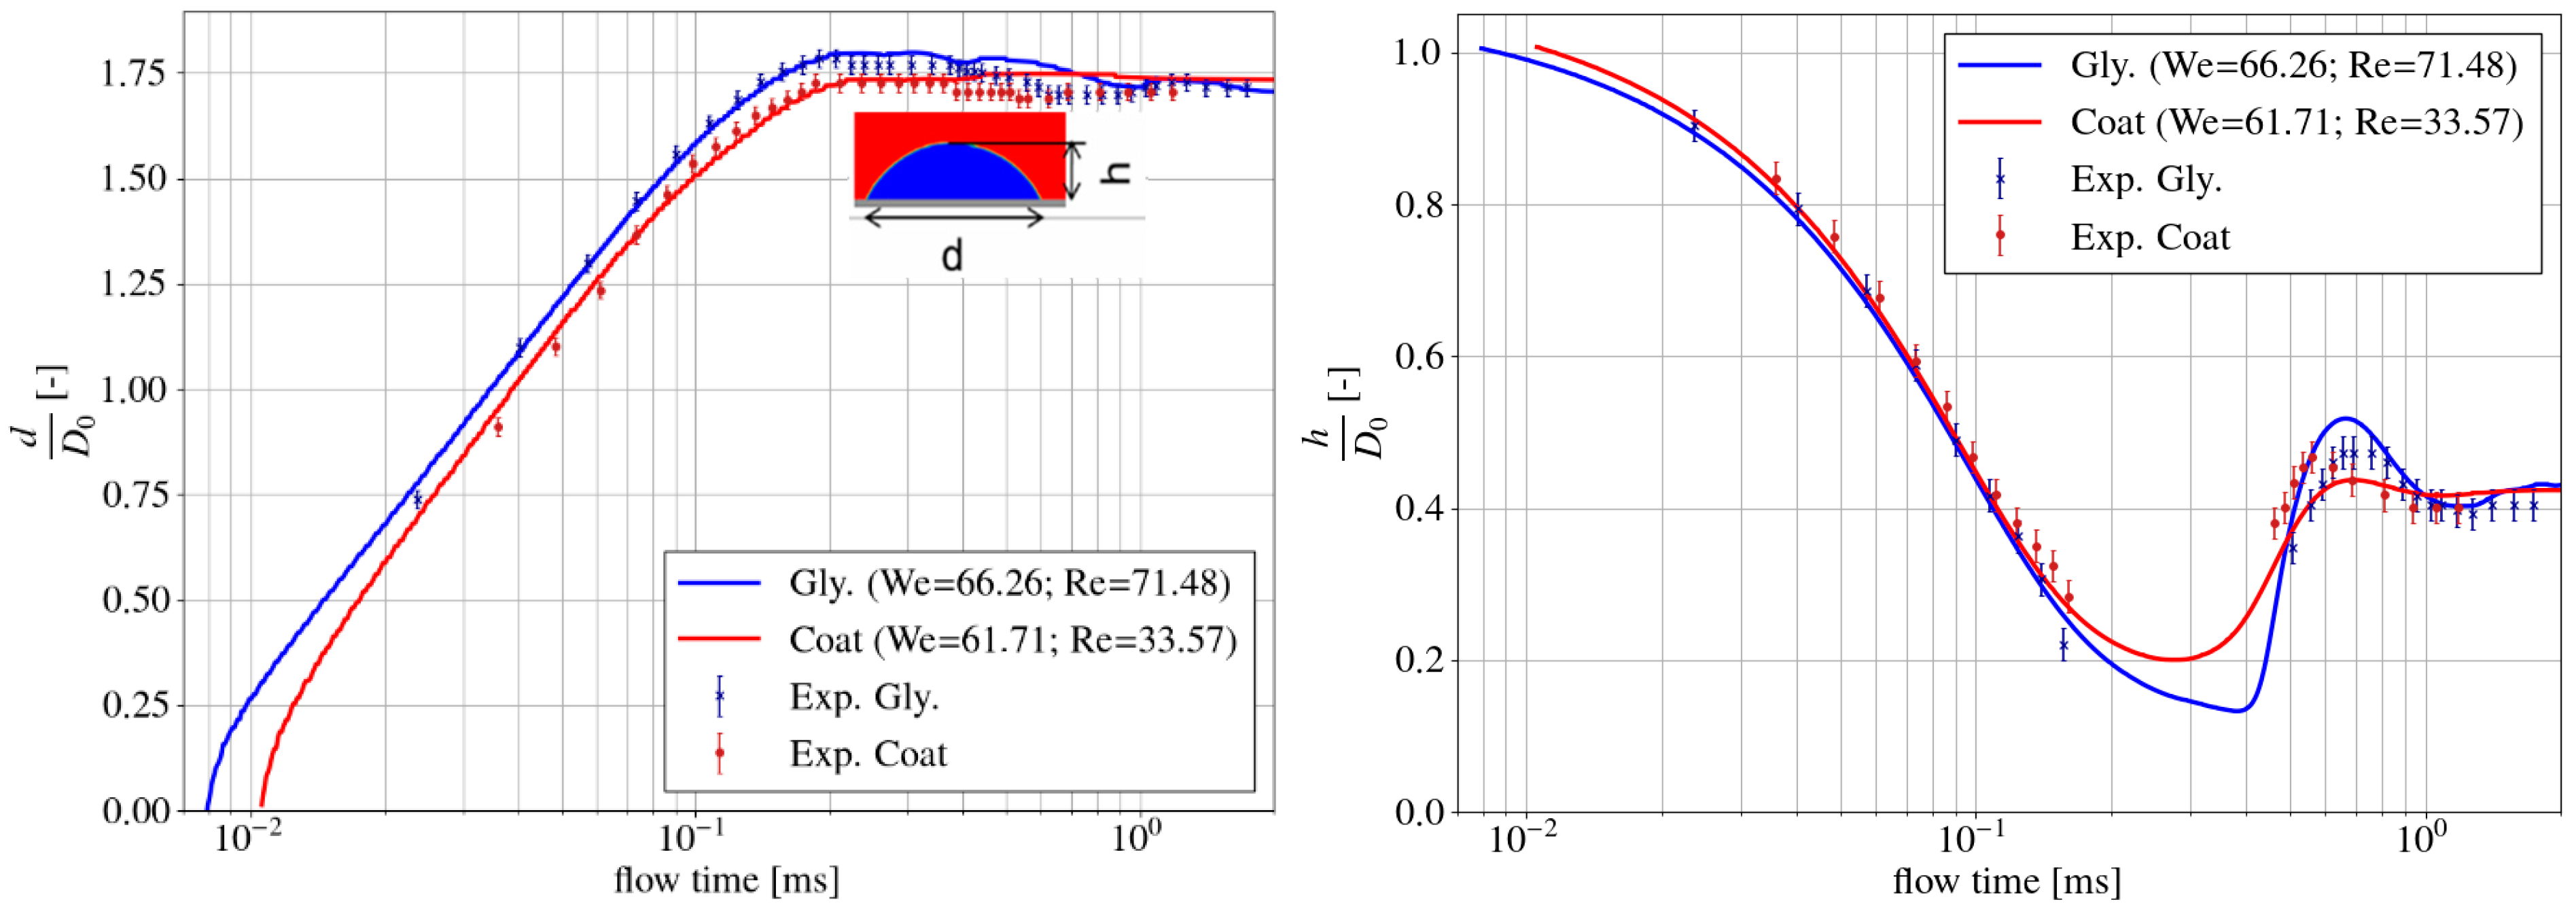
4. Experimental Validation of the Numerical Models for the Droplet Impact on Dry Solid Surfaces

Validations of the numerical models for the impact process of viscous droplets on a dry solid surface were carried out using the single droplet generator and the visualization technique, as described in Figure 1a. Glycerol/water droplets (D = 400 µm, η = 20 mPa·s, σ = 0.063 N/m, θ E = 55°) and model paint droplets (D = 300 µm, η = 17 mPa·s at γ = 105 (1/s), σ = 0.025 N/m, θ E = 53°) were created. Simulations were performed using the two-dimensional axisymmetric domain. Figure 7 shows the comparison between the high-speed-camera recording and the simulation of a glycerol/water droplet impact. The obtained videos of the impact processes for both droplets were further analyzed with respect to the evolution of the droplet spread factors d/D0 and the height ratios h/D0. In the simulations, advancing angles θ A of 120° for glycerol/water droplets and 95° for paint droplets were used, estimated from the high-speed videos. In Figure 8, experimental and simulative spread factors are compared. Quite good agreement can be observed, which indicates that the proposed dynamic contact angle model delivers a good performance and is suitable for more advanced applications.

5. Simulation of Droplet Impact on Dry/Wet Solid Surface

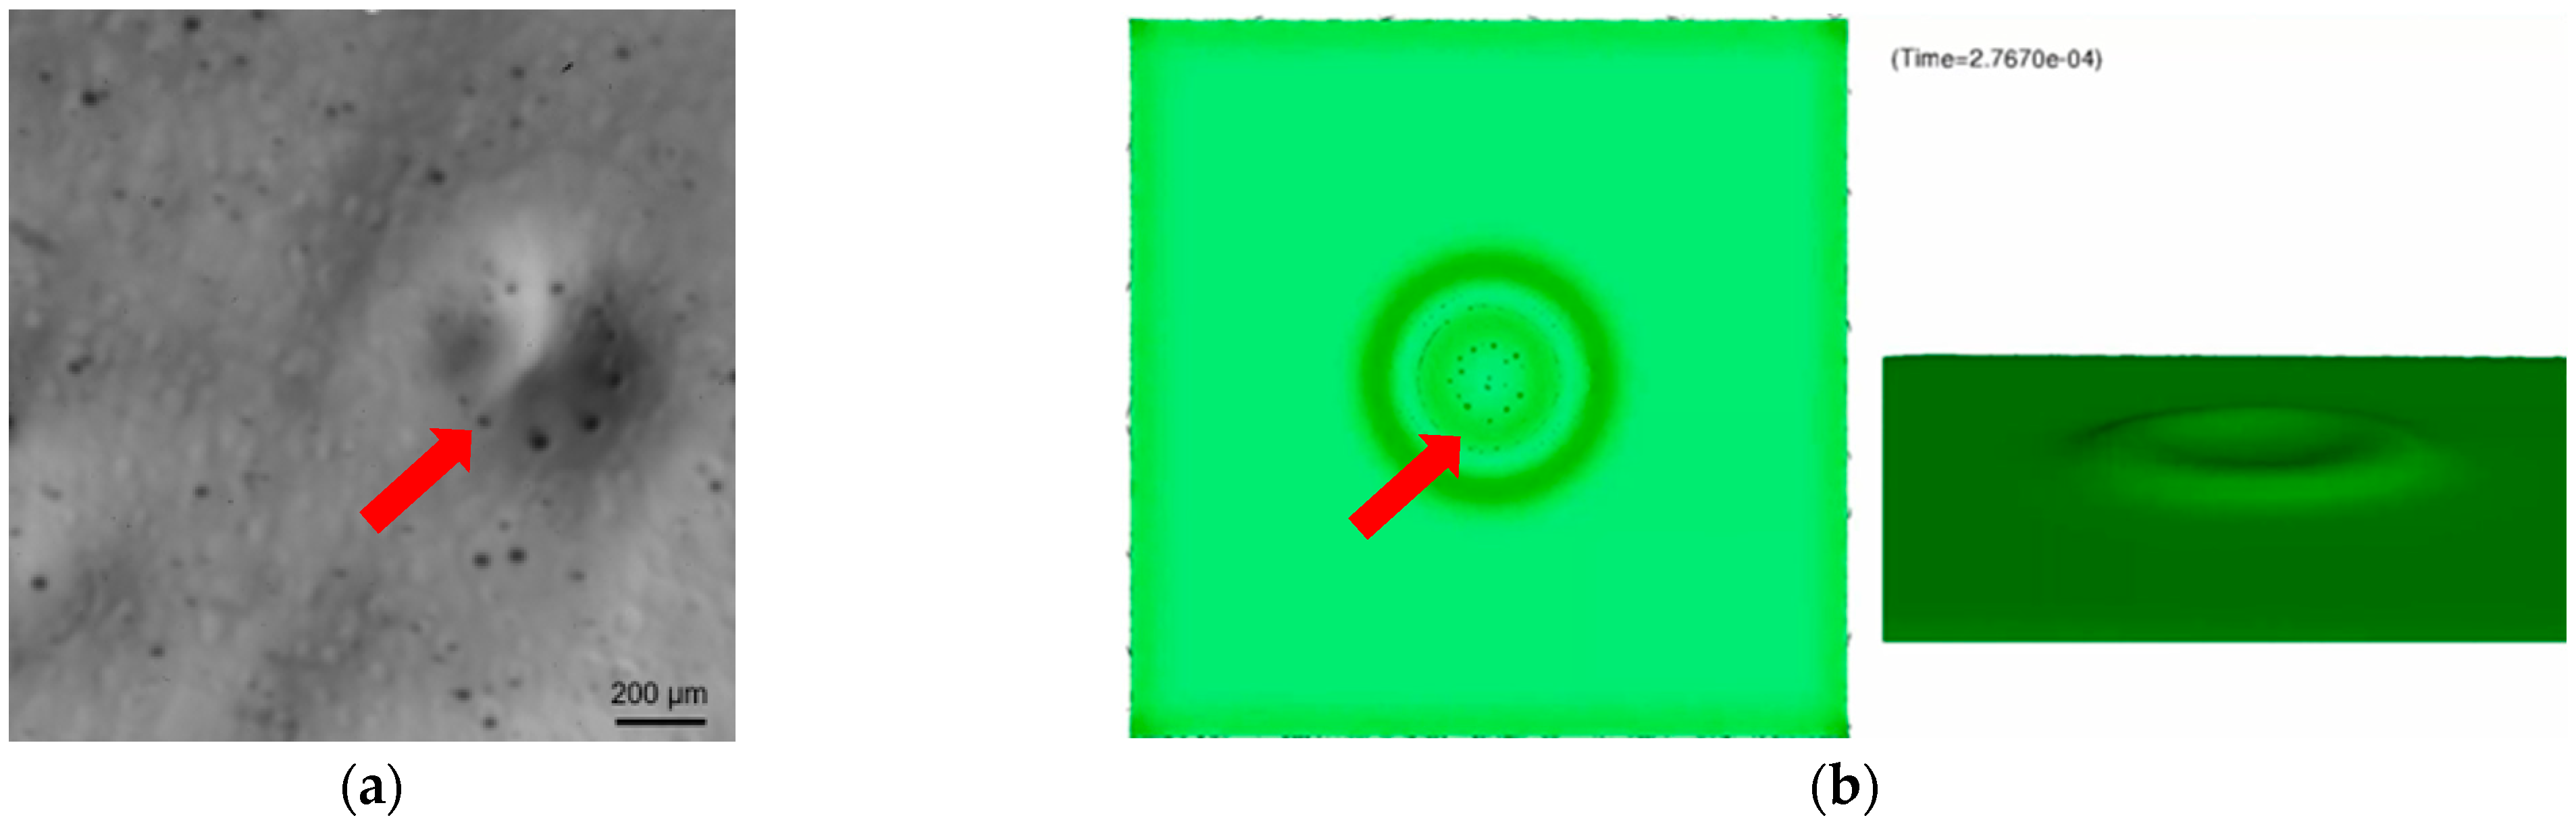
5.1. Air Entrapment in Droplet Impact Processes

It is well-known that air entrapment at droplet impact may occur independently of the state of the surface, i.e., dry or wet. In the case of painting applications, relevant droplets are rather small, with medium volume sizes between 20 and 50 µm. Moreover, paint liquids are very often opaque, resulting in significant difficulties for useful experimental investigations of bubble formations. Therefore, numerical simulations provide to some extent the only appropriate tool to further analyze the mechanism of the air entrapment during droplet impact. Here, numerical simulations were carried out using a quarter of the spherical droplet with a symmetric boundary.
Figure 9 shows simulation results of the droplet contour evolution during the impact process of a 300 µm droplet at an impact velocity of 4 m/s on a dry surface. A thin layer of air bubbles (further also called an air disc) is formed directly at the contact area between droplet and substrate. This air disc is continuously enlarging during the drop spreading until a fully wetted contact line is created and the maximum air disc diameter is observed, which is smaller than the maximum droplet spreading diameter, as shown in Figure 8 at t = 0.127 ms. The air disc then contracts into larger bubbles during the receding process, in which some bubbles can also be released, as shown in the figure at t = 5.8 ms. At the quasi-static state, there are still large air bubbles on the substrate, as the release of the remaining bubbles slows further in the quasi-static state. The total amount of remaining air bubbles in a quasi-static state depends on the properties of the liquid and substrate, as well as the operating conditions. For a water droplet with an identical size and impact conditions, the maximum extension of the air disc and the final number of bubbles on the substrate in the quasi-static state are significantly reduced [12]. Some influence factors on the air bubble formation are indicated by Figure 10, where the quasi-static state of the impact of a viscous 50 µm droplet is analyzed. More bubbles are observed in the case of a higher viscosity (Figure 10a). In addition, a higher impact velocity leads to a larger air disc during the spreading process and ultimately to more bubbles (Figure 10b). With a smaller equilibrium contact angle θ E = 30°, i.e., improved wettability, bubbles tend to reduce their wall contact area, leading to larger distances between the bubble centers and the wall (Figure 10c). This should also ease any additional bubble release in a quasi-static state. Since Figure 10 was created based on the quarter of the spherical droplet with a symmetric boundary, the results shown only demonstrate the dependency between the air entrapment and the different operating conditions, but not the exact distribution of air bubbles inside a droplet.
Air can also be trapped during droplet impacting on a wetted substrate. In this case, characteristic rings around the impact center are formed, consisting of several air bubbles, which can be observed both in the simulation (Figure 11b) and experimentally (Figure 11a). In the following simulation results, bubble formation can be observed continuously.

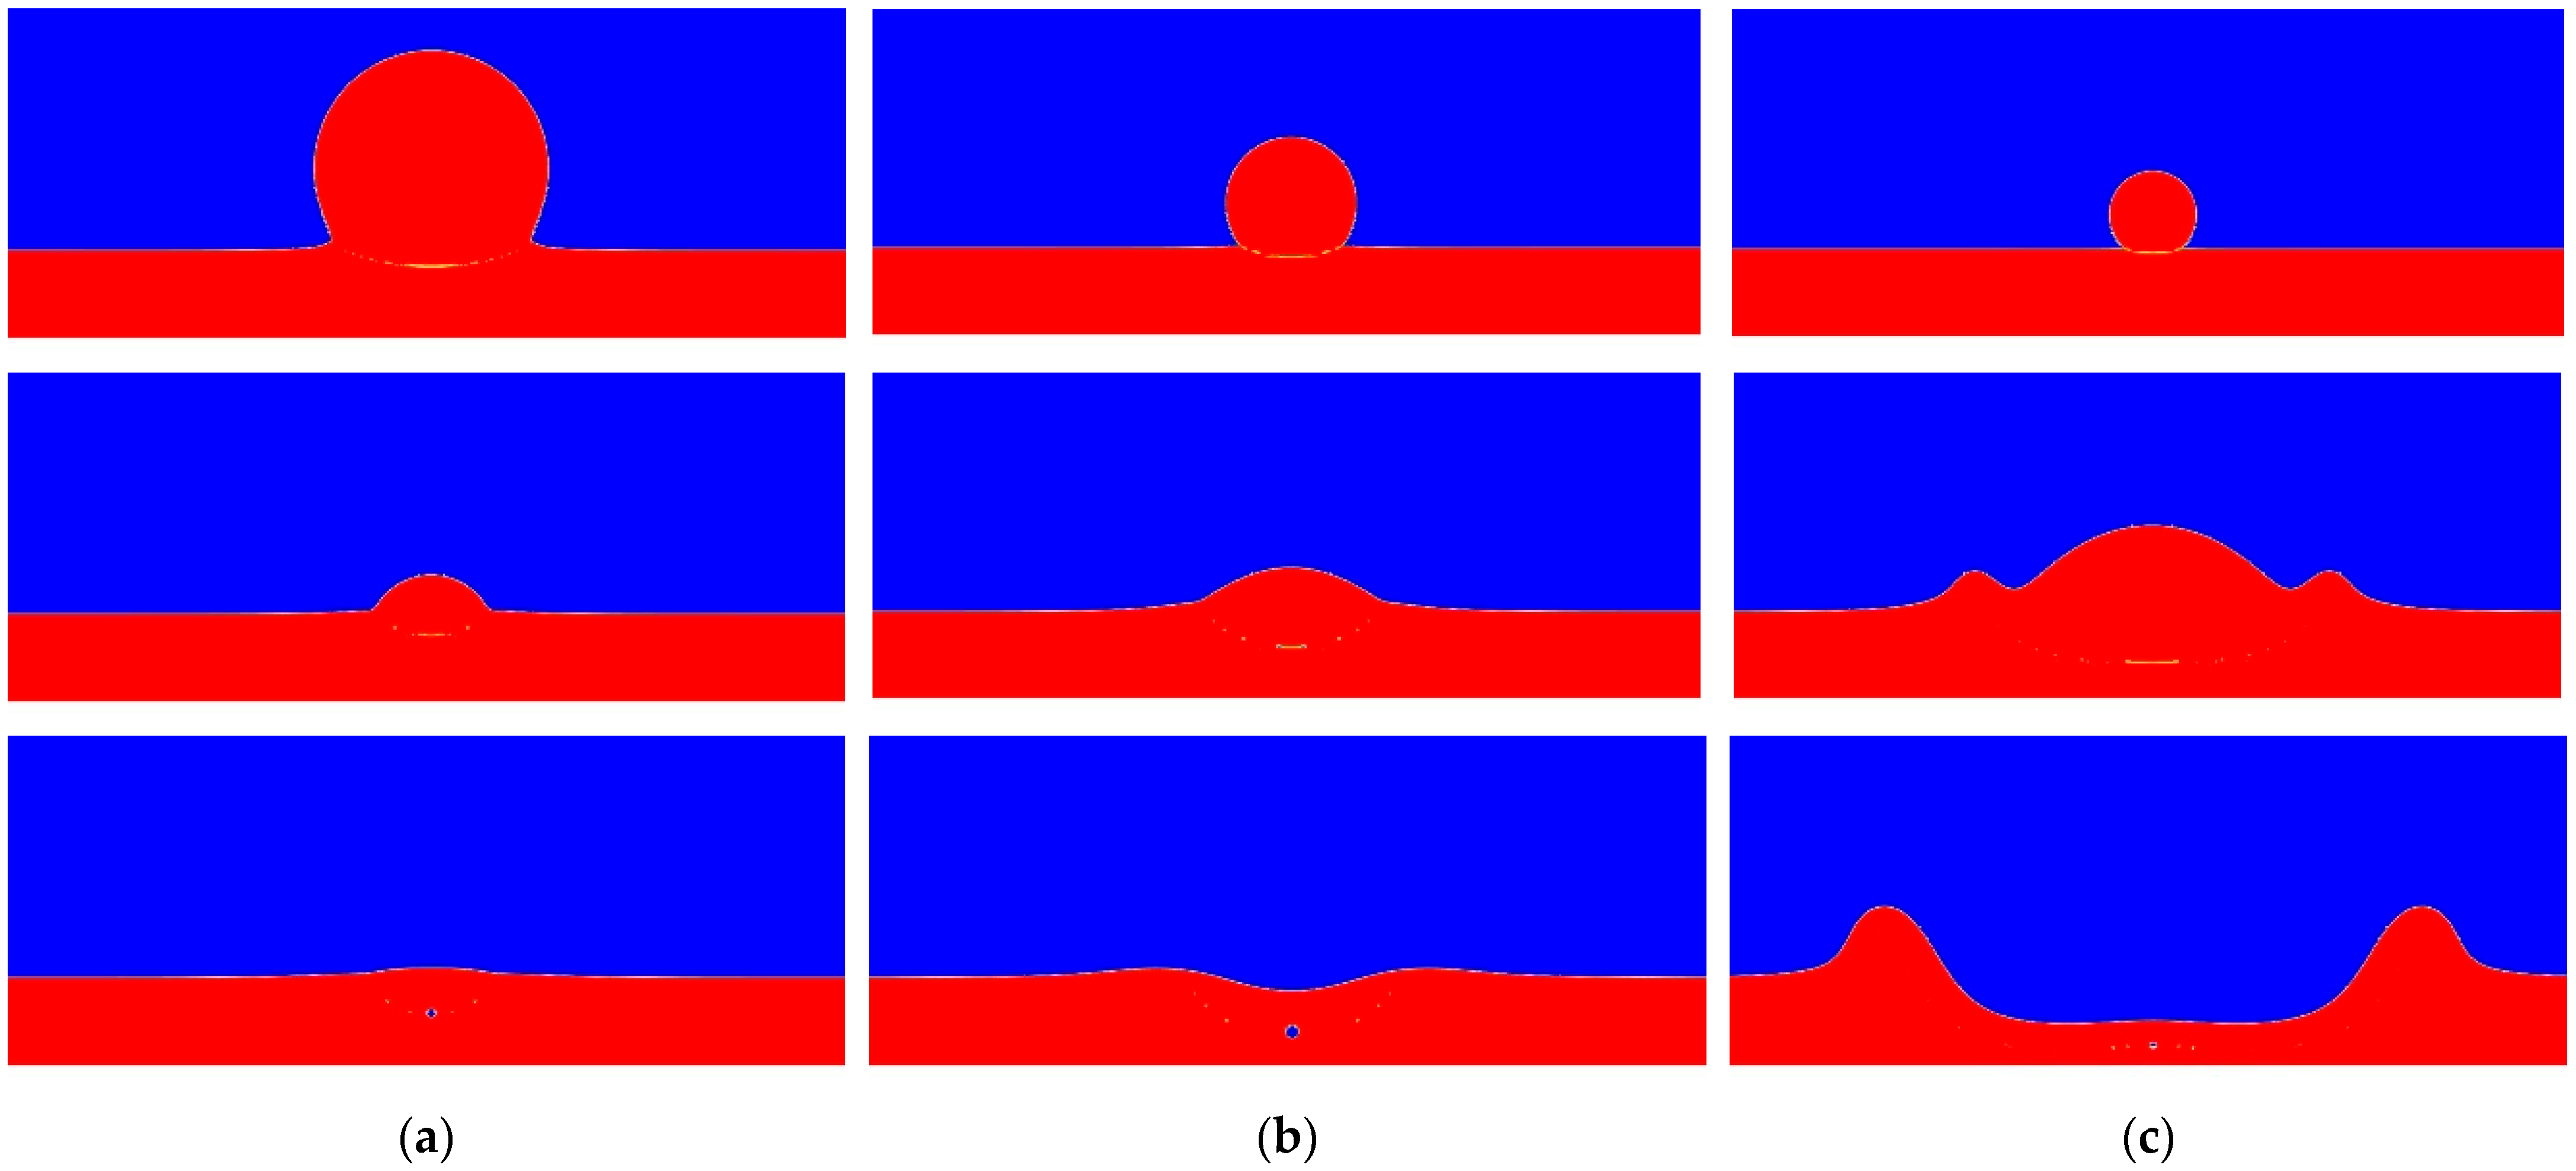
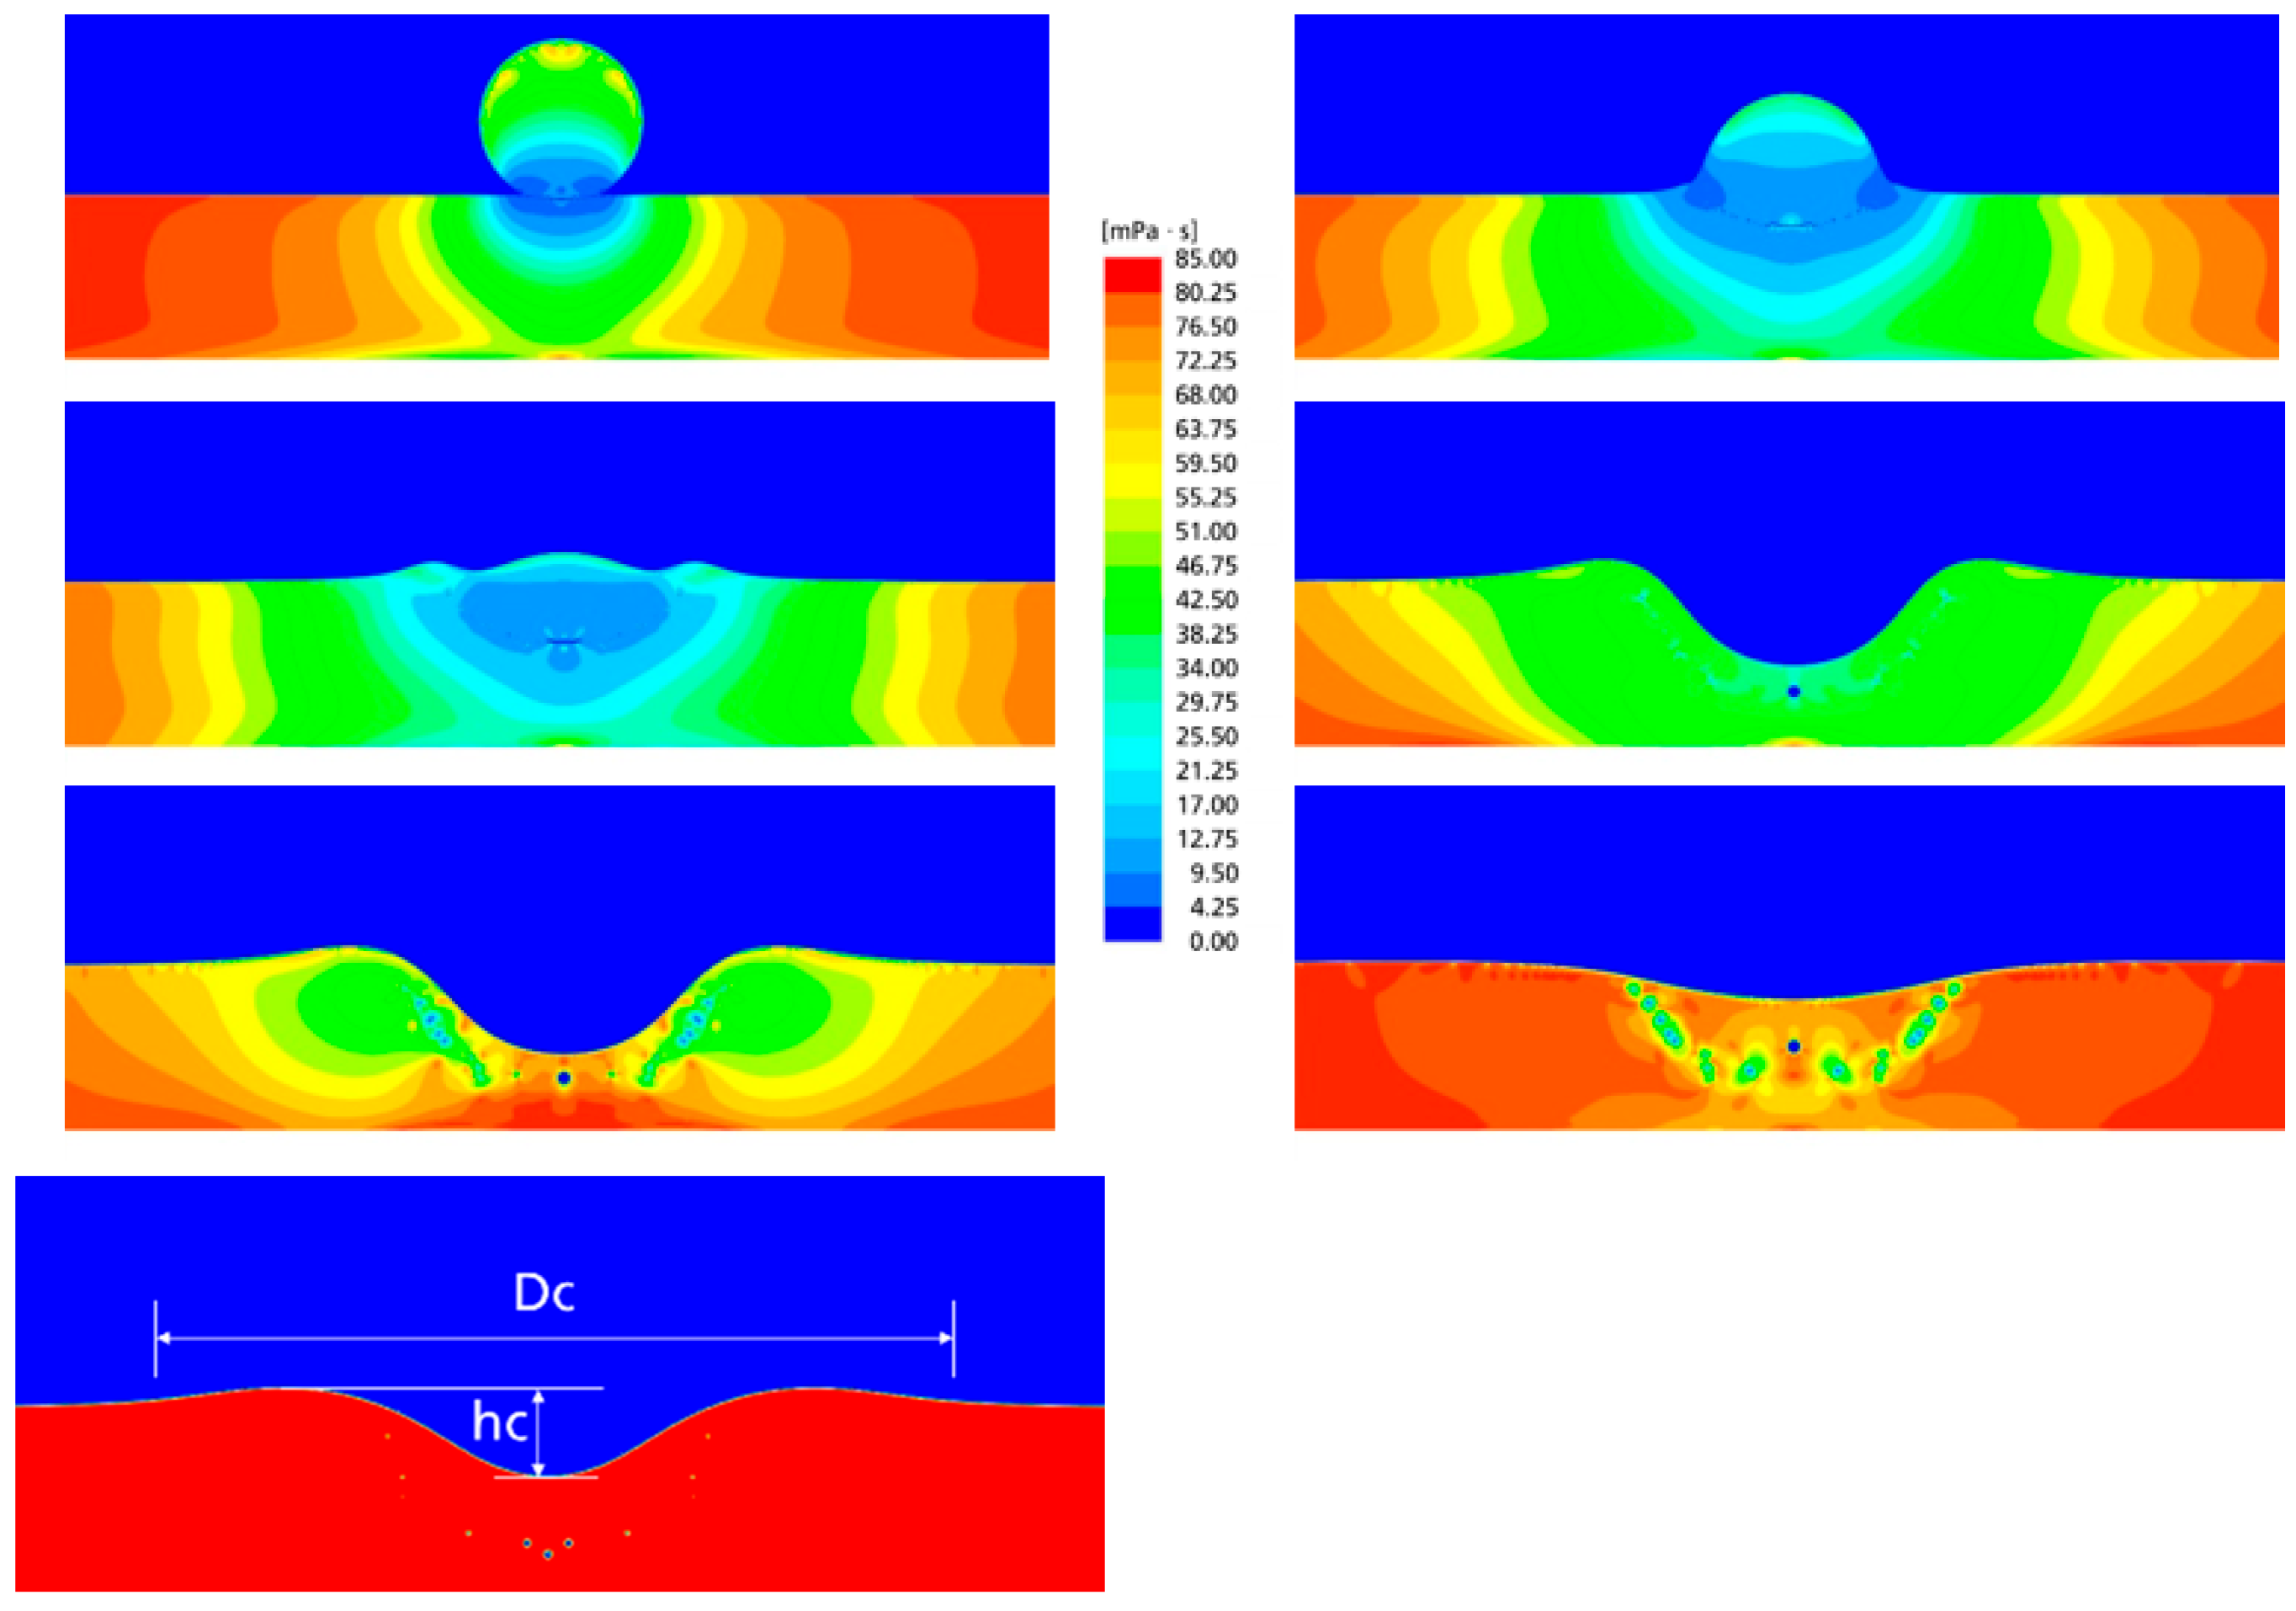
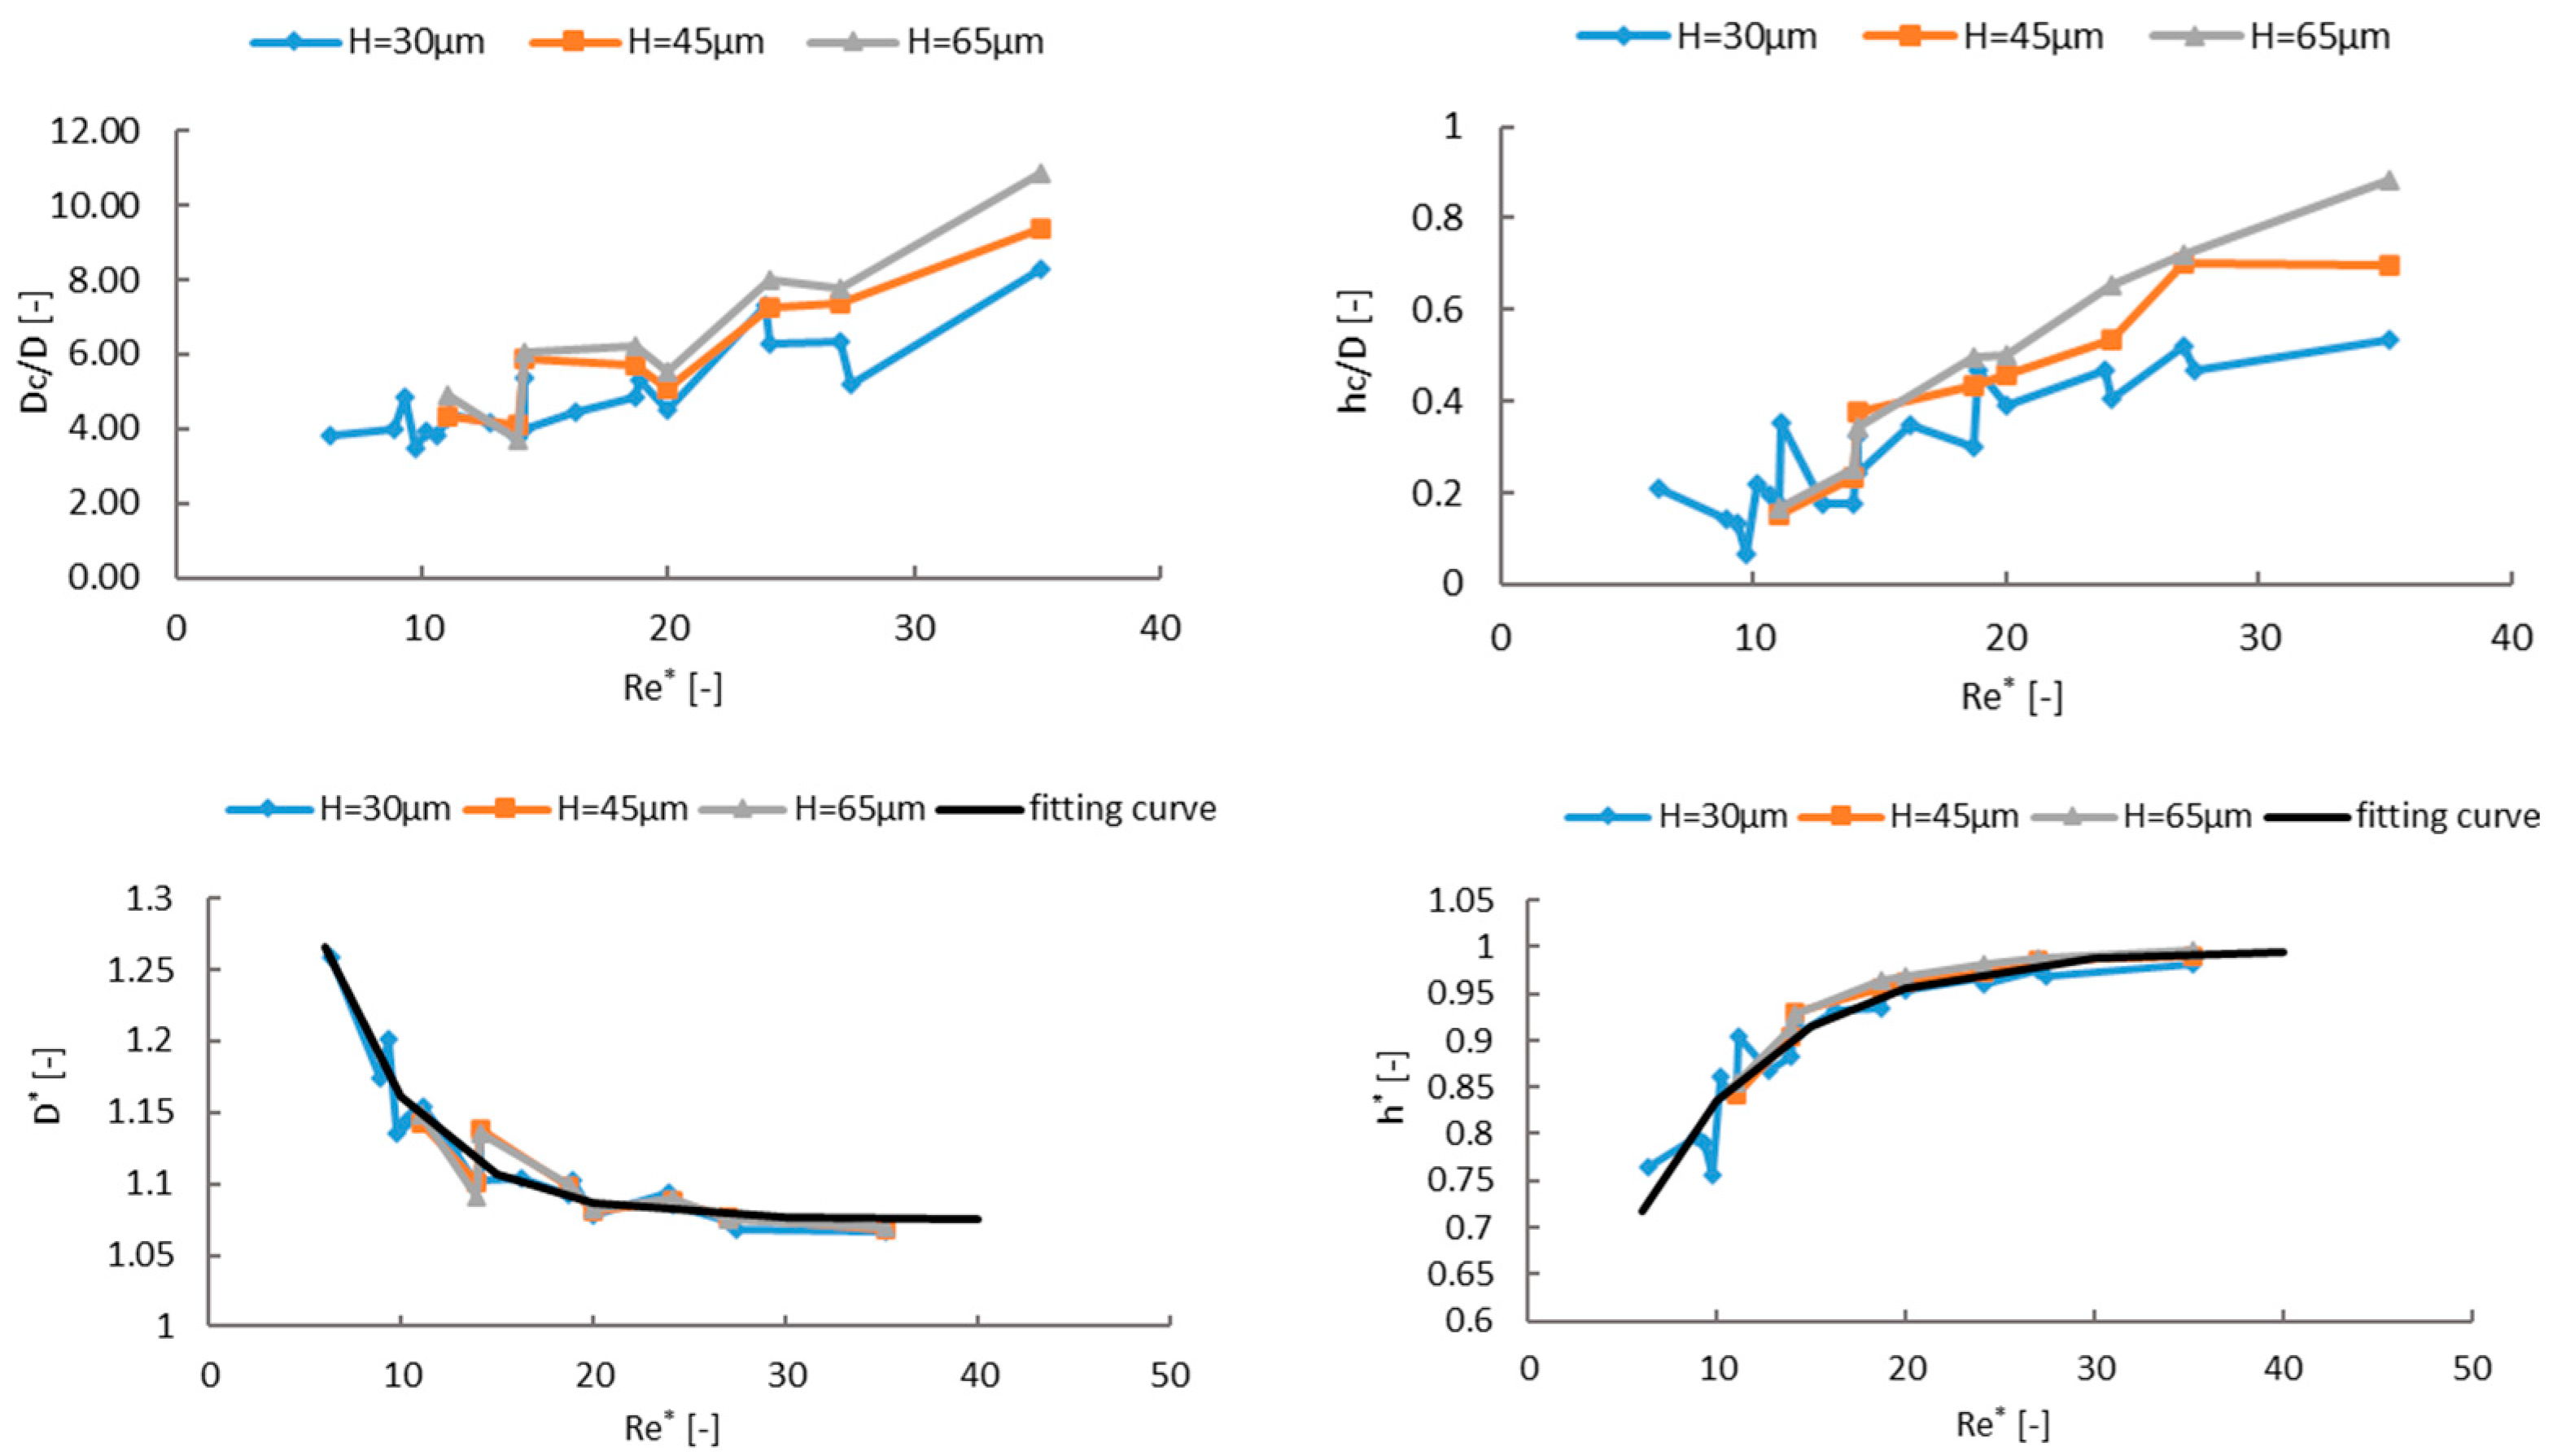
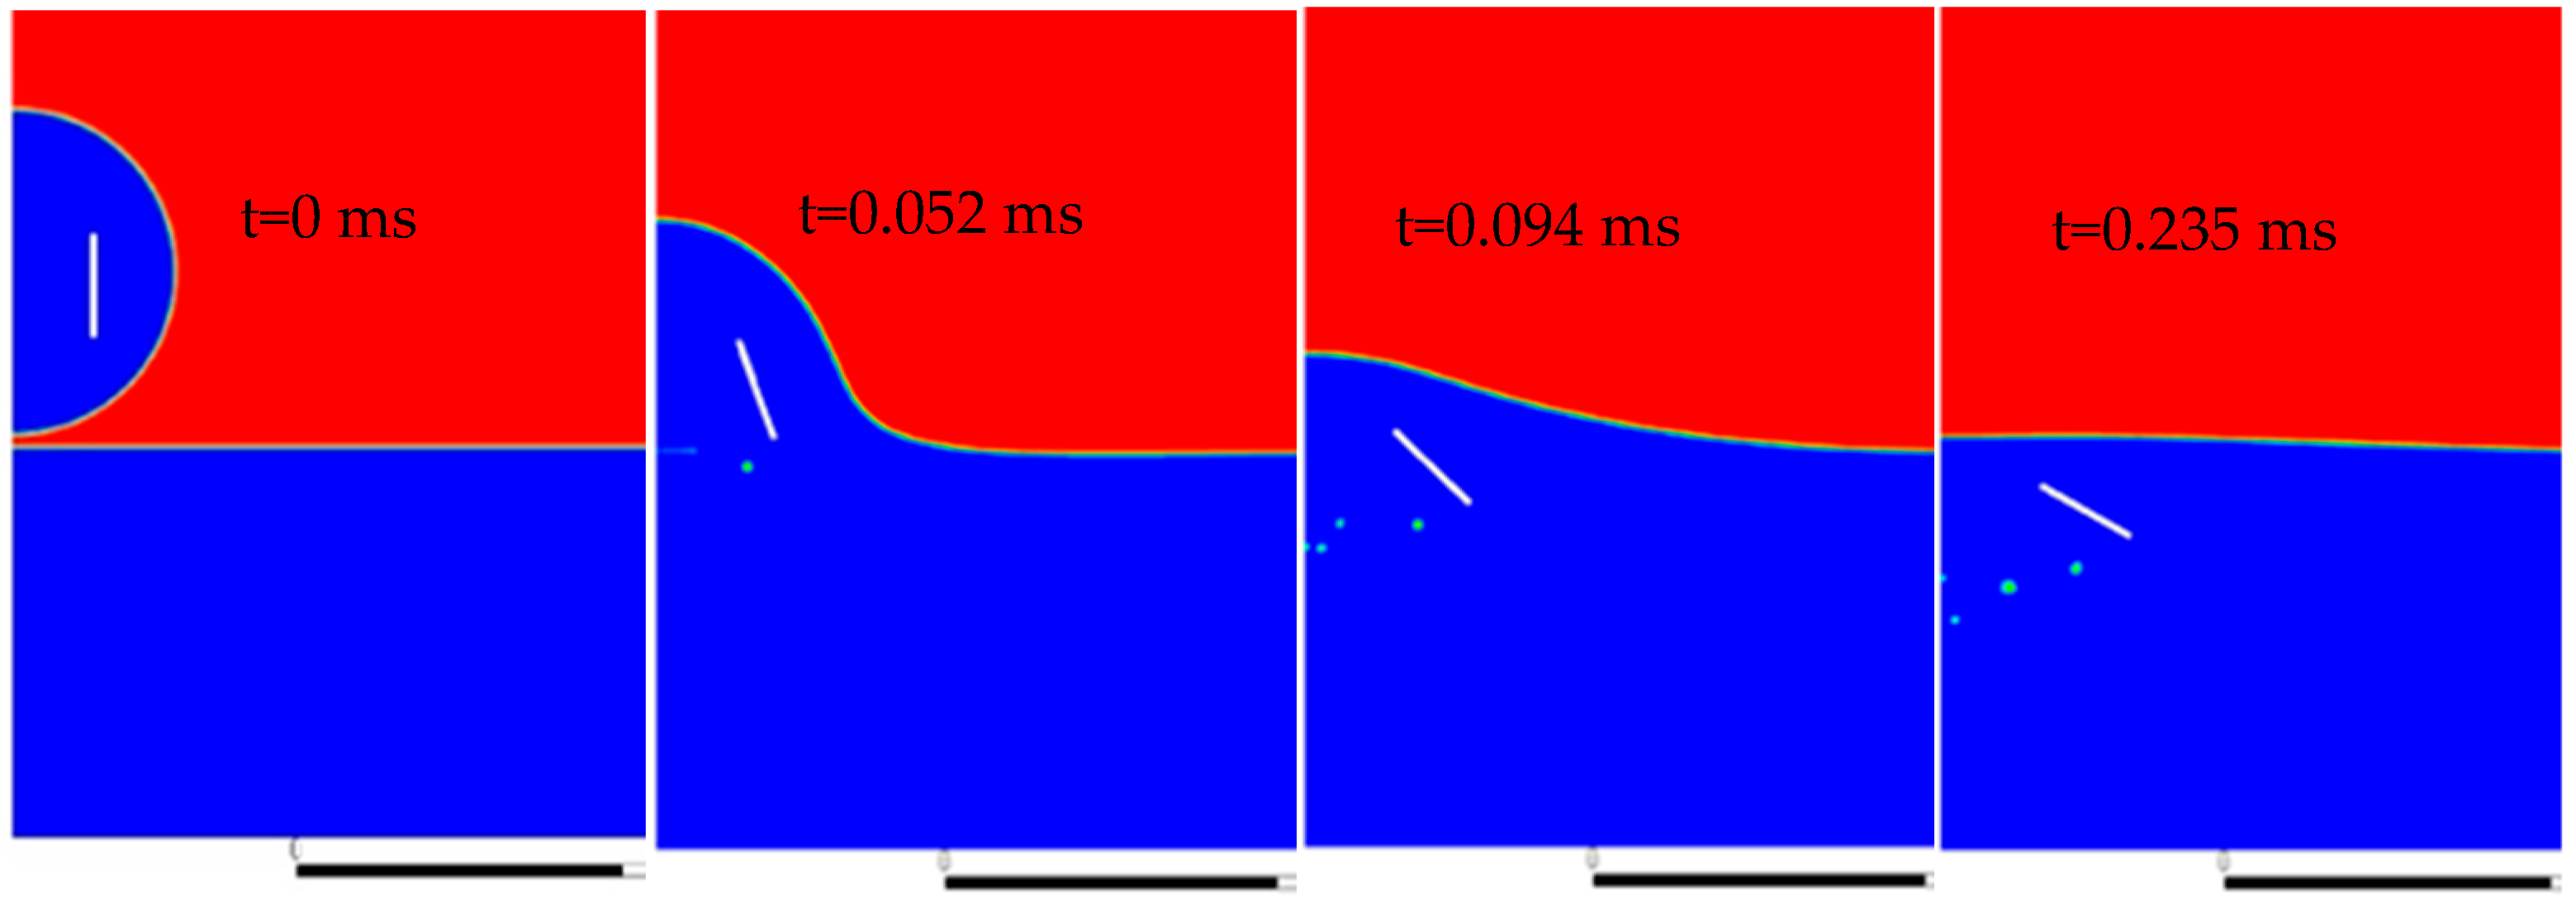
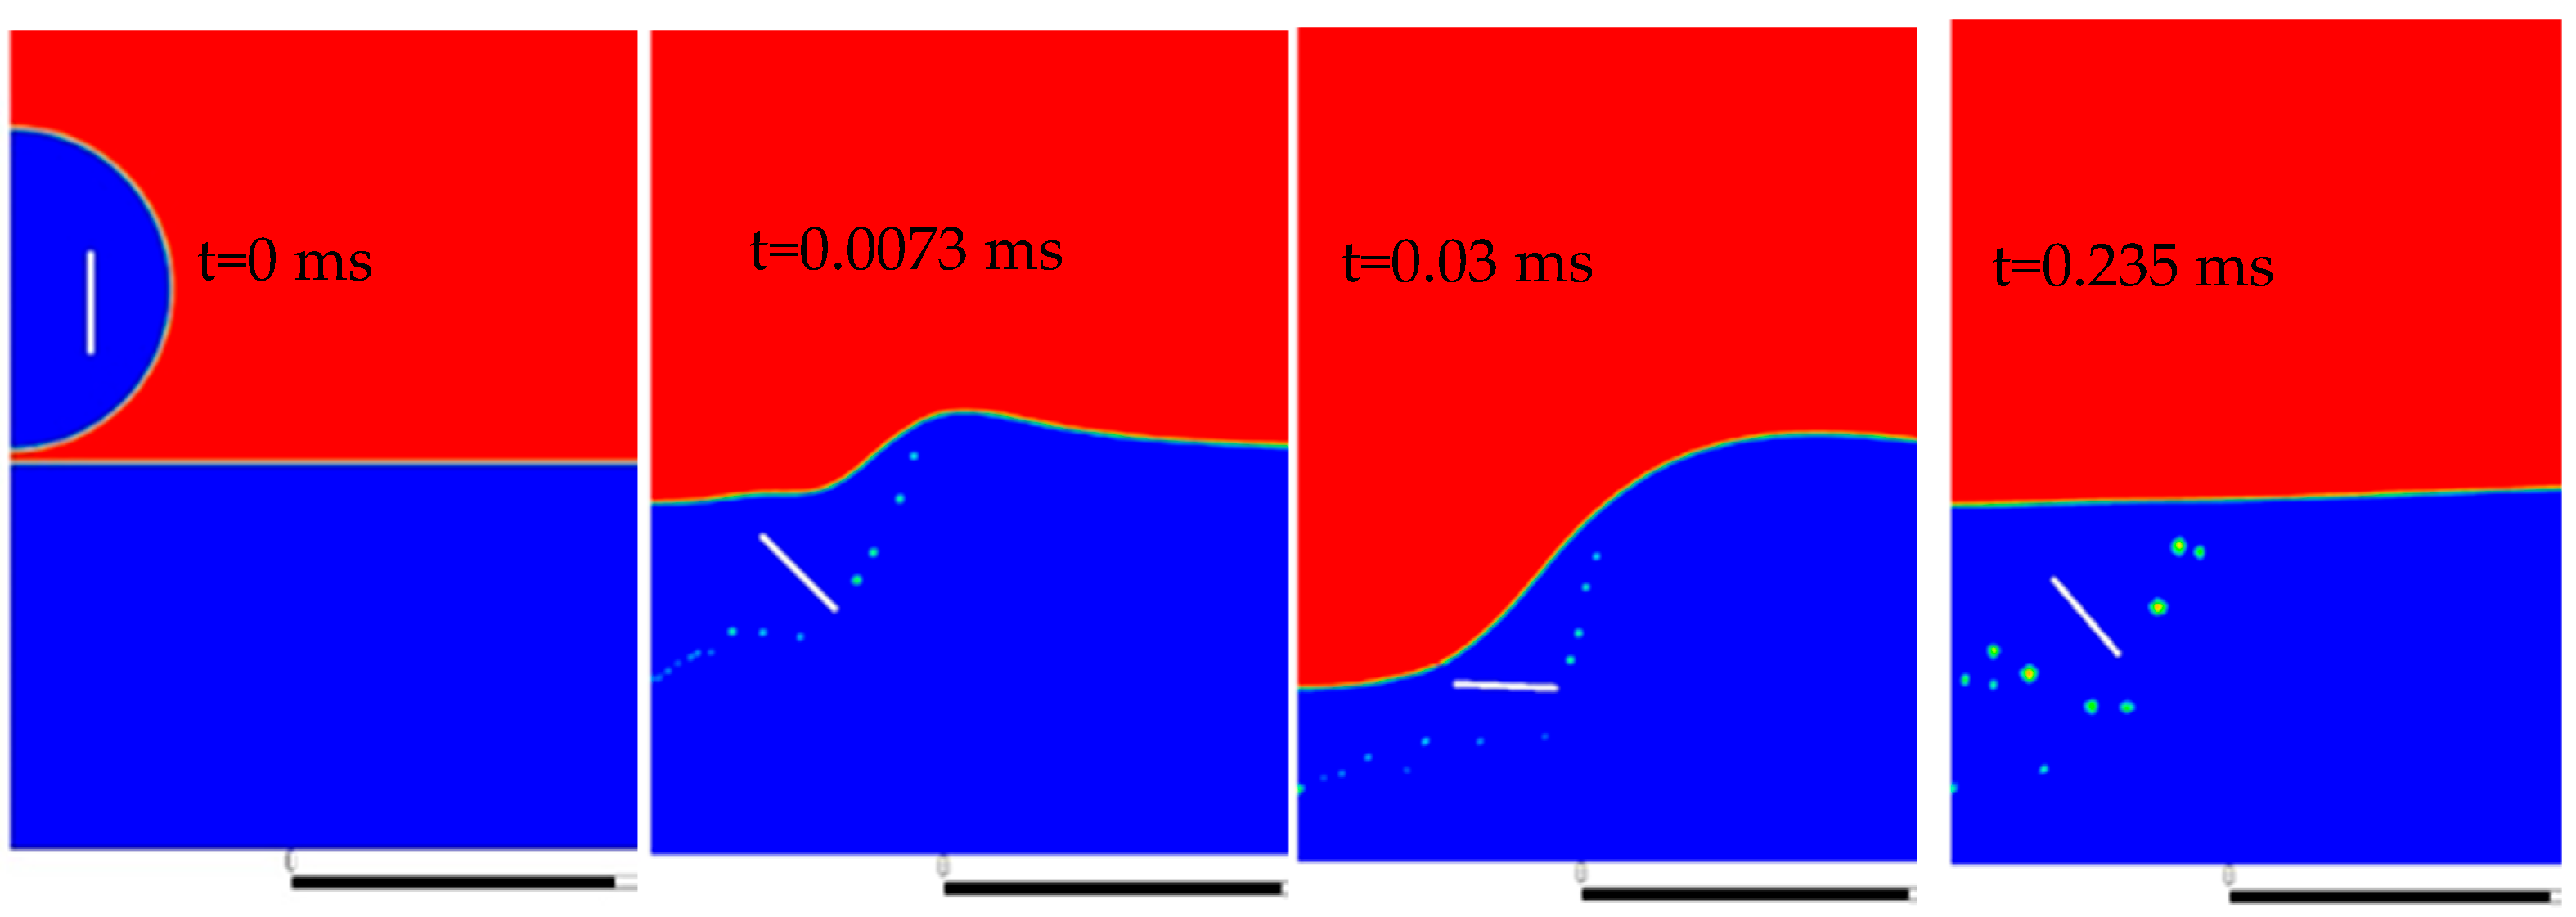
5.2. Evolution of Gas–Liquid Interface at Droplet Impact on Wet Solid Surfaces

As stated in the introduction, there are many studies considering droplet impact on wet substrates. Depending on impact velocity and liquid viscosity, droplet impact on a thin liquid film can be essentially divided into spreading/deposition, cratering/receding, crown formation, and crown with splashing. The latter will not be studied in the present investigation because it is very seldom in spray coating applications. In spray coating applications, typical mean diameters of the droplet range between 30 and 50 µm. Considering existing correlations between droplet impact velocities and droplet diameters for different atomizers in spray painting processes [30], droplets with diameters of less than 100 µm and impact velocities up to 20 m/s were used in our investigations of the interface evolution at droplet impact on wet surfaces. Here, the two-dimensional axisymmetric computational domain and model paints were applied in simulations.
Figure 12 shows typical results of different paint droplet impacting on a thin liquid film. A small droplet at a low impact speed deposits smoothly on the liquid film (Figure 12a). With an increasing impact energy of the droplet, namely, either with a larger diameter or with a higher velocity, a small crater can be formed in the target liquid layer (see Figure 12b). If the impact energy is high enough, the so-called crater rim or crown rises at the circumference of the crater above the original surface of the liquid layer on the target (Figure 12c). Air bubbles (blue color) can be observed clearly in the liquid film, which is air entrapment, a typical phenomenon of the droplet impact process.
For paint liquids with a shear thinning behavior, the variation in the apparent viscosity during the impact process must be considered. Figure 13 shows the evolution of the viscosity inside the droplet and in the liquid film during the cratering process. In this case, a droplet with a diameter of 65 µm impacts at a 6 m/s velocity on a wet solid surface with a film thickness of 65 µm. The evolution of the viscosity in the whole relevant fluid region from the early stage of droplet impact until the end phase of the impact can be obtained. For a better analysis, the characteristic viscosity η * of the droplet is determined to be 14.86 mPa·s ( η * is defined as the viscosity at the characteristic shear rate γ ˙ * of droplets in the impact process, γ ˙ * = 2 · U / D ). The corresponding Reynolds number ( R e * = ρ U D / η * ) and the Ohnesorge number ( O h * = η * / ρ σ D ) are 24.2 and 0.39, respectively. At the early stage of drop impact, the viscosity is quite low in the collision region due to the very high shear rate in this region (larger than 500,000 s−1). The viscosity in the collision region is approx. 10 mPa·s. Far away from the impact center, the viscosity is about 85 mPa·s, corresponding to the value at the shear rate of zero. At the end phase of the impact, the liquid viscosity is increased to 70–75 mPa·s. In this quasi-static state, a ring-shaped region of low viscosity inside the film under the remaining depression can be observed, where the air bubbles are located.
The parameter study of the paint droplet impact on the wet film was carried out using different droplet diameters, impact velocities, as well as film thicknesses, as shown in Table 2, with a focus on the result of the gas–liquid interface. The obtained dimensionless crater sizes, namely, the ratios between the maximal crater diameter Dc (see Figure 13), the droplet diameter D, and the maximal crater depth h c to D are plotted as a function of the Reynolds number R e * in Figure 14. Considering the effect of the film thickness on the crater size, we introduced the characteristic crater diameter and depth as follows:
D * = D c D 1 R e *     ·   H D n
h * = h c D 1 R e *     ·   H D n
where R e * is the characteristic Reynolds number and H is the film thickness. The exponent n indicates the effect of the dimensionless film thickness on the crater size with n = 0.1 . In Figure 14, the characteristic crater sizes are plotted as a function of the Reynolds number R e * . A strong correlation between both dimensionless values is observed and can be described using an exponential function:
D * = A 0 + A 1 e A 2 · R e *  
h * = B 0 + B 1 e B 2 · R e *  
where A 0 = 1.0755 ,   A 1 = 0.62629 ,   A 2 = 0.19858 ,   B 0 = 0.99827 ,   B 1 = 0.63523 ,   a n d   B 2 = 0.13853 . Finally, the dependency of the different droplet impact processes on the Reynolds and Ohnesorge numbers is analyzed and depicted in Figure 15, with a blue dot for deposition and a red circle for a crater/crown. In general, the simulation results shown in this section will help to analyze and understand all further investigations, such as the flake orientation during droplet impact on wet solid surfaces, entrainment of air bubbles in the impact process, and the final film leveling.

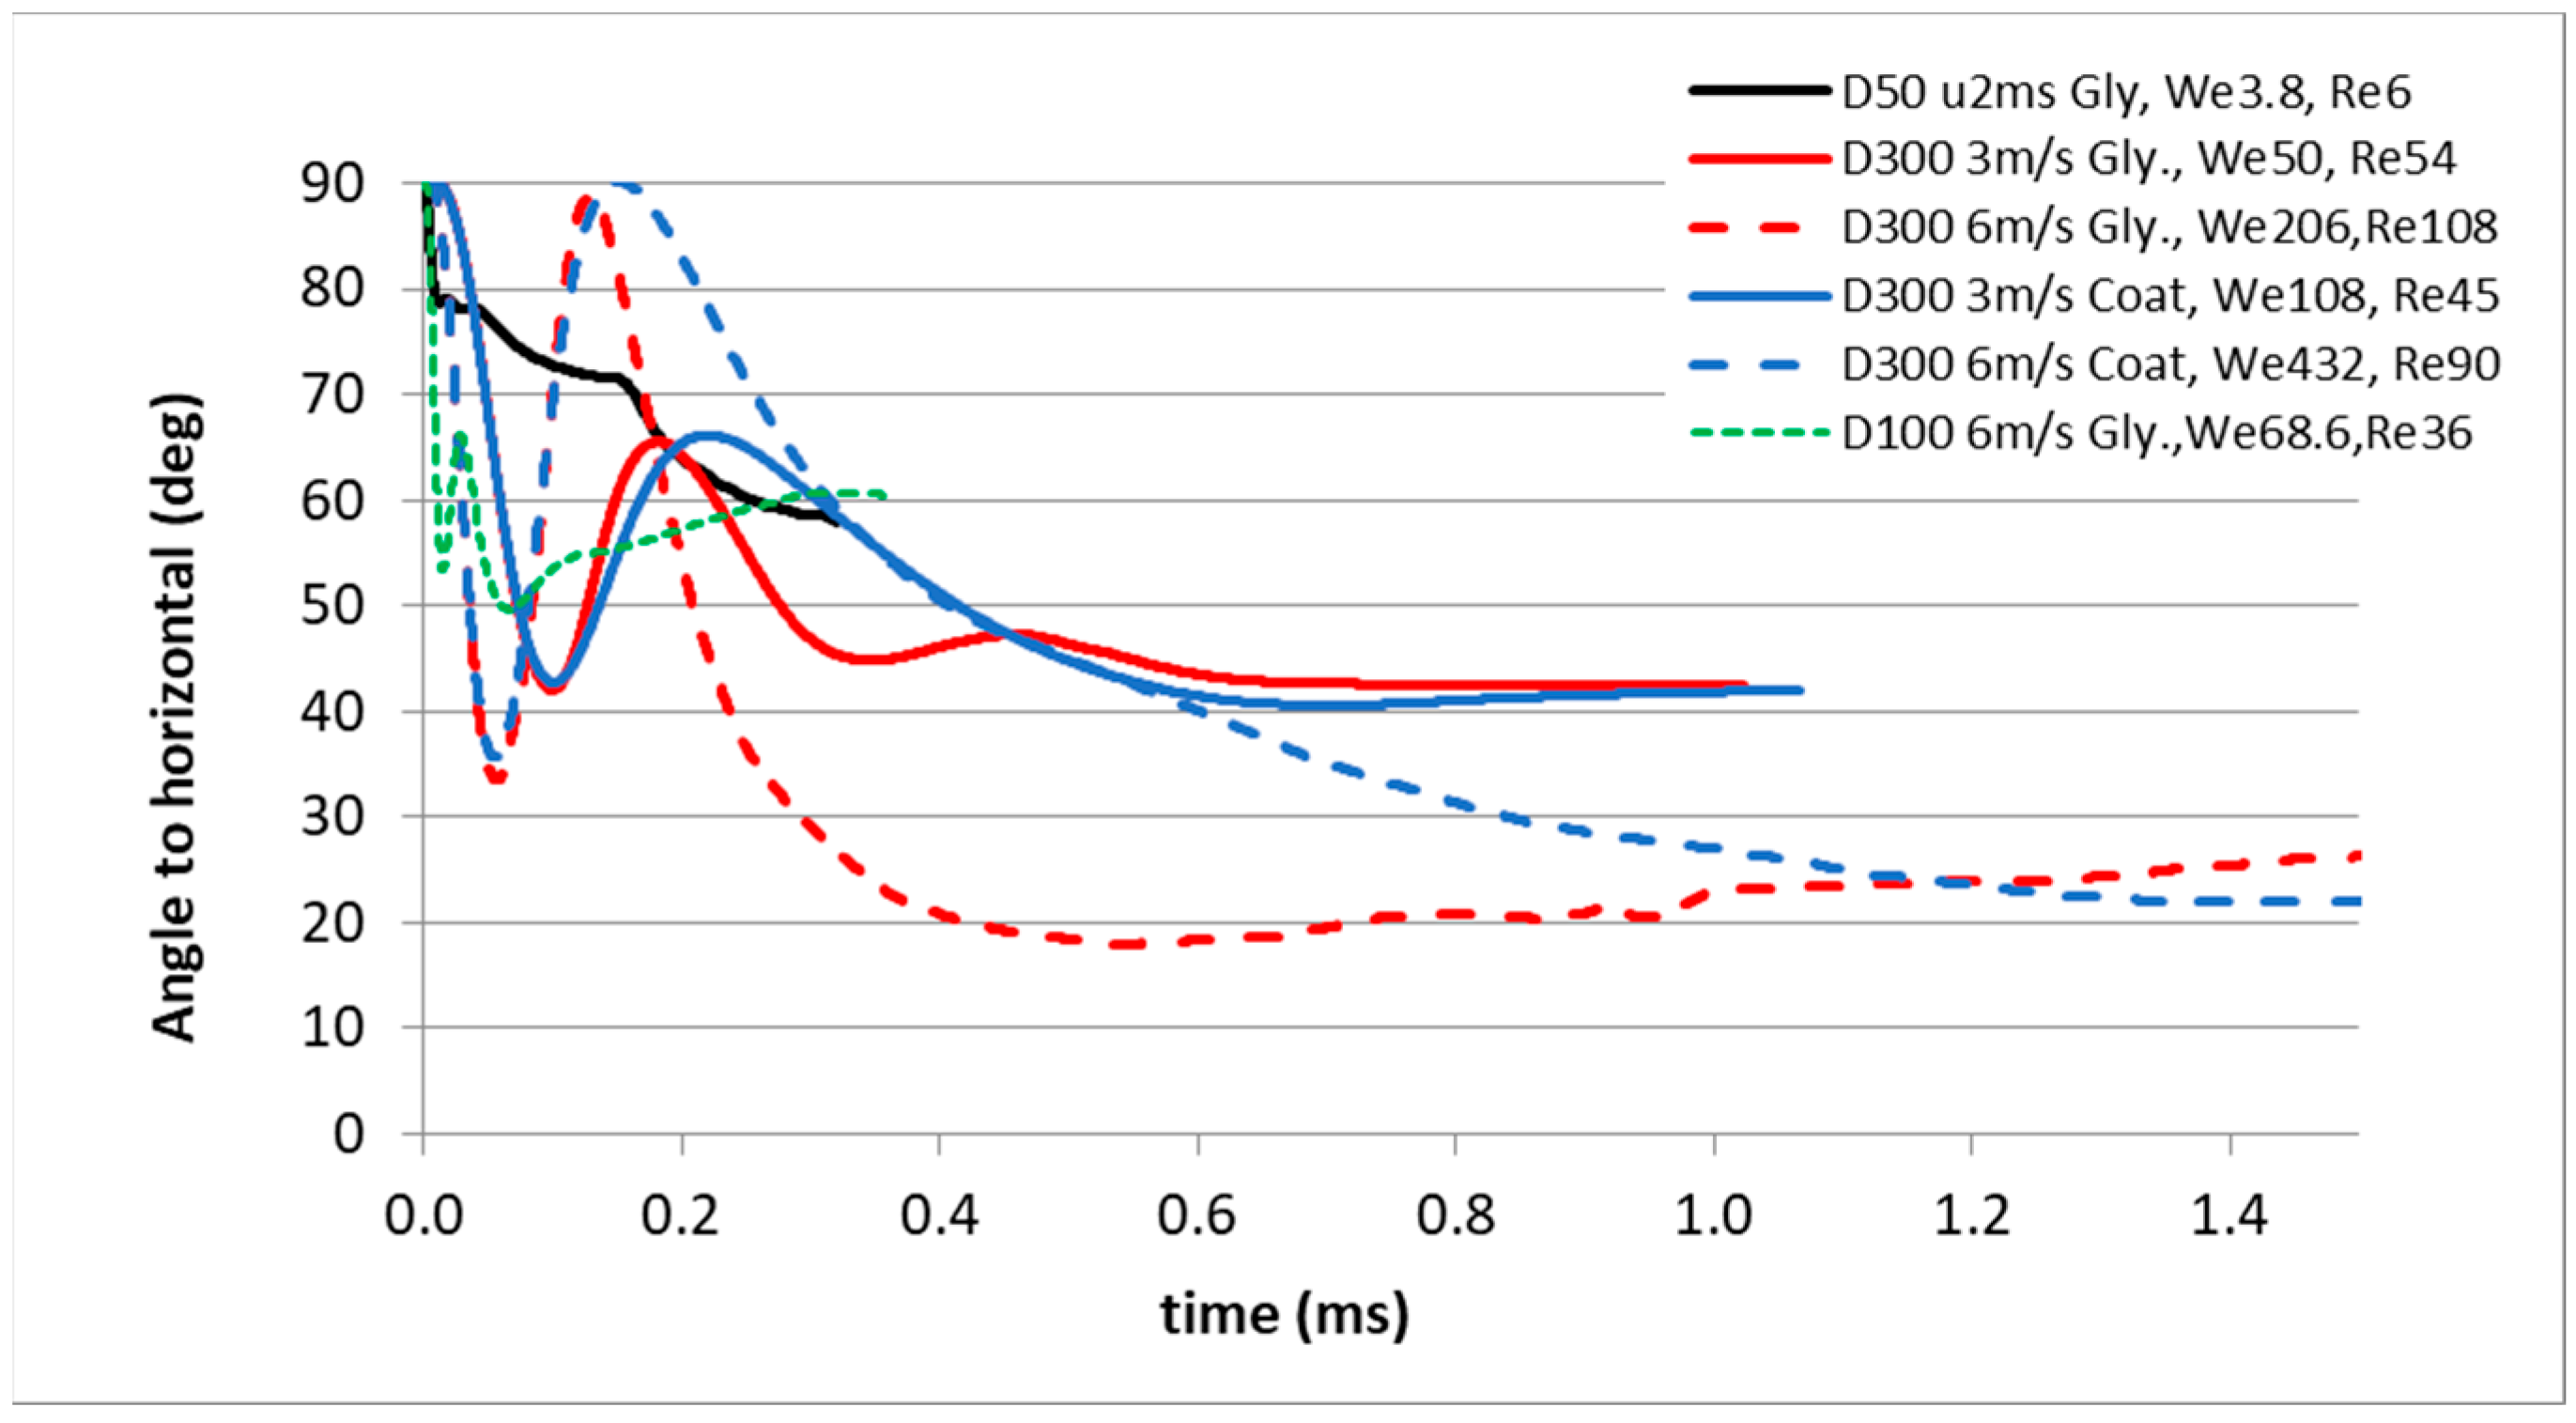
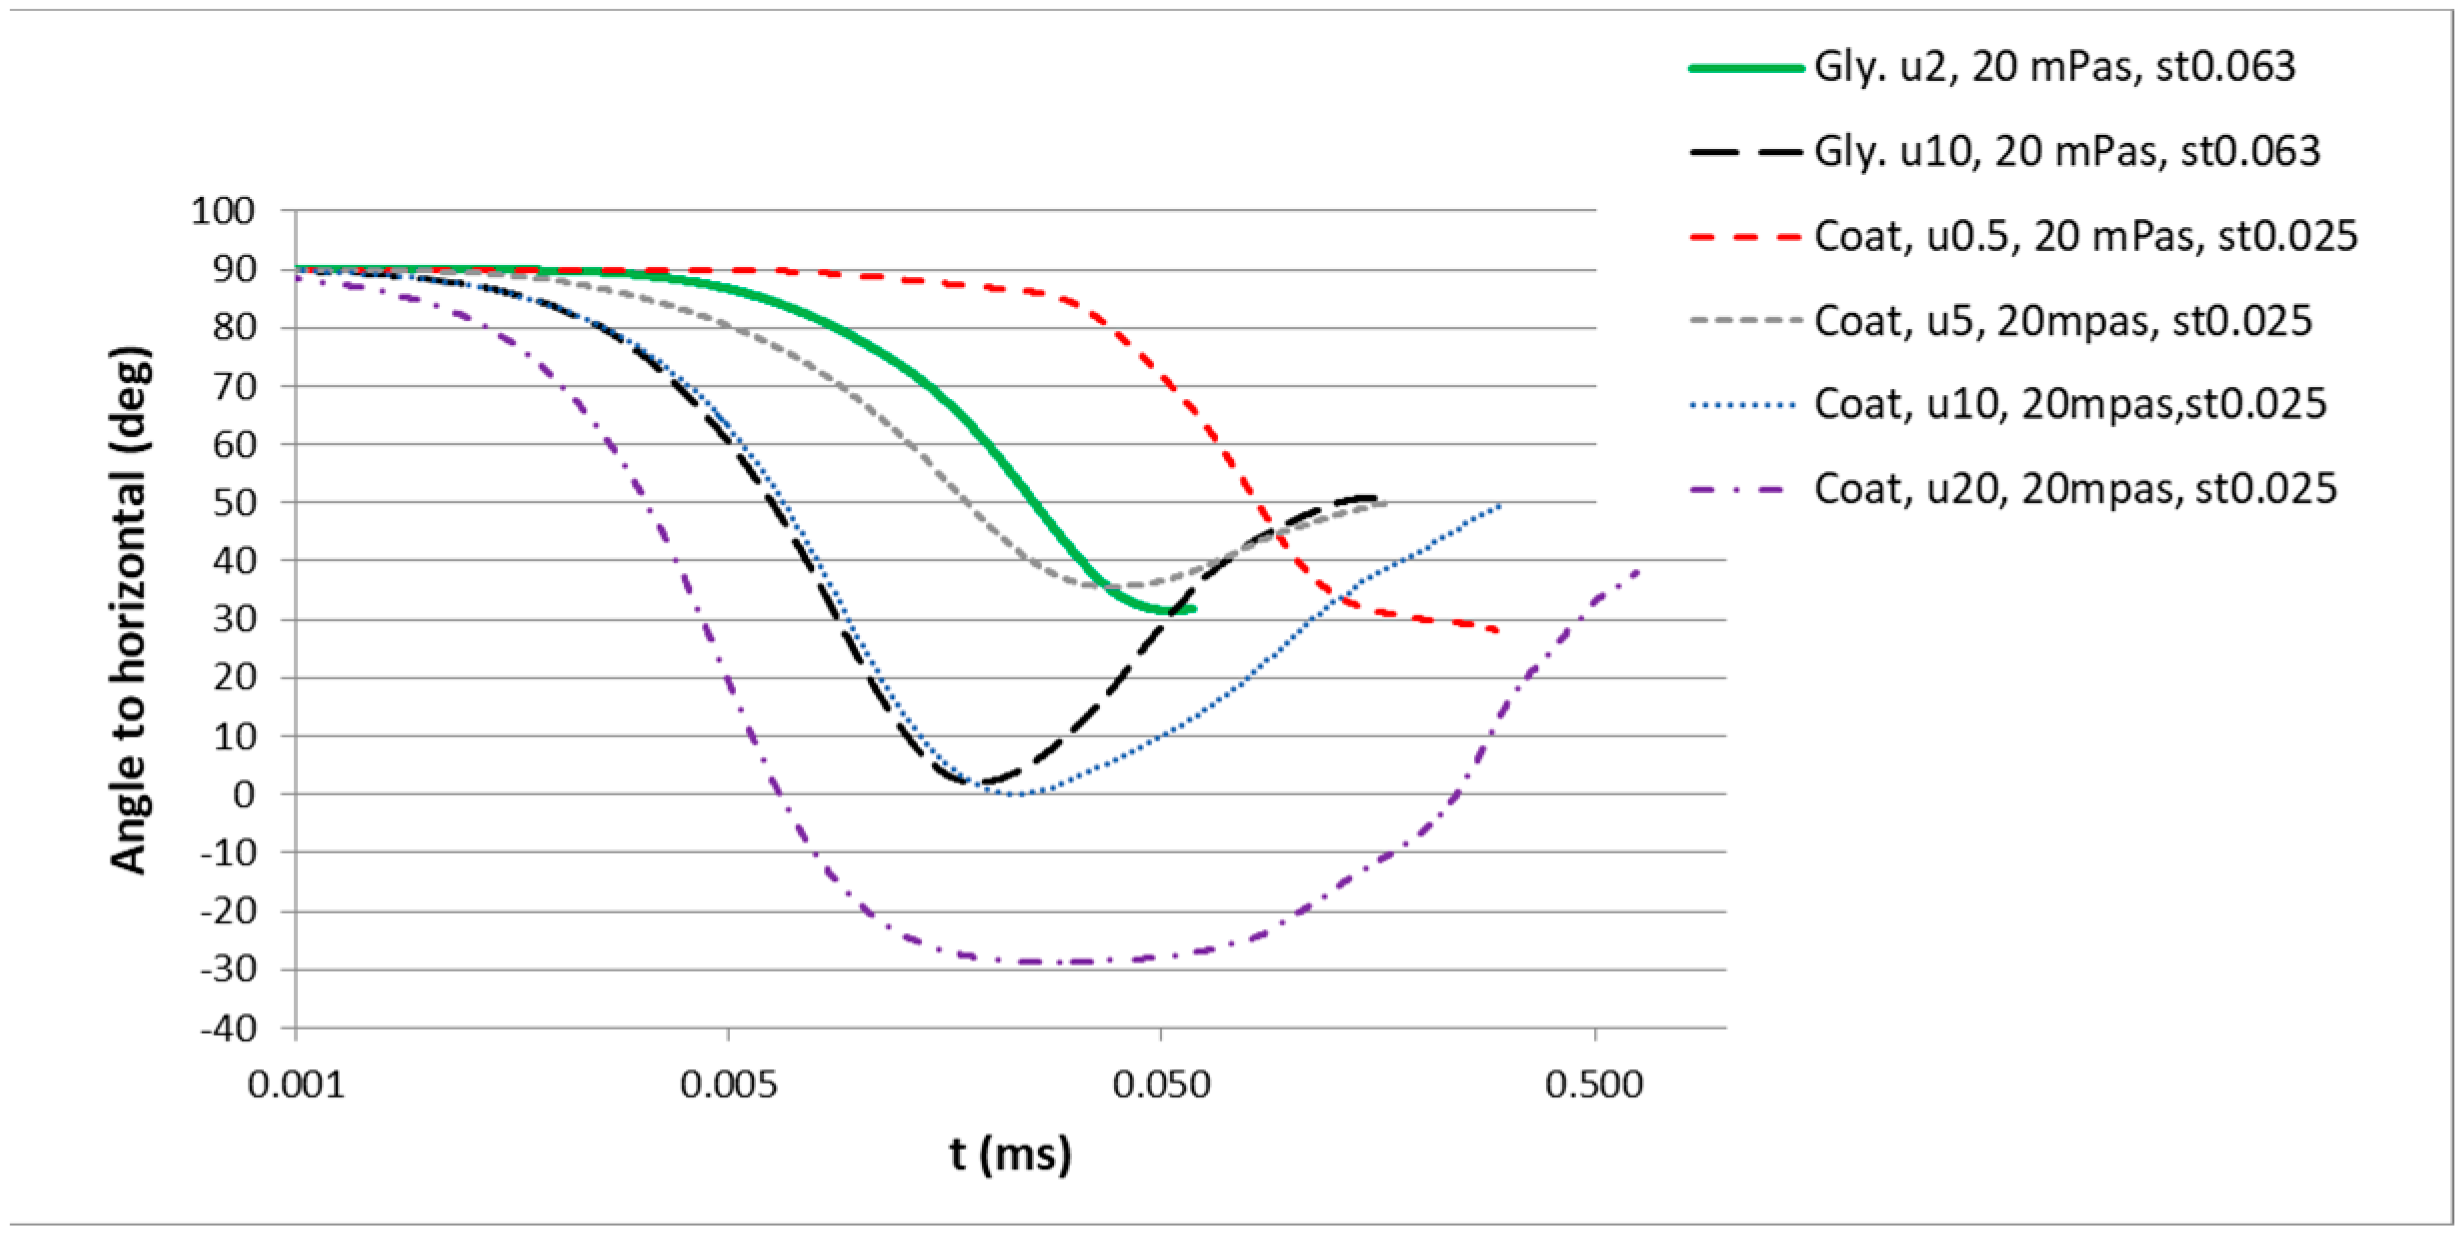
6. Simulation of Flake Orientation at Droplet Impact

Effect pigments (such as metallic pigments) are an essential component of paints with a metallic (or mica) effect. Figure 16 shows a typical metallic pigment, that is, a thin plate with a thickness about 1 µm and a diameter of 8–16 µm. Essentially, flat metallic pigments or flakes act like small mirrors reflecting incident light preferentially at the incident angle. As shown in Figure 16b, the final intensity distribution depends mainly on the orientation distribution of the flakes in the film. An optimum surface-parallel orientation of the flake results in an optimum metallic effect. In simulations, a simple geometry of the flake, namely, a rectangular plate of 1 × 16 × 16 µm3, was applied.
Due to the small sizes of the flakes, the short time scales of the process, and the opaqueness of the paints, it is almost impossible to observe the flake movement during the impact process experimentally. Therefore, numerical simulations provide probably the only alternative for the investigation of flake orientation in droplet impact processes.
In the following parameter study of flake orientation, Newtonian materials with constant viscosity were investigated at first, and later we will also show the results of using non-Newtonian liquid. Based on the characteristic shear rate proposed above, a reasonable range of Newtonian viscosities, i.e., 0.01–0.08 Pa·s, was chosen, representing a good approximation of the viscosities of typical paint materials at the high shear rate during the impact processes. Moreover, a surface tension of 0.025 N/m was used in the simulations for paint liquids. The detailed parameters used in the simulations of flake orientation are given in Table 2.

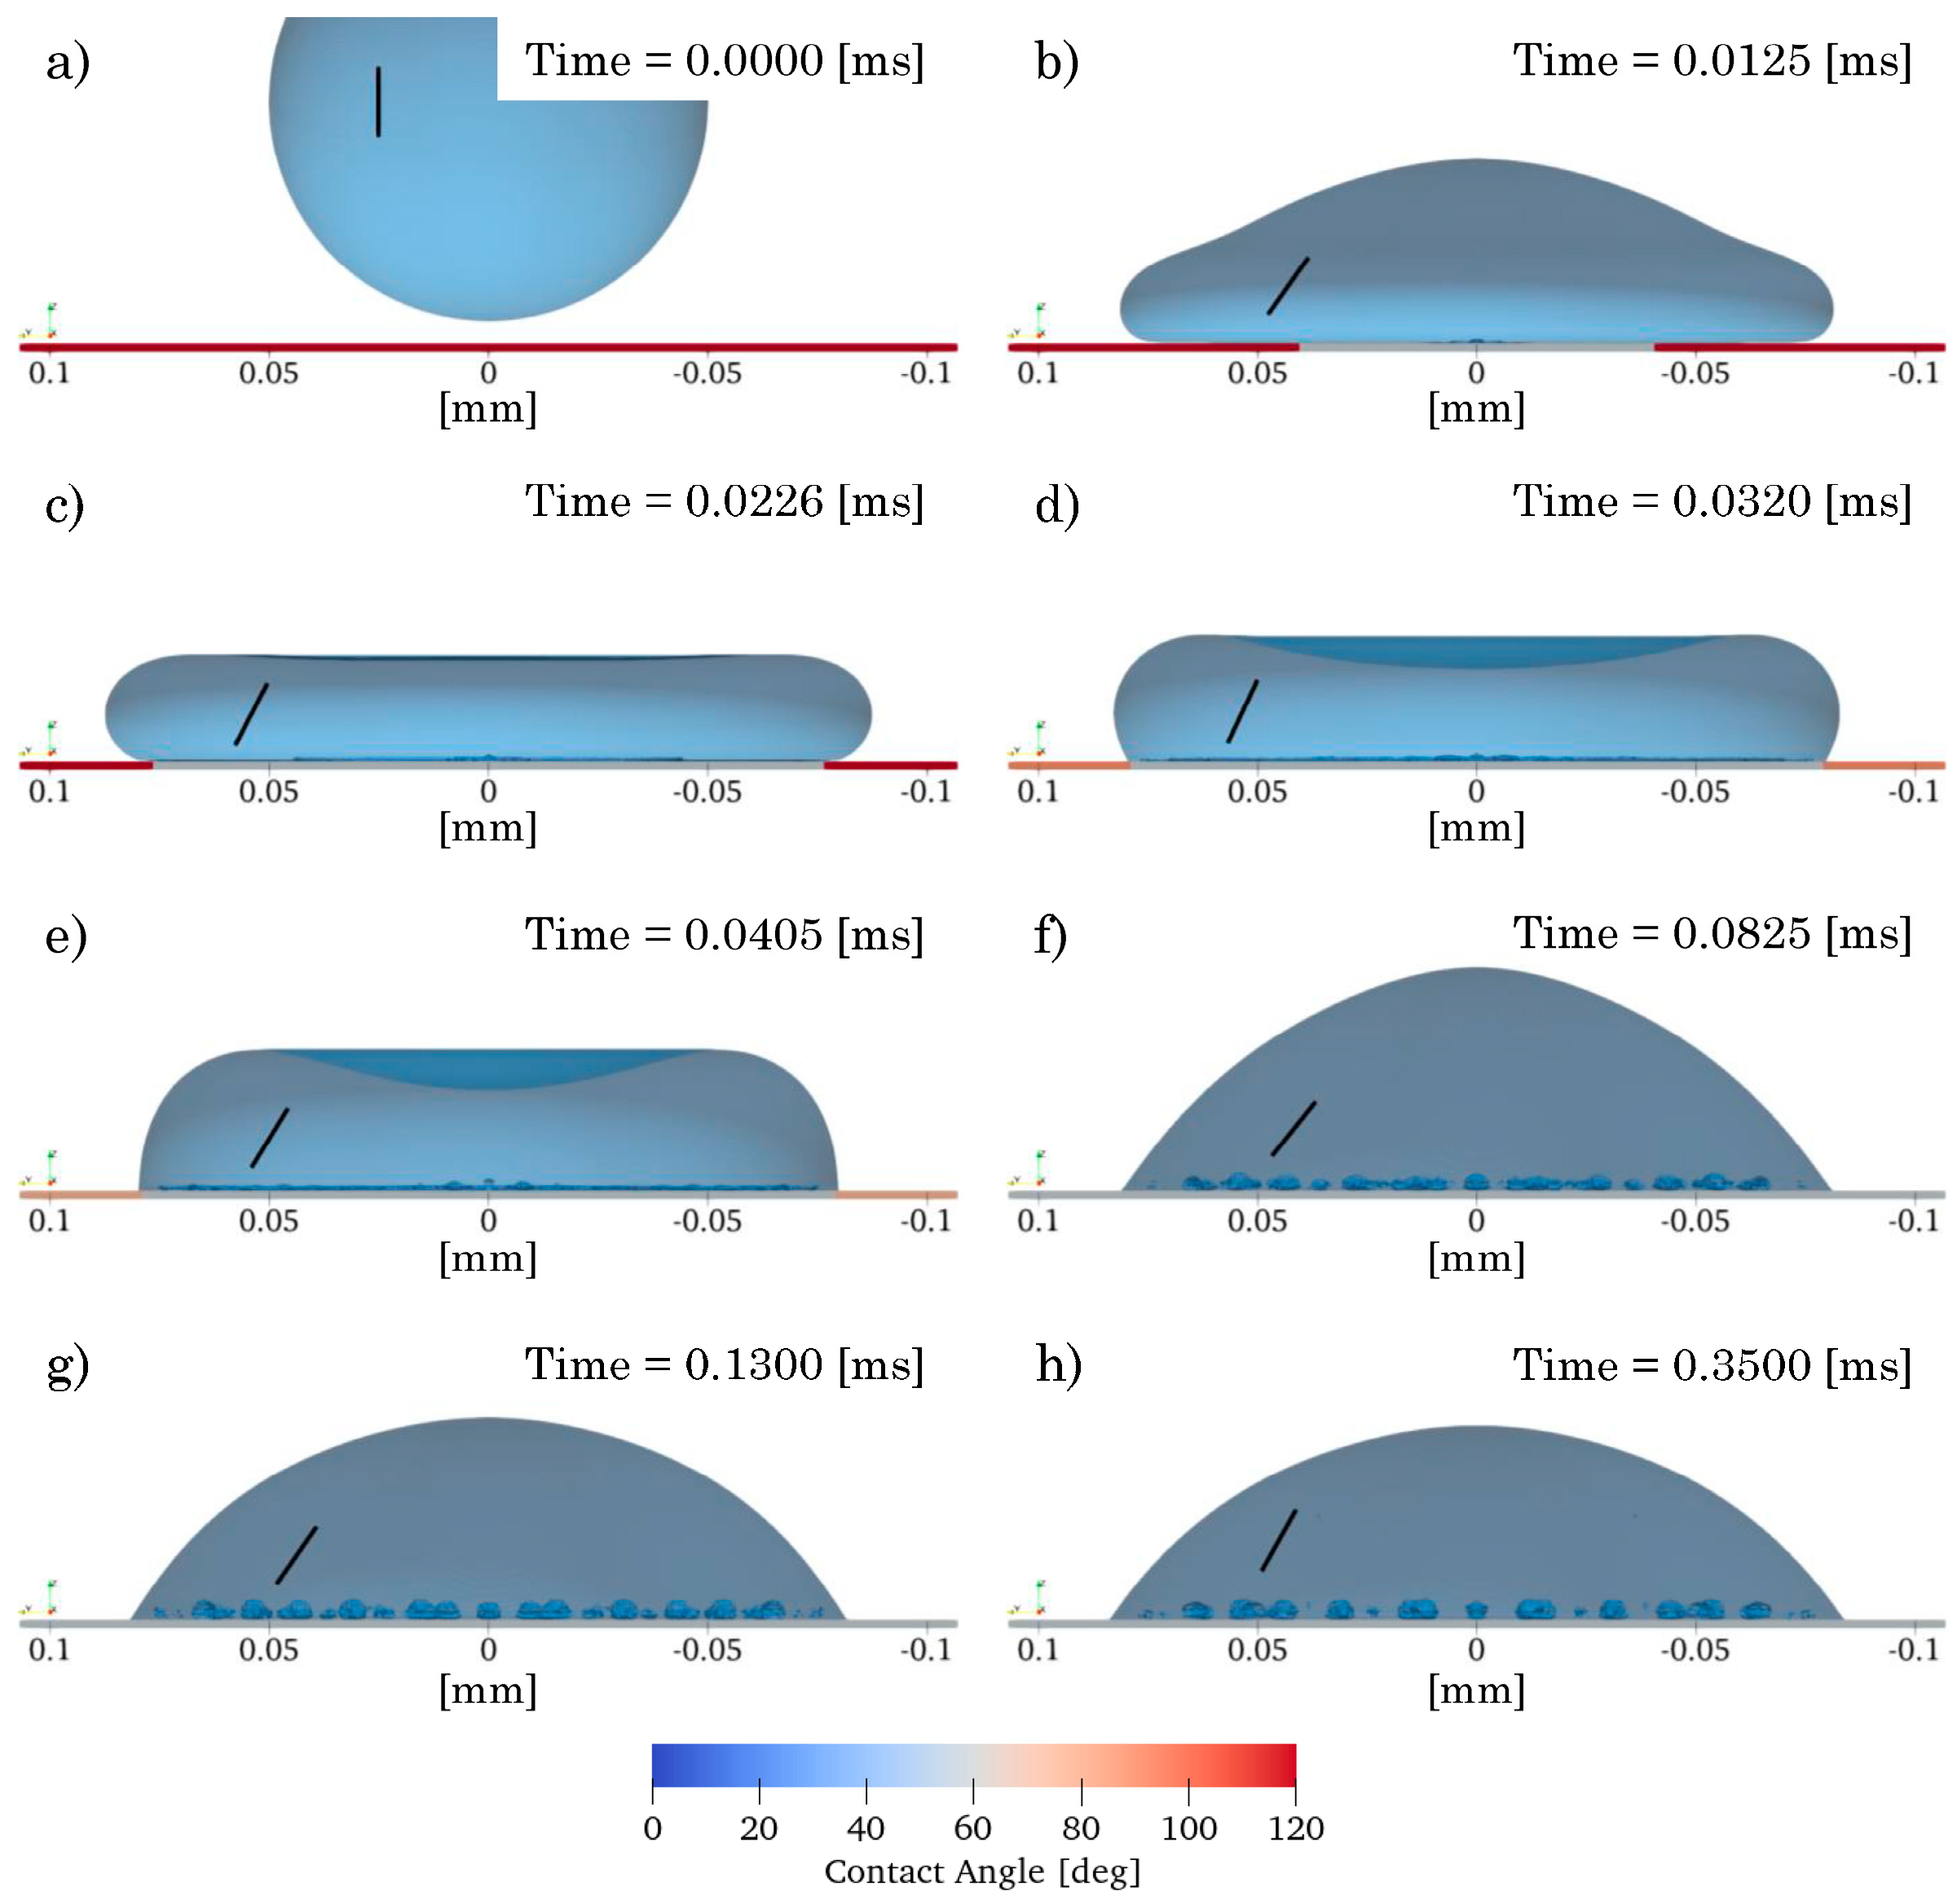
6.1. Dry Solid Surfaces

The initial position and orientation of effect pigments inside an impacting droplet may be randomly distributed. For the simulations of droplet impact on dry substrates, the flake has initially been located at the horizontal mid plane and at a 50% droplet radius in the vertical direction. The initial orientation of the flake is perpendicular to the surface, which can be considered the worst case for the final desired surface-parallel orientation.
Figure 17 shows the droplet contour evolution and the flake orientation during the droplet impact process. The color bar shows the contact angle. The outer contact angle changes from 120° at the beginning of the spreading process to 60° in the final quasi-static situation. The initial state of the flake is depicted in Figure 17a. During the inertia-driven spreading phase, as shown in Figure 17b,c, the flake is rotating significantly. In Figure 17d, the maximum spreading is reached and surface tension effects become dominant. During this stage, despite droplet contour movements, the above-mentioned contact line hysteresis is observed, which is identical to our experimental findings. Here, the flake is increasing its orientation angle with respect to the surface again. Some changes of flake orientation after t = 0.032 ms (Figure 17d) can be observed (Figure 17e,f,g), until the final location and orientation of the flake at a final quasi-steady state, as shown in Figure 17h. Air entrapment at droplet impact and air bubble formations (blue bubbles) on the wall can also be observed in Figure 17.
The effects of the droplet liquid properties and the impact parameters on the temporal evolution of the flake orientation are shown in Figure 18. Glycerol/water and paint droplets with η = 20 mPa·s were applied. For small droplets, in the considered case of 50 µm, the quasi-static state is reached at t = 0.3 ms. Since the size ratio between the flake and droplet diameter is relatively large, i.e., l/D = 0.32 for the 50 µm droplet, the movement of the flake is quite limited. In contrast, larger variations in the flake orientation angle can be observed for 300 µm diameter droplets. In addition, the time to reach a quasi-static state significantly increases with increasing We- or Re-numbers. The final flake angle in the quasi-static state depends, presumably, mainly on the Re-number for a given low viscosity. In general, it seems that the final flake orientation improves with an increasing Re-number, at least in the case of droplet impact on dry surfaces.

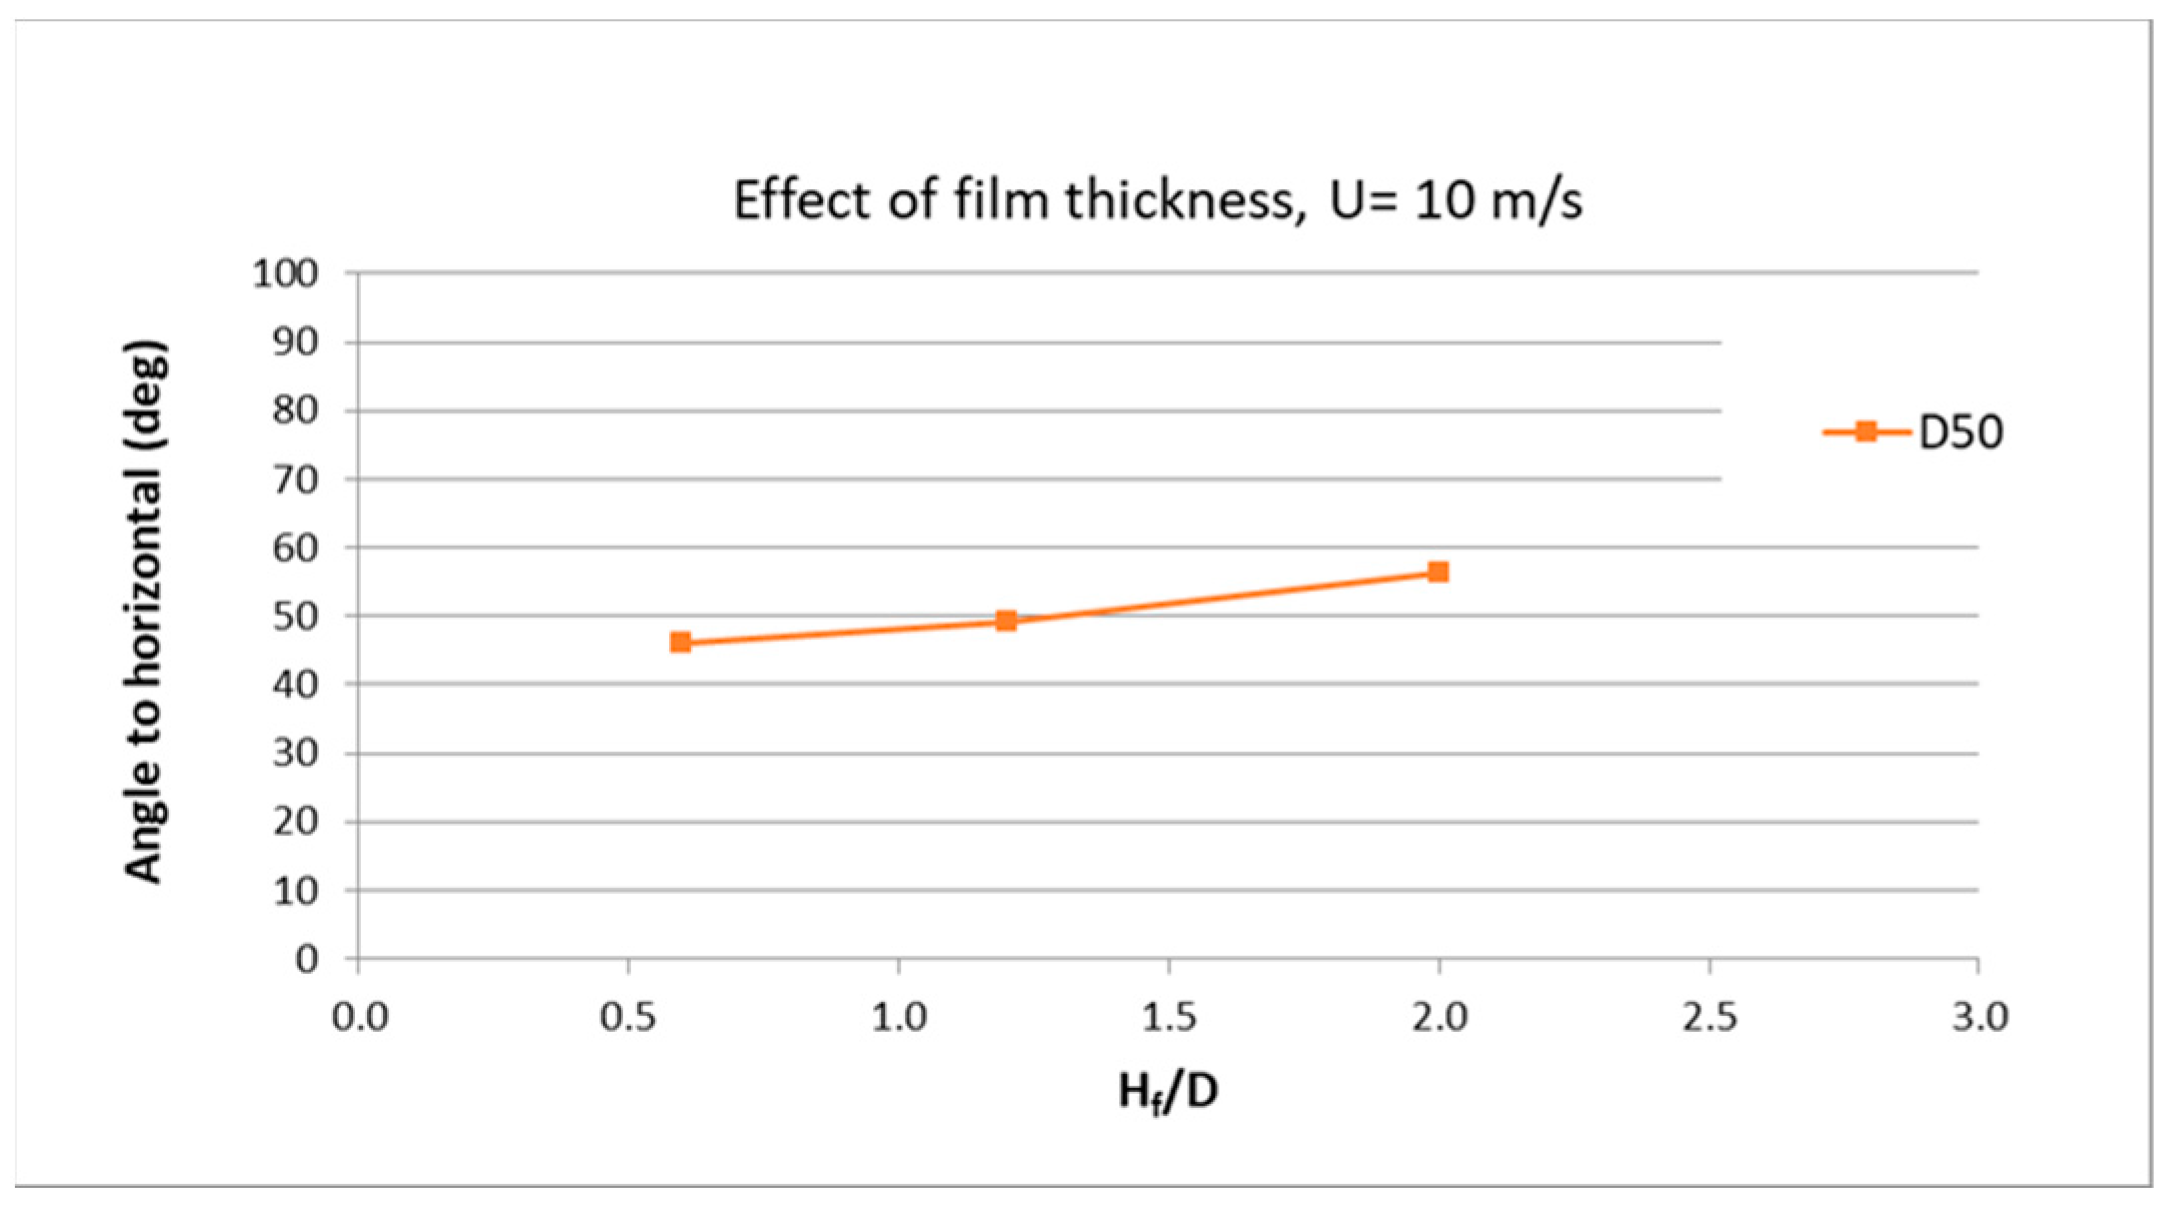
6.2. Impact on Wet Solid Surfaces

The flake orientation at droplet impact on wet surfaces appears to be technically more relevant, as only the very first droplets after the start of application impact on a dry surface. At a later stage, a wet paint film has already been formed on the surface, and the resulting flake orientation is mainly dependent on the complete flow field at and close to the impact location. Since simulations of flake orientation during droplet impact are quite time consuming due to the need for large computational domains, our parameter studies are so far limited to droplets with a diameter of 50 µm only. Also, it should be noted that the droplet diameter must be greater than the longest extension of the flake, i.e., very small droplets do not contain any flakes.
Typical droplet deposition and cratering processes at different impact velocities are shown in Figure 19, Figure 20 and Figure 21, respectively. The wet film thickness is 60 µm. The final flake angle of the droplet deposition in Figure 19 is about 30° with the small impact velocity (U = 0.5 m/s). A typical crater occurs when increasing the impact velocity up to 10 m/s. During the deepening of the crater, as shown in Figure 20, the flake angle decreases and even tends to almost 0 (flake parallel to the surface) at t = 0.03 s. However, during crater retreat, the flake angle increases again significantly and reaches 49.3° in the final quasi-static state. By further increasing the impact velocity to 20 m/s, as shown in Figure 21, the crater size increases heavily, and crown formation can be observed. A larger amount of liquid and the flake are pushed outward from the crater center. The crater retreat begins when the crown disappears. Compared to the case with U = 10 m/s, the process of the crater retreat is much slower due to the thin film at the bottom and the resulting lower surface force. This leads to a lower flake angle (38°) in the final quasi-static state.
The effect of a surface tension variation on the flake orientation at different impact velocities is shown in Figure 22, using a glycerol/water mixture and paint, both with a constant viscosity of 20 mPa·s. When comparing glycerol/water and paint droplets at a 10 m/s impact velocity, the surface tension shows only a weak effect on the final flake orientation in a quasi-static state, approaching 50° for both cases; however, the time to reach the quasi-static state is significantly extended in the case of the paint droplet with a lower surface tension. At lower impact velocities between 0.2 m/s and 5 m/s, the final flake angles are constantly smaller (around 30°), independent of the surface tension. When further increasing the impact velocity to 20 m/s, the final flake angle seems to decrease. In this case, at t = 0.618 ms the film lever shown in Figure 21 is almost horizontal, corresponding to a quasi-steady state.
The effect of the viscosity on the flake angle is shown in Figure 23 for a droplet size D of 50 µm, a film thickness H of 60 µm, an impact velocity U of 5 m/s, and a surface tension σ of 0.025 N/m. Clearly, the final flake angle in a quasi-static state increases significantly with an increasing viscosity, especially in case of the 40 mPa·s and the 80 mPa·s liquids. Figure 23 also includes the simulation results of a non-Newtonian, shear-thinning model paint. The corresponding viscosity curve (paint A) is given in Figure 3. For a further explanation of the result, Figure 23 needs to be analyzed, showing the distribution of the apparent fluid viscosity during different stages of droplet impact. As expected, the apparent viscosity diminishes in fluid regions with high shear rates due to the presence of strong velocity gradients. Since the flake is mainly located in a 20 mPa·s fluid zone, especially at a later stage of the impact process (Figure 24c), the flake orientation and the final flake angle correspond nicely to the results of the Newtonian 20 mPa·s case. Although the present investigations focus on a wet file thickness of 60 µm, only a weak effect of the film thickness was found in the range between 30 µm and 60 µm, as shown in Figure 25, which are typical wet film thicknesses of metallic paint layers.
In summary, the important influencing factors on the evolution of the gas–liquid interface and subsequently on the final flake orientation are the droplet diameter, droplet impact velocity, and liquid viscosity. The correlation between the characteristic Re-number R e * and the final flake angle for paint droplets is depicted in Figure 26. For the desired minimum flake angle, the R e * should be in the range of 40–60. In connection with the subsequent reduction in the flake angle during paint layer drying and baking, these low values should be an appropriate starting condition for an excellent final metallic effect of the paint layer. Low flake angles can also be observed in the case of 0.3 < R e * < 1.5 , corresponding to small droplets and/or very low impact velocities. However, technically, this region appears to have only a little practical importance, as smaller droplets have a lower probability of containing a flake. Moreover, a larger number of very small droplets are subject to unwanted evaporation effects.
The region of very high Re-numbers over 100 was not considered in the present investigations, as the impact of very large droplets and high impact velocities may lead to splashing and formation of ripple structures on the film surface, often resulting in a so-called orange-peel structure of the final paint layer. Paint surfaces with visible orange peel do not correspond to the desired quality. In the present numerical study, the flake is initially oriented vertically to the solid surface, which is the worst case. For additional simulation results of the effect of the initial position of the flake inside droplets on the final flake angle, refer to [26].

7. Summary and Conclusions

The present paper summarizes the results of numerical investigations of viscous droplet impact on dry and wetted solid walls for spray coating applications, focusing on air entrapment, film structure, and flake (pigment) orientation. Parameter studies were performed including Newtonian liquids as well as non-Newtonian, shear-thinning liquids typical for water-based paint materials. Operating parameters typical for high-quality spray painting applications were applied. Also, a dynamic contact angle model that is suitable to be used in the spray painting processes was proposed. Where possible, the obtained results could be validated by experimental observations using a high-speed camera.
It was found that there is always the formation of air entrapment during droplet impact on a dry or wet substrate, almost independent of the surface wettability. Thin air layers (air disc) result from the direct contact between the droplet surface and the substrate. The size of the air disc, the contraction of the air disc to bubbles, and the release of air bubbles depend on material and target properties and application parameters. A reduction in the static contact angle of the liquid enhances the bubble release from the target wall as well as from the liquid film. Of course, higher liquid viscosities delay bubble release from both the wall and the liquid film.
At the considered conditions, when focusing on the spray painting applications, craters are formed at Re-numbers greater than 10 in the case of impact on wet surfaces. Characteristic crater diameters and crater depths could be defined and correlated with the Re-number and the film thickness. Smooth droplet deposition and leveling were found at lower Re-numbers in connection with small Oh-numbers.
Particularly for the analysis of the metallic effect of paints, a detailed numerical study of the flake orientation during droplet impact on dry and wet solid surfaces was carried out. Therefore, a rigid body motion solver for calculating pigment movement was implemented in ANSYS-Fluent, including specific numerical approaches to ensure stable solutions of the flake motion equations and enable simulations with practical relevance. In the case of droplet impact on dry surfaces, relatively large final flake angles with respect to the surface are obtained in the quasi-steady state after the receding process, together with a significant dependency on the Re-number. In the case of droplet impact on wet surfaces, it was found that higher liquid viscosities reduce the flake movement, resulting in smaller differences between the initial and the final flake angles. The dependency of the final flake angle on the characteristic Re-number was analyzed, yielding suitable R e * -numbers for a final optimal flake angle in practical applications.
The presented set of simulation results delivers useful information for future investigations with enhanced practical relevance, including, e.g., the distribution of flake orientation depending on the droplet size distribution and the size/velocity correlation at droplet impact. Also, film drying and baking effects on air release and flake orientation must be considered to allow an estimation of the final paint film quality.

Author Contributions

Validation, O.T. and J.D.; Investigation, Q.Y. and B.S.; Writing—original draft, Q.Y.; Writing—review & editing, O.T. and J.D.; Supervision, Q.Y.; Project administration, O.T. All authors have read and agreed to the published version of the manuscript.

Funding

The present investigations were supported by the German Federal Ministry for Economic Affairs and Energy through the Arbeitsgemeinschaft industrieller Forschungsvereinigungen (AIF). The work was also supported by the High-Performance Computing Center (HLRS) of the University of Stuttgart.

Data Availability Statement

Dataset available on request from the authors.

Acknowledgments

We would like to thank our colleagues at the Fraunhofer Institute for Manufacturing Engineering and Automation in Stuttgart, who provided us the experimental results, which were very helpful for the present work.

Conflicts of Interest

The authors declare no conflict of interest.

References

  1. Chandra, S.; Avedisian, C.T. On the collision of a droplet with a solid surface. Proc. R. Soc. Lond. Ser. A 1991, 432, 13–41. [Google Scholar] [CrossRef]
  2. Fujimoto, H.; Shiraishi, H.; Hatta, N. Evolution of liquid/solid contact area of a drop impinging on a solid surface. Int. J. Heat Mass Transf. 2000, 43, 1673–1677. [Google Scholar] [CrossRef]
  3. Thoroddsen, S.T.; Etoh, T.G.; Takehara, K.; Ootsuka, N.; Hatsuki, Y. The air bubble entrapped under a drop impacting on a solid surface. J. Fluid Mech. 2005, 545, 203–212. [Google Scholar] [CrossRef]
  4. Thoroddsen, S.T.; Takehara, K.; Etoh, T.G. Bubble entrapment through topological change. Phys. Fluids 2010, 22, 051701. [Google Scholar] [CrossRef]
  5. Palacios, J.; Hernández, J.; Gómez, P.; Zanzi, C.; López, J. On the impact of viscous drops onto dry smooth surfaces. Exp. Fluids 2012, 52, 1449–1463. [Google Scholar] [CrossRef]
  6. Thoroddsen, S.T.; Sakakibara, J. Evolution of the fingering pattern of an impacting drop. Phys. Fluids 1998, 10, 1359–1374. [Google Scholar] [CrossRef]
  7. Li, E.Q.; Thoroddsen, S.T. Time-resolved imaging of a compressible air disc under a drop impacting on a solid surface. J. Fluid Mech. 2015, 780, 636–648. [Google Scholar] [CrossRef]
  8. Arogeti, M.; Sher, E.; Bar-Kohany, T. A single spherical drop impact on a flat, dry surface—A unified correlation. At. Sprays 2017, 27, 759–770. [Google Scholar] [CrossRef]
  9. Wörner, M. Maximum spreading of an impacting drop. Int. J. Multiph. Flow 2023, 167, 104528. [Google Scholar] [CrossRef]
  10. Mehdi-Nejad, V.; Mostaghimi, J.; Chandra, S. Air bubble entrapment under an impacting droplet. Phys. Fluids 2003, 15, 173–183. [Google Scholar] [CrossRef]
  11. Kim, E.; Baek, J. Numerical study of the parameters governing the impact dynamics of yield-stress fluid droplets on a solid surface. J. Non-Newton. Fluid Mech. 2012, 173–174, 62–71. [Google Scholar] [CrossRef]
  12. Ye, Q.; Tiedje, O. Investigation on Air Entrapment in Paint Drops under Impact onto Dry Solid Surfaces. High Perform. Comput. Sci. Eng. 2016, 16, 355–374. [Google Scholar]
  13. German, G.; Bertola, V. Impact of shear-thinning and yield-stress drops on solid substrates. J. Phys. Condens. Matter 2009, 21, 375111. [Google Scholar] [CrossRef]
  14. Nigen, S. Experimental investigation of the impact of an (apparent) yield-stress material. At. Sprays 2005, 15, 103–118. [Google Scholar] [CrossRef]
  15. Šikalo, Š.; Wilhelm, H.-D.; Roisman, I.V.; Jakirlić, S.; Tropea, C. Dynamic contact angle of spreading droplets: Experiments and simulations. Phys. Fluids 2005, 17, 062103. [Google Scholar] [CrossRef]
  16. Linder, N.; Criscione, A.; Roisman, I.V.; Marschall, H.; Tropea, C. 3D computation of an incipient motion of a sessile drop on a rigid surface with contact angle hysteresis. Theor. Comput. Fluid Dyn. 2015, 29, 373–390. [Google Scholar] [CrossRef]
  17. Weiss, D.A.; Yarin, A.L. Single drop impact onto liquid films: Neck distortion, jetting, tiny bubble entrainment, and crown formation. J. Fluid Mech. 1999, 385, 229–254. [Google Scholar] [CrossRef]
  18. Rein, M. Phenomena of liquid drop impact on solid and liquid surfaces. Fluid Dyn. Res. 1993, 12, 61–93. [Google Scholar] [CrossRef]
  19. Wang, A.-B.; Chen, C.-C. Splashing impact of a single drop onto very thin liquid films. Phys. Fluids 2000, 12, 2155–2158. [Google Scholar] [CrossRef]
  20. Banks, D.; Ajawara, C.; Sanchez, R.; Surti, H.; Aguilar, G. Effects of drop and film viscosity on drop impacts onto thin films. At. Sprays 2013, 23, 525–540. [Google Scholar] [CrossRef]
  21. Tran, H.; He, Z.; Pack, M. Microbubble entrainment on thin liquid films under drop impacts. J. Colloid Interface Sci. 2025, 682, 915–923. [Google Scholar] [CrossRef]
  22. Thoroddsen, S.T.; Thoraval, M.-J. Using drop impacts to study the dynamics of sub-micron liquid structures. In Proceedings of the 15th International Symposium on Flow Visualization, Minsk, Belarus, 25–28 June 2012. [Google Scholar]
  23. Kirchner, E. Flow-induced orientation of flakes in metallic coatings: II. The orientation mechanism. Prog. Org. Coat. 2018, 124, 104–109. [Google Scholar] [CrossRef]
  24. Schlüsener, T. Untersuchungen zum Einfluss der thermo- und hydrodynamischen Vorgänge bei der Lackapplikation und -trocknung auf die Farbtonausbildung wasserbasierter Metallic-Lacke. Ph.D. Thesis, Technical University of Darmstadt, Darmstadt, Germany, 2000. (In German). [Google Scholar]
  25. Saito, Y.; Hashiguchi, N.; Cheng, Z.; Okabe, T.; Miyagawa, T.; Shirota, M.; Matsukawa, Y.; Aoki, H.; Daikoku, M.; Fukuno, J. Numerical analysis of droplet impact behavior and changes in flake particle orientation within droplets on a solid surface. Chem. Eng. Sci. 2025, 306, 121299. [Google Scholar] [CrossRef]
  26. Ye, Q.; Dreher, M.; Tiedje, O.; Shen, B.; Domnick, J. Numerical simulation of flake orientation during droplet impact on substrates in spray painting processes. In Proceedings of the ICLASS, Edinburgh, UK, 29 August–2 September 2021. [Google Scholar] [CrossRef]
  27. Shen, B.; Ye, Q.; Tiedje, O.; Domnick, J. On the impact of viscous droplets on wet solid surfaces for spray painting processes. In Proceedings of the ICLASS 2021, 15th Triennial International Conference on Liquid Atomization and Spray Systems, Edinburgh, UK, 29 August–2 September 2021; Volume 1. [Google Scholar] [CrossRef]
  28. Ye, Q.; Dreher, M.; Shen, B. Numerical simulation of flake orientation during droplet impact on substrates in spray painting processes. In High Performance Computing in Science and Engineering ’21; Nagel, W.E., Kröner, D.H., Resch, M.M., Eds.; Springer International Publishing: Cham, Switzerland, 2023; pp. 321–337. [Google Scholar] [CrossRef]
  29. Ye, Q.; Rhein, S.; Hess, T.; Niemeier, W.; Tiedje, O. Investigation on viscous droplet generation for selective coating processes. In Proceedings of the 10th International Conference on Multiphase Flow, ICMF 2019, Rio de Janeiro, Brazil, 19–24 May 2019. [Google Scholar]
  30. Ye, Q.; Domnick, J. Analysis of droplet impingement of different atomizers used in spray coating processes. J. Coat. Technol. Res. 2017, 14, 467–476. [Google Scholar] [CrossRef]
  31. Maile, F.J.; Pfaff, G.; Reynders, P. Effect pigments—Past, present and future. Prog. Org. Coat. 2005, 54, 150–163. [Google Scholar] [CrossRef]
Figure 1. Experimental single droplet setup: (a) side observation, (b) upward observation.
Fluids 10 00131 g001
Figure 2. Experimental setup for droplet impact on wetted solid wall.
Fluids 10 00131 g002
Figure 3. Flow curves of the model paints, measured and fitted by the Cross model.
Fluids 10 00131 g003
Figure 4. Definition of contact angle.
Fluids 10 00131 g004
Figure 5. Mesh size distribution determined using dynamic mesh adaption model.
Fluids 10 00131 g005
Figure 6. Contours of VOF overlaid with mesh at t = 0 s, blue: liquid, red: air.
Fluids 10 00131 g006
Figure 7. Glycerol/water droplet impact process, experiment (a) vs. simulation (b), droplet velocity U = 2.6 m/s.
Fluids 10 00131 g007
Figure 8. Comparison of droplet spread factors between experiment and simulation during the impact process, Gly. is Glycerol/water droplet, Coat is paint drop.
Fluids 10 00131 g008
Figure 9. Contours of liquid fraction (red: liquid, blue: air) in impact of a viscous drop (D = 300 µm, U = 4 m/s, η = 20 mPa·s, σ = 24 mN/m, θ E = 60 ° .
Fluids 10 00131 g009
Figure 10. Air entrapment at droplet impact on a dry surface in the quasi-static state (D = 50 µm, σ = 24 mN/m). (a) Effect of the viscosity, (b) effect of the impact velocity, (c) effect of the static contact angle, here cross-sections are also depicted to show the adhesion state of air bubbles on the substrate.
Fluids 10 00131 g010
Figure 11. Air entrapment at droplet impact on a wet substrate. (a) Experimental observation, (b) simulation results (Hf = 60 µm, D = 280 µm, U = 2.2 m/s, η = 30 mPa·s, σ = 28 mN/m).
Fluids 10 00131 g011
Figure 12. Droplet impact on a wet solid surface (red: liquid, blue: air). Film Hf = 30 µm. (a) D = 30 µm, U = 4 m/s, (b) D = 45 µm, U = 4 m/s, (c) D = 80 µm, U = 8 m/s.
Fluids 10 00131 g012
Figure 13. Evolution of the viscosity contours (model paint A, D = 65 µm, Hf = 65 µm, U = 6 m/s, R e * = 24.2 , O h * = 0.39 ).
Fluids 10 00131 g013
Figure 14. Crater sizes as a function of the Reynolds number ( R e * ).
Fluids 10 00131 g014
Figure 15. Droplet impact formations at different Reynolds and Ohnesorge numbers (ratio between film thickness and drop diameter is between 0.375 and 2.16).
Fluids 10 00131 g015
Figure 16. Metallic pigments and their effect in the paint layer. (a) Metallic pigment Alushine® [31], (b) reflection of a real metallic coating.
Fluids 10 00131 g016
Figure 17. Evolution of the glycerol/water droplet contour and flake orientation during dry wall droplet impact (D = 100 µm, η = 20 mPa·s, σ = 0.063 N/m, U = 6 m/s, θ E = 55°, We = 68.6, Re = 36). (ah) correspond to the situation of time sequence from 0.0–0.35 ms.
Fluids 10 00131 g017
Figure 18. Comparison of flake orientation with different viscous droplets.
Fluids 10 00131 g018
Figure 19. Evolution of droplet contour, film contour, and flake orientation (black ruler corresponds to 50 µm), D = 50 µm, η = 20mPa·s, U = 0.5 m/s, σ = 0.025 N/m, We = 0.51, Re = 1.28, Oh = 0.56.
Fluids 10 00131 g019
Figure 20. Evolution of droplet contour, film contour, and flake orientation, D = 50 µm, η = 20 mPa·s, U = 10 m/s, σ = 0.025 N/m, We = 204, Re = 25.5, Oh = 0.56.
Fluids 10 00131 g020
Figure 21. Evolution of droplet contour, film contour, and flake orientation, D = 50 µm, η = 20 mPa·s, U = 20 m/s, σ = 0.025 N/m, We = 816, Re = 51, Oh = 0.56.
Fluids 10 00131 g021
Figure 22. Effect of surface tension on flake orientation, Hf = 60 µm, D = 50 µm (Gly. is glycerol/water with surface tension st = 0.063 N/m, Coat is the droplet with constant viscosity but similar surface tension to water paint st = 0.025 N/m).
Fluids 10 00131 g022
Figure 23. Effect of viscosity on the flake angle, U = 5 m/s, Hf = 60 µm, D = 50 µm.
Fluids 10 00131 g023
Figure 24. Simulation results of droplet impact using a shear thinning viscosity (U = 5 m/s, D = 50 µm): (a) VOF contours (red: air, blue: liquid); (b) strain rate (1/s) distribution (values that are larger than 7e5 are blanked out); (c) viscosity distribution (value that is larger than 50 mPa·s is blanked out).
Fluids 10 00131 g024
Figure 25. Effect of film thickness on the flake orientation (η = 20 mPa·s, Hf = 30–100 µm, D = 50 µm, U = 10 m/s).
Fluids 10 00131 g025
Figure 26. Correlation of Re* number and final flake orientation Hf = 60 µm.
Fluids 10 00131 g026
Table 1. Drop properties.
LiquidD (µm)ρ (kg/m3)σ (N/m)η (Pa·s)U (m/s)
Glycerol/water280–45012000.0630.021–3
Waterborne paint280–45010250.025Shear thinning1–3
Table 2. Parameters used in simulations.
Droplet diameter D (µm) 24, 50, 100, 300Flake size (µm3)1 × 16 × 16
Droplet velocity U (m/s)0.5–20Flake density (kg/m3)3200
Newtonian viscosity η (Pa·s)0.01–0.08Ratio of flake to droplet l/D 0.053–0.32
Non-Newtonian viscosityShear thinningRe-number, Re = ρUD/η1–100
Surface tension σ (N/m)0.025, 0.063We-number, We = ρU2D/σ3–1200
Liquid density ρ (kg/m3)920, 1020, 1200Oh-number, Oh = η/√(σ D ρ)0.1–2.2
Static contact angle (°)30, 50, 60
Height of film (µm)30–65
Disclaimer/Publisher’s Note: The statements, opinions and data contained in all publications are solely those of the individual author(s) and contributor(s) and not of MDPI and/or the editor(s). MDPI and/or the editor(s) disclaim responsibility for any injury to people or property resulting from any ideas, methods, instructions or products referred to in the content.

