Abstract
Droplet spreading is a fascinating phenomenon. Especially when the droplet spreads, reacts, and dissolves on and into metal substrates. This reactive wetting mainly occurs at high temperatures, with a vast number of applications in industry and material science. It is common to monitor and study the process using a side-view projection of the droplet, focusing on the dynamics and shape of its contact line. However, when the spreading is monitored top-view, rich and non-trivial spatio-temporal patterns are revealed during different stages of the process. These patterns call for a different type of study of the perimeter of the entire droplet. Statistical physics is the natural candidate to perform such tasks, using tools developed for the study of kinetic roughening of advancing interfaces. In this review, we demonstrate the use of these tools, the growth, roughness, and persistence exponents, to study the spreading of mercury droplets on metal-on-glass at room temperature, which by itself is a unique experimental system at this range of temperatures. The universality of the results is discussed in comparison with similar patterns of reactive wetting at high temperatures.
1. Introduction
Droplet spreading is a fascinating phenomenon [1,2,3,4,5,6,7,8]. The dynamics of droplet spreading is traditionally described by the change in time of the droplet radius R(t) and its contact angle θ(t) [9,10,11,12] (See Figure 1). According to the well-known Tanner’s Law [9], R(t) ~ t1/10 and θ(t) ~ t−3/10 for a spherical cap shape droplet. When gravity is non-negligible, Lopez et al. [10] showed that the radius grows slightly faster, as t1/8. Nevertheless, these dynamics laws deal with a side-view projection of the spreading droplet in a classical wetting process. When other mechanisms are involved, e.g., dissolution, compound formation, chemical reaction, and more, the wetting is reactive [13,14,15,16,17,18,19,20,21,22]. No theoretical prediction for the dynamic radius and contact angle is known. In turn, based on many empirical results (see, e.g., [22]), it is commonly believed that in these cases the spreading is much faster, behaving like R(t) ~ t for the radius. Such reactive wetting systems have many applications in industry and material science.
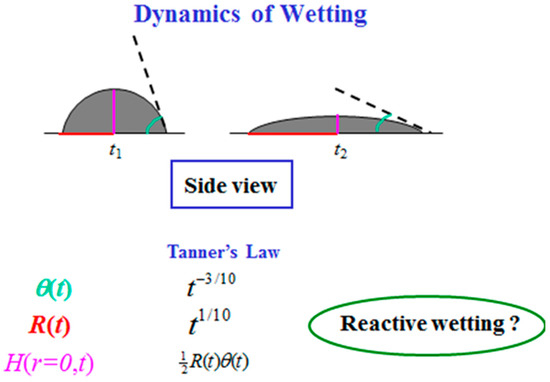
Figure 1.
Wetting dynamics (side view).
In this review, we describe the dynamics of droplet spreading in reactive wetting interfaces, as obtained in a series of papers by our group [23,24,25,26,27,28,29,30,31,32,33,34,35] and references cited therein. Several aspects make our experimental system unique. (A) It is metal on metal-on-glass; (B) The spreading droplet material is mercury [36]. (C) The experiment is performed at room temperature. (D) We follow the top view of the entire perimeter of the advancing droplet.
Most of reactive wetting experiments are metal-on-metal at high temperatures (see e.g., [22]). This requires the heating of the upper metal until it turns into a liquid, which can spread. The only relevant metal that is liquid already in room temperature is the notorious mercury. Hence, it is the only candidate for room temperature reactive-wetting experiments. In addition, from the positive aspect, mercury is used for measurements in medical devices, dental amalgams, and more, and it is important to explore its behavior. In terms of data analysis, our study exploits statistical physics tools to identify the driving mechanisms in the system. The statistical physics point of view enriches the insights into the droplet spreading process. The use of these tools has the advantage of universal applicability of the results to other systems, materials, and experimental conditions, such as high temperatures.
The paper starts with a description of the experimental system and methodology. We then move on to present the two main regimes of the spreading process—bulk spreading and kinetic roughening. The next chapter is devoted to the statistical physics tools, i.e., the scaling exponents, the roughness, growth, and persistence exponents. These enable us to sketch the big picture of the entire process, and to discuss the universality of the results as reflected in high-temperature systems. We then discuss additional topics, such as the kinetic roughening in the QKPZ (Quenched Kardar-Parisi-Zhang) equation and the Ising model, and the effect of temperature on the kinetic roughening exponents.
2. The Experimental System and Methodology
The experimental system is described in detail in [23,24,25,26]. In short, silver (or gold) thin films of various thicknesses (2000–6000 Å) were evaporated, sputtered (or polished) on top of a glass substrate, forming a metal-on-glass substrate. Mercury droplets (100–150 μm diameter) were deposited on this substrate at room temperature (Figure 2). The spreading process was monitored top view using an optical microscope equipped with DIC (Differential Interference Contrast) lenses and a CCD (Charge Coupled Device) camera. The top-view images have been translated into side-view profiles [26], based on the various colors obtained using reflection-DIC light microscopy. The idea is that the object reflects light from different points of its surface with different colors that are indicative of its surface slope at each point of the mercury droplet. The measurements were taken in a diametric cross section of the droplet, parallel to the beam-splitting direction.
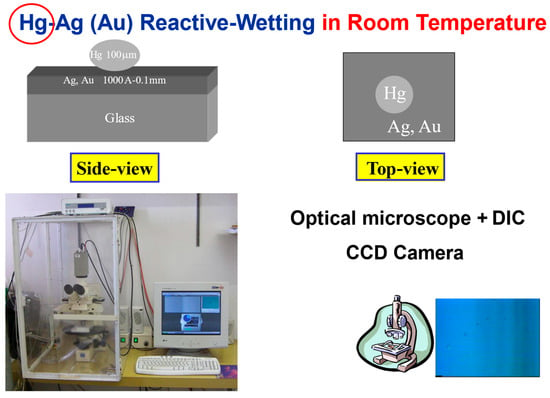
Figure 2.
The experimental system of liquid metal on solid metal-on-glass at room temperature.
Some typical snapshots are shown in Figure 3 for mercury spreading on top of a silver film (4200 Å) on glass, taken at times t = 5, 10, and 15 s after the droplet deposition on the film. These snapshots demonstrate that after several seconds, the droplet perimeter changes from a seemingly smooth curve into a roughened pattern. This reflects the two main regimes in the droplet spreading process, “bulk spreading” and “kinetic roughening”. In short, the transition between these stages is driven by the dissolution of the upper liquid metal into the lower solid one, followed by the capillary effect at the metal-glass interface, as will be described in detail below.
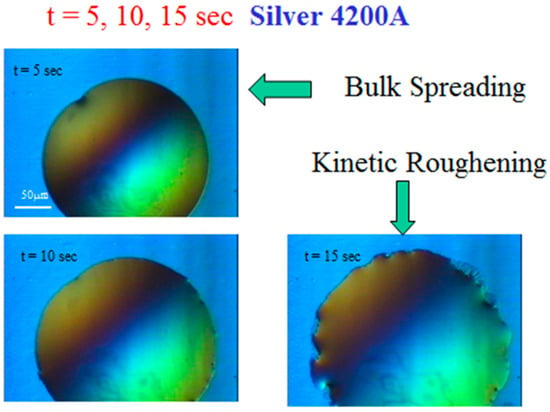
Figure 3.
Typical snapshots of mercury spreading on silver film on glass under the microscope. The transition from bulk spreading to kinetic roughening is demonstrated.
The top-view images are used to reconstruct the side-view profiles of the spreading droplet using the technique described in detail in [26]. This is shown in Figure 4 for the same system, where the vertical scale is stretched in the main graph in order to demonstrate the spherical cap shape of the advancing droplet. The bottom sketch is the real scale. Such reconstructed profiles are used to study the spreading kinetics.
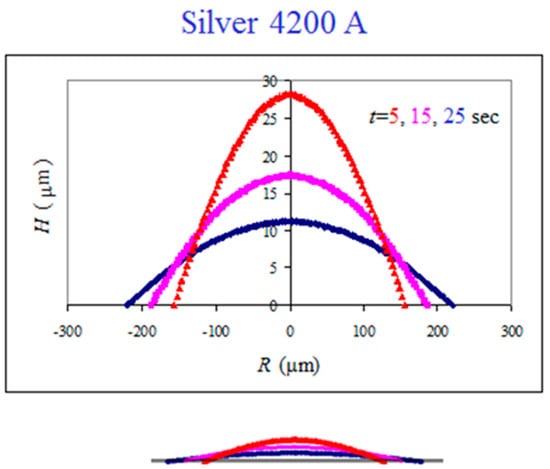
Figure 4.
Side-view reconstruction of the droplet shape in the spreading dynamics of mercury droplet on silver thin film. The bottom sketch is the real scale.
3. The Spreading Process
Using the reconstructed side-view shape profiles, one can follow the details of the spreading process of the reactive metal droplet on the metal-on-glass [30,31]. This was found to consist of several consecutive sub-steps (Figure 5) in the “bulk spreading” regime prior to the “kinetic roughening” regime, with a fast flow region in between.
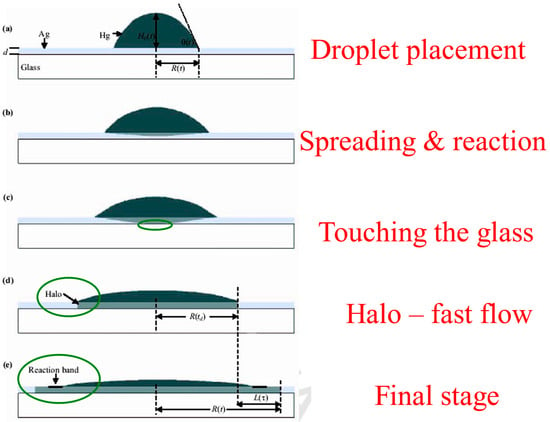
Figure 5.
Schematic sequence of mercury droplet spreading on thin silver films at room temperature. (a) Droplet placement on the film. (b) Droplet bulk spreading and reacting with the underlying substrate. (c) Mercury touching the glass. (d) Start of the fast-flow regime, halo propagation. (e) Formation of a reaction band.
After placing the mercury droplet on the thin silver layer (a), the droplet starts to spread and react (or dissolve) with the film (b). This “bulk spreading regime” is mainly controlled by chemical reaction and diffusion, both on top and inside the silver film. After crossing the entire film downwards, the mercury material touches the underlying glass substrate (c). This is a critical event, as the film-glass interface enters the game as a dominant player. At this very moment, a new spreading regime, which we call the “fast-flow regime,” occurs abruptly. A new and thin front (500 Å in height), which optically looks like a halo, detaches from the bulk (d) and flows ahead throughout the entire film (e) with a much higher velocity (about two orders of magnitude faster). This is since there is effectively no energy barrier at the Hg-glass interface, and the fast flow at this interface can easily lower the entire system’s energy. The fast-flow dynamics give rise to the formation of a reaction band on top of the mercury film surface (e), advancing with the average velocity of the bulk propagation regime, and containing various chemical compositions and intermetallic phases [30,31]. This reaction band is where the “kinetic roughening” regime takes place. This will be discussed in detail in the next section.
3.1. Bulk Spreading
In Figure 6, we show our empirical results for the parameters of the bulk spreading, the radius R(t) and the angle θ(t), for the data of Figure 4. Initially, the droplet radius grows linearly in time, R(t) ~ t, with a constant velocity, in this case 2.1 m/s, and the angle of contact θ(t) decreases continuously. At about t = 15 s, θ(t) demonstrates a sudden step in its decreasing trend. This is exactly the time when the mercury crosses the entire silver layer for the first time and touches the underlying glass (Figure 5c). We define this characteristic time as td, where d is the thickness of the Ag layer. Hence, the step in the behavior of θ(t) at td is strongly thickness dependent. On the other hand, the velocity of the bulk propagation was found to be approximately the same for all Ag thicknesses around 4200 Å (from 2000 up to 6000 Å), having the average value of 2.5 ± 0.4 m/s. It is reasonable to assume that this velocity is material dependent, depending on the reaction of the mercury droplet with the silver surface. This surface velocity is much higher (about two orders of magnitude) than the mercury-silver reaction rate inside the silver film, which is attenuated by diffusion [30]. The constant velocity remains approximately the same also after td, with a very slight variation at td, the time of the fast flow burst. The halo velocity at this regime is also constant, but its specific value is expectedly to be thickness dependent. It is also important to point out that td is also the time where the kinetic roughening of the reaction band starts to show up (Figure 5e).
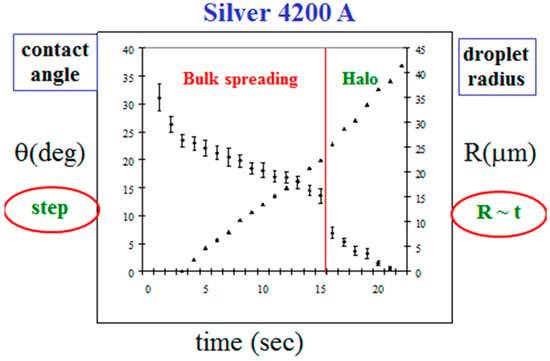
Figure 6.
The dynamics of the droplet radius (right) and contact angle (left) as a function of time, in the bulk spreading regime.
The bottom line is that the underlying glass plays a significant role in the transition of the system behavior from bulk spreading to kinetic roughening. Hence, the spreading of metal liquid on metal-on-glass, which is one of the features of our system, is quite different from the spreading of metal on metal. The glass is more than just a platform.
3.2. Kinetic Roughening
In nonequilibrium surface and interface growth processes, kinetic roughening is the statistical physics framework to follow the stochastic dynamics in the processes, which induce scaling laws for the advancing interfaces with respect to time and length scales [37,38,39,40,41,42,43,44,45,46,47]. It is applicable to a large variety of systems, such as tumor growth [48,49], bacterial and colonies [50,51,52], biological systems [53], reaction-diffusion fronts [54], urban growth [55], urban skyline [56], forest fires [57], slow combustion of paper [58], drying wet paper [59], paper wetting [60], magnetic flux fronts [61], viscous fingering [62] and more [63,64]. Some recent related papers deal with kinetic roughening in thin film spreading [65,66], spreading fronts of wetting droplets [67,68], and contact line dynamics [69,70].
In Figure 7, we illustrate the top-view of an advancing interface, described by a function h(x,t), for the horizontal “height” of the interface at position x at time t. The kinetic roughening properties of an interface of length L0 are defined based on the fluctuations or the second moment of h(x,t). This width function, W(L,t), is defined as
where the average is over all x values between 0 and the minimal length scale in the system (e.g., lattice unit) up to half of the system size L0/2. Family-Vicsek [44] assumed that the width behavior obeys a scaling relation from which follows a dichotomic behavior,
with and being the roughness and growth exponents, respectively, and t0 is given in terms of the system size L0 as
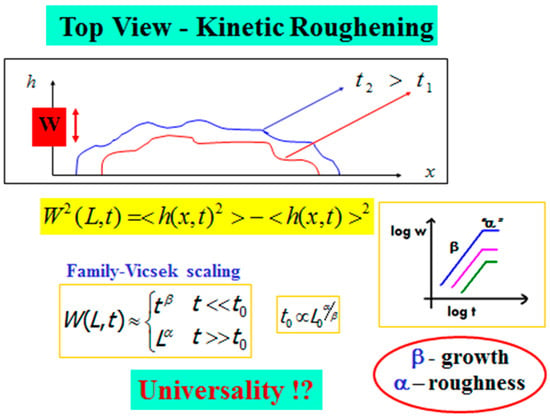
Figure 7.
Kinetic roughening—The general scheme, Family-Vicsek scaling, and the growth and roughness scaling exponents.
At the beginning of the process, the interface width increases as . This continues up to time t0, when the interface width saturates. At this saturation regime, the width behaves as , and one can extract the interface roughness defined by the roughness exponent α, which is related to the interface’s autocorrelation. The growth exponent describes the temporal dynamics of the interface, while the roughness exponent , which is measured after the interface width reaches saturation, describes the geometric shape of its final stage. Based on these two exponents, one can classify the system into a certain universality class [40,41,42,43] that may shed light on the fundamental mechanisms in the process.
4. Scaling Exponents
4.1. The Roughness and Growth Exponents
In Figure 8, we show a typical set of kinetic roughening scaling exponents, obtained for a 2000 Å thick silver film evaporated on top of glass. The results are for the growth exponent and for the roughness exponent. However, the experiments reveal another interesting characteristic of the roughness exponent. Plotting this exponent as a function of distance (according to Equation (2)), one obtains a crossover behavior from at short distances to around at longer distances. This calls for a deeper look into the meaning of the roughness exponent, which reflects the inner correlations of the advancing interface [28,29].
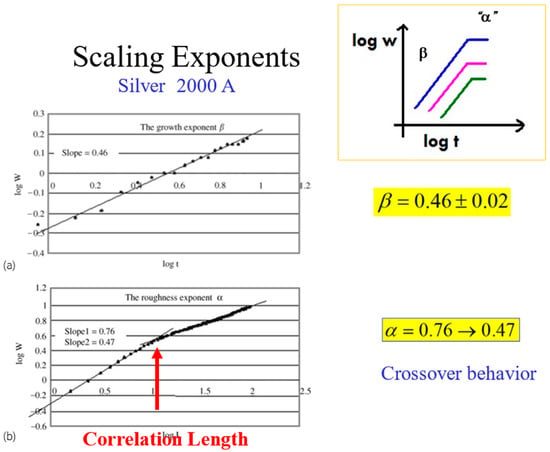
Figure 8.
The scaling exponents and and the crossover behavior at the correlation length.
When , there is a strong correlation between nearby interface points that tend to progress in a similar manner, with for a smooth interface. describes a lack of correlation (random walk), where every point on the interface moves randomly and independently of the surroundings. describes anticorrelations between the points. Hence, the crossover behavior of α in Figure 8 from to 0.47, represents a change of the correlation along the interface, from a relatively strong correlation at short distances to a complete loss of correlation at long distances. This is quite intuitive. The crossover occurs at some typical distance, which is termed the “correlation length” of the interface.
This correlation length can also be extracted from temporal width fluctuations of the growing interface in its growth regime. The fluctuating behavior results from competing mechanisms in the growth process, normal growth and the surface tension. This is discussed in detail in [28,29].
Regarding the classification of the system into a specific universality class, a common practice in statistical physics, a possibly relevant universality class is , valid for isotropic systems [40,41]. In Figure 9, we show some more examples of sets of exponents, obtained for a variety of thin films in various thicknesses at room temperature, which show that this is not the case. While the roughness exponent seems to be always around 0.8 (at distances shorter than the correlation length) for all cases, the growth exponent is significantly different in each system.
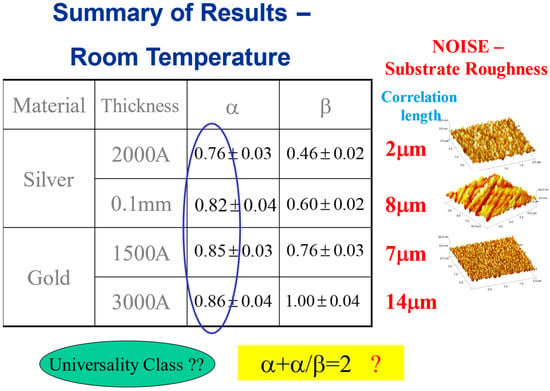
Figure 9.
Scaling exponents at room temperature, for various materials and thicknesses. The corresponding correlation lengths and preparation techniques are shown on the right.
This can be attributed to the very different substrate roughness (prior to the mercury droplet deposition) resulting from different thicknesses and preparation conditions. It is also reflected in the different correlation lengths for each case, as shown next to the table. It is assumed that these different parameters affect the advancing interface growth process (hence the different growth exponent ), while the roughness exponent at the saturation regime of the process is more universal.
4.2. The Persistence Exponent
The microscopic dynamics of the interface can also be described by another measure, the persistence probability, defined as the probability that a stochastic variable will never cross some reference level within a time interval t [47]. In our system, the stochastic variable is the location of the interface point(s) along the interface line, and the reference level is the horizontal height h(x,t) at the point location x at some initial time t0 (see Figure 10). It is then averaged over all points in a computational method which is described in detail in Ref. [34]. This measure considers local microscopic fluctuations and is expected to reflect an additional statistical physics view on the dynamics of the interface, complementing the more traditional growth exponent.
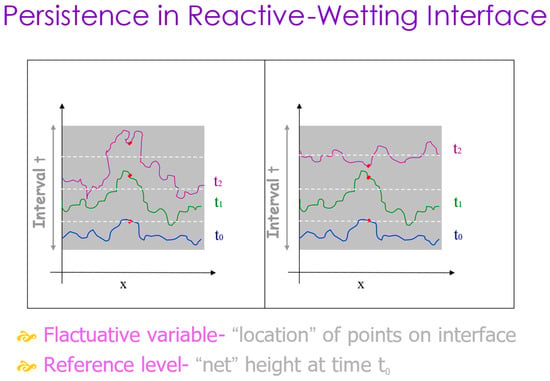
Figure 10.
Persistence in reactive-wetting interfaces. The white dotted lines represent three consecutive times. The red dot is persistent on the left frame but not on the right one.
The persistence probability was shown to obey a power law decay with a persistence exponent θ [47]
In linear systems, there is a simple relation between the two temporal measures, the growth and the persistence exponents [47]
Hence, in linear systems one can either measure the persistence exponent directly or indirectly using the growth exponent
What happens in a nonlinear system like reactive-wetting or droplet spreading? In [34], we report the direct persistence exponent results of the mercury droplet (150 μm) spreading on silver (4000 Å)-on-glass at room temperature. We were able to identify several distinct kinetic time regimes in this process. In the first one, while the interface (i.e., the contact line) is moving but its width is not yet growing, the persistence exponent is = 0.55 ± 0.05, which is typical for a random, noisy behavior. In the second regime, there is an effective growth of the interface width with a growth exponent = 0.67 ± 0.06, followed by a final regime of saturation, according to the Family-Vicsek description of interface growth. The persistence exponent in this regime is = 0.37 ± 0.05, which indicates that the hyper-scaling relation = 1 − seems to hold even for this nonlinear experimental system. The roughness exponent α, calculated at the end of the process according to Equation (2), was found to be 0.83 ± 0.008 [32], in agreement with previous studies of this system [24,28,29].
5. The Big Picture
Using this insight, we can now look at the “big picture” of the spreading process in our system. In Figure 11, we summarize the three sub-regimes in the kinetic roughening process of the interface: noise (light green), non-linear growth (purple), and surface tension relaxation (light blue). The upper curve shows the width of the interface W(t) as a function of time, starting with a region of noisy constant width followed by regions of growth (with the growth exponent ) and then saturation (where the roughness exponent is measured) as in the inset of Figure 7 and Figure 8 above. The lower curve is the independent calculation of the complementary persistence curve, showing the random walk exponent −0.5 for the initial noisy region. The detailed calculation of the persistence exponent in the other two regions requires a shift of the initial time, as is explained in detail in Ref. [34].
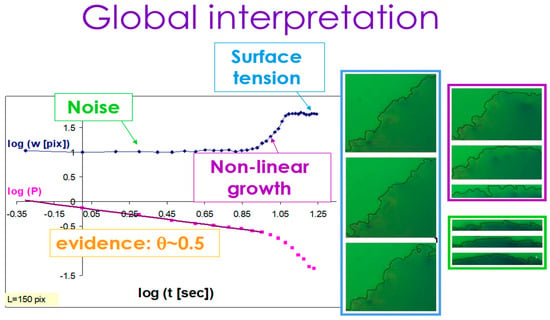
Figure 11.
Noise, non-linear growth, and surface tension relaxation in the global kinetic roughening process.
The snapshots presented on the right side of the figure are examples of the time evolution of the interface at each of the three sub-regions. One can see the significant increase in the width in the purple growth region, compared with the constant (in time) width in both the preceding noise region (light green) and the succeeding surface tension relaxation/saturation region (light blue).
6. Universality—High Temperatures
Most of the spreading results in high-temperature reactive-wetting systems were obtained using a side view of the spreading droplet (see, e.g., [22]). One of the exceptions is a series of top-view experiments performed by Singler’s group at Binghamton [17,18,33]. They performed experiments of Sn droplets spreading on a 1 μm coating of Au on Cu of thickness 12 μm, deposited on glass, at several high temperatures. For detailed information on the experimental setup, see Yin et al. [17].
The kinetic roughening patterns at high temperatures are shown in Figure 12. They are quite similar to the room temperature patterns presented above. Analyzing the data in the same methodology and plotting the interface width W as a function of time, one obtains the three typical regimes of the interface dynamics [33]. It should be mentioned that in the high temperature system, there is an additional early and extremely short time regime in which the liquid spreads with no discernible morphological or chemical change of the interface. This very early regime is undetectable in the room temperature reactive-wetting experiment [33,34].
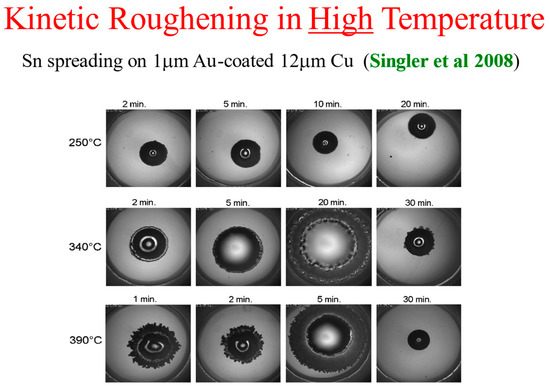
Figure 12.
Kinetic roughening at high temperature [17].
The persistence concept allows one to better understand and clearly define these regimes. The dimensionless comparison of the three regions in the room temperature Hg–Ag system and the high temperature Sn–Au/Cu system shown in Figure 13 speaks for itself.
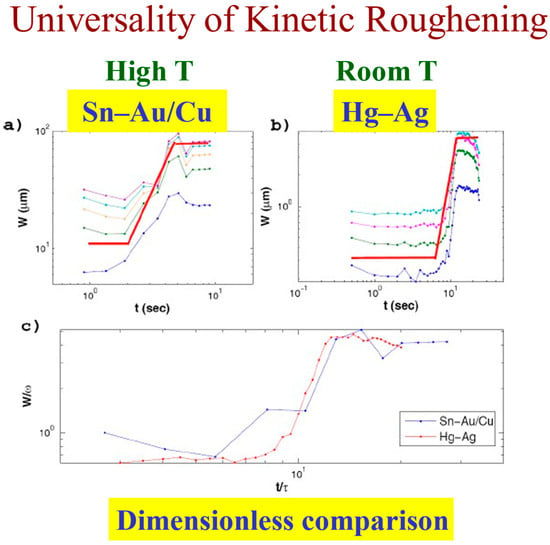
Figure 13.
Universality of kinetic roughening: The interface width as a function of time in high temperature (a) vs. room temperature (b). A dimensionless comparison (c).
This comparison allows one to compare quantitatively the similarity between reactive wetting experiments of different materials in various thicknesses, as reflected by the kinetic roughening exponents and (Figure 14). One can see that the growth exponent of the system under study, Sn–Au/Cu, is very close to the growth exponent of Hg on thick Ag (second and fourth lines). The value of the roughness exponent α is usually around 0.8 with variation that can be caused by other effects, like overhangs [32]. Therefore, it seems that the Sn–Au/Cu belongs to the same universality class as the Hg–Ag system. According to the value of the exponents, we conjecture that this could be the QKPZ universality class whose exponents are = 3/5 and = 3/4 [40]. This conjecture should be confirmed by additional experiments. The Hg–Au system belongs to a different universality class; however, it obeys the same hyper-scaling relation, as discussed in detail in [25].
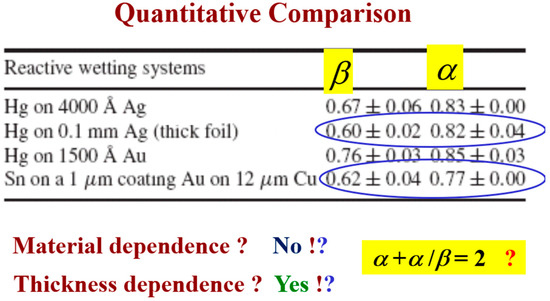
Figure 14.
Room temperature (first three lines) vs. high temperature (last line): A quantitative comparison of the scaling exponents [33].
7. Kinetic Roughening, the QKPZ Equation, and the Ising Model
The natural question to be asked is whether there exists a well-defined model to describe the interface dynamics of the reactive-wetting system. In [32] we investigated two candidates for this task, the QKPZ equation and the Ising chain model at zero temperature. The QKPZ is an explicit equation for describing advancing interfaces, while a given configuration of the spins in an Ising ferromagnetic 1d chain can be converted into a landscape, i.e., can be thought of as an interface. The QKPZ equation is the quenched disorder version of the well-known KPZ (Kardar-Parisi-Zhang) equation [45]. It was studied in the context of its kinetic roughening exponents, but not for its persistence. The persistence exponent of the Ising model has been calculated, but the kinetic roughening exponents of an Ising chain were not. For more details, see Ref. [32].
In [32], we calculated for each model its persistence, growth, and roughness exponents, and compared them with the available experimental results at room temperature. The results are given in Table 1. We found that neither of these two models gives a complete description of the dynamics of the experimental reactive-wetting system, but each one of them describes quantitatively some aspects of the interface growth process.

Table 1.
The persistence, growth and roughness exponents for reactive-wetting experiments, QKPZ and Ising simulations.
We suggest that the behavior of our reactive-wetting system is dichotomic. While kinetic roughening has to do with the collective behavior of the advancing interface (allowing e.g., for estimation of the lateral correlation length [28,29]), the microscopic persistence measure is much more sensitive [47]. In the macroscopic scale, reflected by the growth exponent, the behavior of the system is QKPZ-like, but in the microscopic scale, reflected by the persistence exponent, the system shows Ising-like behavior. This might be supported by the observation that local surface tension resembles the neighboring interactions in the Ising chain, which are dominant for relatively small scales. In larger scales, however, the non-linear growth of the interface is more profound, due to the chemical interaction with the substrate. This growth is better described by the QKPZ equation. These conjectures should be further substantiated.
The interpretation of the results for the roughness exponent [32] is based on the observation that in the final stages of the spreading process, the interface propagation is not necessarily perpendicular only. This results in an overhangs geometry of the advancing interface, which was shown to affect the value of the roughness exponent.
8. Effect of Temperature on Kinetic Roughening Exponents
So far, we have described spreading experiments around room temperature. A reasonable question is what is the effect of slight temperature variations around this temperature. To study experimentally such a possible effect, we have used a heating stage which allowed us to change the temperature in a controlled manner in the range −15 °C < T < 25 °C. Higher temperatures are more difficult to handle with respect to the mercury vapors. The spreading of a mercury droplet (~150 μm) on a silver substrate (4000 Å) at these temperatures was monitored using the optical microscope as in the room temperature experiments. The full details can be found in [35].
First, we studied the temperature effect on the wetting dynamics (droplet radius and velocity). We found that for all studied temperatures, the spreading radius R(t) grows linearly with time, R(t) ~ t, with the specific velocity value (the proportionality constant) depending on the specific temperature. We also studied the temperature effect on the kinetic roughening properties of the advancing interface (growth and roughness exponents). Our results [35] are that the growth exponent β increases with temperature while the roughness exponent α is relatively constant for all studied temperatures, with a value around 0.8. In the literature, there are a variety of dependencies of kinetic roughening exponents on temperature [35]. Our results show that it depends on the specific system.
In sum, the temperature does play a role in the behavior of reactive-wetting systems, not only in very high temperatures, but also around room temperature.
9. Summary
The spreading of a droplet on metal-on-glass is highly non-linear and very sensitive to minor fluctuations. It’s extremely difficult to construct a comprehensive model that fully describes it. Alternatively, one can look at the top-view data of the dynamics and geometry of the horizontal morphology of the advancing triple line. A statistical physics analysis of the common kinetic roughening properties of similar systems can yield universal insights (Figure 15), allowing for a better understanding of the dynamical aspects of the process.
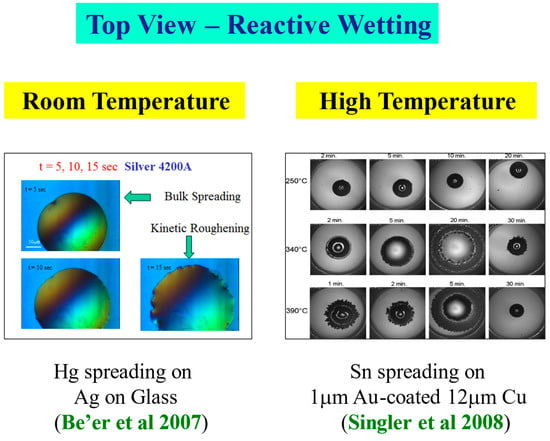
Figure 15.
Room temperature [30] vs. high temperature [17]: A qualitative comparison.
Funding
This review paper received no external funding.
Acknowledgments
This paper is a written summary of numerous talks presented on this subject in international conferences and workshops. I am indebted to my former students Avraham Be’er, Inbal Hecht, Yael Efraim, Meital Harel, and late Tal Grynpas-Ya’akov for their immense contribution to this project throughout the years. I am highly thankful to my colleagues Yossi Lereah, Aviad Frydman, and of course to Timothy Singler and his group at Binghamton University.
Conflicts of Interest
The authors declare no conflict of interest.
References
- de Gennes, P.G. Wetting: Statics and Dynamics. Rev. Mod. Phys. 1985, 57, 827. [Google Scholar] [CrossRef]
- Leger, L.; Joanny, J.F. Liquid Spreading. Rep. Prog. Phys. 1992, 55, 431. [Google Scholar] [CrossRef]
- Oron, A.; Davis, S.H.; Bankoff, S.G. Long-Scale Evolution of Thin Liquid Films. Rev. Mod. Phys. 1997, 69, 931. [Google Scholar] [CrossRef]
- de Gennes, P.G. The Dynamics of Reactive Wetting on Solid Surfaces. Physica A 1998, 249, 196. [Google Scholar] [CrossRef]
- Bonn, D.; Eggers, J.; Indekeu, J.; Meunier, J.; Rolley, E. Wetting and Spreading. Rev. Mod. Phys. 2009, 81, 739. [Google Scholar] [CrossRef]
- Tadmor, R. Approaches in Wetting Phenomena. Soft Matter 2011, 7, 1577. [Google Scholar] [CrossRef]
- Karim, A.M. A Review of Physics of Moving Contact Line Dynamics Models and its Applications in Interfacial Science. J. Appl. Phys. 2022, 132, 080701. [Google Scholar] [CrossRef]
- Karim, A.M.; Suszynski, W.J. Physics of Dynamic Contact Line: Hydrodynamics Theory versus Molecular Kinetic Theory. Fluids 2022, 7, 318. [Google Scholar] [CrossRef]
- Tanner, L.H. The Spreading of Silicone Oil Drops on Horizontal Surfaces. J. Phys. D 1979, 12, 1473. [Google Scholar] [CrossRef]
- Lopez, J.; Miller, C.A.; Ruckenstein, E. Spreading Kinetics of Liquid Drops on Solids. J. Colloid Interface Sci. 1976, 56, 460. [Google Scholar] [CrossRef]
- Blake, T.D. Dynamic Contact Angles and Wetting Kinetics in Wettability; Berg, J.C., Ed.; Marcel Dekker: New York, NY, USA, 1993. [Google Scholar]
- Davidovitch, B.; Moro, E.; Stone, H.A. Spreading of Viscous Fluid Drops on a Solid Substrate Assisted by Thermal Fluctuations. Phys. Rev. Lett. 2005, 95, 244505. [Google Scholar] [CrossRef] [PubMed]
- Landry, K.; Eustathopoulos, N. Dynamics of Wetting in Reactive Metal/Ceramic Systems: Linear Spreading. Acta Mater. 1996, 44, 3923. [Google Scholar] [CrossRef]
- Eustathopoulos, N. Dynamics of Wetting in Reactive Metal/Ceramic Systems. Acta Mater. 1998, 46, 2319. [Google Scholar] [CrossRef]
- Eustathopoulos, N.; Nicholas, M.G.; Drevet, B. Wettability at High Temperatures; Pergamon: New York, NY, USA, 1999. [Google Scholar]
- Kumar, G.; Prabhu, K.N. Review of Non-Reactive and Reactive Wetting of Liquids on Surfaces. Adv. Colloid Interface Sci. 2007, 133, 61. [Google Scholar] [CrossRef]
- Yin, L.; Chauhan, A.; Singler, T.J. Reactive Wetting in Metal/Metal systems: Dissolutive versus Compound-Forming Systems. Mater. Sci. Eng. A 2008, 495, 80. [Google Scholar] [CrossRef]
- Singler, T.J.; Su, S.; Yin, L.; Murray, B.T. Modeling and Experiments in Dissolutive Wetting: A Review. J. Mater. Sci. 2012, 47, 8261. [Google Scholar] [CrossRef]
- Bormashenko, E. Wetting of Real Surfaces; de Gruyter: Berlin, Germany, 2013. [Google Scholar]
- Bormashenko, E. Apparent contact angles for reactive wetting of smooth, rough, and heterogeneous surfaces calculated from the variational principles. J. Colloid Interface Sci. 2019, 537, 597. [Google Scholar] [CrossRef]
- Lin, Q.; Xie, K.; Sui, R.; Mu, D.; Cao, R.; Chang, J.; Qiu, F. Kinetic analysis of wetting and spreading at high temperatures: A review. Adv. Colloid Interface Sci. 2022, 305, 102698. [Google Scholar] [CrossRef] [PubMed]
- Sobczak, N.; Agathopoulos, S. (Eds.) HTC 2022: Book of Abstracts of the 10th International Conference on High Temperature Capillarity, Krakow, Poland, 12–16 September 2022; Polish Foundrymen’s Association: Kraków, Poland, 2022; ISBN 978-83-963247-1-9. [Google Scholar]
- Be’er, A.; Lereah, Y.; Taitelbaum, H. The Dynamics and Geometry of Solid-Liquid Reaction Interface. Physica A 2000, 285, 156. [Google Scholar] [CrossRef]
- Be’er, A.; Lereah, Y.; Hecht, I.; Taitelbaum, H. The Roughness and Growth of a Silver-Mercury Reaction Interface. Physica A 2001, 302, 297. [Google Scholar] [CrossRef]
- Be’er, A.; Lereah, Y.; Frydman, A.; Taitelbaum, H. Spreading of a Mercury Droplet on Thin Gold Films. Physica A 2002, 314, 325. [Google Scholar] [CrossRef]
- Be’er, A.; Lereah, Y. Time-resolved, three-dimensional quantitative microscopy of a droplet spreading on solid substrates. J. Microsc. 2002, 208, 148. [Google Scholar] [CrossRef]
- Hecht, I.; Taitelbaum, H. Roughness and Growth in a Continuous Fluid Invasion Model. Phys. Rev. E 2004, 70, 046307. [Google Scholar] [CrossRef]
- Be’er, A.; Hecht, I.; Taitelbaum, H. Interface Roughening Dynamics: Temporal Width Fluctuations and the Correlation Length. Phys. Rev. E 2005, 72, 031606. [Google Scholar] [CrossRef]
- Hecht, I.; Be’er, A.; Taitelbaum, H. Single Interface Growth: Fluctuations and the Correlation Length. Fluct. Noise Lett. 2005, 5, L319. [Google Scholar] [CrossRef]
- Be’er, A.; Lereah, Y.; Frydman, A.; Taitelbaum, H. Spreading of Mercury Droplets on Thin Silver Films at Room Temperature. Phys. Rev. E 2007, 75, 051601. [Google Scholar] [CrossRef] [PubMed]
- Be’er, A.; Lereah, Y.; Taitelbaum, H. Reactive-Wetting of Hg-Ag System at Room Temperature. Mater. Sci. Eng. A 2008, 495, 102. [Google Scholar] [CrossRef]
- Efraim, Y.; Taitelbaum, H. Can Ising model and/or QKPZ equation properly describe reactive-wetting interface dynamics? Cent. Eur. J. Phys. 2009, 7, 503. [Google Scholar] [CrossRef]
- Yin, L.; Murray, B.T.; Su, S.; Sun, Y.; Efraim, Y.; Taitelbaum, H.; Singler, T.J. Reactive Wetting in Metal-Metal Systems. J. Phys. Condens. Matter 2009, 21, 464130. [Google Scholar] [CrossRef]
- Efraim, Y.; Taitelbaum, H. Persistence in Reactive-Wetting Interfaces. Phys. Rev. E 2011, 84, 050602. [Google Scholar] [CrossRef]
- Harel, M.; Taitelbaum, H. Effect of Temperature on the Dynamics and Geometry of Reacting-Wetting Interfaces around Room Temperature. Phys. Rev. E 2017, 96, 062801. [Google Scholar] [CrossRef] [PubMed]
- Barlow, M.; Planting, P.J. The Wetting of Metal Surfaces by Liquid Mercury. Z. Met. 1969, 60, 10. [Google Scholar] [CrossRef]
- Vicsek, T. Fractal Growth Phenomena, 2nd ed.; World Scientific: Singapore, 1992. [Google Scholar]
- Bunde, A.; Havlin, S. Fractals in Science, 2nd ed.; Springer: Berlin/Heidelberg, Germany, 1994. [Google Scholar]
- Bunde, A.; Havlin, S. Fractals and Disordered Systems, 2nd ed.; Springer: Berlin/Heidelberg, Germany, 1996. [Google Scholar]
- Barabasi, A.L.; Stanley, H.E. Fractal Concepts in Surface Growth; Cambridge University Press: Cambridge, UK, 1995. [Google Scholar]
- Meakin, P. Fractals, Scaling, and Growth Far from Equilibrium; Cambridge University Press: Cambridge, UK, 1998. [Google Scholar]
- Halpin-Healy, T.; Zhang, Y.-C. Kinetic Roughening Phenomena, Stochastic Growth, Directed Polymers and all that. Aspects of Multidisciplinary Statistical Mechanics. Phys. Rep. 1995, 254, 215. [Google Scholar] [CrossRef]
- Alava, M.; Dube, M.; Rost, M. Imbibition in Disordered Media. Adv. Phys. 2004, 53, 83. [Google Scholar] [CrossRef]
- Family, F.; Vicsek, T. Scaling of the Active Zone in the Eden Process on Percolation Networks and the Ballistic Deposition Model. J. Phys. A 1985, 18, L75. [Google Scholar] [CrossRef]
- Kardar, M.; Parisi, G.; Zhang, Y.-C. Dynamic Scaling of Growing Interfaces. Phys. Rev. Lett. 1986, 56, 889. [Google Scholar] [CrossRef]
- Hentschel, H.G.E.; Family, F. Scaling in Open Dissipative Systems. Phys. Rev. Lett. 1991, 66, 1982. [Google Scholar] [CrossRef]
- Majumdar, S.N. Persistence in Nonequilibrium Systems. Curr. Sci. 1999, 77, 370. [Google Scholar] [CrossRef]
- Brú, A.; Pastor, J.M.; Fernaud, I.; Brú, I.; Melle, S.; Berenguer, C. Super-Rough Dynamics on Tumor Growth. Phys. Rev. Lett. 1998, 81, 4008. [Google Scholar] [CrossRef]
- Khain, E.; Sander, L.M. Dynamics and Pattern Formation in Invasive Tumor Growth. Phys. Rev. Lett. 2006, 96, 188103. [Google Scholar] [CrossRef]
- Ben-Jacob, E.; Schochet, O.; Tenenbaum, A.; Cohen, I.; Czirok, A.; Vicsek, T. Generic Modelling of Cooperative Growth Patterns in Bacterial Colonies. Nature 1994, 368, 46. [Google Scholar] [CrossRef] [PubMed]
- Huergo, M.A.C.; Pasquale, M.A.; González, P.H.; Bolzán, A.E.; Arvia, A.J. Growth Dynamics of Cancer Cell Colonies and their Comparison with Noncancerous Cells. Phys. Rev. E 2012, 85, 011918. [Google Scholar] [CrossRef] [PubMed]
- Santalla, S.N.; Rodríguez-Laguna, J.; Abad, J.P.; Marín, I.; Espinosa, M.M.; Muñoz-García, J.; Vázquez, L.; Cuerno, R. Nonuniversality of Front Fluctuations for Compact Colonies of Nonmotile Bacteria. Phys. Rev. E 2018, 98, 012407. [Google Scholar] [CrossRef] [PubMed]
- Santalla, S.N.; Ferreira, S.C. Eden Model with Nonlocal Growth Rules and Kinetic Roughening in Biological Systems. Phys. Rev. E 2018, 98, 022405. [Google Scholar] [CrossRef]
- Barreales, B.G.; Meléndez, J.J.; Cuerno, R.; Ruiz-Lorenzo, J.J. Kardar–Parisi–Zhang universality class for the critical dynamics of reaction–diffusion fronts. J. Stat. Mech. Theor. Exp. 2020, 2020, 023203. [Google Scholar] [CrossRef]
- Makse, H.A.; Havlin, S.; Stanley, H.E. Modelling urban growth patterns. Nature 1995, 377, 608. [Google Scholar] [CrossRef]
- Najem, S.; Krayem, A.; Ala-Nissila, T.; Grant, M. Kinetic Roughening of the Urban Skyline. Phys. Rev. E 2020, 101, 050301. [Google Scholar] [CrossRef]
- Maunuksela, J.; Myllys, M.; Timonen, J.; Alava, M.J.; Ala-Nissila, T. Kardar–Parisi–Zhang Scaling in Kinetic Roughening of Fire Fronts. Physica A 1999, 266, 372–376. [Google Scholar] [CrossRef]
- Maunuksela, J.; Myllys, M.; Kähkönen, O.-P.; Timonen, J.; Provatas, N.; Alava, M.J.; Ala-Nissila, T. Kinetic Roughening in Slow Combustion of Paper. Phys. Rev. Lett. 1997, 79, 1515. [Google Scholar] [CrossRef]
- Balankin, A.S.; Morales, D.; Susarrey, O.; Samayoa, D.; Trinidad, J.M.; Marquez, J.; García, R. Self-Similar Roughening of Drying Wet paper. Phys. Rev. E 2006, 73, 065105. [Google Scholar] [CrossRef][Green Version]
- Balankin, A.S.; Paredes, R.G.; Susarrey, O.; Morales, D.; Vacio, F.C. Kinetic Roughening and Pinning of Two Coupled Interfaces in Disordered Media. Phys. Rev. Lett. 2006, 96, 056101. [Google Scholar] [CrossRef] [PubMed]
- Barness, D.; Efraim, Y.; Taitelbaum, H.; Sinvani, M.; Shaulov, A.; Yeshurun, Y. Kinetic Roughening of Magnetic Flux Fronts in Bi2Sr2CaCu2O8+δ Crystals with Columnar Defects. Phys. Rev. B 2012, 85, 174516. [Google Scholar] [CrossRef]
- Hasegawa, K.; Kishimoto, Y. Fingering Instability of Binary Droplets on Oil Pool. Fluids 2023, 8, 138. [Google Scholar] [CrossRef]
- Santalla, S.; Rodríguez-Laguna, J.; Cuerno, R. Circular Kardar-Parisi-Zhang Equation as an Inflating, Self-Avoiding Ring Polymer. Phys. Rev. E 2014, 89, 010401. [Google Scholar] [CrossRef]
- Barreales, B.G.; Meléndez, J.J.; Cuerno, R.; Ruiz-Lorenzo, J.J. Large-Scale Kinetic Roughening Behavior of Coffee-Ring Fronts. Phys. Rev. E 2022, 106, 044801. [Google Scholar] [CrossRef]
- Harel, M.; Taitelbaum, H. Non-Universal Dynamic Exponents for Thin-Film Spreading. Europhys. Lett. 2018, 122, 26002. [Google Scholar] [CrossRef]
- Harel, M.; Taitelbaum, H. Non-Monotonic Dynamics of Thin Film Spreading. Eur. Phys. J. E 2021, 44, 69. [Google Scholar] [CrossRef] [PubMed]
- Marcos, J.M.; Rodríguez-López, P.; Meléndez, J.J.; Cuerno, R.; Ruiz-Lorenzo, J.J. Spreading Fronts of Wetting Liquid Droplets: Microscopic Simulations and Universal Fluctuations. Phys. Rev. E 2022, 105, 054801. [Google Scholar] [CrossRef]
- Marcos, J.M.; Meléndez, J.J.; Cuerno, R.; Ruiz-Lorenzo, J.J. Microscopic Fluctuations in the Spreading Fronts of Circular Wetting Liquid Droplets. Phys. Rev. E 2025, 111, 045504. [Google Scholar] [CrossRef]
- Iliev, S.; Pesheva, N.; Iliev, P. Dependence of the Contact Line Roughness Exponent on the Contact Angle on Substrates with Dilute Mesa Defects: Numerical Study. Eur. Phys. J. E 2022, 45, 66. [Google Scholar] [CrossRef]
- Iliev, S.; Pesheva, N.; Iliev, P. Roughness Exponents of the Liquid/Vapor/Solid Contact Line on Surfaces with Dilute Random Gaussian Defects: Numerical Study. Eur. Phys. J. E 2025, 48, 32. [Google Scholar] [CrossRef] [PubMed]
Disclaimer/Publisher’s Note: The statements, opinions and data contained in all publications are solely those of the individual author(s) and contributor(s) and not of MDPI and/or the editor(s). MDPI and/or the editor(s) disclaim responsibility for any injury to people or property resulting from any ideas, methods, instructions or products referred to in the content. |
© 2025 by the author. Licensee MDPI, Basel, Switzerland. This article is an open access article distributed under the terms and conditions of the Creative Commons Attribution (CC BY) license (https://creativecommons.org/licenses/by/4.0/).