Abstract
Partial blockages in pressurised pipe systems present significant challenges for precise detection, characterisation, and ongoing monitoring. Transient test-based techniques, which utilise sharp but small pressure waves, have shown considerable potential due to their safety and diagnostic capabilities. This paper investigates the transient response of an extended partial blockage—an evolution of a discrete partial blockage that protrudes longitudinally—an increasingly complex condition which has a greater impact on the behavior of pipe systems. Through Computational Fluid Dynamics simulations, the interaction of pressure waves with extended partial blockages of different severity and lengths is examined to assess the resulting pressure response. The results confirm that the pressure signature, generated by extended partial blockages, differs markedly from those of discrete partial blockages. In particular, the magnitudes of the first and second pressure peaks enable accurate characterisation of the severity and extent of the extended partial blockage. These results demonstrate that transient test-based techniques can play a significant role in managing water pipe systems, facilitating more targeted maintenance interventions. Broader implementation of these techniques could enable water utilities to reduce energy consumption, maintain water quality with lower chlorine dosing, and prevent the progression of partial blockages to total pipeline blockage.
1. Introduction
Pressurised pipe systems are fundamental components of modern infrastructures, enabling the reliable transport of vital fluids—such as potable water, natural gas, industrial chemicals, and crude and refined petroleum products—across vast geographical areas. These systems underpin a range of sectors from municipal water supply and energy distribution to industrial activities [].
In the context of global climate change, the increasing frequency and severity of extreme events—such as droughts and floods—make water demand more uncertain and jeopardise its availability. As a consequence, water system managers face intensifying operational challenges. These include increasing resource scarcity, high energy requirements, growing urban populations, ageing and costly infrastructures, more stringent regulatory frameworks, and increased environmental concerns []. Recent reviews highlight that these stressors are accelerating infrastructure deterioration and intensifying the hydraulic vulnerability of pipe systems [,]. From the mentioned perspective of water resource scarcity, as an alarming example, the situation of small lakes without natural emissaries—but with a relevant role for the local water supply and a sort of climate sentinel—is emblematic, as in many cases they are at risk of survival, e.g., [,].
To address the above challenges, system managers need to improve methods used for the monitoring, diagnosis, prognosis, supervision, and optimisation of water-related systems in alignment with sustainability objectives [,]. These issues are compounded by the operational vulnerabilities of pressurised pipe systems, which must maintain uninterrupted flow under demanding conditions, yet are susceptible to faults—most notably leaks, pipe wall deterioration, and partial blockages (PBs)—that compromise continuity, safety, and efficiency. Among these, PBs are recognised as particularly insidious, as they may persist undetected for long periods, progressively degrading system performance while offering little or no external indication of their presence [,].
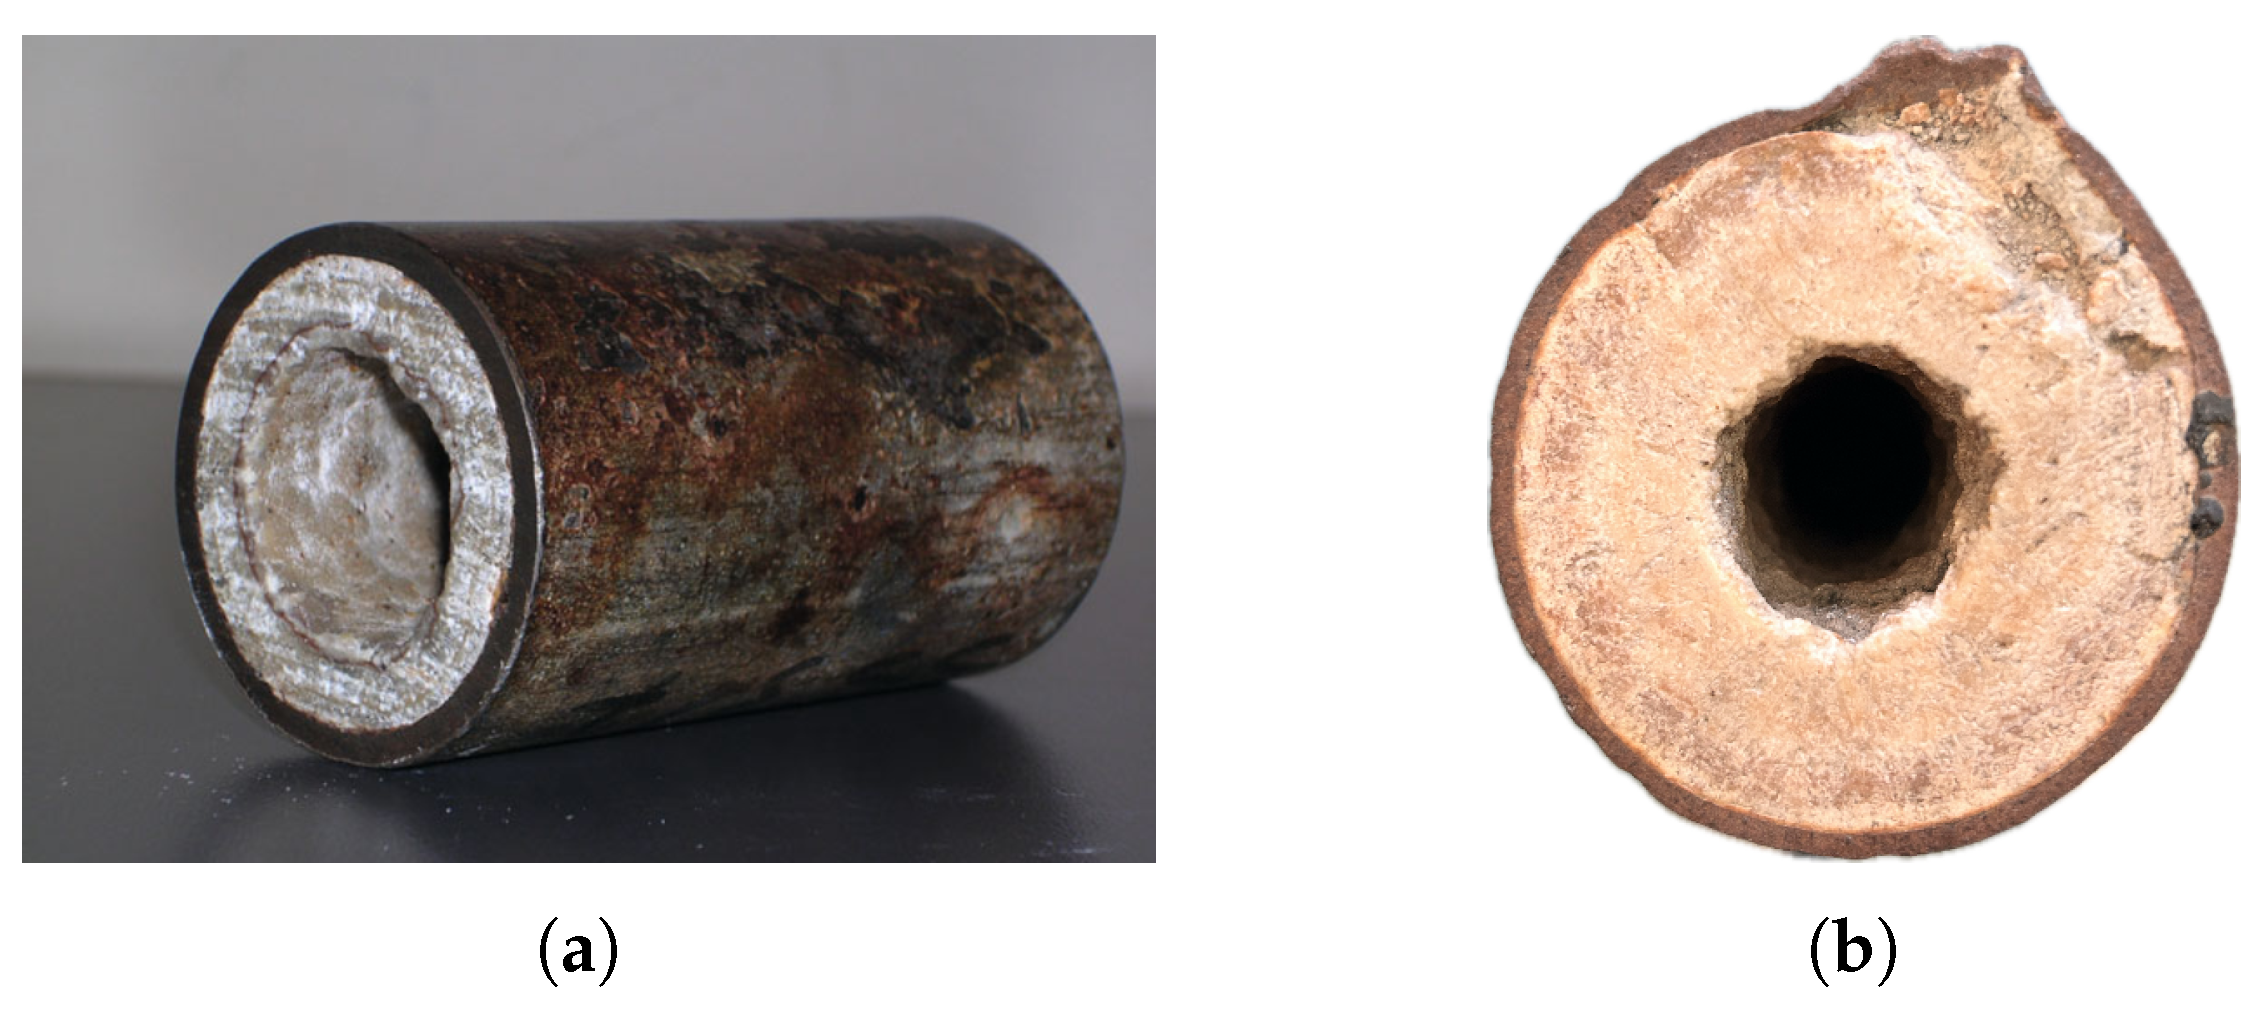
PBs arise from many faults. Physical and chemical deposition processes lead to the accumulation of sediments, mineral scale, biofilms, or corrosion products on the internal pipe wall. In oil and gas pipelines, waxes, paraffin, hydrates, and asphaltenes can precipitate, particularly in subsea environment with low ambient temperature []. In these contexts, hydrate and wax blockages remain among the critical flow assurance problems, motivating advanced numerical approaches for prediction and mitigation [,]. Air pockets in undulating profiles and partially closed in-line valves can produce similar effects from a hydraulic point of view []. All these obstructions narrow the effective pipe cross-section and then increase head losses. Accordingly, they reduce the carrying capacity of gravity pipelines on the one hand and increase the energy demand in elevatory mains on the other hand [,]. In addition, PBs may interfere with the dynamics of biofilm formation in the pipe wall with possible microbial proliferation and water quality deterioration []. In metallic and concrete pressurised pipelines, due to the possibility of sediments adhering to the internal pipe wall, PBs are predominantly concentric (Figure 1) [,]. On the contrary, in polymeric pipes, in most cases, sediments accumulate at the bottom of the pipe.
Figure 1.
Partial blockage (PB) from sediment deposition, reducing the inner section by (a) 50%, and (b) 90%.
The reasons outlined above contrast with PBs, which is a priority for water system managers.
Without external evidence, the most common approaches used for PBs detection include localised intrusive inspections, insertion of probes, or extensive video and ultrasonic surveys [,,,]. While technically robust, such methods are costly, labour-intensive, service-disruptive, and often impractical in buried or inaccessible sections of pipe systems. To overcome these constraints, attention has turned towards non-invasive diagnostic methods capable of detecting and characterising PBs with minimal operational impact. Among the most promising of these are the transient test–based techniques (TTBTs), which exploit controlled hydraulic transients—those characterised by sharp but small-amplitude pressure waves []—to detect and characterise anomalies in a pipeline. When a pressure wave interacts with an anomaly, a part of it is reflected back, whereas the other is transmitted beyond. The characteristics of the reflected pressure wave, i.e., its time of occurrence at the pressure measurement section, entity, and shape, allow it to be located and facilitate the identification of its type and severity without interior pipe access. TTBTs are non-destructive and well-suited to buried or otherwise inaccessible pipes; they are also cost-effective, as only the pressure signal must be acquired at some selected sections. Moreover, the whole procedure can be executed on demand by trained utility personnel, avoiding additional expense and the waiting list of external companies [,]. Pressure signal (i.e., the pressure time-history) acquired during transients can be analysed using different approaches e.g., [,,], as discussed in [,,,].
With regard to PBs, a distinction must be made between discrete, DPBs, and extended, EPBs, partial blockages. The first type, resulting from the deposition of sediment on the internal pipe wall at an early stage in terms of longitudinal length, includes features (e.g., partially closed in-line valves) that behave like an orifice from the hydraulic point of view (Figure 2a). The second type is the result of the progressive longitudinal development of DPBs along the pipe axis (Figure 2b). Accordingly, the transient response of DPBs and EPBs is remarkably different [].
Figure 2.
Partial blockage classification: (a) discrete partial blockage (DPB), and (b) extended partial blockage (EPB).
In a previous paper [], the interaction of pressure waves with a sharp-edged orifice was analysed by a Computational Fluid Dynamics (CFD) model. Scenarios examined by numerical experiments, i.e., layouts with different ratios between the diameter of the orifice and the one of the pipe, confirmed the following key features: (i) The first reflected pressure wave encapsulates the information required for DPB detection and localisation; (ii) The amplitude of the reflected wave increases as the DPB severity increases, allowing its characterisation; and (iii) The characteristics of the acquired pressure signal depend significantly on the relative position of the DPB, and location of the measurement section and the one where the transient is generated. Numerical tests were executed in laminar conditions for two reasons. The first reason is that, because of the small value of the mean flow velocity that characterises such a regime, a small amount of overpressure is generated even for very fast maneuvers. As a matter of fact, within TTBTs fast maneuvers are requested as sharp pressure waves improve significantly their performance in terms of both fault localisation and evaluation. At the same time, small overpressures limit the risk of damage to pipe systems and issues caused by fatigue, as system managers must carry out integrity checks quite frequently, particularly in aging systems. The second reason why the laminar regime is of interest is that pressure waves generated “to explore” the pipe overlap the pre-transient pressure oscillations. As shown in [], the smaller the value of the pre-transient Reynolds number, the more visible the travelling pressure waves.
2. Materials and Methods
2.1. Computational Fluid Dynamics (CFD) Model
Numerical simulations have been executed using OpenFOAM (OF) 2106, an open-source CFD software package [,]. This tool has been chosen for its robust capabilities in handling transient scenarios and its ability to accurately simulate the intricate interactions between pressure waves and different PB configurations [,,,,,,,]. OF is based on the Navier–Stokes equations, derived from the conservation principles of mass and momentum. In the absence of mass sources and sinks, the principle of mass conservation is expressed by the following continuity equation:
where = fluid density, = velocity component, t = time, and = spatial co-ordinate (with ).
The principle of momentum conservation, in terms of the Cauchy stress tensor, , is expressed by the Cauchy equation:
where f = forces per unit mass (e.g., gravity). For isotropic, homogeneous, and Newtonian fluids, the stress tensor is expressed in terms of the velocity field by
where p = thermodynamic pressure (equal to static pressure for motionless fluids), Kronecker delta, and = fluid dynamic viscosity.
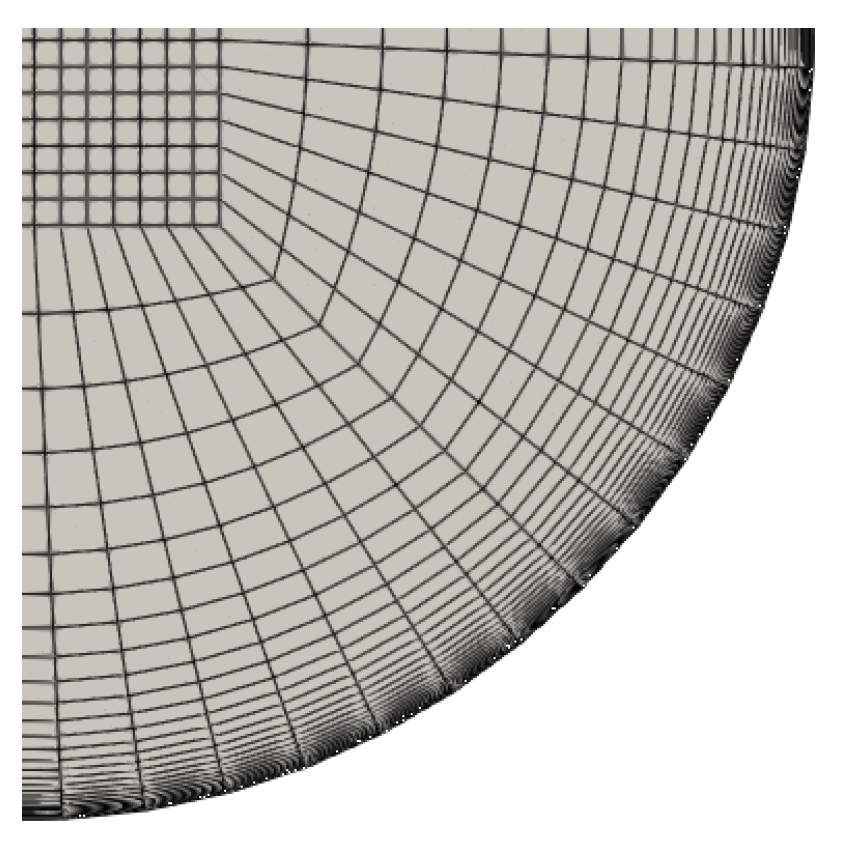
The governing equations are discretised using the finite volume method [], implemented within the computational framework. The domain consists of a structured mesh of hexahedral cells [], with local refinement applied to critical regions such as near-wall zones and the vicinity of the EPB.
For the mesh generation (Figure 3), the snappyHexMesh tool of the OF framework is employed. The process begins with a base cuboid mesh defined according to the three-dimensional (3D) discretisation of the mesh size parameters proposed in []: mesh size in the axial direction, described in terms of number of diameters, ; mesh size in the circumferential direction described in terms of the perimeter, ; and the ratio between the first layer thickness and theoretical viscous sublayer in the radial direction, . The initial mesh is subsequently refined and adapted to conform to the geometry of the fluid domain, corresponding to a pipe featuring an EPB. The procedure involves successive sculpting and refinement steps until the mesh accurately represents the physical configuration, resulting in meshes from 2 to 9 million points. Consequently, the fluid domain is divided into smaller, non-overlapping subdomains. As highlighted below, this mesh strategy ensures adequate resolution [] of steep velocity and pressure gradients in the flow field.
Figure 3.
Structured hexahedral efficient mesh.
Appropriate initial and boundary conditions are imposed. As pre-transient conditions, the fluid is presumed to be at rest (). At the pipe wall, zero relative velocity happens with respect to the fluid (in the simulation, water, with kg/m3, has been considered) enforcing the no-slip boundary condition. Moreover, as discussed below, where the system layout is described in more detail, a given pressure increase characterises the pipe inlet, determining the corresponding velocity increase. On the contrary, no outlet is assumed at the opposite end section of the pipe where there is a dead end.
The numerical scheme employs the cavitatingFoam solver, a pressure-based solver with a PIMPLE (merged PISO-SIMPLE) algorithm to handle compressibility effects, which is crucial for modelling pressure wave propagation accurately. In particular, the solver uses the Homogeneous Equilibrium Model to determine the compressibility of the liquid according to the selected barotropic equation of state. Temporal discretisation is achieved through a transient scheme, providing stability and precision in time-dependent simulations. Given the laminar flow regime under consideration, turbulence modelling is not incorporated. The convergence of the numerical solution is evaluated by monitoring the residuals that arise during each iteration. In particular, convergence studies have been conducted to optimise mesh resolution and time-step sizes, striking a balance between computational efficiency and solution accuracy []. Convergence is achieved when the residuals fall below the threshold of .
The above numerical approach has been validated extensively with regard to both steady- and unsteady-state conditions. As the solution of a CFD model depends greatly on the accuracy with which the flow field is simulated, particular attention has been paid to the description of the DPB and EPB geometries with the adoption of an appropriate spatial mesh. To verify the adequacy of the geometry and mesh adopted, the model results were compared with the laboratory experimental data available in [,,,,,,] under steady-state conditions, with satisfactory results [,]. Subsequently, the model’s ability to appropriately capture the characteristics of transients in pressurized flows was verified [,,].
2.2. System Layout and Parameters
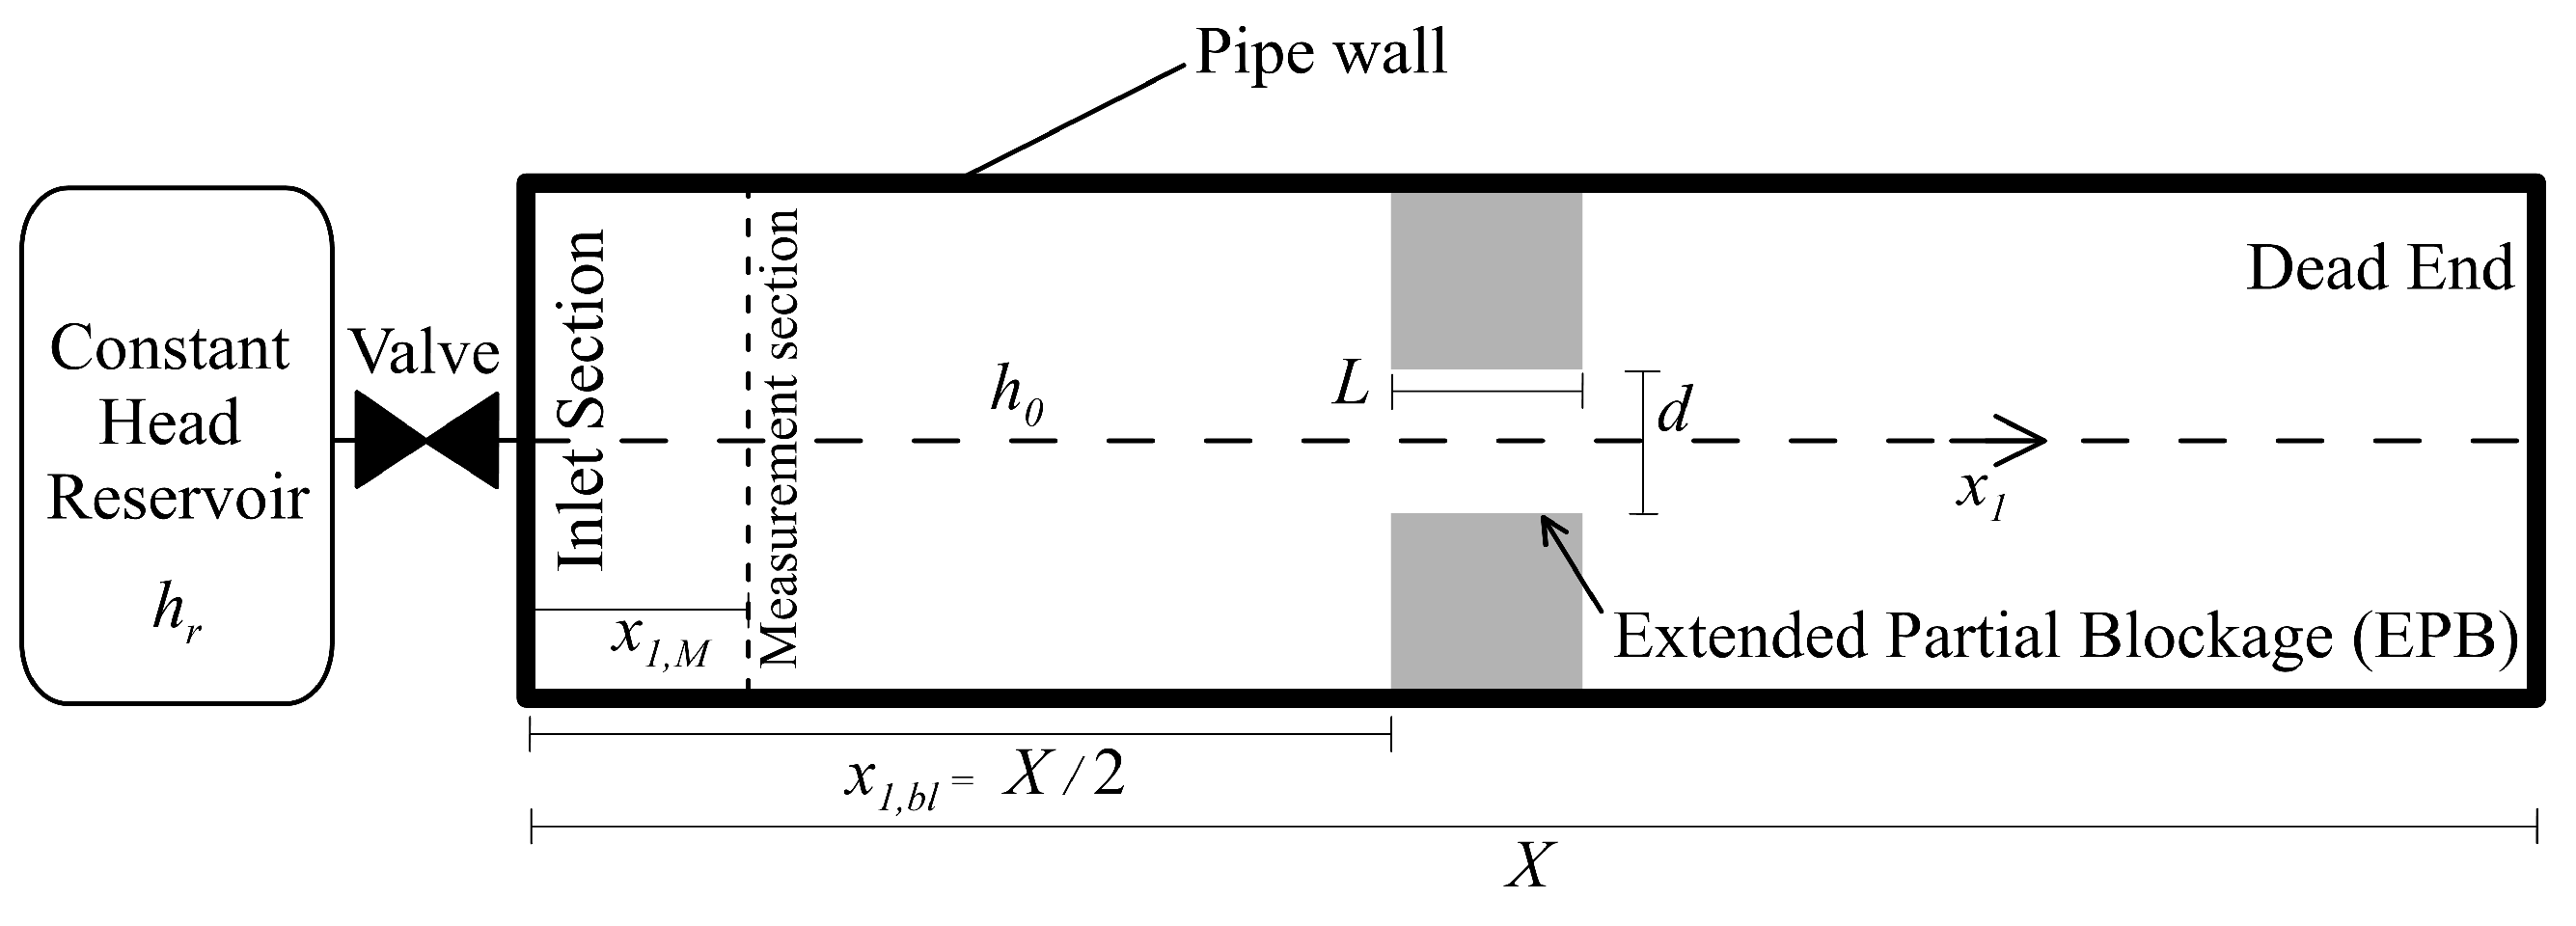
Numerical experiments were carried out in a 3D fluid domain (Figure 4). The setup included a constant pressure head reservoir maintained at a pressure head, , equipped with a valve—hereafter referred to as the connection valve—that was initially closed. In fact, at the inlet section, such a valve was connected to a pipe—with an inner diameter, D, and length, X (=3 m)—initially at a pressure head, , with the subscript 0 indicating the pre-transient conditions. As discussed in detail in [], such a setup is an idealised version of the Portable Pressure Wave Maker (PPWM) device, refined at the Water Engineering Laboratory (WEL) of the University of Perugia, Italy []. At the opposite section of the pipe, there is a dead end.
Figure 4.
Layout schematic representation: a constant-head reservoir connected through a valve to a pressurized pipe, with an EPB located at mid-length.
However idealised, such a layout is not too far from the configuration that real TTBT pipe systems must assume before transient tests to maximise the performance of the method. In fact, closing a valve and then creating a dead end isolates the pipe under study from the other parts of the system. This prevents the entry of pressure waves that are not related to the transient test, which would complicate the subsequent analysis of the pressure signal and then the detectability of the anomalies. The values chosen for D (=0.02 m), (=42.39 m), and (=40.86 m) imply the establishment of a laminar flow during the transient generated by the opening of the connection valve. In fact, as mentioned previously, the smaller the value of the Reynolds number, (=, with U = mean flow velocity, and = fluid kinematic viscosity), the more effective the identification of the pressure waves reflected by anomalies with respect to the pressure oscillations that characterise the flow. The EPB, with a diameter d, starts at and extends over a length L. The value of the pressure wave speed, a (=300 m/s)—which is significantly smaller than that of elastic pipes—has been chosen to increase the pipe characteristic time, , rather than increasing the pipe length, which would have increased the computation time. The pressure signal, h, is acquired at the measurement section located at .
In the assumed pre-transient conditions—i.e., with the fluid at rest—background disturbances are negligible, ensuring that subsequent pressure variations originate solely from the imposed transient.
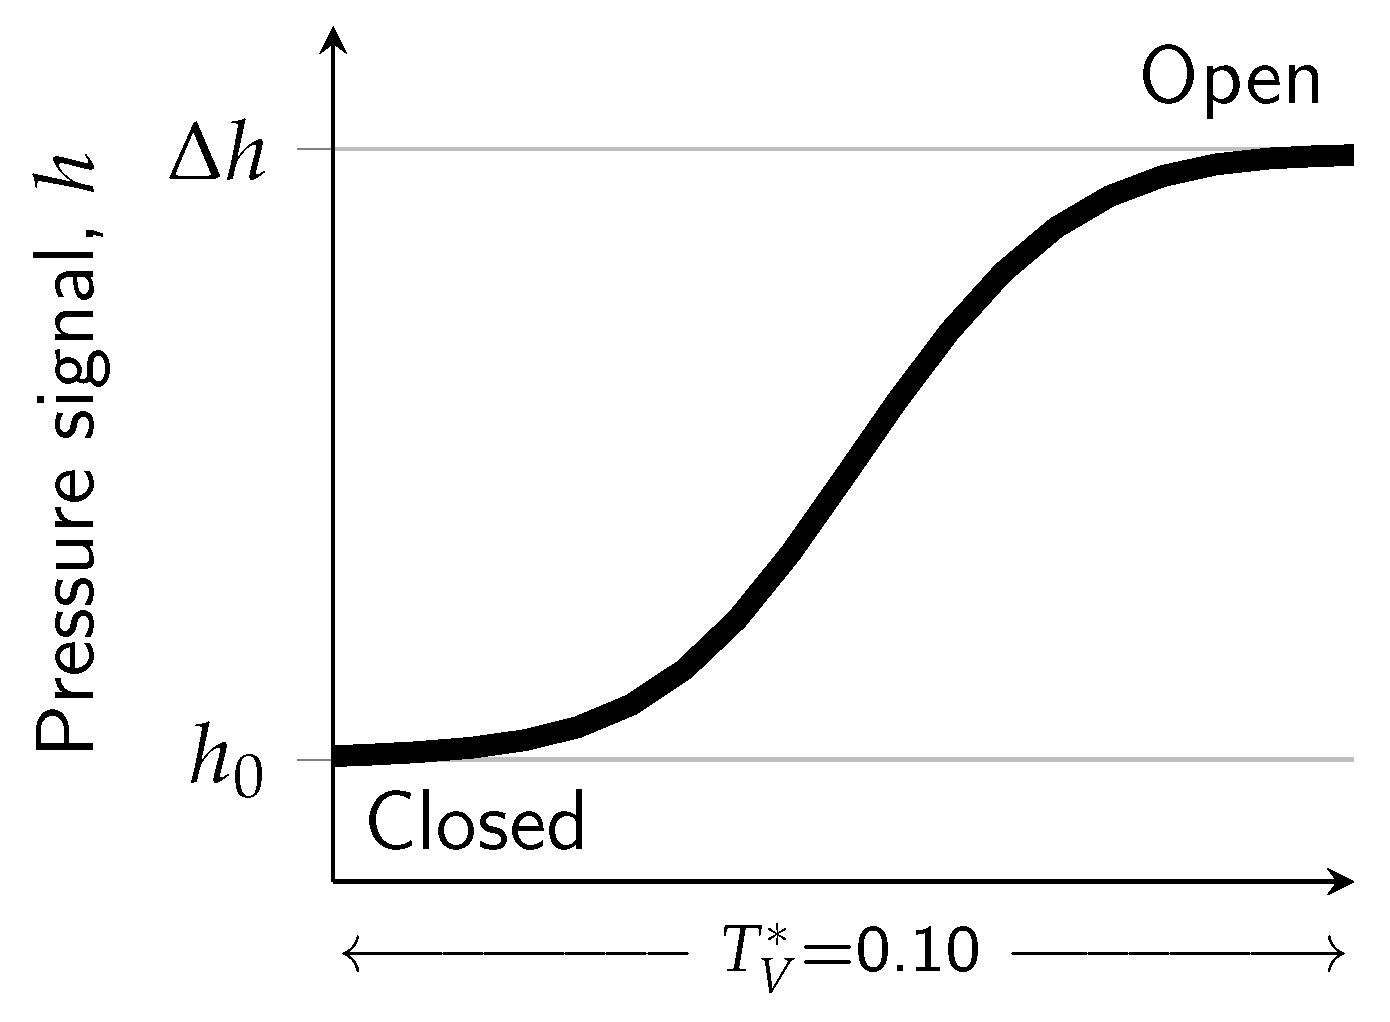
The connection valve opening (Figure 5) is characterised by a dimensionless manoeuvre duration , with being the manoeuvre duration. The considered manoeuvre profile is based on experimental measurements for a ball valve [].
Figure 5.
Pressure signal at the inlet section, illustrating the valve-opening manoeuvre and resulting pressure surge.
As , a pressure wave is generated; such a pressure wave propagates along the pipe, crossing the EPB and reaching the dead end. The mean induced velocity, U () determines the establishment of laminar conditions with = 1000.
A comprehensive series of 3D CFD simulations was executed for a wide range of EPB geometries. In particular, for the orifice diameter ratio, , the following values were considered: 5%, 6.25%, 7.5%, 8.75%, 10%, 11.25%, 12.5%, 13.75%, 15%, 17%, 19%, 21.4%, 25%, 35%, 42.5%, 50%, 69.7%, 75%, and 90%; the EPB length ratio, , assumed the following values: 0.5, 1, 2, 5, 10, and 25. Accordingly, in total, 114 numerical simulations were executed—taking an average of 16 h each for a 16-processor unit—allowing a comprehensive exploration of how variations in EPB severity and length affect the transient response.
3. Results and Discussion
3.1. Role of EPB Severity in the Transient Response
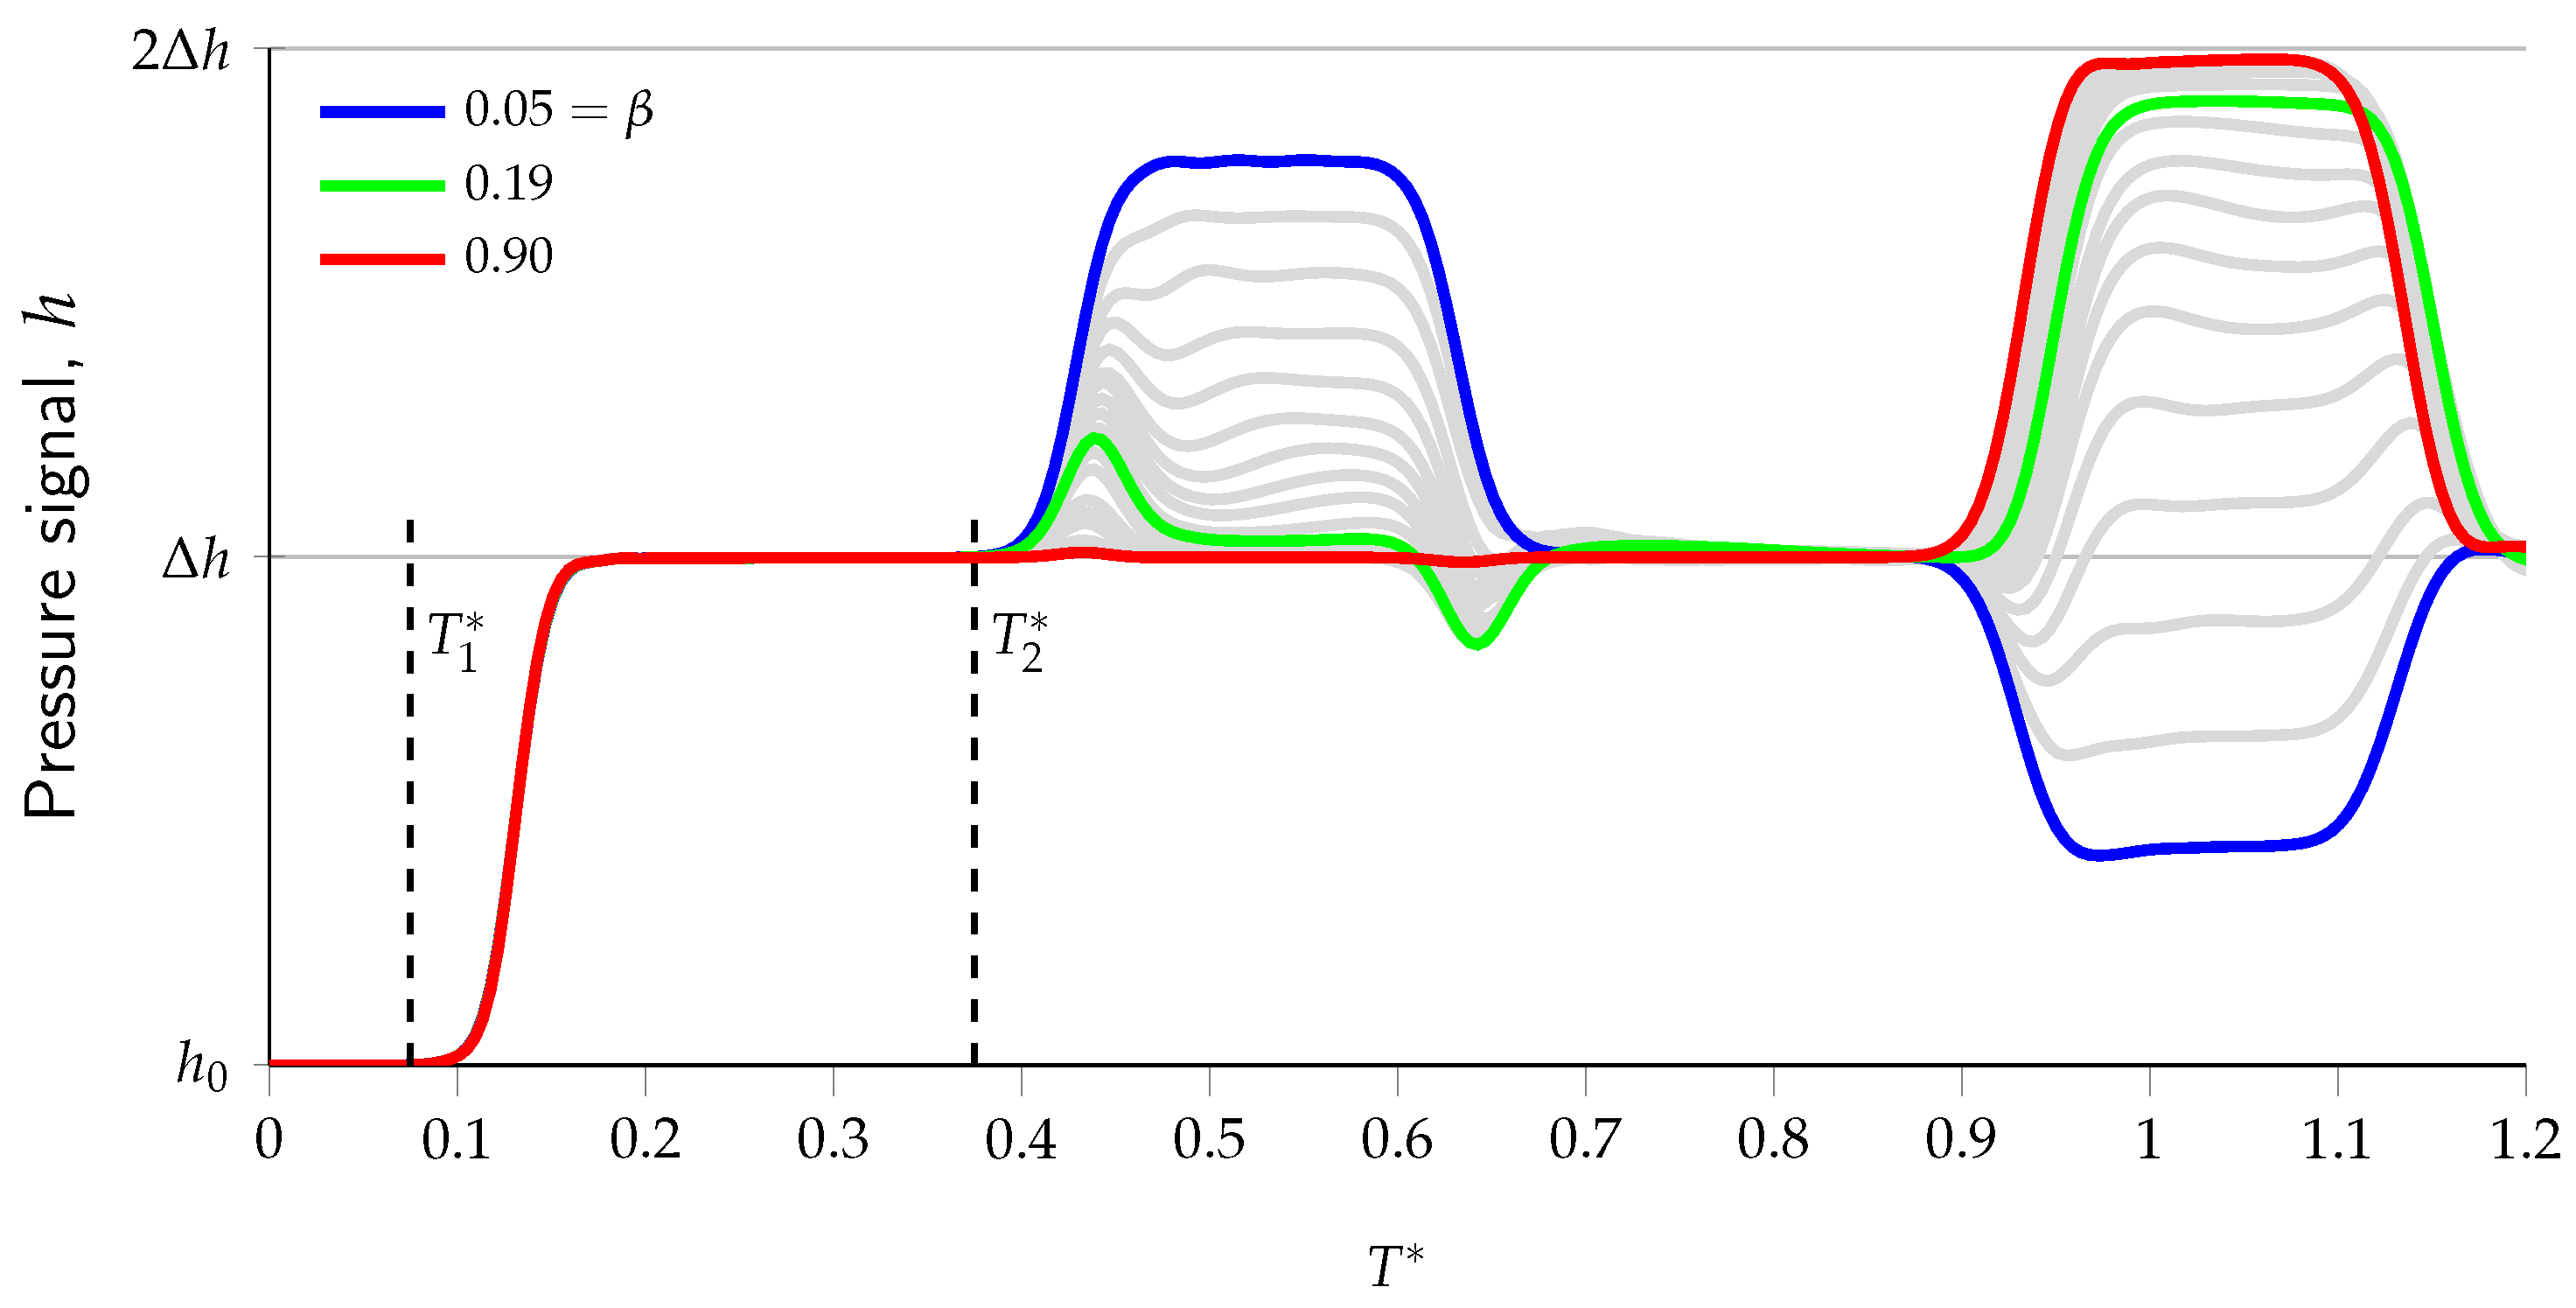
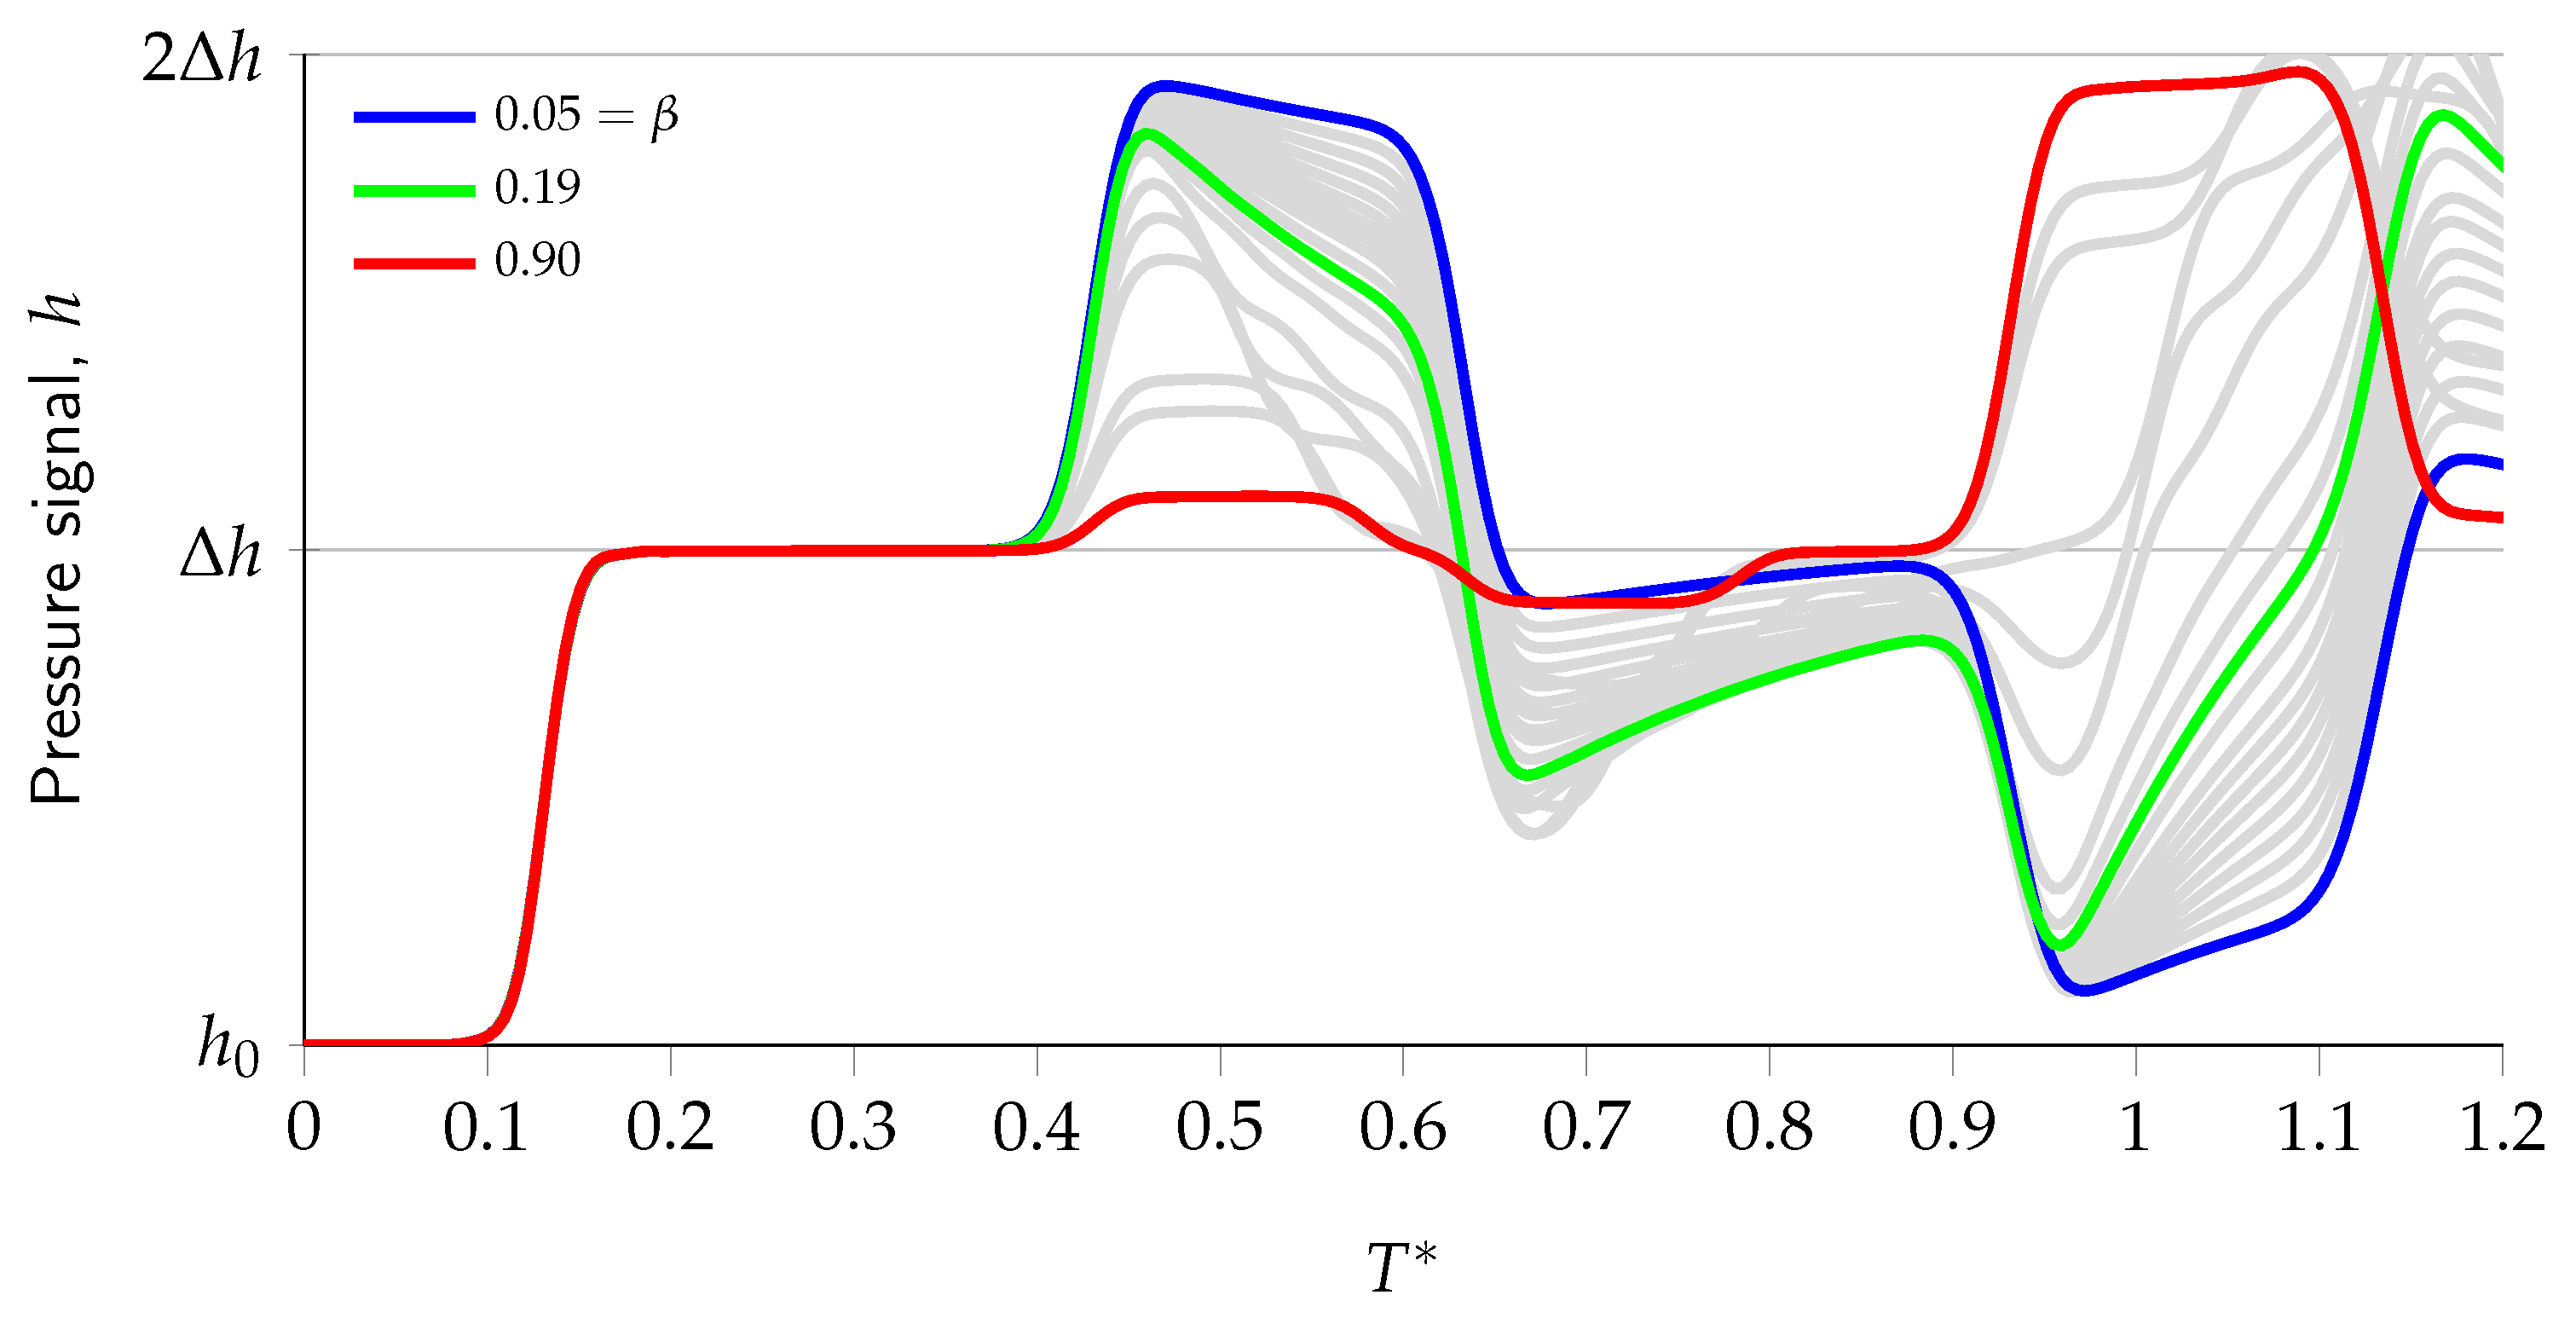
To analyse the role of the diameter ratio, , in the EPB transient response, as a first example, the pressure signal at , the smallest length of the EPB ( 0.50) has been considered for the above-mentioned range of the diameter ratio, (Figure 6); where = is the dimensionless time. All cases are characterised by an initial sharp step increase in the pressure signal from to . Successively, different patterns can be observed according to the value of . Precisely, for the smallest value of (=0.05, blue line), the transient response is similar to the one observed for the DPB with the same [] with the largest peak reaching near , which corresponds to the dead end scenario. The intermediate value of (=0.19, green line) shows a much more moderate response, with attenuated amplitude pressure changes. Finally, for the highest value of (=0.90, red line), the effect of the EPB is almost negligible. A notable feature characterises the second pressure rise that results from the overlapping of pressure waves due to the EPB and dead end for the largest value of . The implications of this feature extend beyond theoretical understanding to practical system management. Specifically, the observed pressure amplification phenomenon suggests that EPBs, which are associated with close dead ends, may subject pipeline systems to pressure exceeding design specifications based on conventional wave reflection principles. This observation carries implications for system operation and safety protocols.
Figure 6.
Pressure signal at for = 0.50 and different values of (pressure signals for = 0.05, 0.19, and 0.90 are highlighted in bold, whereas those for the intermediate values of are shown in gray).
With regard to the EPB localization, it can be obtained by considering the time interval taken for a pressure wave to travel from the measurement section to the EPB and return. As an example, the time instants and , indicated in Figure 6, allow EPB localisation. Specifically, the calculated distance, , of the EPB from the measurement section, , is given by .
For the same range of diameter ratio, , as a second example, Figure 7 shows the pressure signals concerning the largest EPB length ( = 25). Such pressure signals demonstrate distinctive characteristics, which are particularly evident in the case of 0.05, where the extended nature of the EPB and the associated damping effects are observable. These features provide valuable indicators for EPB characterisation through pressure signal analysis.
Figure 7.
Pressure signal at for 25 and different values of (pressure signals for = 0.05, 0.19 and 0.90 are highlighted in bold, whereas those for the intermediate values of are in gray).
3.2. Role of EPB Length in the Transient Response
The pressure signal at the measurement section, , for the diameter ratio, 0.05 is presented in Figure 8, illustrating a range of values of (=0.50, 1, 2, 5, 10 and 25).
Figure 8.
Pressure signal at for 0.05 and different values of (pressure signals for 0.50 and 25 highlighted in black, whereas those for the intermediate values of are in gray).
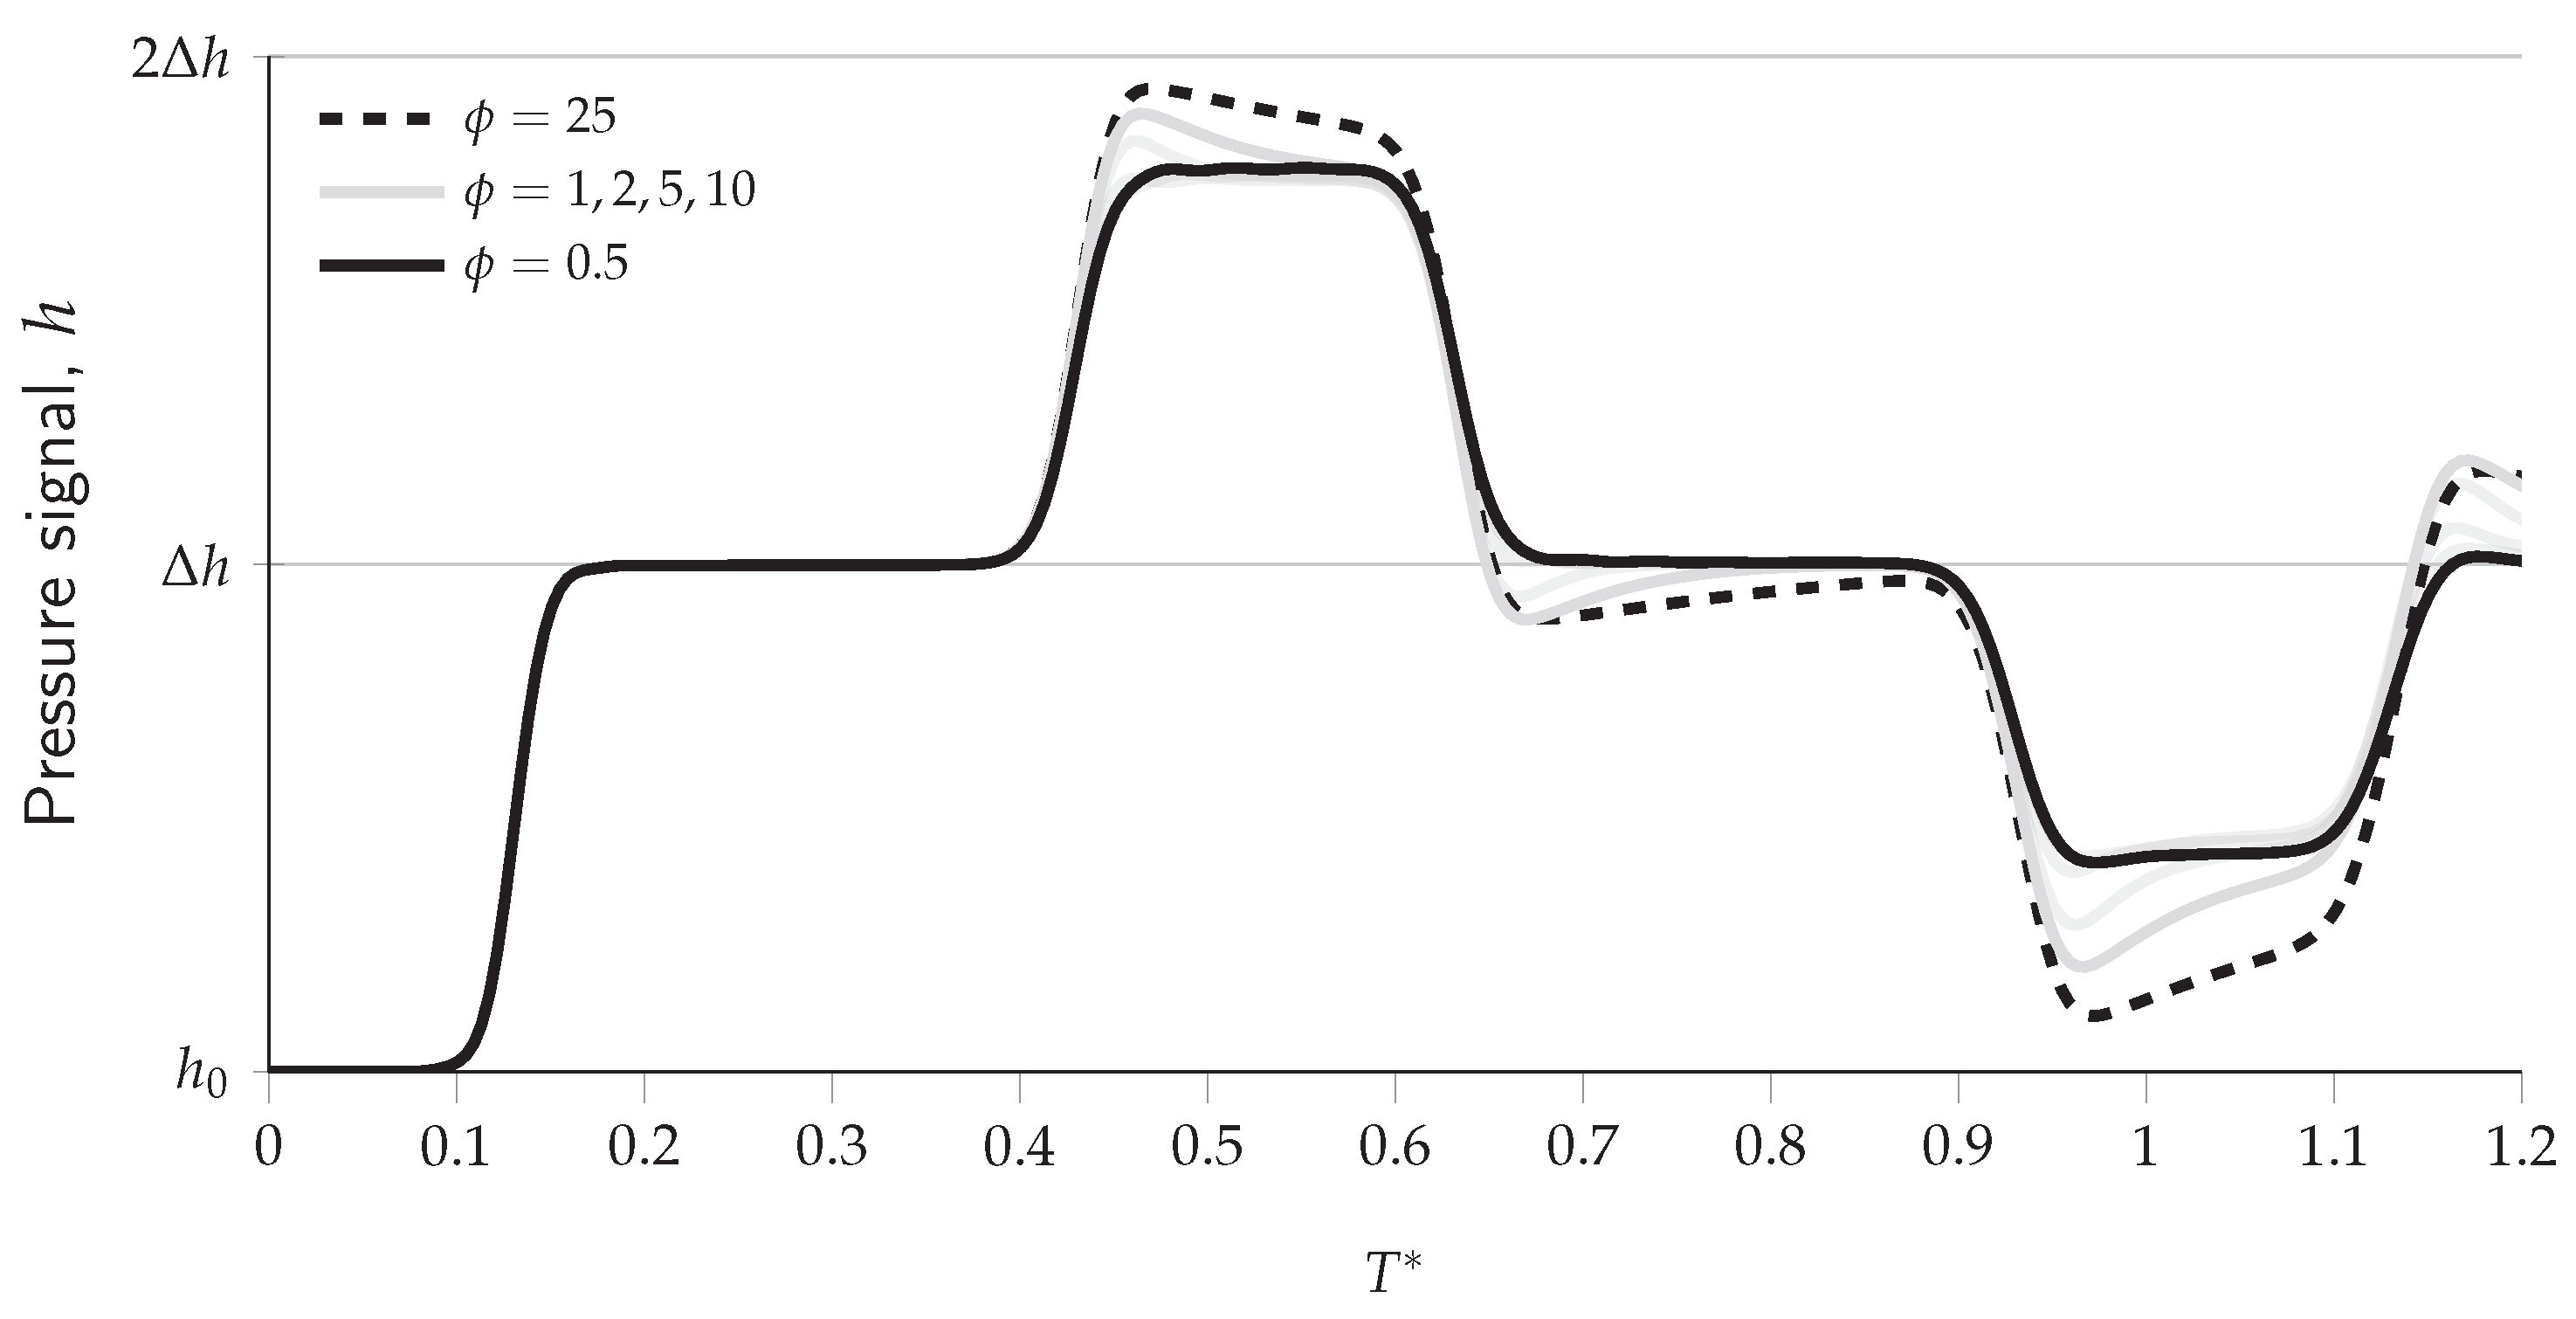
The pressure signal reveals distinct characteristics for different EPB lengths, with all cases enabling precise location identification. The most significant contrast appears between the smallest and largest value of (0.5 and 25, represented by solid and dashed black lines, respectively). The smallest EPB length generates a pressure response similar to DPB with the same value of , both in amplitude and duration. Conversely, the largest EPB length produces substantially higher amplitude peaks and exhibits increased decay.
Intermediate cases, depicted by grey lines ( 1, 2, 5, and 10), demonstrate a progressive evolution in pressure signal characteristics. These traces reveal a systematic increase in peak amplitude and through depth as the EPB length increases, establishing a continuous relationship between blockage length and pressure signal behaviour. This response pattern provides fundamental insights into the relationship between blockage length and transient pressure characteristics, with longer EPBs producing progressively larger pressure changes. The systematic nature of these changes suggests a direct correlation between the length of the EPB and its corresponding transient response, offering valuable diagnostic potential for EPB characterisation in pipeline systems [].
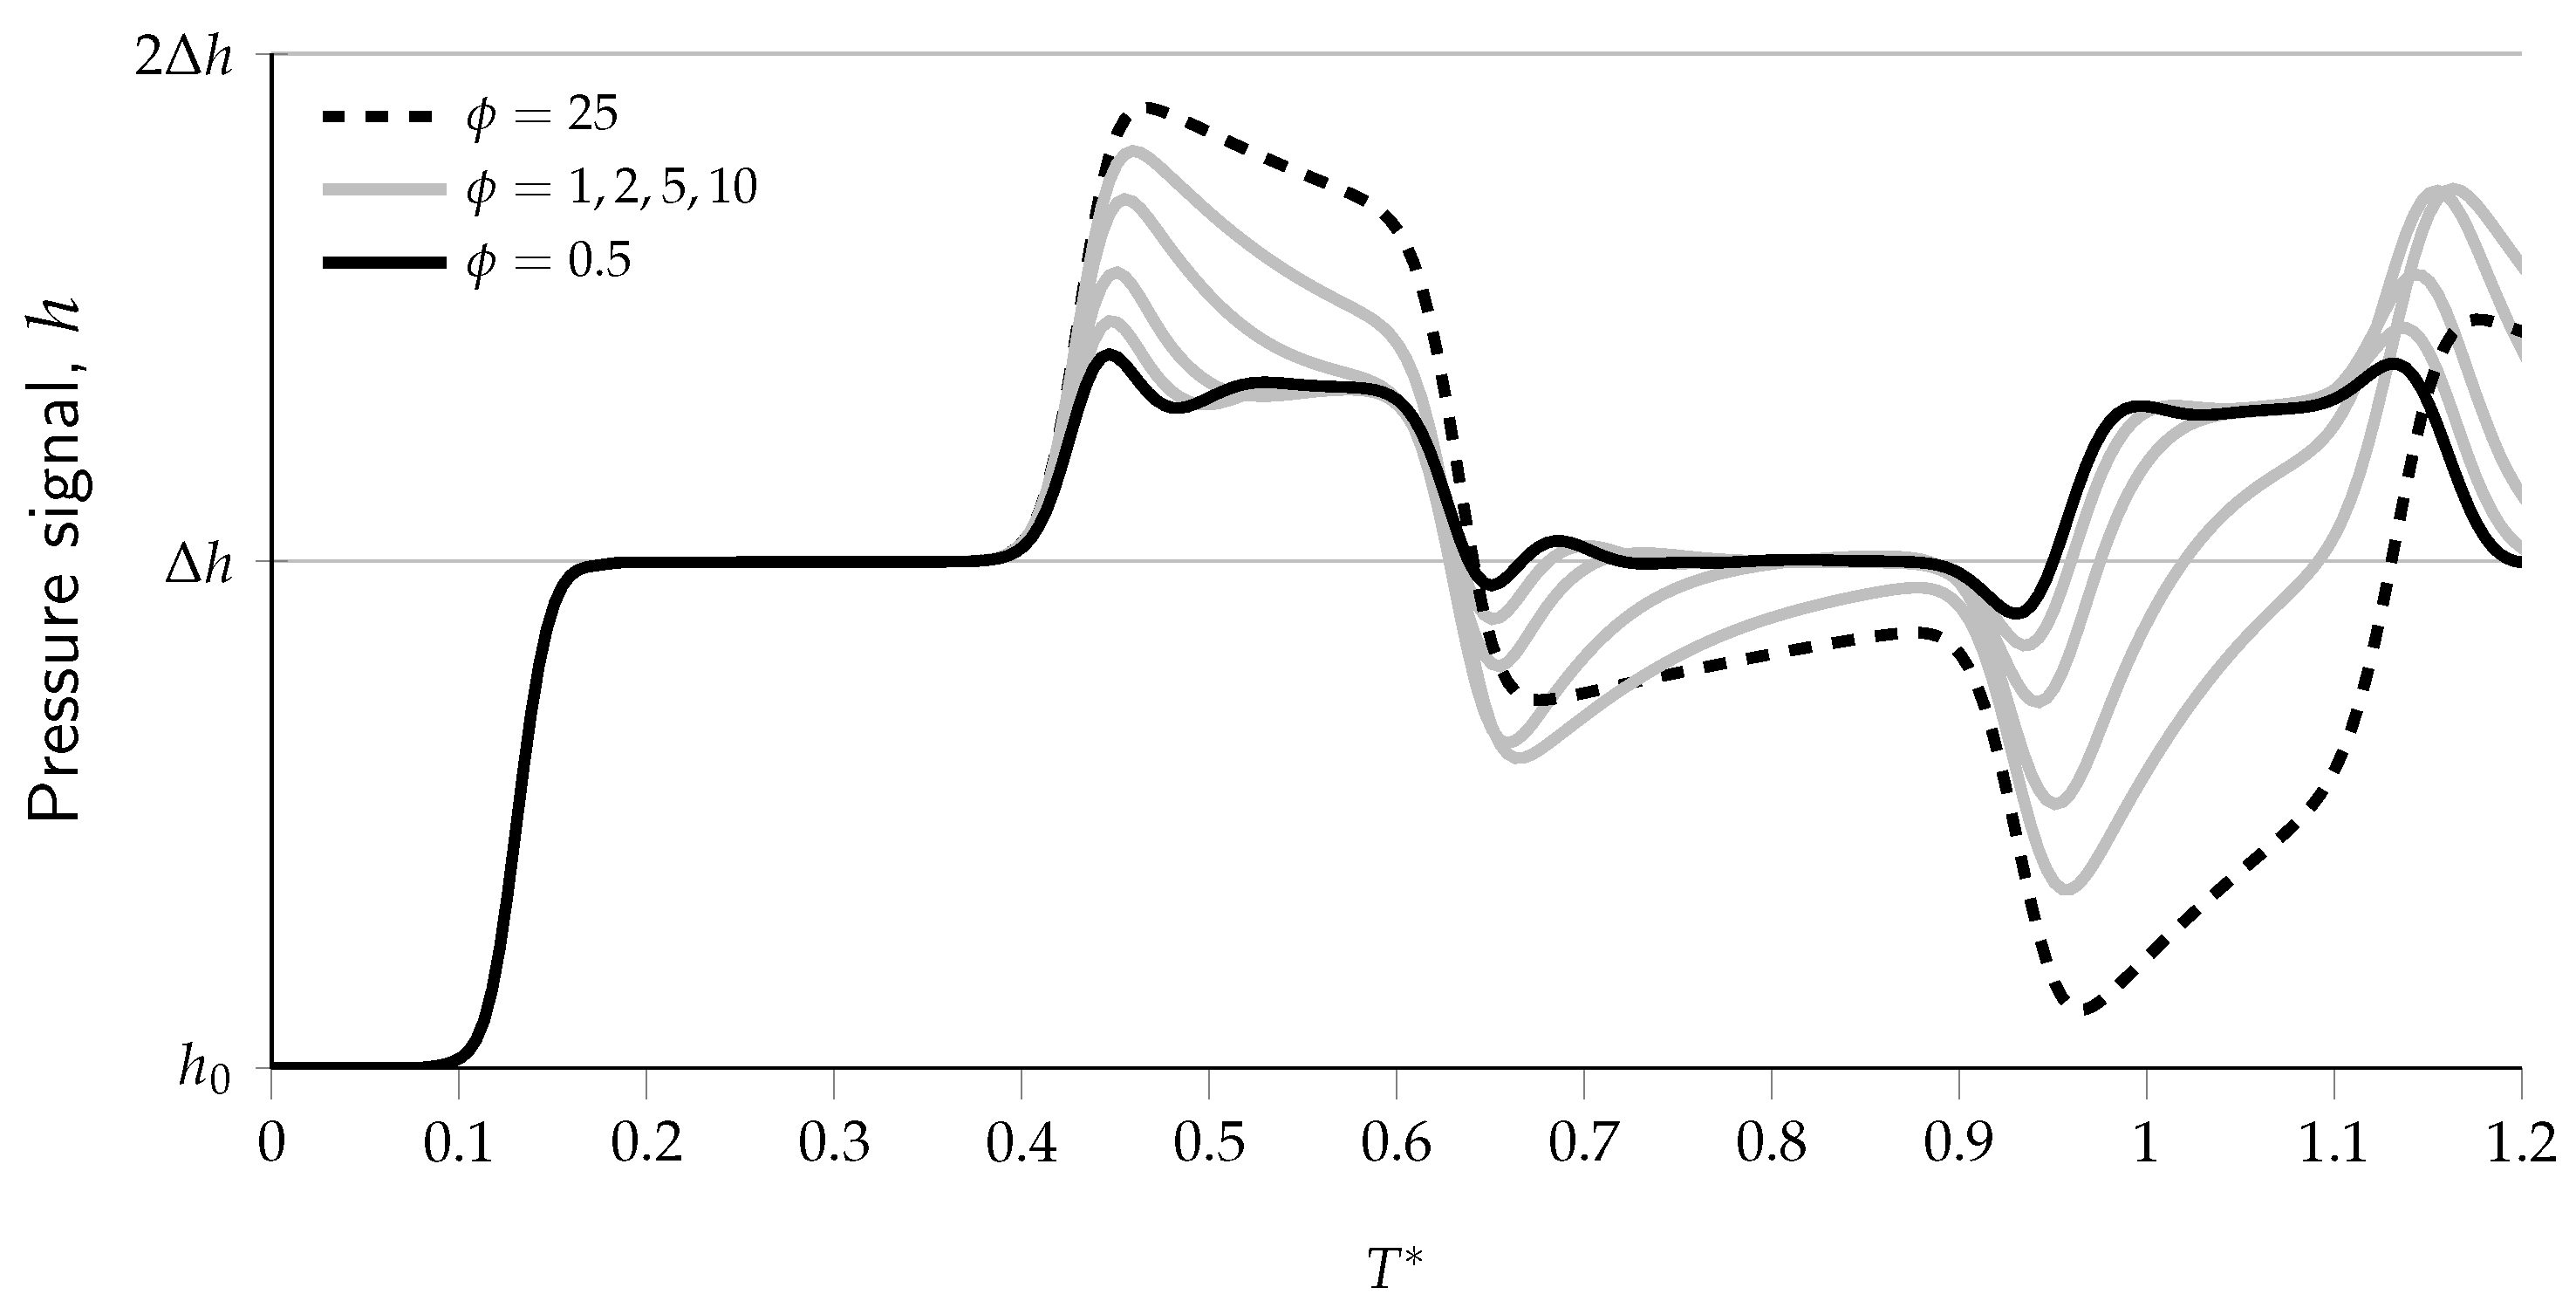
The pressure signal for 0.10 (Figure 9) shows overall patterns similar to those observed in the previous case, but with some notable distinctions. The transient response maintains the ability to identify EPB location while exhibiting characteristic differences across the range of the EPB length ( 0.5 to 25). The smallest length ( 0.50, a continuous black line) generates pressure peaks comparable to DPB, through with reduced amplitude compared to the case for 0.05. The largest length ( 25, dashed black line) maintains its distinct higher amplitude response, but the magnitude of these fluctuations is notably different from the previous case. The intermediate cases (gray lines) display a systematic progression in pressure response characteristics, through the overall pressure variations are less pronounced than in the 0.05 scenario.
Figure 9.
Pressure signal at , for 0.10 and different values of (pressure signals for 0.50 and 25 are highlighted in bold, whereas those for the intermediate values of are in gray).
In Figure 10, the pressure signal for 0.15 shows a notable evolution compared to the previous cases ( 0.05 and 0.10). This larger diameter ratio reveals distinct behavioural patterns across the range of blockage length, whilst maintaining the fundamental ability to identify blockage locations through pressure signals. For this increased diameter ratio, the smallest length, 0.5, exhibits a markedly different response pattern, with reduced peak amplitude compared to the cases with smaller values of . The pressure signal shows a more moderate initial peak, suggesting a fundamental shift in the pressure wave–EPB interaction dynamics. The largest length ( 25) generates the highest amplitude response, through the magnitude of these fluctuations is notably attenuated compared to the previous cases.
Figure 10.
Pressure signal at , for 0.15 and different values of (pressure signals for 0.50 and 25 are highlighted in bold, whereas the other signals are shown in gray).
Intermediate EPB lengths ( 1, 2, 5, and 10) display a systematic progression in their pressure response, with each successive increase in length producing incrementally larger amplitude variations. However, these variations are less pronounced than in the cases with smaller diameter ratios, indicating that the larger flow area moderates the pressure wave interactions. This moderating effect is particularly evident in the secondary reflections.
These observations confirm that the influence of EPB length on the transient response becomes more subtle as the diameter ratio increases, suggesting that detection and characterisation methodologies may need to be adjusted accordingly for larger diameter ratios. The above analysis confirms the importance of considering both the EPB length and diameter ratio for understanding and interpreting transient pressure responses in pipeline systems.
4. Conclusions
Extended partial blockages (EPBs) represent the longitudinal progression of discrete partial blockages (DPBs) and create substantial operational challenges for pressurised pipe systems through altered flow dynamics and potential system compromise. This paper investigates the transient response of EPBs using three-dimensional Computational Fluid Dynamics (CFD) simulations based on compressible Navier–Stokes equations implemented in OpenFOAM. Extending upon previous DPB investigations, this analysis examines transient pressure wave interactions with EPBs at mid-pipe locations featuring different orifice diameter ratios and longitudinal extensions.
The results reveal distinct pressure signature patterns for EPBs compared with DPBs. The first reflected pressure wave from an EPB shares qualitative similarities with the DPB response, with its amplitude being inversely proportional to the EPB diameter ratio. However, significant differences arise in the second pressure peak, which can exceed the maximum pressure increase expected under traditional wave reflection theory, sometimes exceeding the inserted pressure wave two times over (). This feature, due to the interaction between multiple reflected waves within the EPB region and dead end, carries important implications for structural safety and operation. Moreover, the EPB length significantly influences the transient pressure response. Longer EPBs generate higher amplitude peaks and more complex pressure changes, highlighting the need for refined detection algorithms.
The presented results contribute to improving monitoring strategies for water utilities by advancing non-invasive diagnostic capabilities. Transient test-based techniques leveraging pressure wave reflections can effectively differentiate between DPBs and EPBs whilst providing quantitative estimates of their severity through analysis of reflection magnitude and temporal characteristics. These enhanced diagnostic capabilities enable water system managers to implement optimised maintenance practices through targeted interventions, achieving significant energy savings by preserving hydraulic efficiency and mitigating the risks of progressive EPB development into full obstruction. Furthermore, the improved characterisation methodology supports proactive asset management strategies, reducing operational costs and enhancing network reliability through early detection and timely remediation of partial blockages before they compromise system performance or require emergency interventions.
Author Contributions
Conceptualization, N.M.C.M., D.I.C.C., B.B., S.M. and C.C.; Methodology, N.M.C.M., D.I.C.C., B.B., S.M. and C.C.; Software, N.M.C.M., D.I.C.C., B.B., S.M. and C.C.; Validation, N.M.C.M., D.I.C.C., B.B., S.M. and C.C.; Formal analysis, N.M.C.M., D.I.C.C., B.B., S.M. and C.C.; Investigation, N.M.C.M., D.I.C.C., B.B., S.M. and C.C.; Resources, N.M.C.M., D.I.C.C., B.B., S.M. and C.C.; Data curation, N.M.C.M., D.I.C.C., B.B., S.M. and C.C.; Writing—original draft, N.M.C.M., D.I.C.C., B.B., S.M. and C.C.; Writing—review & editing, N.M.C.M., D.I.C.C., B.B., S.M. and C.C.; Visualization, N.M.C.M., D.I.C.C., B.B., S.M. and C.C.; Supervision, N.M.C.M., D.I.C.C., B.B., S.M. and C.C.; Project administration, N.M.C.M., D.I.C.C., B.B., S.M. and C.C.; Funding acquisition, S.M. and C.C. All authors have read and agreed to the published version of the manuscript.
Funding
This research has been jointly supported by the University of Perugia “Fondi di ricerca di Ateneo-edizioni 2021 e 2022”; by the Ministry of University and Research (MUR) under the Project of Relevant Interest PRIN2022 “Hybrid Transient-Machine Learning Approach for Anomaly Detection and Classification in Water Transmission Mains (TANDEM)” (CUP: J53D23002110006). Finally, the Authors would like to thank the European Commission, MUR (Italy) (CUP: J93C23002030006, C57J24000010001), Fapesc (Brazil), and FCT (Portugal) for funding in the framework of the collaborative international consortium MORE4WATER financed under the 2022 Joint call of the European Partnership 101060874-Water4all.
Institutional Review Board Statement
Not applicable.
Informed Consent Statement
Not applicable.
Data Availability Statement
The original contributions presented in this study are included in the article. Further inquiries can be directed to the corresponding author.
Conflicts of Interest
The authors declare no conflicts of interest.
References
- Li, C.; Zhang, Y.; Jia, W.; Hu, X.; Song, S.; Yang, F. Blockage detection techniques for natural gas pipelines: A review. Gas Sci. Eng. 2024, 122, 205187. [Google Scholar] [CrossRef]
- Rosińska, W.; Jurasz, J.; Przestrzelska, K.; Wartalska, K.; Kaźmierczak, B. Climate change’s ripple effect on water supply systems and the water-energy nexus—A review. Water Resour. Ind. 2024, 32, 100266. [Google Scholar] [CrossRef]
- Fan, Q.; Zhan, J.; Hu, W.; Huang, Z. Effects of orifice size on the efficiency of a heaving oscillating water column. Eng. Appl. Comput. Fluid Mech. 2022, 16, 666–676. [Google Scholar] [CrossRef]
- Li, D.; Wang, C.; Ju, P.; Han, G.; Jin, D.; Wen, J. Effect of the number of orifice plate stages on cavitation characteristics. J. Phys. Conf. Ser. 2024, 2752, 012168. [Google Scholar] [CrossRef]
- Woolway, R.I.; Kraemer, B.M.; Lenters, J.D.; Merchant, C.J.; O’Reilly, C.M.; Sharma, S. Global lake responses to climate change. Nat. Rev. Earth Environ. 2020, 1, 388–403. [Google Scholar] [CrossRef]
- Bongioannini Cerlini, P.; Saraceni, M.; Silvestri, L.; Meniconi, S.; Brunone, B. Monitoring the water mass balance variability of small shallow lakes by an ERA5-Land reanalysis and water level measurement-based model. An application to the Trasimeno Lake, Italy. Atmosphere 2022, 13, 949. [Google Scholar] [CrossRef]
- Yakhot, V.; Bailey, S.C.C.; Smits, A.J. Scaling of global properties of turbulence and skin friction in pipe and channel flows. J. Fluid Mech. 2010, 652, 65–73. [Google Scholar] [CrossRef]
- Walski, T.; Chase, D.V.; Savic, D.; Grayman, W.; Beckwith, S.; Koelle, E. Advanced Water Distribution Modeling and Management; Haestad Press: Waterbury, CT, USA, 2003. [Google Scholar]
- Duan, H.F.; Lee, P.J.; Che, T.C.; Ghidaoui, M.S.; Karney, B.W.; Kolyshkin, A.A. The influence of non-uniform blockages on transient wave behavior and blockage detection in pressurized water pipelines. J. Hydro-Environ. Res. 2017, 17, 1–7. [Google Scholar] [CrossRef]
- Duan, H.F.; Lee, P.J.; Kashima, A.; Lu, J.; Ghidaoui, M.S.; Tung, Y.K. Extended blockage detection in pipes using the system frequency response: Analytical analysis and experimental verification. J. Hydraul. Eng. 2013, 139, 763–771. [Google Scholar] [CrossRef]
- Olajire, A.A. Review of wax deposition in subsea oil pipeline systems and mitigation technologies in the petroleum industry. Chem. Eng. J. Adv. 2021, 6, 100104. [Google Scholar] [CrossRef]
- Duan, X.; Shi, B.; Wang, J.; Song, S.; Liu, H.; Li, X.; Chen, Y.; Liao, Q.; Gong, J.; Chen, S.; et al. Simulation of the hydrate blockage process in a water-dominated system via the CFD-DEM method. J. Nat. Gas Sci. Eng. 2021, 96, 104241. [Google Scholar] [CrossRef]
- Duan, X.; Shi, B.; Ruan, C.; Jia, J.; Song, S.; Liao, Q.; Chen, Y.; Chen, S.; Wang, J.; Yao, H.; et al. Quantitative assessment of hydrate blockage risk in pipelines based on reliability theory. J. Nat. Gas Sci. Eng. 2022, 98, 104345. [Google Scholar] [CrossRef]
- Escarameia, M. Air Problems in Pipelines—A Design Manual; HR Wallingford Ltd.: Oxford, UK, 2005; p. 49. [Google Scholar]
- Mays, L.W. Water Distribution Systems Handbook; Mays, L.W., Ed.; McGraw-Hill: New York, NY, USA, 2000. [Google Scholar]
- Boulos, P.; Lansey, K.; Karney, B. Comprehensive Water Distribution Systems Analysis Handbook for Engineers and Planners, 2nd ed.; MWH Soft: Pasadena, CA, USA, 2006. [Google Scholar]
- Soini, S.; Koskinen, K.; Vilenius, M.; Puhakka, J. Effects of fluid-flow velocity and water quality on planktonic and sessile microbial growth in water hydraulic system. Water Res. 2002, 36, 3812–3820. [Google Scholar] [CrossRef] [PubMed]
- Likitha, J.; Savitha, M.; Karthik, M.; Kavya, P.; Usha, G. CFD analysis on different shapes of concentric orifice plate for turbulent flow. Int. J. Eng. Res. Technol. 2018, 7, 421–426. [Google Scholar]
- Zain, R.; Terry, A.; Dahing, N.S.; Yusoff, N.; Yahya, R.; Dahing, L.N.S.; Rahman, M.; Mustapha, I.; Hassan, N.; Chik, E.; et al. Technical aspect on procedure of gamma-ray pipeline inspection. In Proceedings of the Nuclear Technical Convention 2015 (NTC 2015), Bangi, Malaysia, 3–5 November 2015; pp. 1–5. [Google Scholar]
- Rogers, L. Pipeline blockage location by strain measurement using a ROV. In Proceedings of the Offshore Technology Conference, Houston, TX, USA, 1–4 May 1995. [Google Scholar] [CrossRef]
- Qunli, W. Reconstruction of blockage in a duct from single spectrum. Appl. Acoust. 1994, 41, 229–236. [Google Scholar] [CrossRef]
- Qunli, W.; Fricke, F. Estimation of blockage dimensions in a duct using measured eigenfrequency shifts. J. Sound Vib. 1989, 133, 289–301. [Google Scholar] [CrossRef]
- Brunone, B.; Capponi, C.; Meniconi, S. Design criteria and performance analysis of a smart portable device for leak detection in water transmission mains. Measurement 2021, 183, 109844. [Google Scholar] [CrossRef]
- Meniconi, S.; Brunone, B.; Tirello, L.; Rubin, A.; Cifrodelli, M.; Capponi, C. Transient tests for checking the Trieste subsea pipeline: Toward field tests. J. Mar. Sci. Eng. 2024, 12, 374. [Google Scholar] [CrossRef]
- Meniconi, S.; Brunone, B.; Tirello, L.; Rubin, A.; Cifrodelli, M.; Capponi, C. Transient tests for checking the Trieste subsea pipeline: Diving into fault detection. J. Mar. Sci. Eng. 2024, 12, 391. [Google Scholar] [CrossRef]
- Kim, S. Inverse transient analysis for a branched pipeline system with leakage and blockage using impedance method. Procedia Eng. 2014, 89, 1350–1357. [Google Scholar] [CrossRef]
- Kim, D.S.; Shin, S.; Choi, G.B.; Jang, K.H.; Suh, J.C.; Lee, J.M. Diagnosis of partial blockage in water pipeline using support vector machine with fault-characteristic peaks in frequency domain. Can. J. Civ. Eng. 2017, 44, 707–714. [Google Scholar] [CrossRef]
- Mohapatra, P.K.; Chaudhry, M.H. Frequency responses of single and multiple partial pipeline blockages. J. Hydraul. Res. 2011, 49, 263–266. [Google Scholar] [CrossRef]
- Guo, X.; Zhao, L.; Cao, Z.; Deng, J. The development and application of transient-based leak detection methods in pressurized liquid pipelines: A review. Measurement 2025, 257, 118867. [Google Scholar] [CrossRef]
- Ayati, A.H.; Haghighi, A.; Lee, P.J. Statistical review of major standpoints in hydraulic transient-based leak detection. J. Hydraul. Struct. 2019, 5, 1–26. [Google Scholar] [CrossRef]
- Colombo, A.F.; Lee, P.; Karney, B.W. A selective literature review of transient-based leak detection methods. J. Hydro-Environ. Res. 2009, 2, 212–227. [Google Scholar] [CrossRef]
- Xu, X.; Karney, B. An overview of transient fault detection techniques. In Modeling and Monitoring of Pipelines and Networks: Advanced Tools for Automatic Monitoring and Supervision of Pipelines; Verde, C., Torres, L., Eds.; Applied Condition Monitoring; Springer International Publishing: Berlin/Heidelberg, Germany, 2017; pp. 13–37. [Google Scholar] [CrossRef]
- Brunone, B.; Ferrante, M.; Meniconi, S. Discussion of “Detection of partial blockage in single pipelines” by P. K. Mohapatra, M. H. Chaudhry, A. A. Kassem, and J. Moloo. J. Hydraul. Eng. 2008, 134, 872–874. [Google Scholar] [CrossRef]
- Martins, N.M.C.; Covas, D.I.C.; Brunone, B.; Meniconi, S.; Capponi, C. Transient response of discrete partial blockages in laminar pressurized flow: Insights into pressure and velocity variations by Computational Fluid Dynamics. Phys. Fluids 2024, 36, 106112. [Google Scholar] [CrossRef]
- Jasak, H. OpenFOAM: Open Source CFD in Research and Industry. Technical Report, International Workshop on Coupled Methods in Numerical Dynamics, 2009. Available online: https://openfoam.org (accessed on 1 January 2025).
- Weller, H.G.; Tabor, G.; Jasak, H.; Fureby, C. A tensorial approach to computational continuum mechanics using object-oriented techniques. Comput. Phys. 1998, 12, 620–631. [Google Scholar] [CrossRef]
- Yang, L.; Fu, H.; Liang, H.; Wang, Y.; Han, G.; Ling, K. Detection of pipeline blockage using lab experiment and computational fluid dynamic simulation. J. Pet. Sci. Eng. 2019, 183, 106421. [Google Scholar] [CrossRef]
- Denton, J.D.; Dawes, W.N. Computational Fluid Dynamics for turbomachinery design. Proc. Inst. Mech. Eng. Part J. Mech. Eng. Sci. 1998, 213, 107–124. [Google Scholar] [CrossRef]
- Fay, J.A. Introduction to Fluid Mechanics; MIT Press: London, UK, 1994. [Google Scholar]
- White, F.M. Viscous Fluid Flow, 2nd ed.; McGraw-Hill: Columbus, OH, USA, 1991. [Google Scholar]
- Martins, N.M.C.; Covas, D.I.C.; Meniconi, S.; Capponi, C.; Brunone, B. Hydrodynamics of laminar pipe flow through an extended partial blockage by CFD. J. Hydroinform. 2023, 25, 2268–2280. [Google Scholar] [CrossRef]
- Martins, N.M.C.; Covas, D.I.C.; Capponi, C.; Meniconi, S.; Brunone, B. Unified approach for damping rate of transient laminar flow: Experiments, Computational Fluid Dynamics, one-dimensional, and global models. J. Fluids Eng. 2024, 146, 1–32. [Google Scholar] [CrossRef]
- Chaudhry, M.H. Applied Hydraulic Transients, 3rd ed.; Springer: New York, NY, USA, 2014. [Google Scholar] [CrossRef]
- Acharya, S.; Baliga, B.R.; Karki, K.; Murthy, J.Y.; Prakash, C.; Vanka, S.P. Pressure-Based Finite-Volume Methods in Computational Fluid Dynamics. J. Heat Transf. 2007, 129, 407–424. [Google Scholar] [CrossRef]
- Ushakova, O.V. Advances in Grid Generation; Nova Science Publishers Inc.: Hauppauge, NY, USA, 2007. [Google Scholar]
- Martins, N.M.C.; Carriço, N.J.G.; Ramos, H.M.; Covas, D.I.C. Velocity distribution in pressurized pipe flow using CFD: Accuracy and mesh analysis. Comput. Fluids 2014, 105, 218–230. [Google Scholar] [CrossRef]
- Oh, H.W. Applied Computational Fluid Dynamics; IntechOpen: London, UK, 2012. [Google Scholar]
- Zampaglione, D. Sul moto di una corrente laminare attraverso diaframmi. L’Energia Elettr. 1969, 66, 821–828. (In Italian) [Google Scholar]
- Johansen, F.C. Flow through pipe orifices at low Reynolds numbers. Proc. R. Soc. London Ser. 1997, 126, 231–245. [Google Scholar] [CrossRef]
- Hasegawa, T.; Suganuma, M.; Watanabe, H. Anomaly of excess pressure drops of the flow through very small orifices. Phys. Fluids 1997, 9, 1–3. [Google Scholar] [CrossRef]
- Sahin, B.; Ceyhan, H. Numerical and experimental analysis of laminar flow through square-edged orifice with variable thickness. Trans. Inst. Meas. Control 1996, 18, 166–174. [Google Scholar] [CrossRef]
- Jankowski, T.A.; Schmierer, E.N.; Prenger, F.C.; Ashworth, S.P. A series pressure drop representation for flow through orifice tubes. J. Fluids Eng. 2008, 130, 1–7. [Google Scholar] [CrossRef]
- Kiljanski, T. Discharge coefficient for free jets from orifices at low Reynolds number. J. Fluids Eng. 1993, 115, 778–781. [Google Scholar] [CrossRef]
- Alvi, S.H.; Sridharan, K.; Lakshmana Rao, N.S. Loss characteristics of orifices and nozzles. J. Fluids Eng. 1978, 100, 299–307. [Google Scholar] [CrossRef]
- Martins, N.M.C.; Covas, D.I.C.; Meniconi, S.; Capponi, C.; Brunone, B. Characterisation of low-Reynolds number flow through an orifice: CFD results vs. laboratory data. J. Hydroinform. 2021, 23, 709–723. [Google Scholar] [CrossRef]
- Martins, N.M.C.; Brunone, B.; Meniconi, S.; Ramos, H.M.; Covas, D.I.C. CFD and 1D approaches for the unsteady friction analysis of low Reynolds number turbulent flows. J. Hydraul. Eng. 2017, 143, 04017050. [Google Scholar] [CrossRef]
- Brunone, B.; Maietta, F.; Capponi, C.; Duan, H.F.; Meniconi, S. Detection of partial blockages in pressurized pipes by transient tests: A review of the physical experiments. Fluids 2023, 8, 19. [Google Scholar] [CrossRef]
Disclaimer/Publisher’s Note: The statements, opinions and data contained in all publications are solely those of the individual author(s) and contributor(s) and not of MDPI and/or the editor(s). MDPI and/or the editor(s) disclaim responsibility for any injury to people or property resulting from any ideas, methods, instructions or products referred to in the content. |
© 2025 by the authors. Licensee MDPI, Basel, Switzerland. This article is an open access article distributed under the terms and conditions of the Creative Commons Attribution (CC BY) license (https://creativecommons.org/licenses/by/4.0/).