Abstract
The mite Varroa destructor, the main ectoparasite of honey bees, is a threat to apiculture worldwide. Understanding the ecological interactions between Varroa and honeybees is fundamental for reducing mite impact in apiaries. This work assesses bee colonies with various Varroa infestation levels in apiaries to determine: (1) the relationship between multi-infested brood cells and brood infestation level, (2) the damage caused by Varroa to parasitized honey bee pupae, and (3) mite reproduction rate at various infestation levels. Data were collected from 19 worker brood combs, each from a different colony, ranging from 160 to 1725 (mean = 706) sealed cells per comb. Mite distribution was aggregated, ranging from about 2% to 74% infested cells per comb. The percentage of cells invaded by one, two, three, four, or more than four foundress mites, as a function of infestation level, was estimated by five highly significant (p < 0.0001) second-degree polynomial regression equations. The correction factors found could increase the precision of prediction models. Varroa fertility and adult bee longevity decreased as multi-infestation levels increased, and the implications of this relationship are discussed. Finally, these findings could improve sampling methods and the timing of mite treatments in apiaries, thus favoring sustainable management strategies.
Keywords:
mite; reproductive rate; worker brood; infestation level; longevity; distribution; model; Apis mellifera 1. Introduction
The parasitic mite Varroa destructor was originally confined to the Eastern honey bee Apis cerana [1]. After a shift to a new host, A. mellifera, and a worldwide dispersion, this mite has become the most serious threat to honeybees [1,2]. Varroa has had a fundamental role in the decline of honeybee colonies observed all over the Northern Hemisphere in the last few decades [3,4].
Many factors of the host and the parasite affect the population growth of Varroa in honeybee colonies [5,6], such as the worker brood availability. In fact, the number of brood cells and/or the fertility of the mites and population growth are significantly correlated [7,8,9]. Therefore, it is likely that the population dynamic of the bee colony significantly influences the development of Varroa infestation. It is known that the average number of adult female offspring produced by a single mother mite invading a worker brood cell ranges between 1.2–1.5, whereas this reproduction rate rises to 2.2–2.6 in drone brood cells due to their longer capping period [10,11,12]. Moreover, in multiple-infested brood cells, the reproductive rate per female mite is significantly reduced [12,13,14,15]. Consequently, the number of brood cells throughout the season, the temporal pattern of brood availability, and the percentage of drone brood, among other factors [1], can have an impact on the reproduction of the Varroa population. This is described in some population dynamic models of Varroa mites and honeybees [12,16,17]. Furthermore, in the honey bee brood, it is not uncommon to find sealed cells with bee larvae infested by two, three, or more female mites, while many other cells remain uninfested. This suggests that the distribution of the mite among brood cells is not random but, rather, aggregated [18,19,20,21]. However, it should also be pointed out that some other studies do not support the aggregation hypothesis [12,22]. Differences in the statistical approach and data collection methods adopted probably led to different interpretations in these studies. Despite that, what clearly emerges statistically is that the mean values of brood infestation are always lower than the respective variances, which is a basic assumption to demonstrate the tendency to aggregation from an ecological point of view [23,24].
An aspect that remains to be explained is the different attractiveness of the brood cells, which is at the basis of the aggregation behavior, such as possible chemical sources of attractiveness [2]. Aggregation could favor exogamy and may have an adaptive value for Varroa, but it is unknown whether this phenomenon is related to an aggregation pheromone, to the higher attractiveness of certain bee larvae, or to other biotic and abiotic factors [2].
One of the main sources of error in the application of sampling techniques is the aggregate distribution, especially when cutting honeycomb parts [25,26]. In fact, the variability of infestation between different areas of the same comb or between different combs [27,28], due to the irregular distribution of Varroa, may lead to substantial differences in sampling results. An accurate estimation of brood infestation, based on precise knowledge of the mite spatial distribution pattern and its interpretation by specific models (e.g., Iwao’s regression method [20]), favors the development adoption of appropriate sampling plans (e.g., stratified random sampling, cross sampling or, for practical purposes, sequential sampling) [19,20,26]. Better understanding the basic ecology of the mite is useful for several other reasons: (1) the correct estimation of the infestation level of the brood can help to determine the most appropriate timing of treatments used for Varroa control, as done in the sustainable integrated pest management (IPM); (2) the damage caused by Varroa to larvae or pupae depends on the infestation level and the number of mites entering the cell, as demonstrated by the correlations between pathogen loads (positive) or colony strength (negative) and Varroa infestation rate [29,30]; thus, knowing the mite distribution pattern can be useful in determining the extent of brood damage as a function of infestation level; (3) an accurate estimate of the percentage of cells with a specific number of female mites allows us to correctly assess the Varroa reproduction rate because the increased competition among the offspring mites for food and space in a multi-infested cell can decrease mite fertility. In fact, in multiple-invaded drone and worker brood cells, the reproductive rate per female mite is significantly reduced [12,14,15,31].
The available predictive models of mite dynamics [11,12,16,17,32] do not consider the effects of multi-infested brood cells on the development of Varroa infestation, thus associating mite growth rates simply with brood availability (distinguishing only between male and female brood), or they refer to a Poisson distribution, which is not accurate enough to represent the real behavior of Varroa in bee brood [33]. Some studies have shown an aggregated distribution of Varroa in the brood [19,20], associated with increases in multi-infestation as population density grows, with consequent effects on mite development and reproduction rate, as well as on the extent of damage to bee colonies. It is important to highlight that in environmental conditions favorable for the constant presence of brood in the hives throughout seasons, such as in the Mediterranean area, it is crucial to correctly estimate the percentage of cells infested by one or more mites [34]. This allows for the definition of more realistic simulation models of the development dynamic of Varroa, in line with its statistical spatial distribution, thus promoting more sustainable and efficient mite control.
This work assesses bee colonies with various levels of natural infestations by Varroa in apiaries to determine: (1) the relationship between multi-infested brood cells and brood infestation level, (2) the damage caused by Varroa to parasitized honey bee pupae in terms of bee longevity, and (3) the effect of infestation level on mite reproduction rate. Based on data collected from numerous worker brood combs with percentages of infested cells ranging from about 2% to 74%, five second-degree polynomial regression equations were developed to estimate the percentage of cells invaded by one, two, three, four, and more than four foundress mites according to the infestation level. The work also discusses the implications of these relationships on the reduction of Varroa fertility and longevity of adult bees. Our findings could favor sustainable management strategies by improving predictive models, sampling methods, and timing of mite treatments in apiaries.
2. Materials and Methods
The work was carried out in the experimental apiary of the University of Sassari located in Ottava (40°46′23″ N; 8°29′34″ E), Province of Sassari, Italy, from late summer to early fall (September–October) in 2018. The apiary was composed of A. mellifera colonies kept in Dadant–Blatt standard hives naturally infested by Varroa, at various infestation levels.
In total, 19 combs containing worker sealed brood were taken from the central position of the nest of 19 hives, 3 days after cell sealing started, and maintained at −20 °C until inspection. For each honeycomb, all sealed brood cells were inspected, and the number of foundress mites present in each infested cell was recorded. The number of sealed brood cells in each comb ranged from 160 (comb no. 18) to 1725 (comb no. 2), with an average value of 706 (Table 1).

Table 1.
The number of sealed and infested brood cells and foundress mites obtained by inspecting 19 combs sampled from 19 different colonies of honey bees naturally infested by Varroa in the apiary. The percentage of infestation and the mean number of foundress mites per infested cell were calculated for each comb.
The following descriptive variables were calculated for each comb: (a) the total number of sealed brood cells, (b) the total number of female (foundress) mites, (c) the average number of female mites per brood cell, and (d) the number and percentage of cells containing one, two, three, four, and more than four foundress mites per cell. These data were used to derive second-degree polynomial regression equations to correlate the average number of foundress mites per infested cell with the percentage of cells containing one, two, three, four, or more than four foundress mites per cells, separately.
The regression equations obtained were used to derive two other second-degree regression equations, useful to describe the mean reproduction rate (fecundity) of female mites and the percentage of longevity reduction of adult bees parasitized by mites in the preimaginal stage as a function of the mean number of mother mites per infested cell. In order to develop these two equations, we simulated 17 different distributions of foundress mites, considering a constant number of cells available for invasion (1000) and an increasing number of mites (from 10 to 2500). After that, the average fecundity of foundress mites for each mite distribution was calculated considering the following average values of mite offspring: 1.45, 1.32, 1.25, 0.87, and 0 mites in cells with one, two, three, four, and more than four foundress mites, respectively [12]. To calculate the average longevity of workers that have emerged from the infested cells, the following percentage reduction in lifespan was considered: 2%, 10%, 20%, 40%, and 80% in cells with one, two, three, four, and more than four foundress mites, respectively [16].
Data availability: The complete datasets analyzed during the current study are available from the corresponding author on reasonable request.
3. Results
The number of sealed brood cells, infested brood cells, and foundress mites in each of the 19 inspected combs, the percentage of infestation per comb, and the mean number of female mites per infested cell are given in Table 1. The infestation level of Varroa ranged from 1.7% to 74.3% in the inspected combs, and the mean number of foundress mites per infested cell varied from 1 to 2.8 (Table 1). Between these last two variables, a highly significant, linear and positive, relationship (Df = 1; F = 277.4; p < 0.00001) was observed (Figure 1), with approximately 94% of the variability of the mean number of foundress mites per infested cell explained by the infestation level (R2 = 0.942). This relationship clearly shows that as the level of infestation increases, the phenomenon of multi-infestation increases.
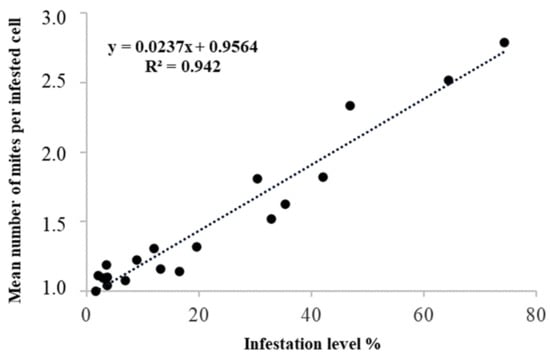
Figure 1.
Relationship between the percentage of Varroa infestation level and the mean number of foundress mites per infested cells of worker brood.
From the raw data, we calculated, for each infestation level, the percentage of cells with one, two, three, four, and more than four foundress mites. Then, we correlated these parameters with the mean number of female mites per infested cells. The equations that better fitted the relationship between these variables were second-degree polynomials, as shown in Figure 2.
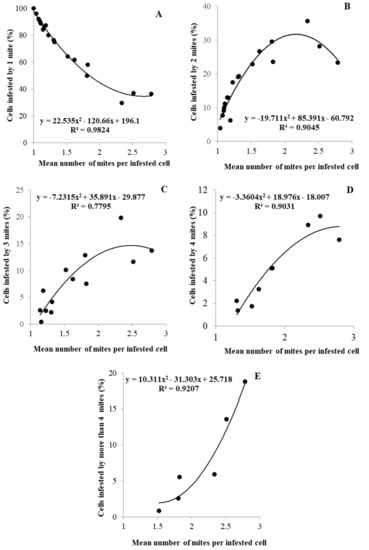
Figure 2.
Relationship between the mean number of foundress mites per infested worker brood cells and the percentage of cells invaded by one (A), two (B), three (C), four (D), and more than four (E) foundress mite. In each graph, each dot represents a colony.
The second-degree polynomial curves (Figure 2A–E), all highly significant (p < 0.0001), allow us to evaluate the distribution of the foundress mites inside the brood cells for different infestation levels. In fact, we can observe that when the level of infestation increases, the progressive decrease in the percentage of cells containing only one mother mite (R2 = 0.9824; Figure 2A) is compensated by the growth of cells containing two (R2 = 0.9045; Figure 2B), three (R2 = 0.7795; Figure 2C), four (R2 = 0.9031; Figure 2D) or more than four (R2 = 0.9207; Figure 2E) foundress mites.
Considering that the Varroa reproduction rate decreases with increasing multi-infestation, if the distribution of multi-infested cells is known for each infestation level, we can also calculate the average reproduction rate of Varroa. For this purpose, by simulating a series of mite distributions at levels of growing infestation (n = 17), a regression curve was derived to express the negative relationship between the average fecundity per female mite and the average number of foundress mites for infested cell (R2 = 0.9989; Figure 3). The same criterion used above was applied to derive a regression curve describing the decrease in the longevity of adult bees as a function of the average number of mites per infested cell (R2 = 0.9993; Figure 4). In this case, the information obtained could be used to better understand the effects of the increasing infestation levels on the bee population dynamic.
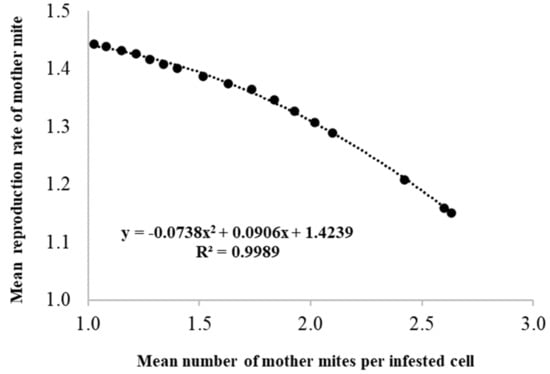
Figure 3.
Relationship between the mean number of foundress mites per infested cells of worker brood and the reduction of their reproduction rate.
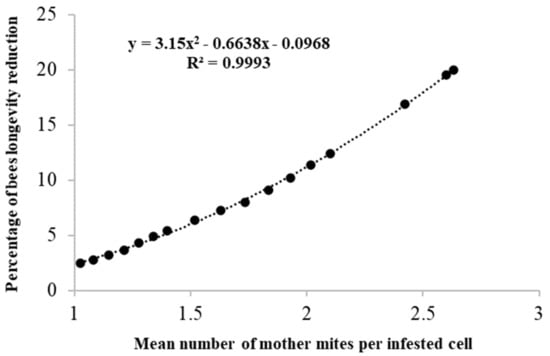
Figure 4.
Relationship between the mean number of foundress mites per infested cells of worker brood and the longevity reduction of honeybee adults.
4. Discussion
Based on the data collected under our specific experimental conditions, our findings suggest applications of practical relevance in terms of improving Varroa control strategies. Differences due to seasonal or environmental variations are possible but likely limited to the range of infestation levels detected. In fact, these differences should not affect the relationship between infestation and multi-infestation levels nor the effects of multi-infestation because the latter is proven to be density-dependent [13]. This is clearly evidenced by the observed increase in multi-infestation as the infestation level increases. This phenomenon also has important effects on the genetic structure of the population of Varroa. In fact, as observed by Beaurepaire et al. [35], the increase in the co-infestation rate of brood cells also coincides with an increase in the recombined lines in the mite populations. Therefore, if treatments against Varroa are carried out before the recombination phase has taken place, the inbreeding will greatly promote the fixation of the alleles for acaricide resistance [35]. Furthermore, based on the model of De Grandi-Hoffmann and Curry [16], control treatments applied against Varroa in late summer provide the best chances for the survival of heavily infested colonies. Therefore, surveys conducted in late summer, as in our case, are particularly important in Mediterranean environments. However, it should also be considered that colony survival thresholds for mite populations and the effectiveness of miticides are dependent on the climate and the yearly brood dynamic.
The analysis of the data collected in our study revealed, according to the principles established by ecological methods [23,24], an aggregate distribution of Varroa in the brood. Such distribution can be interpreted by different models, such as Iwao’s regression method, the negative binomial, and other interpretative models [19,20]. The aggregate distribution of the mite in the brood is associated with multi-infestation, with mites tending to concentrate in some areas of the brood comb, thus increasing the possibility that some of them may invade the same cell. However, the factors causing mite aggregation are still unknown [2].
Among the possible applications of our findings, the definition of more precise prediction models for the development of Varroa infestation is one of the most interesting aspects. In fact, based on our second-degree polynomial curves it could be possible to define the distribution of female mites in brood cells and their rate of reproduction for each level of infestation. Therefore, these equations provide significant correction factors, previously unknown in the literature, to define the evolution of Varroa infestation, better representing the behavior of the mite in apiary conditions. In addition, the information obtained in the reduction of adult bee longevity as a function of the average number of mites per infested cell, could be used to better understand the effects of the increasing infestation levels on bee population dynamic. Differently from previous studies, in our work, all the cells of the combs were examined according to their natural distribution, without preselection of combs or honeycomb areas with cells of the same age and so on, and the observations were not conducted under laboratory conditions. Therefore, our data reflect the natural behavior of the mite in honeybee colonies in their environment.
Our findings also have an important practical and scientific impact on the definition of more appropriate and precise sampling methods. In particular, the detected aggregated mite distribution suggests, from a statistical point of view, the need for a stratified sampling for a correct evaluation of brood infestation level. For practical purposes, sequential sampling [19,20], based on predefined infestation thresholds, is appropriate, whereas for experimental designs, crossed sampling [36] is recommended.
Finally, knowing the levels of Varroa infestation in apiaries and understanding the effects of their presence on beehives allows us to make correct decisions on treatment timing. This is particularly important in areas where bee brood are constantly present in the hives during the year, as in the case of Mediterranean environments, where chemical treatments are still the main means to control Varroa mite infestations, with the aim of limiting undesirable toxicological and pathological side effects of the applied products and of the mite infestation, respectively.
Author Contributions
Conceptualization and design of the work, I.F., M.P., and A.S.; investigation, data curation, and formal analysis, M.P. and A.S.; funding acquisition, writing—original draft preparation, and supervision, I.F.; writing—review and editing, M.P. and A.S. All authors have read and agreed to the published version of the manuscript.
Funding
This research was funded by Università degli Studi di Sassari “Fondo di Ateneo per la ricerca”.
Acknowledgments
The authors thank Ana Helena Dias Francesconi from the University of Sassari for revising the manuscript.
Conflicts of Interest
The authors declare no conflict of interest.
References
- Rosenkranz, P.; Aumeier, P.; Ziegelmann, B. Biology and control of Varroa destructor. J. Invertebr. Pathol. 2010, 103, S96–S119. [Google Scholar] [CrossRef]
- Nazzi, F.; Le Conte, Y. Ecology of Varroa destructor, the major ectoparasite of the Western Honey Bee, Apis mellifera. Annu. Rev. Entomol. 2016, 61, 417–432. [Google Scholar] [CrossRef]
- Le Conte, Y.; Ellis, M.; Ritter, W. Varroa mites and honey bee health: Can Varroa explain part of the colony losses? Apidologie 2010, 41, 353–363. [Google Scholar] [CrossRef]
- Neumann, P.; Carreck, N.L. Honey bee colony losses. J. Apic. Res. 2010, 49, 1–6. [Google Scholar] [CrossRef]
- Calis, J.N.M.; Fries, I.; Ryrie, S.C. Population modelling of Varroa jacobsoni Oud. Apidologie 1999, 38, 111–124. [Google Scholar] [CrossRef]
- Fries, I.; Camazine, S.; Sneyd, J. Population Dynamics of Varroa jacobsoni: A Model and a Review. Bee World 1994, 75, 5–28. [Google Scholar] [CrossRef]
- Arechavaleta-Velasco, M.E.; Guzman-Novoa, E. Relative effect of four characteristics that restrain the population growth of the mite Varroa destructor in honey bee (Apis mellifera) colonies. Apidologie 2001, 32, 157–174. [Google Scholar] [CrossRef]
- Harris, J.W.; Harbo, J.R.; Villa, J.D.; Danka, R.G. Variable population growth of Varroa destructor (Mesostigmata: Varroidae) in colonies of honey bees (Hymenoptera: Apidae) during a 10-year period. Environ. Entomol. 2003, 32, 1305–1312. [Google Scholar] [CrossRef]
- Lodesani, M.; Crailsheim, K.; Moritz, R.F.A. Effect of some characters on the population growth of mite Varroa jacobsoni in Apis mellifera L. colonies and results of a bi-directional selection. J. Appl. Entomol. 2002, 126, 130–137. [Google Scholar] [CrossRef]
- Boot, W.J.; Schoenmaker, J.; Calis, J.N.M.; Beetsma, J. Invasion of Varroa jacobsoni into drone brood cells of the honey bee, Apis mellifera. Apidologie 1995, 26, 109–118. [Google Scholar] [CrossRef]
- Martin, S.J. Ontogenesis of the mite Varroa jacobsoni Oud. in worker brood of the honeybee Apis mellifera L. under natural conditions. Exp. Appl. Acarol. 1994, 18, 87–100. [Google Scholar] [CrossRef]
- Martin, S.J. Reproduction of Varroa jacobsoni in cells of Apis mellifera containing one or more mother mites and the distribution of these cells. J. Apic. Res. 1995, 34, 187–196. [Google Scholar] [CrossRef]
- Fuchs, S.; Langenbach, K. Multiple infestation of Apis mellifera L. brood cells and reproduction in Varroa jacobsoni Oud. Apidologie 1989, 20, 257–266. [Google Scholar] [CrossRef]
- Martin, S.J.; Medina, L.M. Africanized honey bees have unique tolerance to Varroa mites. Trends Parasitol. 2004, 20, 112–114. [Google Scholar] [CrossRef]
- Mondragon, L.; Martin, S.; Vandame, R. Mortality of mite offspring: A major component of Varroa destructor resistance in a population of Africanized bees. Apidologie 2006, 37, 67–74. [Google Scholar] [CrossRef]
- DeGrandi-Hoffman, G.; Curry, R. A mathematical model of Varroa mite (Varroa destructor Anderson and Trueman) and honeybee (Apis mellifera L.) population dynamics. Int. J. Acarol. 2004, 30, 259–274. [Google Scholar] [CrossRef]
- Martin, S.J. A population model for the ectoparasitic mite Varroa jacobsoni in honey bee (Apis mellifera) colonies. Ecol. Model. 1998, 109, 267–281. [Google Scholar] [CrossRef]
- Chiesa, F.; Milani, N. Some preliminary observations on the behaviour of Varroa jacobsoni Oud. on its natural host under laboratory conditions. In European Research on Varroatosis Control; Cavalloro, R., Ed.; Balkema: Rotterdam, The Netherlands, 1988; pp. 113–124. [Google Scholar]
- Floris, I. Dispersion indices and sampling plans for the honeybee (Apis mellifera ligustica Spin.) mite Varroa jacobsoni Oud. Apicoltura 1991, 7, 161–170. [Google Scholar]
- Floris, I. A sequential sampling technique for female adult mites of Varroa jacobsoni Oudemans in the sealed worker brood of Apis mellifera ligustica Spin. Apidologie 1997, 28, 63–70. [Google Scholar] [CrossRef]
- Fuchs, S. Untersuchungen. zur quantitativen Abschägtzung des Befalls von Bienenvölkern mit Varroa jacobsoni Oudemans und zur Verteilung des Parasiten im Bienenvolk. Apidologie 1985, 16, 343–368. [Google Scholar] [CrossRef]
- Salvy, M.; Capowiez, Y.; Le Conte, Y.; Clément, J.L. Does the spatial distribution of the parasitic mite Varroa jacobsoni Oud. (Mesostigmata: Varroidae) in worker brood of honey bee Apis mellifera L. (Hymenoptera: Apidae) rely on an aggregative process? Naturwissenschaften 1999, 86, 540–543. [Google Scholar] [CrossRef] [PubMed]
- Southwood, T.R.E. Ecological Methods; Chapman and Hall: London, UK, 1970. [Google Scholar]
- Taylor, L.R. Assessing and interpreting the spatial distributions of insect populations. Ann. Rev. Entomol. 2016, 29, 321–357. [Google Scholar] [CrossRef]
- Accorti, M.; Barbattini, R.; Marchetti, S. La diagnosi ed il controllo di Varroa jacobsoni Oud. in campo: Proposta di unificazione delle metodologie nelle prove sperimentali. Apicoltura 1986, 2, 165–185. [Google Scholar]
- Dietemann, V.; Nazzi, F.; Martin, S.J.; Anderson, D.L.; Locke, B.; Delaplane, K.S.; Wauquiez, Q.; Tannahill, C.; Frey, E.; Ziegelmann, B.; et al. Standard methods for varroa research. J. Apic. Res. 2015, 52, 1–54. [Google Scholar] [CrossRef]
- Pappas, N.; Thrasyvoulou, A. Searching for an accurate method to evaluate the degree of Varroa infestation in honeybee colonies. In European Research on Varroatosis; Cavalloro, R., Ed.; Balkema: Rotterdam, The Netherlands, 1988; pp. 85–92. [Google Scholar]
- Rosenkranz, P. Distribution of Varroa females within the honeybee brood nest and consequences for biological control. Experts meeting CCE. In Proceedings of the Research Activities on Varroatosis in the European Countries, Thessaloniki, Greece, 26–28 September 1984. [Google Scholar]
- Natsopoulou, M.E.; McMahon, D.P.; Doublet, V.; Frey, E.; Rosenkranz, P.; Paxton, R.J. The virulent, emerging genotype B of Deformed wing virus is closely linked to overwinter honeybee worker loss. Sci. Rep. 2017, 7, 5242. [Google Scholar] [CrossRef]
- Barroso-Arévalo, S.; Fernández-Carrión, E.; Goyache, J.; Molero, F.; Puerta, F.; Sánchez-Vizcaíno, J.M. High load of Deformed wing virus and Varroa destructor infestation are related to weakness of honey bee colonies in Southern Spain. Front. Microbiol. 2019, 10, 1331. [Google Scholar] [CrossRef]
- Martin, S.J. The role of Varroa and viral pathogens in the collapse of honey bee colonies: A modeling approach. J. Appl. Ecol. 2001, 38, 1082–1093. [Google Scholar] [CrossRef]
- Wilkinson, D.; Smith, G.C. A model of the mite parasite, Varroa destructor, on honeybees (Apis mellifera) to investigate parameters important to mite population growth. Ecol. Model. 2002, 148, 263–275. [Google Scholar] [CrossRef]
- Fuchs, S. The distribution of Varroa jacobsoni on honeybee brood combs and within brood cells as a consequence of fluctuation infestation rates. In European Research on Varroatosis Control; Cavalloro, R., Ed.; Balkema: Rotterdam, The Netherlands, 1988; pp. 15–17. [Google Scholar]
- Boot, W.J.; Sisselaar, D.J.A.; Calis, J.N.M.; Beetsma, J. Factors affecting invasion of Varroa jacobsoni (Acari: Varroaidae) into honey bee, Apis mellifera (Hymenoptera: Apidae), brood cells. Bull. Entomol. Res. 1994, 84, 3–10. [Google Scholar] [CrossRef]
- Beaurepaire, A.L.; Krieger, K.J.; Moritz, R.F. Seasonal cycle of inbreeding and recombination of the parasitic mite Varroa destructor in honeybee colonies and its implications for the selection of acaricide resistance. Infect. Genet. Evol. 2017, 50, 49–54. [Google Scholar] [CrossRef]
- Floris, I. Osservazioni sull’infestazione da Varroa jacobsoni Oud di covata femminile opercolata di Apis mellifera ligustica Spin. In Proceedings of the Convegno Stato attuale e sviluppo della ricerca in apicoltura, Sassari, Italy, 25–26 October 1991; pp. 87–98. [Google Scholar]


© 2020 by the authors. Licensee MDPI, Basel, Switzerland. This article is an open access article distributed under the terms and conditions of the Creative Commons Attribution (CC BY) license (http://creativecommons.org/licenses/by/4.0/).