
An Evaluation of the OpenWeatherMap API versus INMET Using Weather Data from Two Brazilian Cities: Recife and Campina Grande

 , , ,
, , ,  , ,
, ,  ,
,  and
and
Abstract
:1. Background and Summary
2. Methods
2.1. Data Records
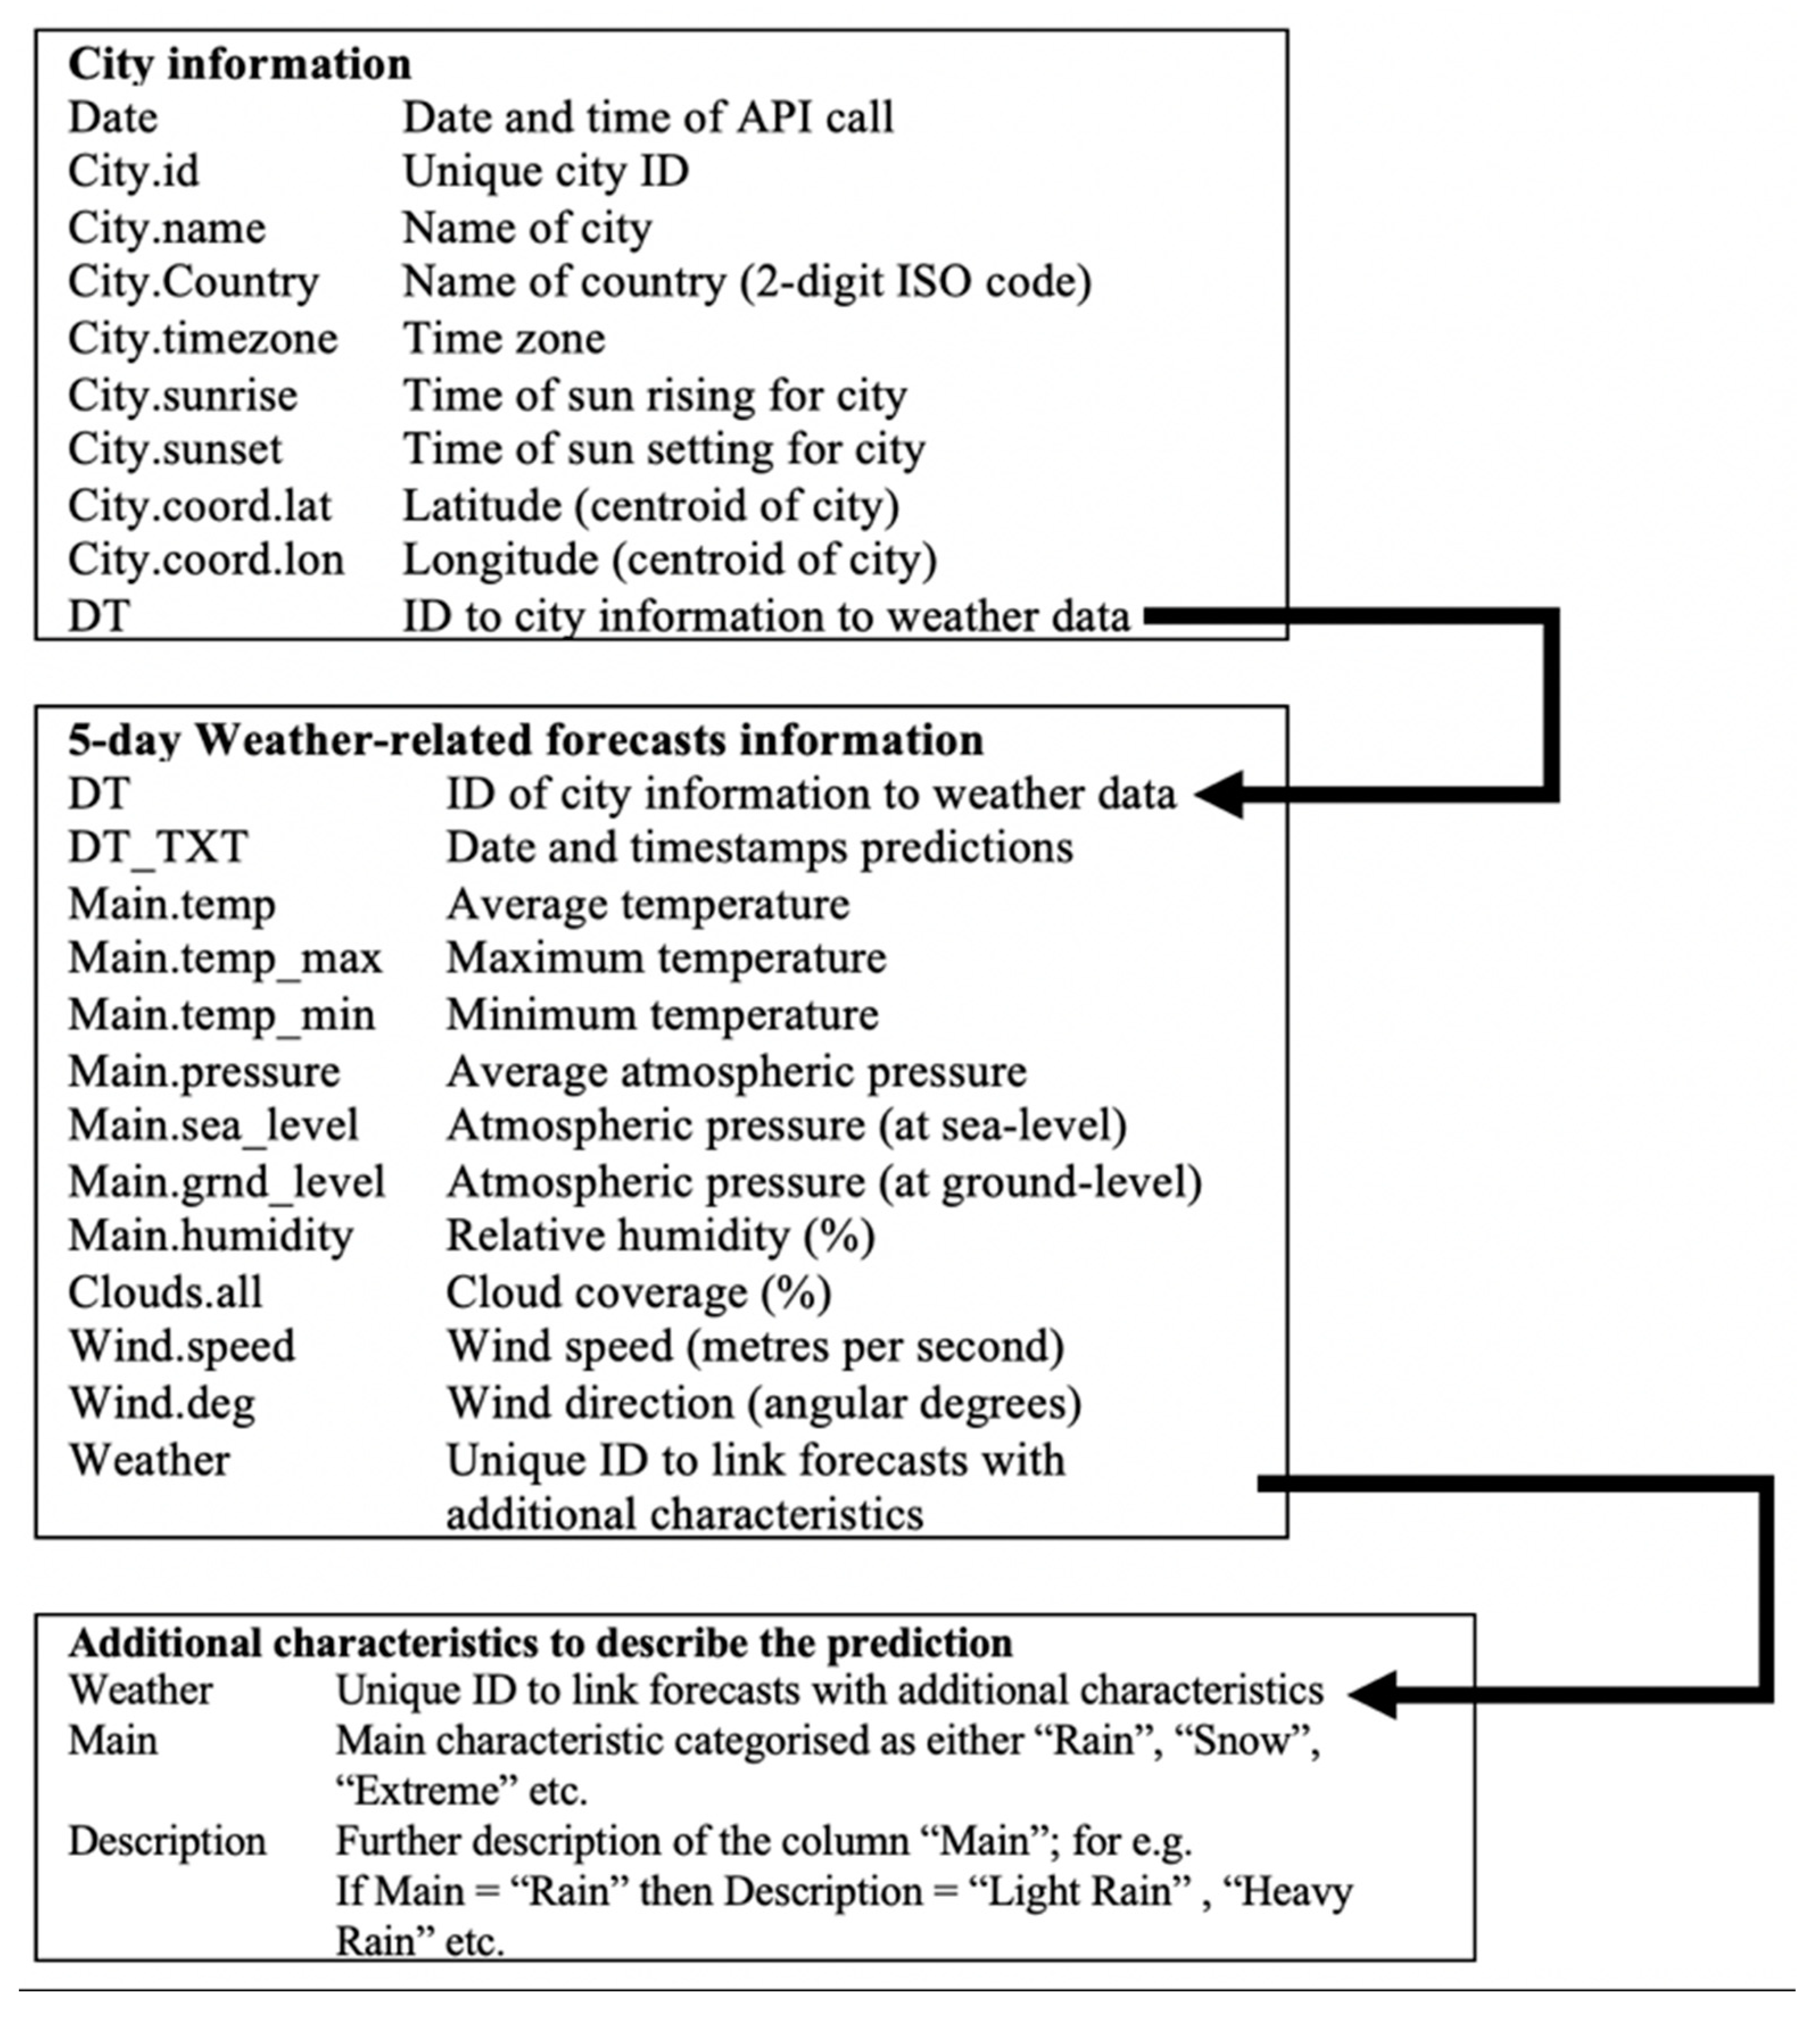
2.1.1. Dataset 1: OpenWeatherMap API
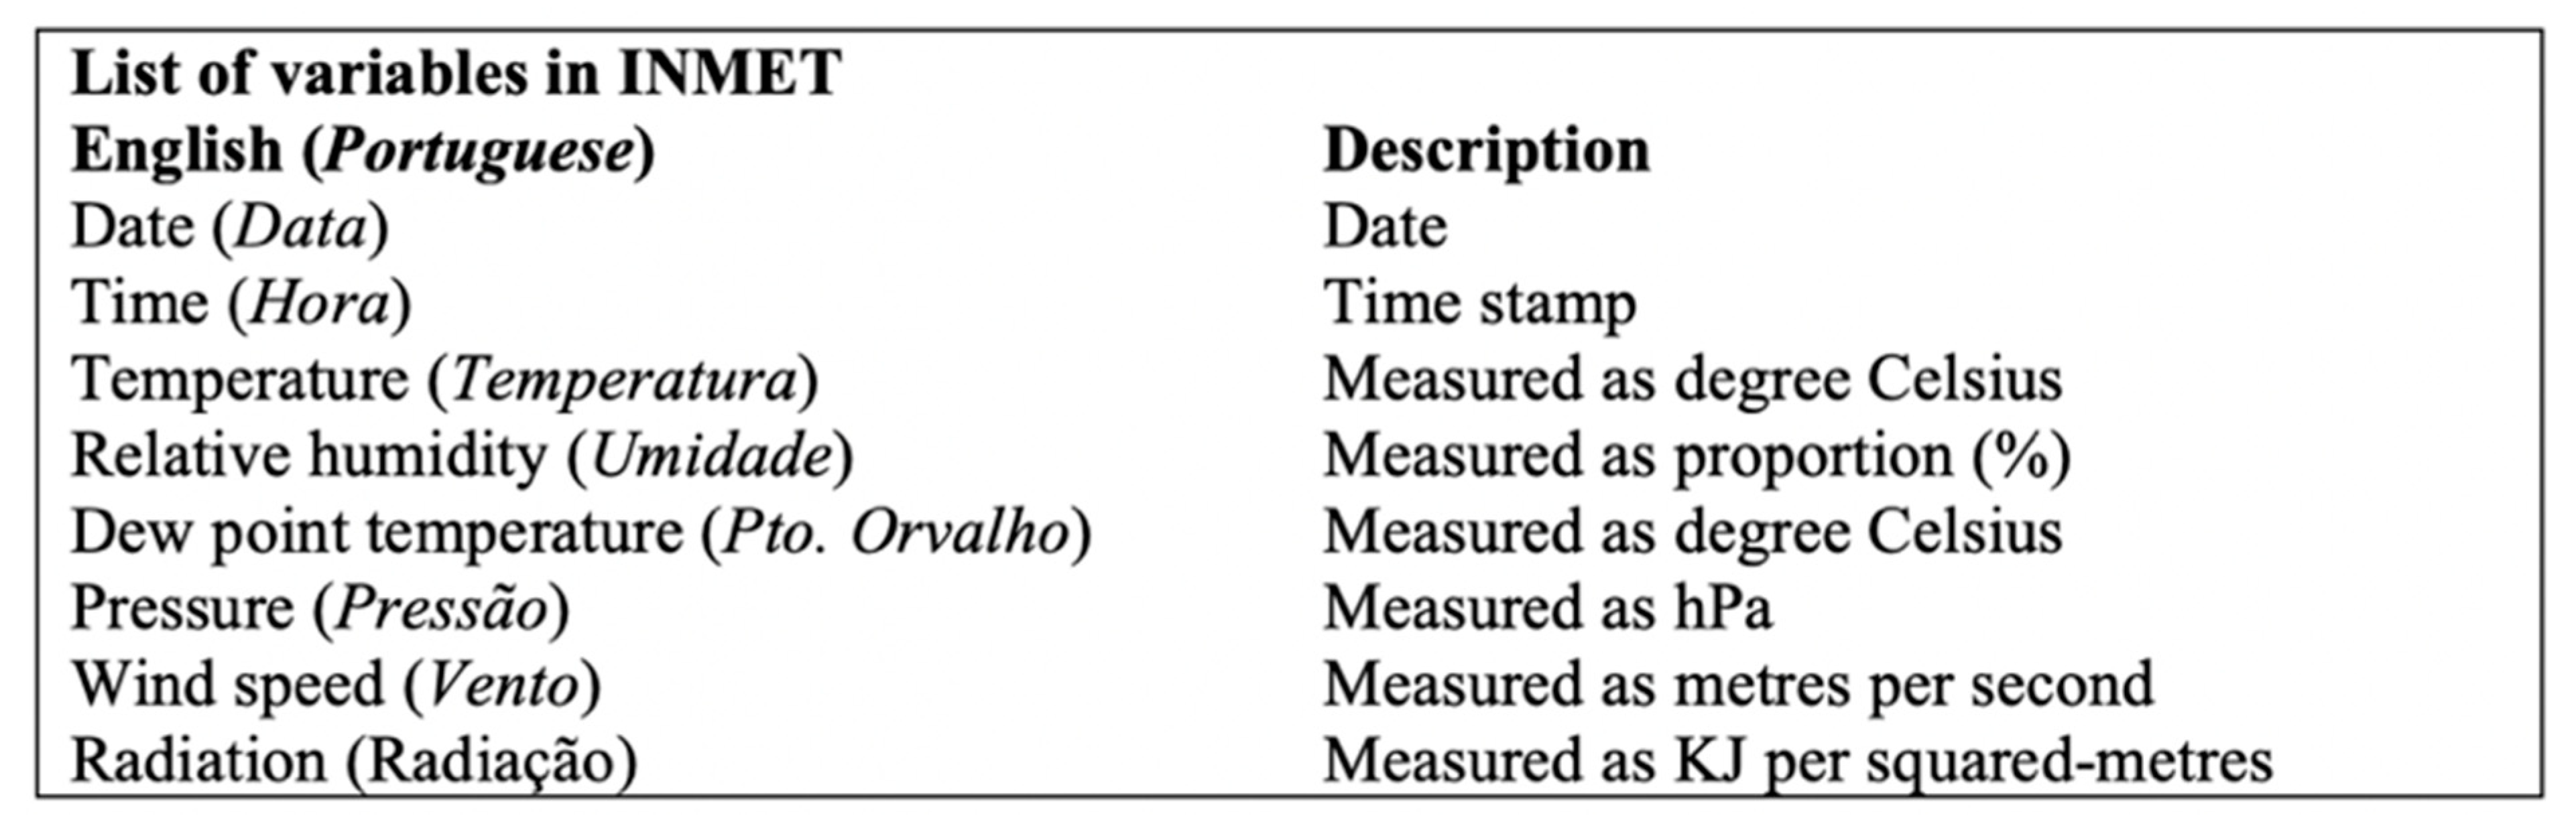
2.1.2. Dataset 2: Brazilian National Institute of Meteorology (INMET)
2.2. Statistical Analysis
3. Technical Validation
4. Usage Notes
Author Contributions
Funding
Institutional Review Board Statement
Informed Consent Statement
Data Availability Statement
Acknowledgments
Conflicts of Interest
References
- Hussain, M.M.; Avci, B.; Trajcevski, G.; Scheuermann, P. Incorporating Weather Updates for Public Transportation Users of Recommendation Systems. In Proceedings of the 2016 17th IEEE International Conference on Mobile Data Management (MDM), Porto, Portugal, 13–16 June 2016; Volume 1, pp. 333–336. [Google Scholar]
- Makkar, G. Real-Time Disease Forecasting using Climatic Factors: Supervised Analytical Methodology. In Proceedings of the 2018 IEEE Punecon, Pune, India, 30 November–2 December 2018; pp. 1–5. [Google Scholar] [CrossRef]
- Marquez, P. Weather Prediction: Improving Accuracy Using Data Mining and Forecasting Techniques. Master’s Theses, University of Texas at El Paso, El Paso, TX, USA, 2020. [Google Scholar]
- Rao, V.B.; Franchito, S.H.; Santo CM, E.; Gan, M.A. An update on the rainfall characteristics of Brazil: Seasonal variations and trends in 1979–2011. Int. J. Clim. 2016, 36, 291–302. [Google Scholar] [CrossRef]
- Gómez-Martín, M.B.; Armesto-López, X.A.; Martínez-Ibarra, E. Tourists, Weather and Climate. Official Tourism Promotion Websites as a Source of Information. Atmosphere 2017, 8, 255. [Google Scholar] [CrossRef] [Green Version]
- Dewi, C.; Chen, R.-C. Integrating Real-Time Weather Forecasts Data Using OpenWeatherMap and Twitter. Int. J. Inf. Technol. Bus. 2019, 1, 48–52. [Google Scholar]
- Machado, R.D.; Bravo, G.; Starke, A.; Lemos, L.; Colle, S. Generation of 441 typical meteorological year from INMET stations-Brazil. In Proceedings of the IEA SHC International Conference on Solar Heating and Cooling for Buildings and Industry 2019, Santiago, Chile, 4–7 November 2019. [Google Scholar] [CrossRef]
- Brooker, S.; Clements, A.C.A.; Bundy, D.A.P. Global Epidemiology, Ecology and Control of Soil-Transmitted Helminth Infections. In Advances in Parasitology; Hay, S.I., Graham, A., Rogers, D.J., Eds.; Academic Press: Cambridge, MA, USA, 2006; Volume 62, pp. 221–261. [Google Scholar]
- O’Hanlon, S.J.; Slater, H.C.; Cheke, R.A.; Boatin, B.A.; Coffeng, L.E.; Pion, S.D.S.; Boussinesq, M.; Zouré, H.G.M.; Stolk, W.A.; Basáñez, M. Model-Based Geostatistical Mapping of the Prevalence of Onchocerca volvulus in West Africa. PLOS Negl. Trop. Dis. 2016, 10, e0004328. [Google Scholar] [CrossRef] [PubMed] [Green Version]
- Slater, H.; Michael, E. Mapping, Bayesian Geostatistical Analysis and Spatial Prediction of Lymphatic Filariasis Prevalence in Africa. PLoS ONE 2013, 8, e71574. [Google Scholar] [CrossRef] [PubMed]
- Lubinda, J.; Treviño C, A.T.; Walsh, M.R.; Moore, A.J.; Hanafi-Bojd, A.A.; Akgun, S.; Zhao, B.; Barro, A.S.; Begum, M.M.; Jamal, H.; et al. Environmental suitability for Aedes aegypti and Aedes albopictus and the spatial distribution of major arboviral infections in Mexico. Parasite Epidemiol. Control. 2019, 6, e00116. [Google Scholar] [CrossRef] [PubMed]
- Messina, J.P.; Kraemer, M.U.; Brady, O.J.; Pigott, D.M.; Shearer, F.M.; Weiss, D.J.; Golding, N.; Ruktanonchai, C.W.; Gething, P.W.; Cohn, E.; et al. Mapping global environmental suitability for Zika virus. eLife 2016, 5, e15272. [Google Scholar] [CrossRef] [PubMed]
- Caminade, C.; McIntyre, K.M.; Jones, A.E. Impact of recent and future climate change on vector-borne diseases. Ann. N. Y. Acad. Sci. 2018, 1436, 157–173. [Google Scholar] [CrossRef] [PubMed] [Green Version]
- Cailly, P.; Tran, A.; Balenghien, T.; L’Ambert, G.; Toty, C.; Ezanno, P. A climate-driven abundance model to assess mosquito control strategies. Ecol. Model. 2012, 227, 7–17. [Google Scholar] [CrossRef]
- Beltrán, J.D.; Boscor, A.; dos Santos, W.P.; Massoni, T.; Kostkova, P. ZIKA: A New System to Empower Health Workers and Local Communities to Improve Surveillance Protocols by E-learning and to Forecast Zika Virus in Real Time in Brazil. In Proceedings of the 2018 International Conference on Digital Health, online, 23 April 2018; ACM: New York, NY, USA, 2018; pp. 90–94. [Google Scholar] [CrossRef]
- Musah, A.; Rubio-Solis, A.; Birjovanu, G.; dos Santos, W.P.; Massoni, T.; Kostkova, P. Assessing the Relationship between various Climatic Risk Factors & Mosquito Abundance in Recife, Brazil. In Proceedings of the 9th International Conference on Digital Public Health, online, 20 November 2019; Association for Computing Machinery: New York, NY, USA, 2019; pp. 97–100. [Google Scholar] [CrossRef]
- Rubio-Solis, A.; Musah, A.; Dos Santos, W.P.; Massoni, T.; Birjovanu, G.; Kostkova, P. ZIKA Virus: Prediction of Aedes Mosquito Larvae Occurrence in Recife (Brazil) using Online Extreme Learning Machine and Neural Networks. In Proceedings of the 9th International Conference on Digital Public Health, online, 20 November 2019; Association for Computing Machinery: New York, NY, USA, 2019; pp. 101–110. [Google Scholar] [CrossRef]
- UCL-IRDR. ZIKA: A Deployment of ZIKA: A Mobile Mosquito Surveillance App to Combat Arboviruses in Brazil. UCL Institute for Risk and Disaster Reduction. 2018. Available online: https://www.ucl.ac.uk/risk-disaster-reduction/zika-deployment-zika-mobile-mosquito-surveillance-app-combat-arboviruses-brazil (accessed on 18 November 2021).
- UCL-IRDR. Mosquito Population Modelling for Early Warning System and Rapid Health Authority Response (MEWAR). UCL Institute for Risk and Disaster Reduction. 2020. Available online: https://www.ucl.ac.uk/risk-disaster-reduction/research-projects/2020/sep/mosquito-population-modelling-early-warning-system-and-rapid-health (accessed on 18 November 2021).
- Kostkova, P.; dos Santos, W.P.; Massoni, T. ZIKA: Improved surveillance and forecast of Zika virus in Brazil. Eur. J. Public Health 2019, 29 (Suppl. S4), 414–415. [Google Scholar] [CrossRef]
- De Souza, W.V.; Albuquerque, M.D.F.P.M.D.; Vazquez, E.; Bezerra, L.C.A.; Mendes, A.D.C.G.; Lyra, T.M.; De Araujo, T.V.B.; De Oliveira, A.L.S.; Braga, M.C.; Ximenes, R.A.D.A.; et al. Microcephaly epidemic related to the Zika virus and living conditions in Recife, Northeast Brazil. BMC Public Health 2018, 18, 130. [Google Scholar] [CrossRef] [PubMed]
- Cavalcante, A.C.P.; De Olinda, R.A.; Gomes, A.; Traxler, J.; Smith, M.; Santos, S. Spatial modelling of the infestation indices of Aedes aegypti: An innovative strategy for vector control actions in developing countries. Parasites Vectors 2020, 13, 197. [Google Scholar] [CrossRef] [PubMed] [Green Version]
- INMET Information. Instituto Nacional de Meteorologia (INMET); 2020. Available online: http://portal.inmet.gov.br/ (accessed on 18 November 2021).
- INMET (All Weather Data). Instituto Nacional de Meteorologia (INMET); 2020. Available online: https://tempo.inmet.gov.br/TabelaEstacoes/# (accessed on 18 November 2021).
- OpenWeatherMap API. OpenWeather API. OpenWeather Mobile Application. 2021. Available online: https://openweathermap.org/api (accessed on 18 November 2021).
- De Oliveira, F.H.P.C.; Ara, A.L.S.C.E.; Moreira, C.H.P.; Lira, O.O.; Padilha, M.D.R.F.; Shinohara, N.K.S. Seasonal changes of water quality in a tropical shallow and eutrophic reservoir in the metropolitan region of Recife (Pernambuco-Brazil). Anais da Academia Brasileira de Ciências 2014, 86, 1863–1872. [Google Scholar] [CrossRef] [PubMed] [Green Version]
- Jale, J.D.S.; Júnior, S.F.A.X.; Xavier, F.M.; Stošić, T.; Stošić, B.; Ferreira, T.A.E. Application of Markov chain on daily rainfall data in Paraíba-Brazil from 1995–2015. Acta Sci. Technol. 2019, 41, 37186. [Google Scholar] [CrossRef]
- Pu, Z.; Kalnay, E. Numerical Weather Prediction Basics: Models, Numerical Methods, and Data Assimilation. In Handbook of Hydrometeorological Ensemble Forecasting; Duan, Q., Pappenberger, F., Wood, A., Cloke, H.L., Schaake, J.C., Eds.; Springer: Berlin/Heidelberg, Germany, 2019; pp. 67–97. [Google Scholar] [CrossRef]


| Dry Season Mean Difference (SD) | Wet Season Mean Difference (SD) | |
|---|---|---|
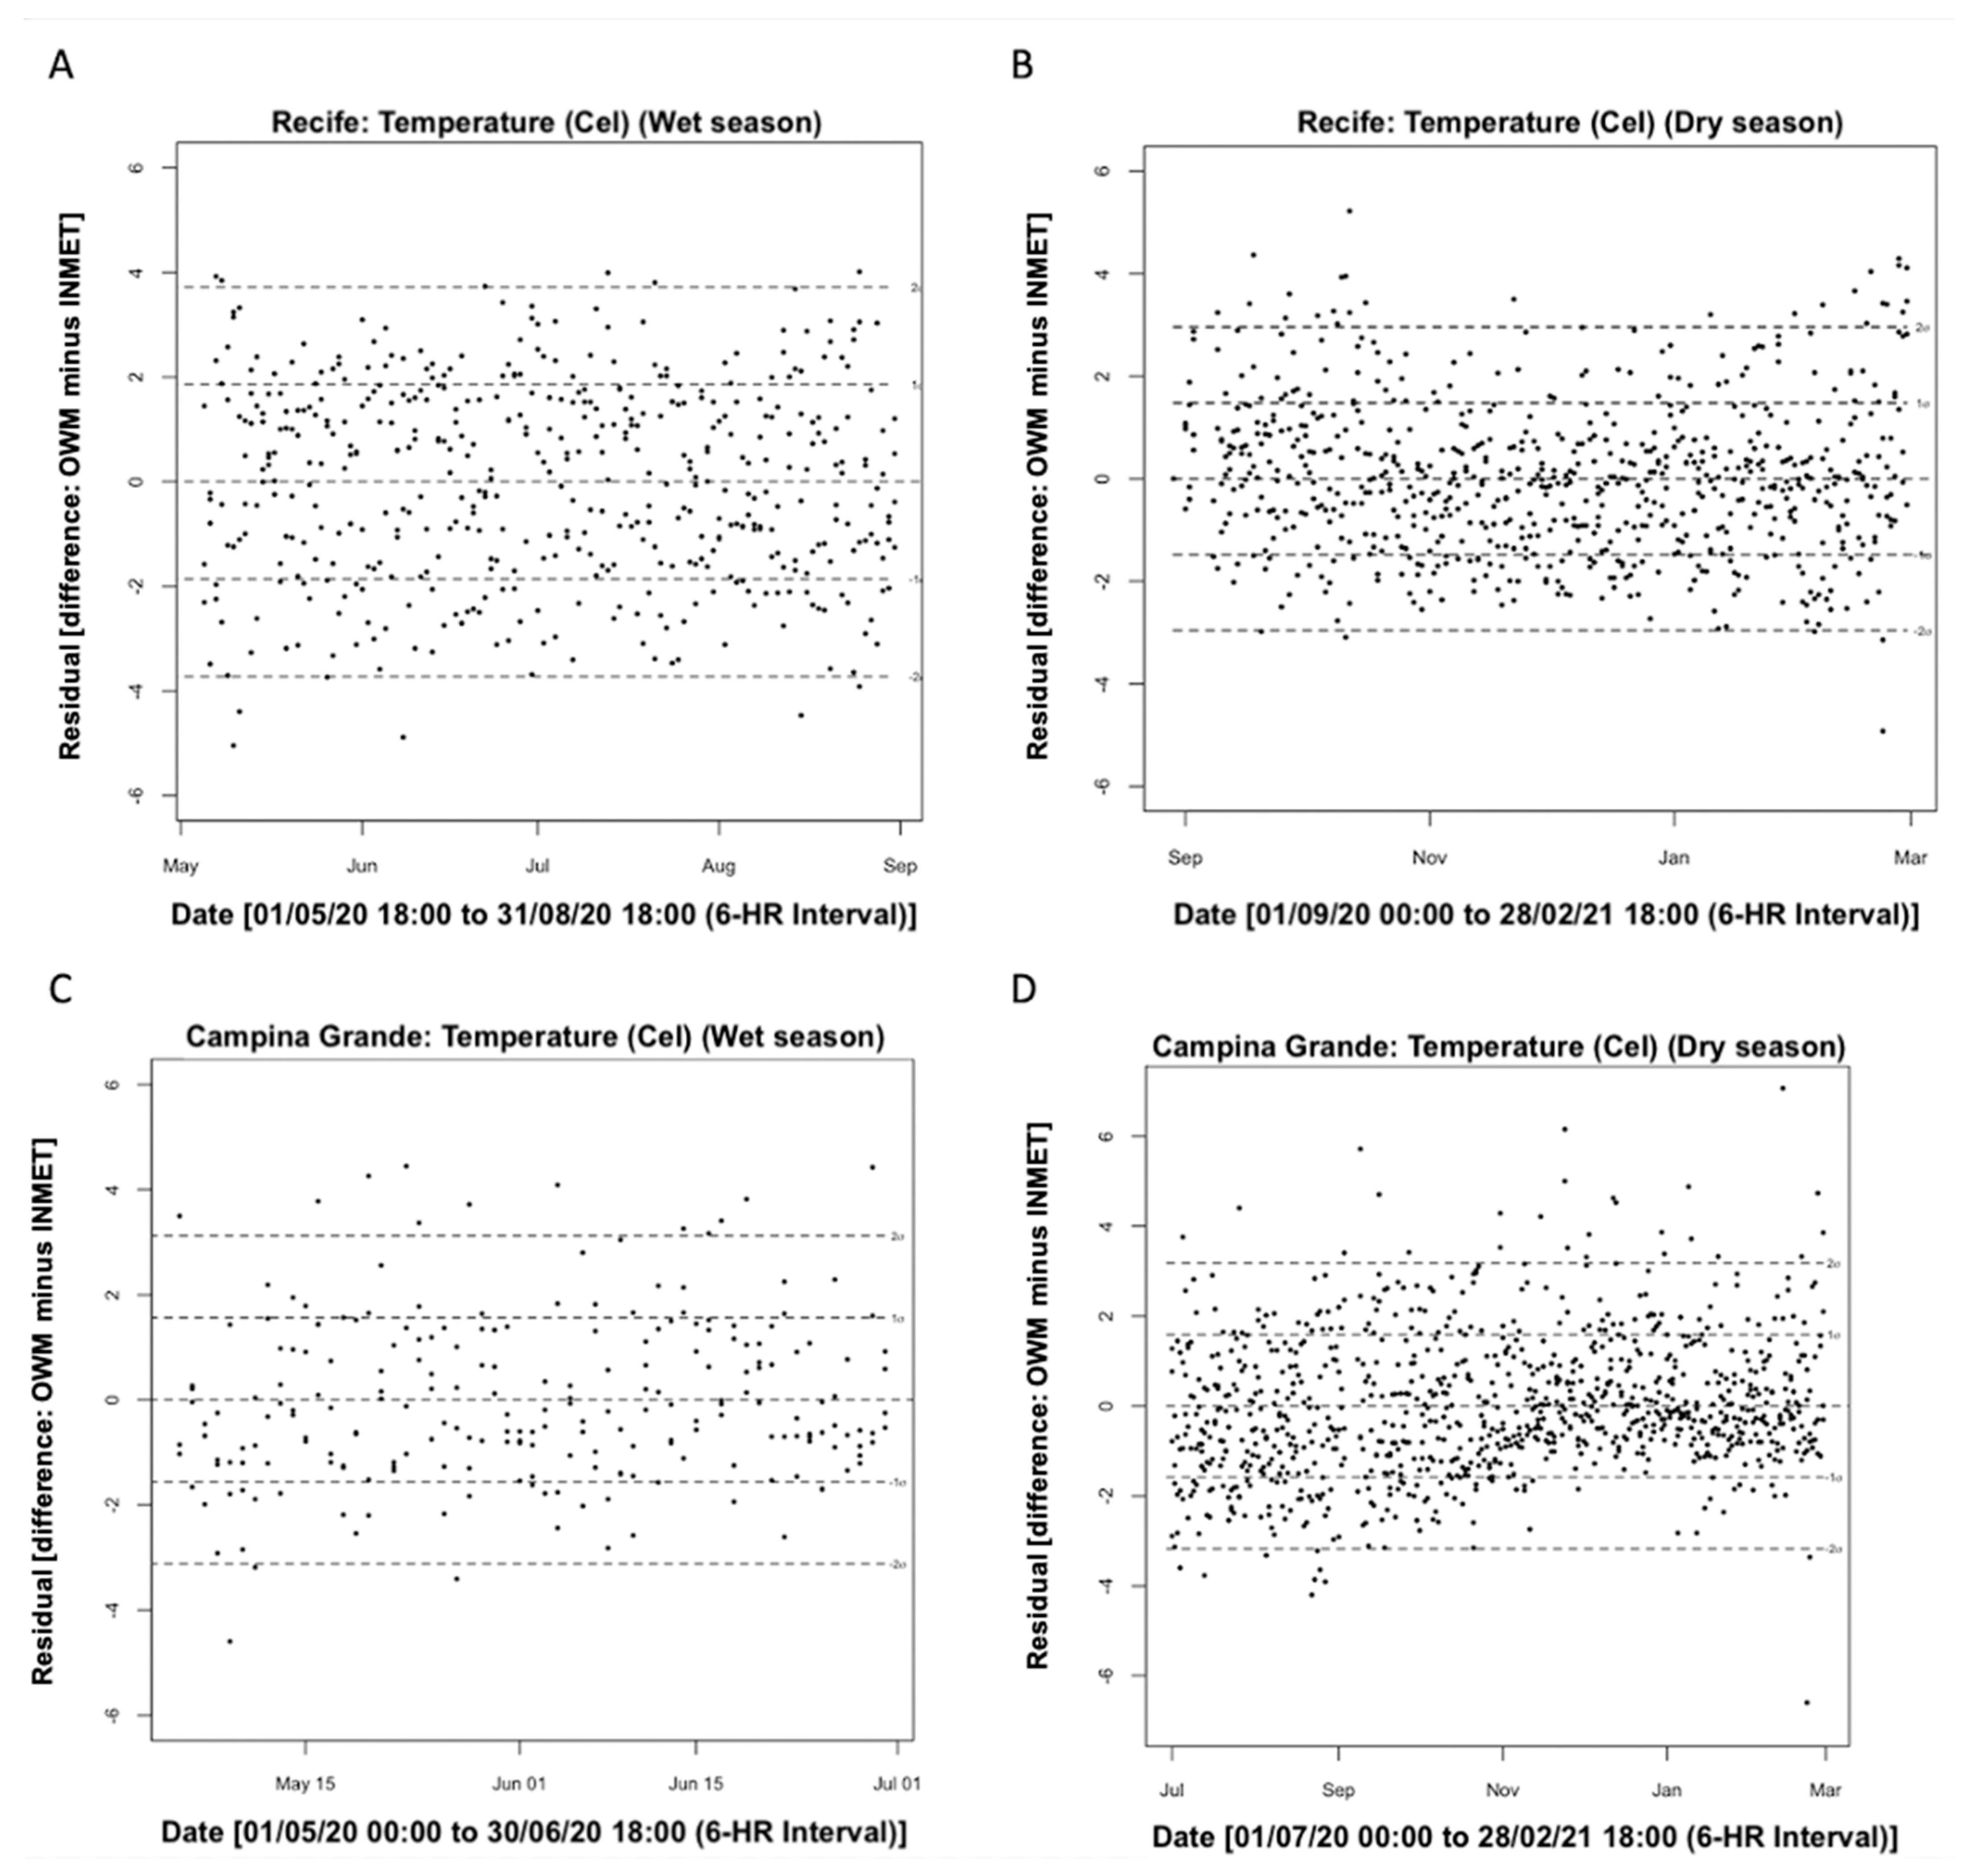
| Recife: Temperature | −0.35 (±1.47) (p > 0.05) | 0.85 (±1.86) (p > 0.05) |
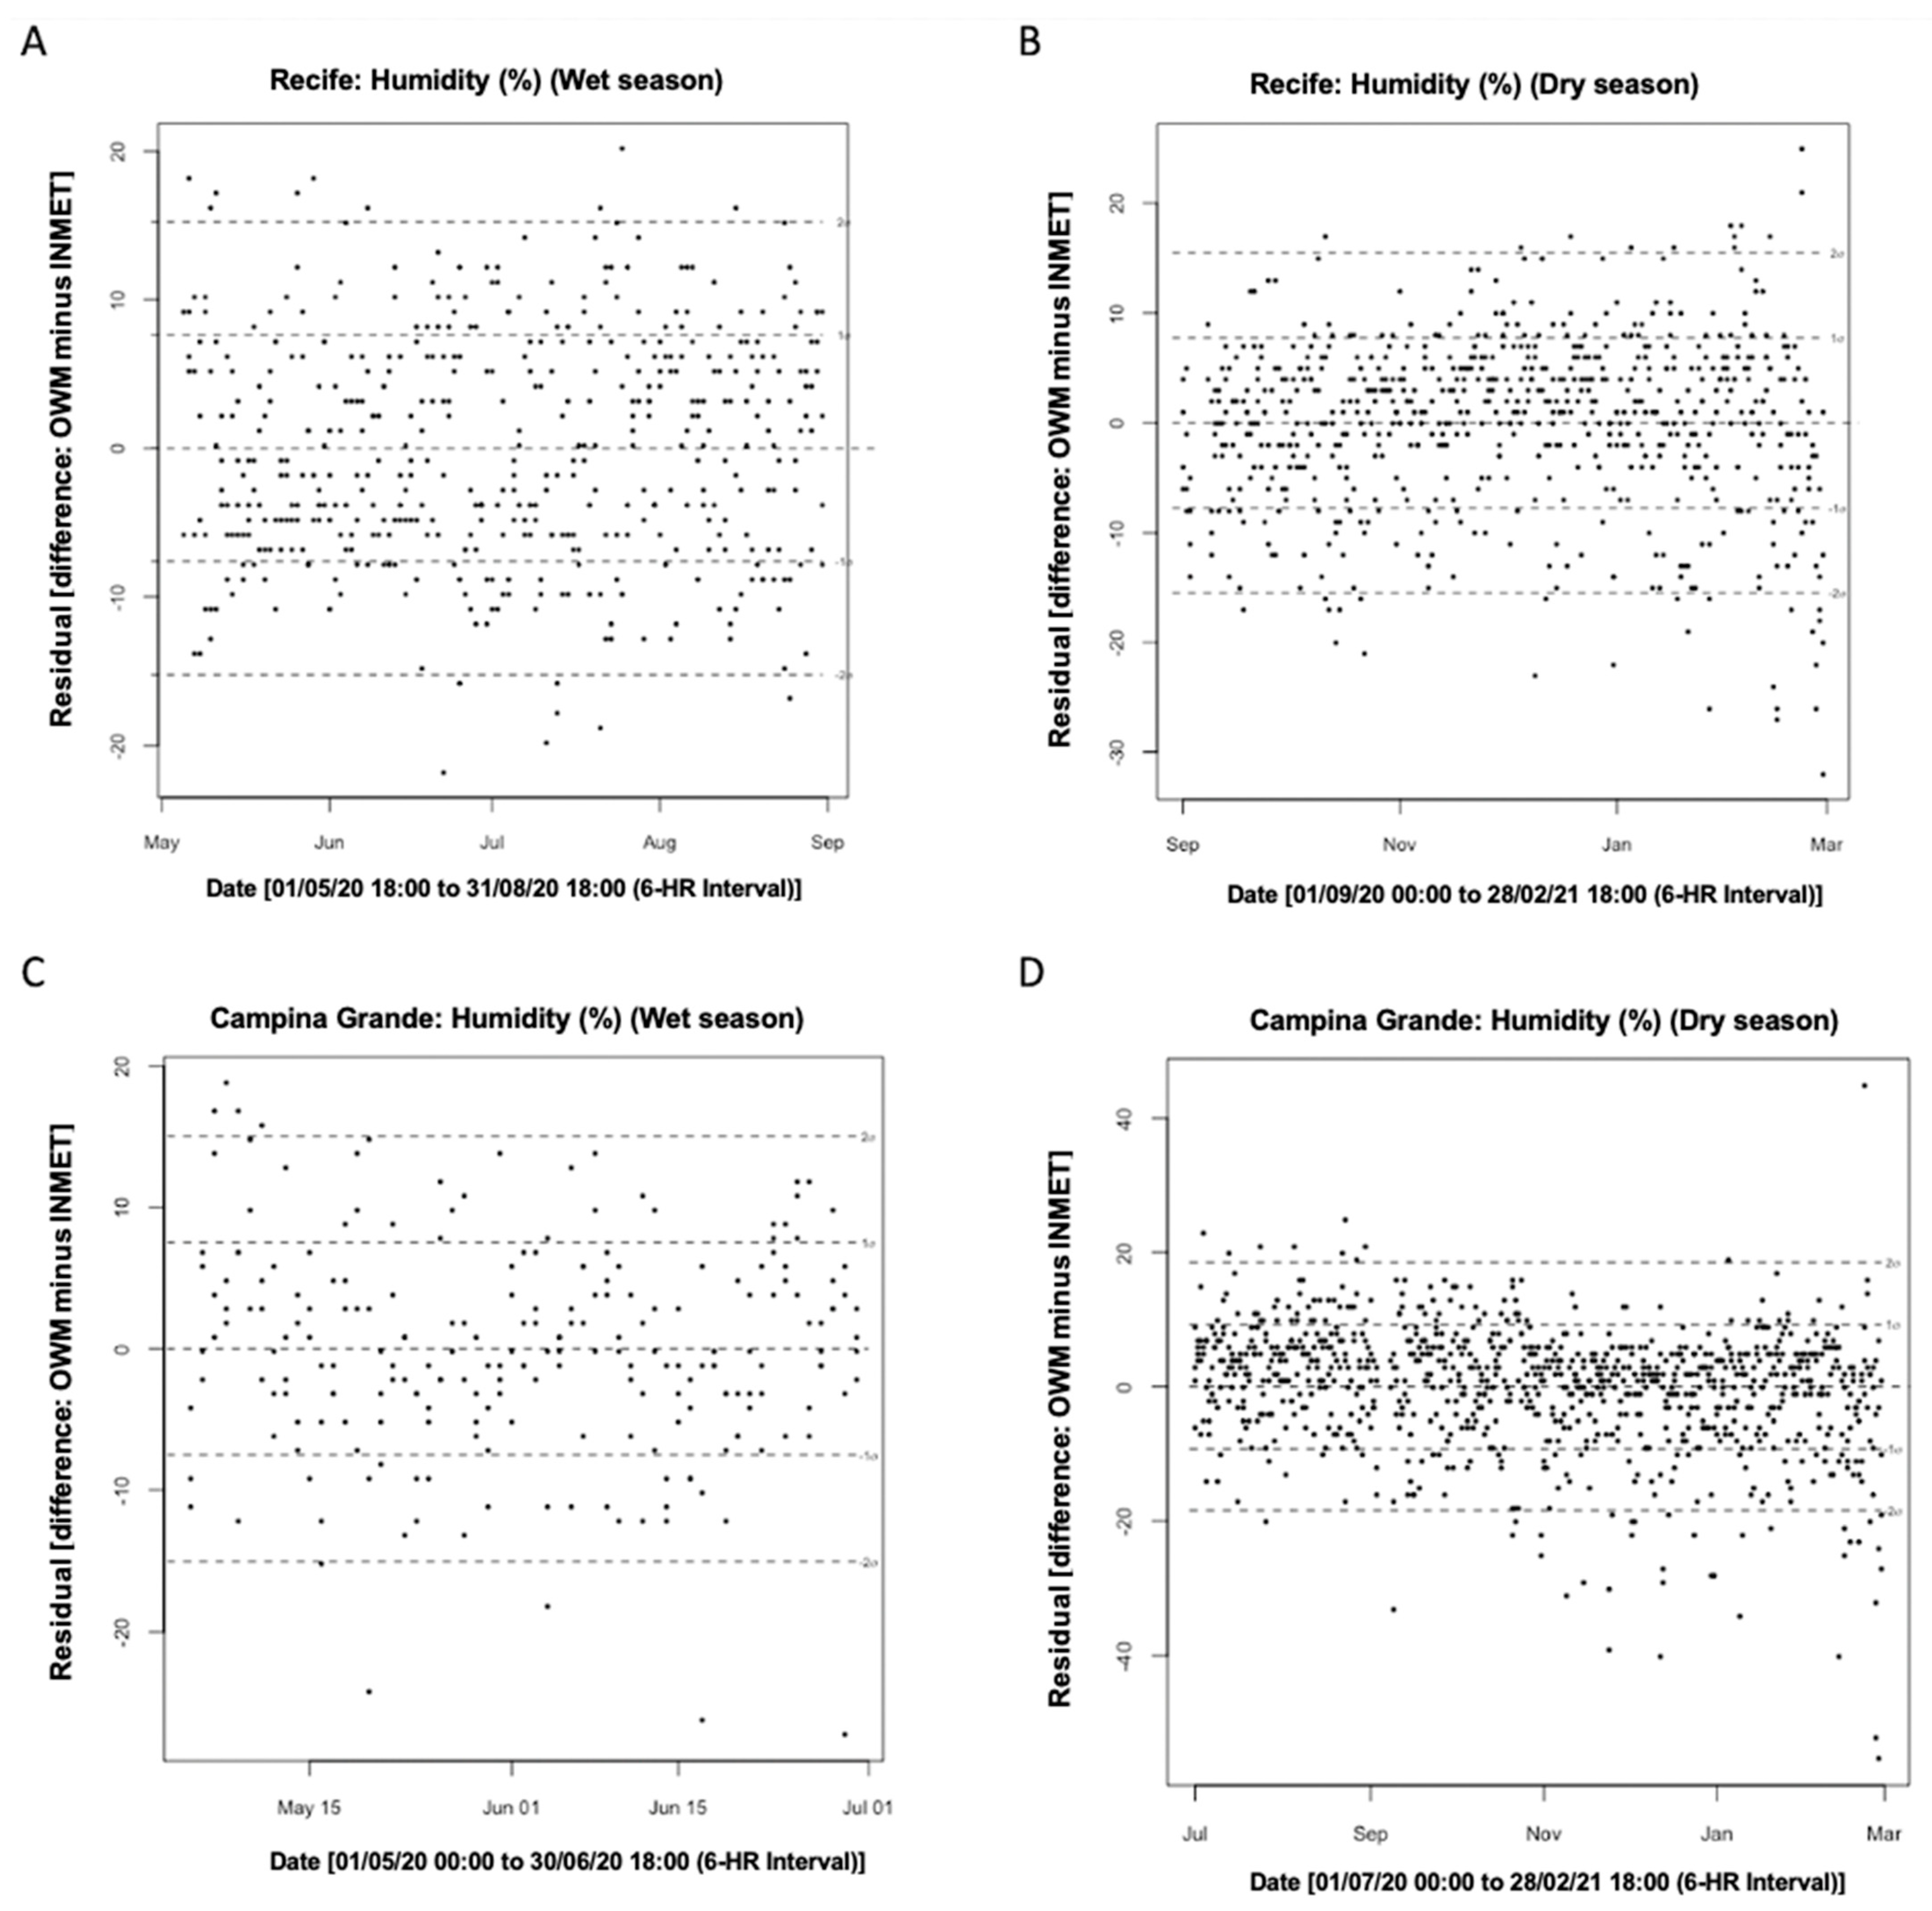
| Recife: Humidity | 1.03 (±7.73) (p < 0.001) | −4.16 (±7.62) (p < 0.01) |
| Campina Grande: Temperature | −0.67 (±1.58) (p > 0.05) | −1.14 (±1.56) (p > 0.05) |
| Campina Grande: Humidity | −0.87 (±9.23) (p < 0.05) | 3.19 (±7.52) (p < 0.01) |
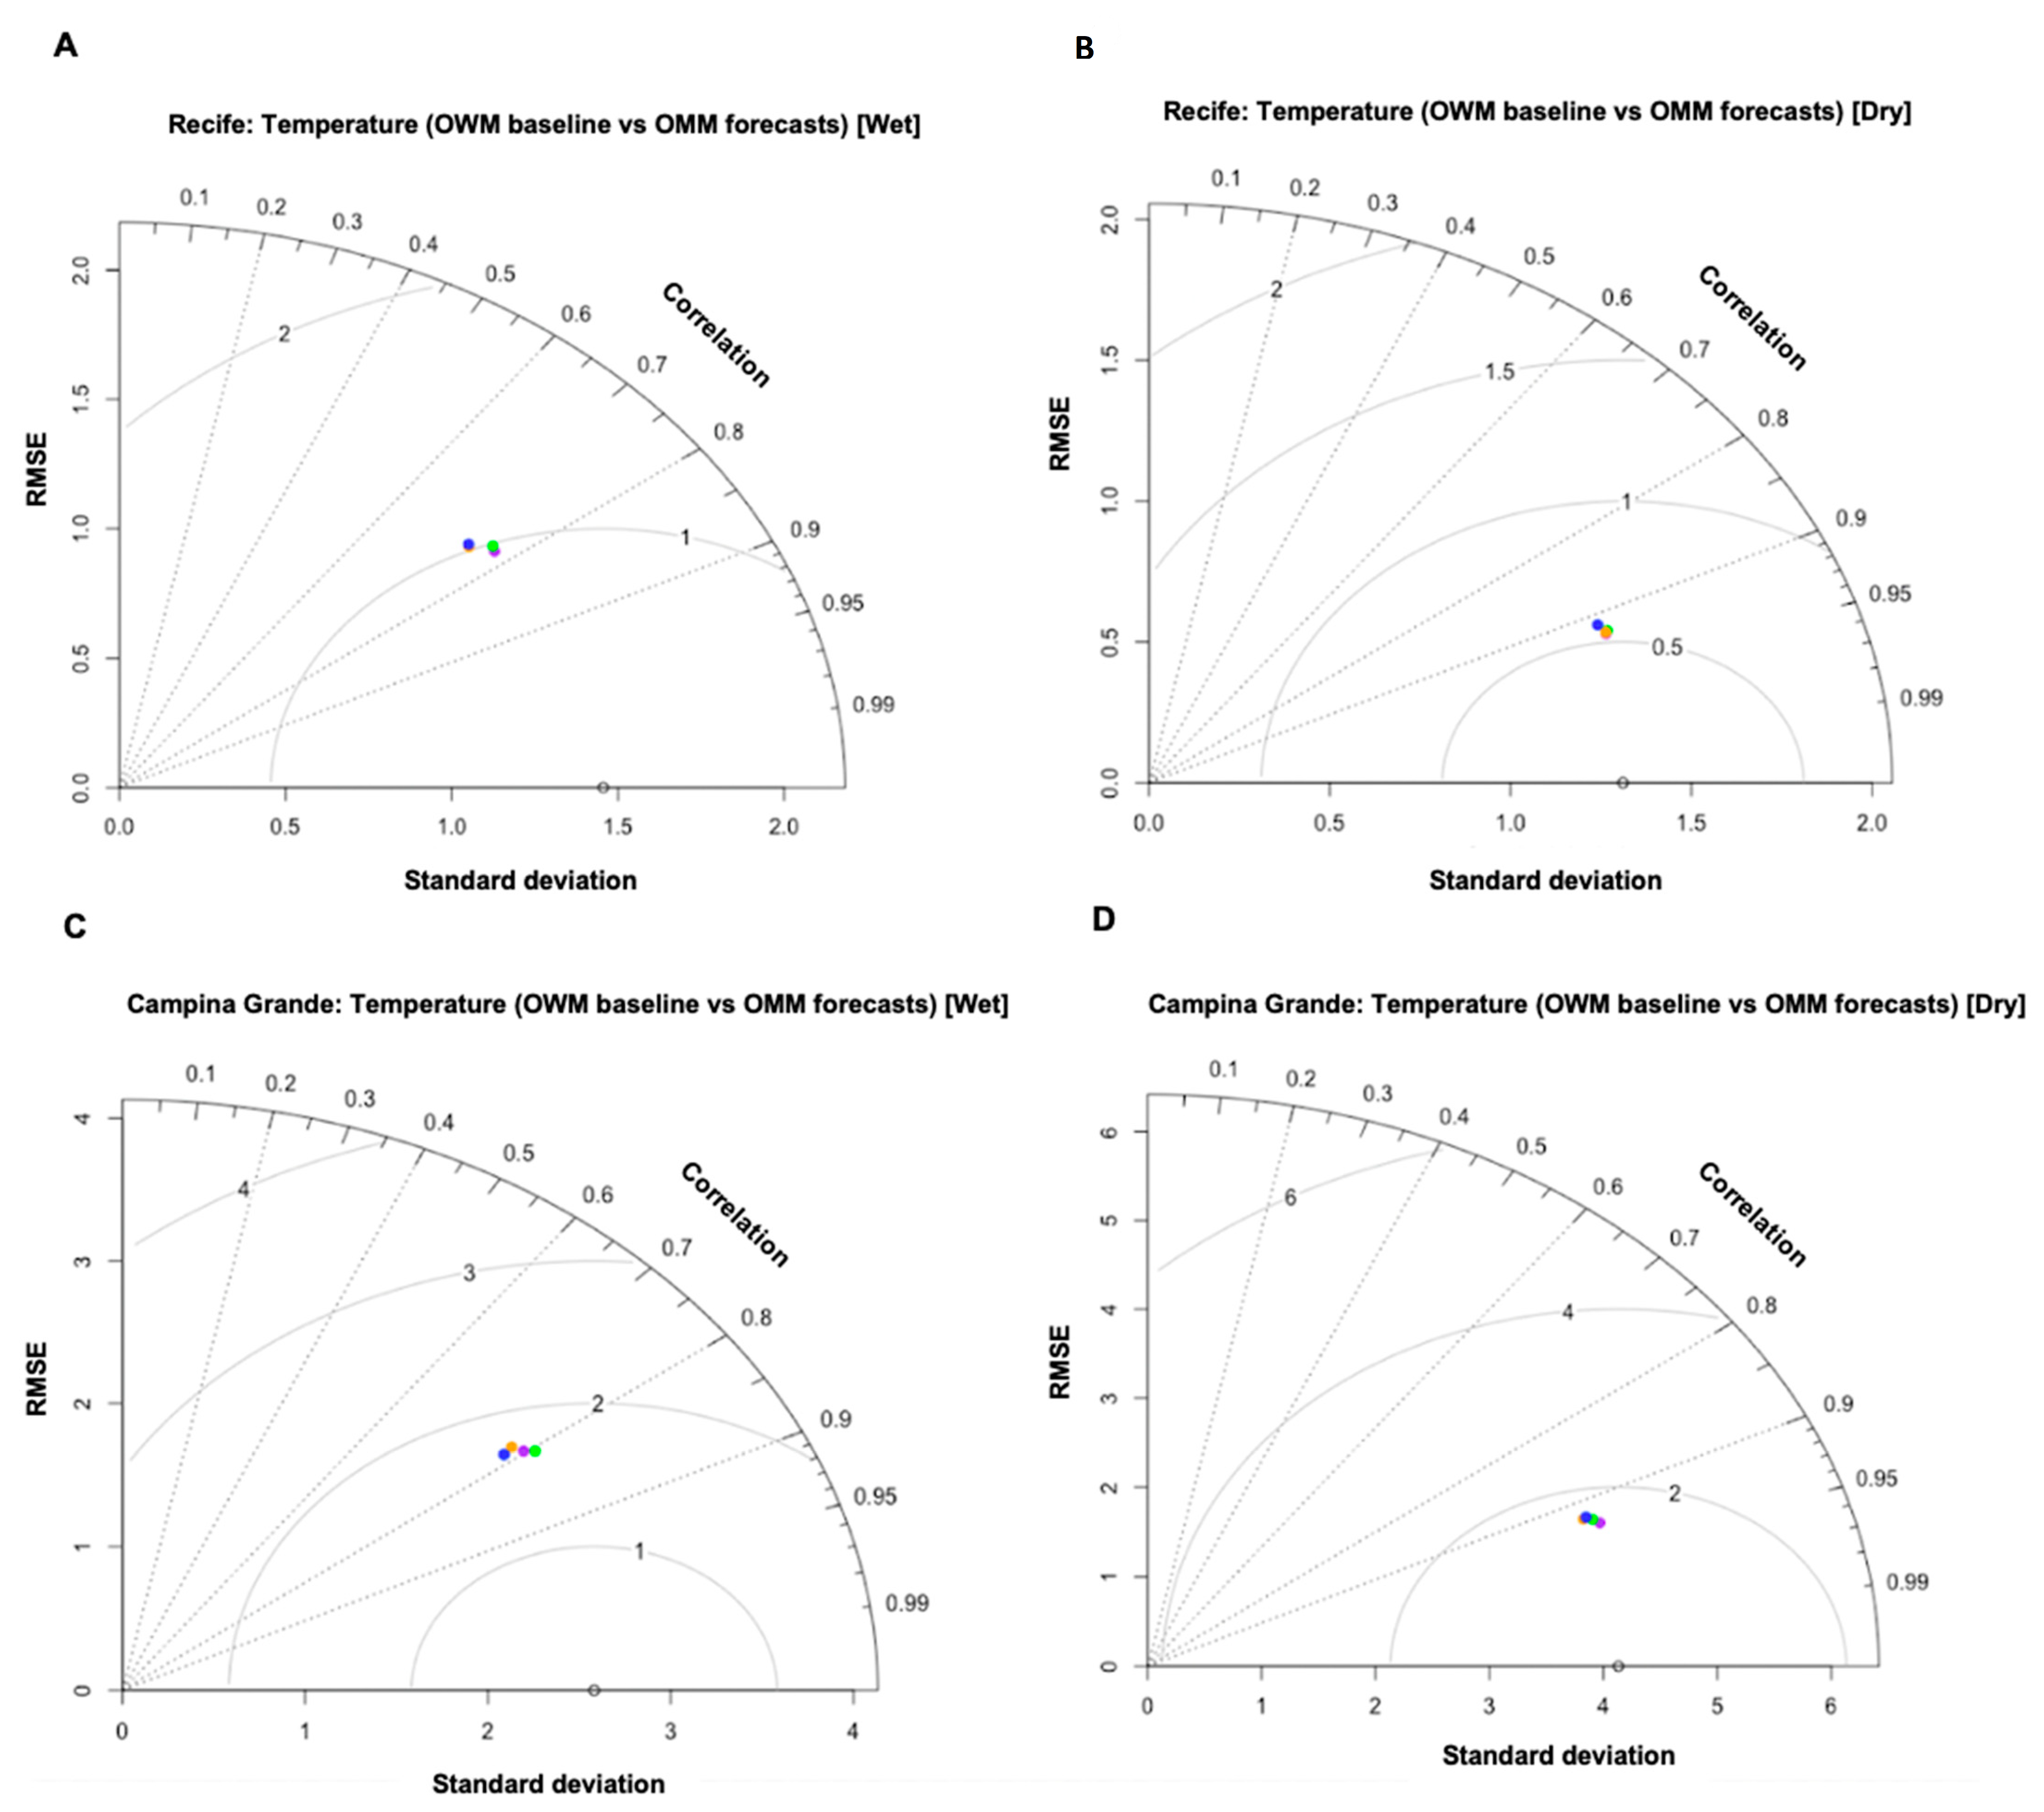
| Temperature a | Wet Season | Dry Season | ||||||
|---|---|---|---|---|---|---|---|---|
| Day-1 (Purple) | Day-2 (Green) | Day-3 (Orange) | Day-4 (Blue) | Day-1 (Purple) | Day-2 (Green) | Day-3 (Orange) | Day-4 (Blue) | |
| Recife | (See Figure 5A) | (See Figure 5B) | ||||||
| Correlation | 0.77 | 0.76 | 0.74 | 0.74 | 0.92 | 0.92 | 0.92 | 0.91 |
| RMSE | 0.97 | 0.99 | 1.01 | 1.02 | 0.54 | 0.55 | 0.54 | 0.55 |
| Campina Grande | (See Figure 5C) | (See Figure 5D) | ||||||
| Correlation | 0.79 | 0.80 | 0.78 | 0.78 | 0.93 | 0.92 | 0.91 | 0.90 |
| RMSE | 1.71 | 1.69 | 1.75 | 1.71 | 1.61 | 1.65 | 1.67 | 1.69 |
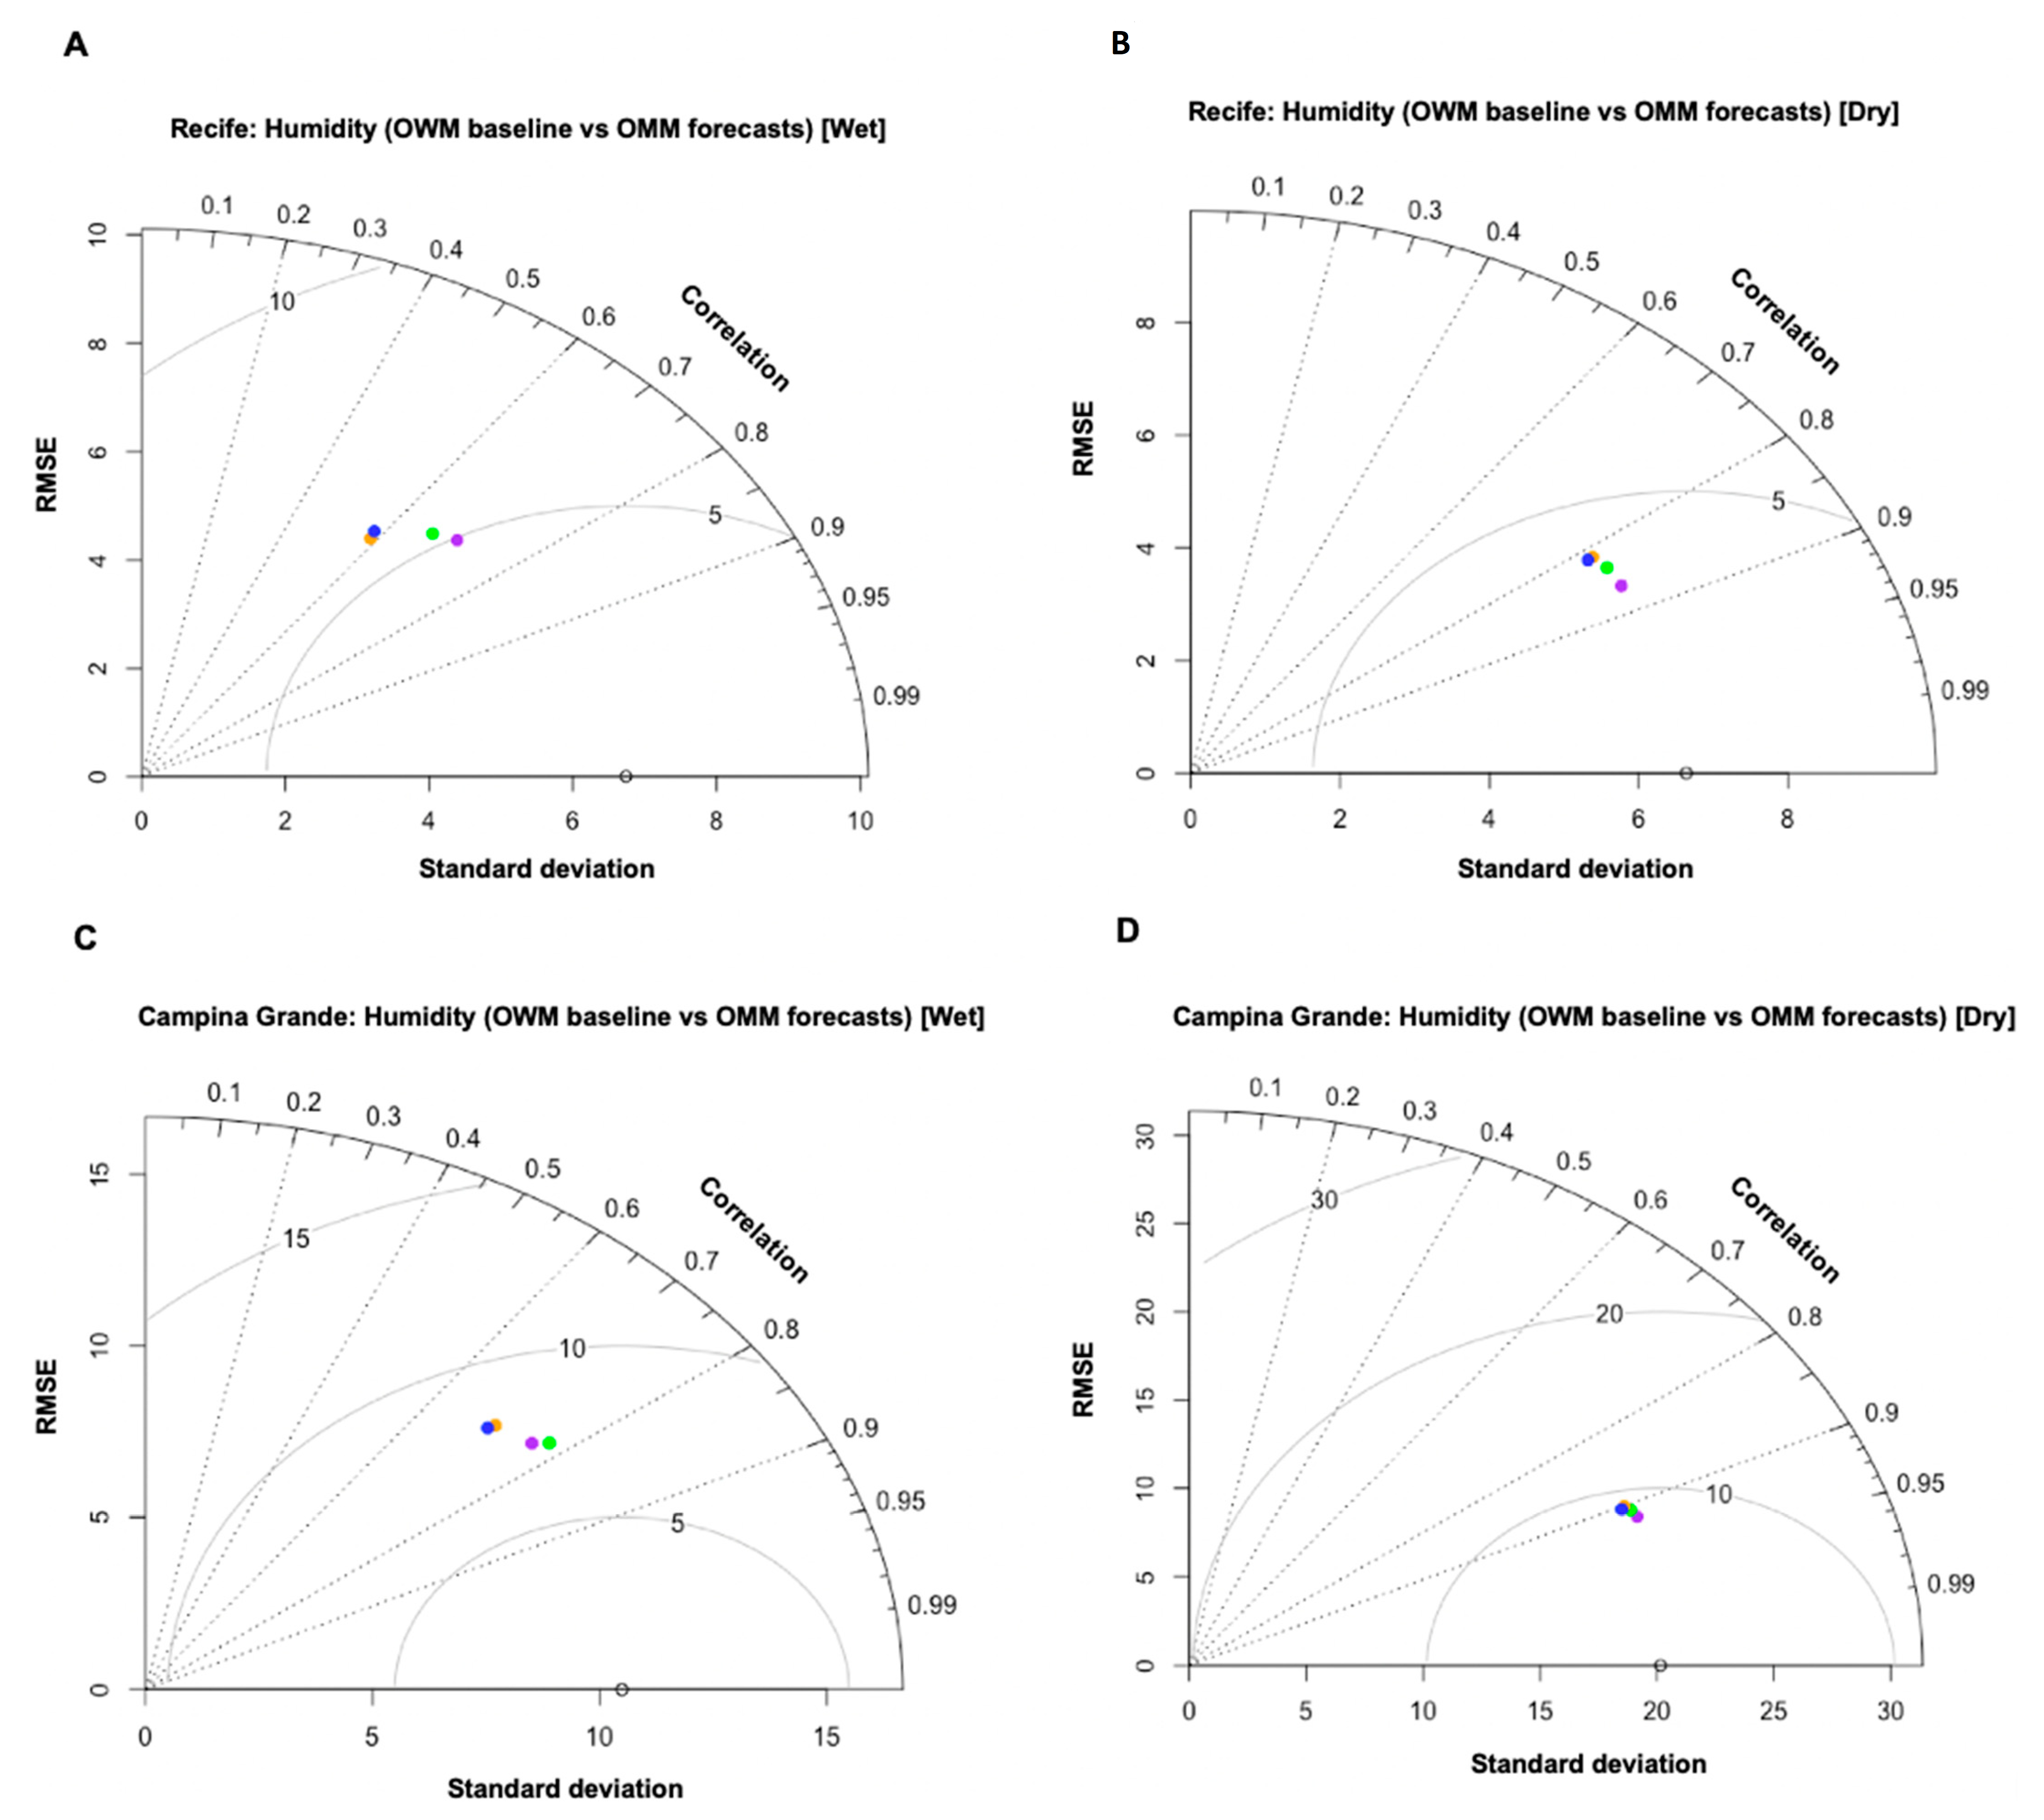
| Humidity b | Wet Season | Dry Season | ||||||
| Day-1 (Purple) | Day-2 (Green) | Day-3 (Orange) | Day-4 (Blue) | Day-1 (Purple) | Day-2 (Green) | Day-3 (Orange) | Day-4 (Blue) | |
| Recife | (See Figure 6A) | (See Figure 6B) | ||||||
| Correlation | 0.71 | 0.67 | 0.59 | 0.58 | 0.86 | 0.83 | 0.81 | 0.82 |
| RMSE | 5.09 | 5.37 | 5.68 | 5.76 | 3.44 | 3.81 | 4.04 | 3.99 |
| Campina Grande | (See Figure 6C) | (See Figure 6D) | ||||||
| Correlation | 0.76 | 0.77 | 0.70 | 0.70 | 0.92 | 0.90 | 0.90 | 0.91 |
| RMSE | 7.42 | 7.34 | 8.17 | 8.15 | 8.44 | 8.85 | 9.12 | 9.14 |
Publisher’s Note: MDPI stays neutral with regard to jurisdictional claims in published maps and institutional affiliations. |
© 2022 by the authors. Licensee MDPI, Basel, Switzerland. This article is an open access article distributed under the terms and conditions of the Creative Commons Attribution (CC BY) license (https://creativecommons.org/licenses/by/4.0/).
Share and Cite
Musah, A.; Dutra, L.M.M.; Aldosery, A.; Browning, E.; Ambrizzi, T.; Borges, I.V.G.; Tunali, M.; Başibüyük, S.; Yenigün, O.; Moreno, G.M.M.; et al. An Evaluation of the OpenWeatherMap API versus INMET Using Weather Data from Two Brazilian Cities: Recife and Campina Grande. Data 2022, 7, 106. https://doi.org/10.3390/data7080106
Musah A, Dutra LMM, Aldosery A, Browning E, Ambrizzi T, Borges IVG, Tunali M, Başibüyük S, Yenigün O, Moreno GMM, et al. An Evaluation of the OpenWeatherMap API versus INMET Using Weather Data from Two Brazilian Cities: Recife and Campina Grande. Data. 2022; 7(8):106. https://doi.org/10.3390/data7080106
Chicago/Turabian StyleMusah, Anwar, Livia Màrcia Mosso Dutra, Aisha Aldosery, Ella Browning, Tercio Ambrizzi, Iuri Valerio Graciano Borges, Merve Tunali, Selma Başibüyük, Orhan Yenigün, Giselle Machado Magalhaes Moreno, and et al. 2022. "An Evaluation of the OpenWeatherMap API versus INMET Using Weather Data from Two Brazilian Cities: Recife and Campina Grande" Data 7, no. 8: 106. https://doi.org/10.3390/data7080106
APA StyleMusah, A., Dutra, L. M. M., Aldosery, A., Browning, E., Ambrizzi, T., Borges, I. V. G., Tunali, M., Başibüyük, S., Yenigün, O., Moreno, G. M. M., da Silva, A. C. G., dos Santos, W. P., de Lima, C. L., Massoni, T., Jones, K. E., Campos, L. C., & Kostkova, P. (2022). An Evaluation of the OpenWeatherMap API versus INMET Using Weather Data from Two Brazilian Cities: Recife and Campina Grande. Data, 7(8), 106. https://doi.org/10.3390/data7080106