Data Descriptor

An Inventory of Large-Scale Landslides in Baoji City, Shaanxi Province, China

1
National Institute of Natural Hazards, Ministry of Emergency Management of China, Beijing 100085, China
2
School of Engineering and Technology, China University of Geosciences (Beijing), Beijing 100083, China
3
Key Laboratory of Compound and Chained Natural Hazards Dynamics, Ministry of Emergency Management of China, Beijing 100085, China
4
Key Laboratory of Landslide Risk Early-Warning and Control, Ministry of Emergency Management of China, Chengdu 610059, China
*
Author to whom correspondence should be addressed.
Data 2022, 7(8), 114; https://doi.org/10.3390/data7080114
Submission received: 1 May 2022 / Revised: 10 August 2022 / Accepted: 13 August 2022 / Published: 15 August 2022

Abstract

:
Landslides are a typical geological hazard that endangers people’s lives and property in the Loess Plateau. The destructiveness of large-scale landslides, in particular, is incalculable. For example, traffic disruptions, river blockages, and house collapses may all result from landslides. Thus, it is urgent to compile a complete inventory of landslides in a specific region. The investigation object of this study is Baoji City, Shaanxi Province, China. Using the multi-temporal high-resolution remote sensing images from Google Earth, we preliminarily completed the cataloging of large-scale (area > 5000 m2) landslides in the study area through visual interpretation. The inventory was subsequently compared with the existing literature and hazard records for improvement and supplement. We identified 3422 landslides with a total area of 360.7 km2 and an average area of 105,400 m2 for each individual landslide. The largest landslide had an area of 1.71 km2, while the smallest one was 6042 m2. In previous studies, we analyzed these data without describing the data sources in detail. We now provide a shared dataset of each landslide in shp format, containing geographic location, boundary information, etc. The dataset is significantly useful for understanding the distribution characteristics of large-scale landslides in this region. Moreover, it can serve as basic data for the study of paleolandslide resurrection.
Dataset License: Creative Commons Attribution 4.0 International.

1. Summary

Landslides are one of the major and most frequently occurring natural hazards. The stability analysis and sliding evolution simulation of single landslides and the distribution characteristics and susceptibility evaluation of regional landslides have always been research hotspots [1,2]. Our work focuses on the study of regional landslides. The availability and quality of regional historical landslide databases are critical points, as they are the basis for all components of landslide risk assessment [3]. Thomas et al. [4] completed a high-precision catalog, including information on 1194 landslides on a global scale, and then proposed a heuristic method for landslide susceptibility mapping. Fausto et al. [5] deciphered the power-law correlation of a dataset containing 16,809 landslides in central Italy. Isaac et al. [6] analyzed landslide erosion rates using data from more than 15,000 landslides in the eastern Himalayas. In addition to those aforementioned areas, when mentioning landslide-prone zones, the Loess Plateau of China should not be ignored. Due to the complex tectonic setting and strong tectonic activities, the Loess Plateau is characterized by frequent earthquakes, and thus coseismic landslides are densely distributed [7]. In addition, Loess has water sensitivity and strong softening properties [8], which are highly likely to induce sliding under human activities such as irrigation. Finally, the combination of multiple factors makes landslides in the Loess Plateau the most prominent geological hazards. Areas affected by previous landslides may also be unstable in the future. Thus, the focus of studies has changed from past records to future predictions [9]. For example, large-scale landslides caused by historical earthquakes can easily become the locations of rainfall landslides [7]. Constantine and Dunne [10] produced the first dataset based on the high-resolution Google Earth imagery. Remote sensing images from the Google Earth (GE) platform have been widely used for landslide identification in recent years. Visual interpretation can avoid the defects of automatic identification [11]. Sato and Harp [12] used publicly available imagery from GE to perform a preliminary evaluation of the landslide hazard triggered by the 2008 Wenchuan earthquake and its aftershocks. They proved that GE is an effective and fast reconnaissance tool. Using the remote sensing images provided by GE, Li et al. [13] deciphered 1000 medium–large landslides triggered by the 1920 earthquake. Using similar methods and a combination of detailed fieldwork, Xu et al. [7] completed an inventory of landslides on the Loess Plateau containing approximately 80,000 landslides. Visual interpretation has been developed rapidly, along with the updated iterations of images. Our study area, Baoji City, is located in the southwest corner of the Loess Plateau, which is the transition zone between the Ordos Plate and the Yangtze Plate (Figure 1). Detailed large-scale landslide cataloguing work in the study area is scarce. To provide a thorough landslide inventory, we visually interpreted large-scale landslides in the region using optical remote sensing imagery, mainly from Google Earth. By comparing with the existing literature and hazard records, a detailed large-scale landslide database of Baoji City was finally compiled. The flow of our study is shown in Figure 2.
In the previous study [14], we focused on the analysis of the data and only briefly described the data acquisition process. In this work, we describe the landslide data acquisition process in detail.

2. Data Description

2.1. Source of Google Earth Imagery

Google Earth is a virtual earth software developed by Google. With the support of this platform, one can arrange satellite photos, aerial photography, and GIS on a three-dimensional model of the earth. Since the launch of Google Earth in June 2005, millions of people have gained unprecedented access to data due to its intuitive user interface and rich underlying imagery. Moreover, attributed to the update of Google Earth 5 in early 2009, users were allowed to browse historical aerial photos and archived satellite images [15], making it easier for users to compare changes in features in different periods. In November 2016, the Google Earth Timelapse feature was updated to allow users to view changes in the Earth’s surface from 1984 to 2016 through satellite images. The abundant source of satellite imagery on Google Earth platform has brought great convenience to our landslide interpretation work. The specific image types used in Google Earth are not disclosed; only the suppliers are disclosed. We summarized some of the most commonly used satellite images in Table 1, and their highest resolution can reach 0.5 m. In our study, the satellite image coverage of the workspace is 100%. Furthermore, the multi-temporal available historical imagery is also a major strength of the Google Earth platform, and we selected historical images from March 2009 to March 2022 (mainly including March 2009, December 2013, May 2015, September 2017, August 2019, and March 2022) in this study. Figure 3 shows satellite images from three different historical periods. Through the comparison of multi-temporal satellite images, we can more accurately identify historical large-scale landslides.

2.2. How to Use the Landslide Inventory

According to the basis of landslide interpretation (see Section 3), we represented the spatial extent of landslides as vector polygons in the Google Earth platform. Each landslide has its own corresponding file, which is stored in KML format. Crosby [16] has explained the interactive features of KML files in detail. Then, we imported this file into ArcGIS to perform repair operations such as checking landslide self-intersection and topology analysis. After the file format conversion, the landslide information was stored in shp format for subsequent studies. We identified a total of 3422 large-scale (area > 5000 m2) landslides, and their location information and areas are shown in Figure 4.

3. Methods

With the development of remote sensing technology, the visual interpretation of remote sensing images has saved tremendous time on external work and has gradually become an important method for cataloging landslides. For experienced geologists, the interpretation of remote sensing imagery is an intuitive process without sophisticated technical skills [17]. Many landslides that occurred a long time ago are already difficult to distinguish from color differences. At this time, visual interpretation is more effective than automatic identification. Based on the Google Earth platform, we interpreted remote sensing images of the entire study area. To avoid regional omissions, we used a grid-by-grid approach to complete the landslide interpretation of the entire workspace according to the latitude and longitude grid provided in Google Earth. Specifically, we selected and maintained a constant line-of-sight height of 1.5 km to identify large-scale landslides. Due to the long-term landscape evolution, large-scale landslides are often transformed into farmland or settlements, etc. Thus, we could ignore the influence of micro-geomorphic landscapes when identifying such landslides. The zoom-in and zoom-out tools were used when the line-of-sight could not detect the overall landslide outline. The study area was located on the Loess Plateau, where vegetation cover has little effect on the identification of landslide contours. The three-dimensional features of Google Earth imagery magnified the morphological appearance of the terrain, and therefore subtle morphological changes were revealed, realizing the identification and interpretation of the topographical features of typical landslides. In this study, we mainly used the following topographic features to identify landslides:
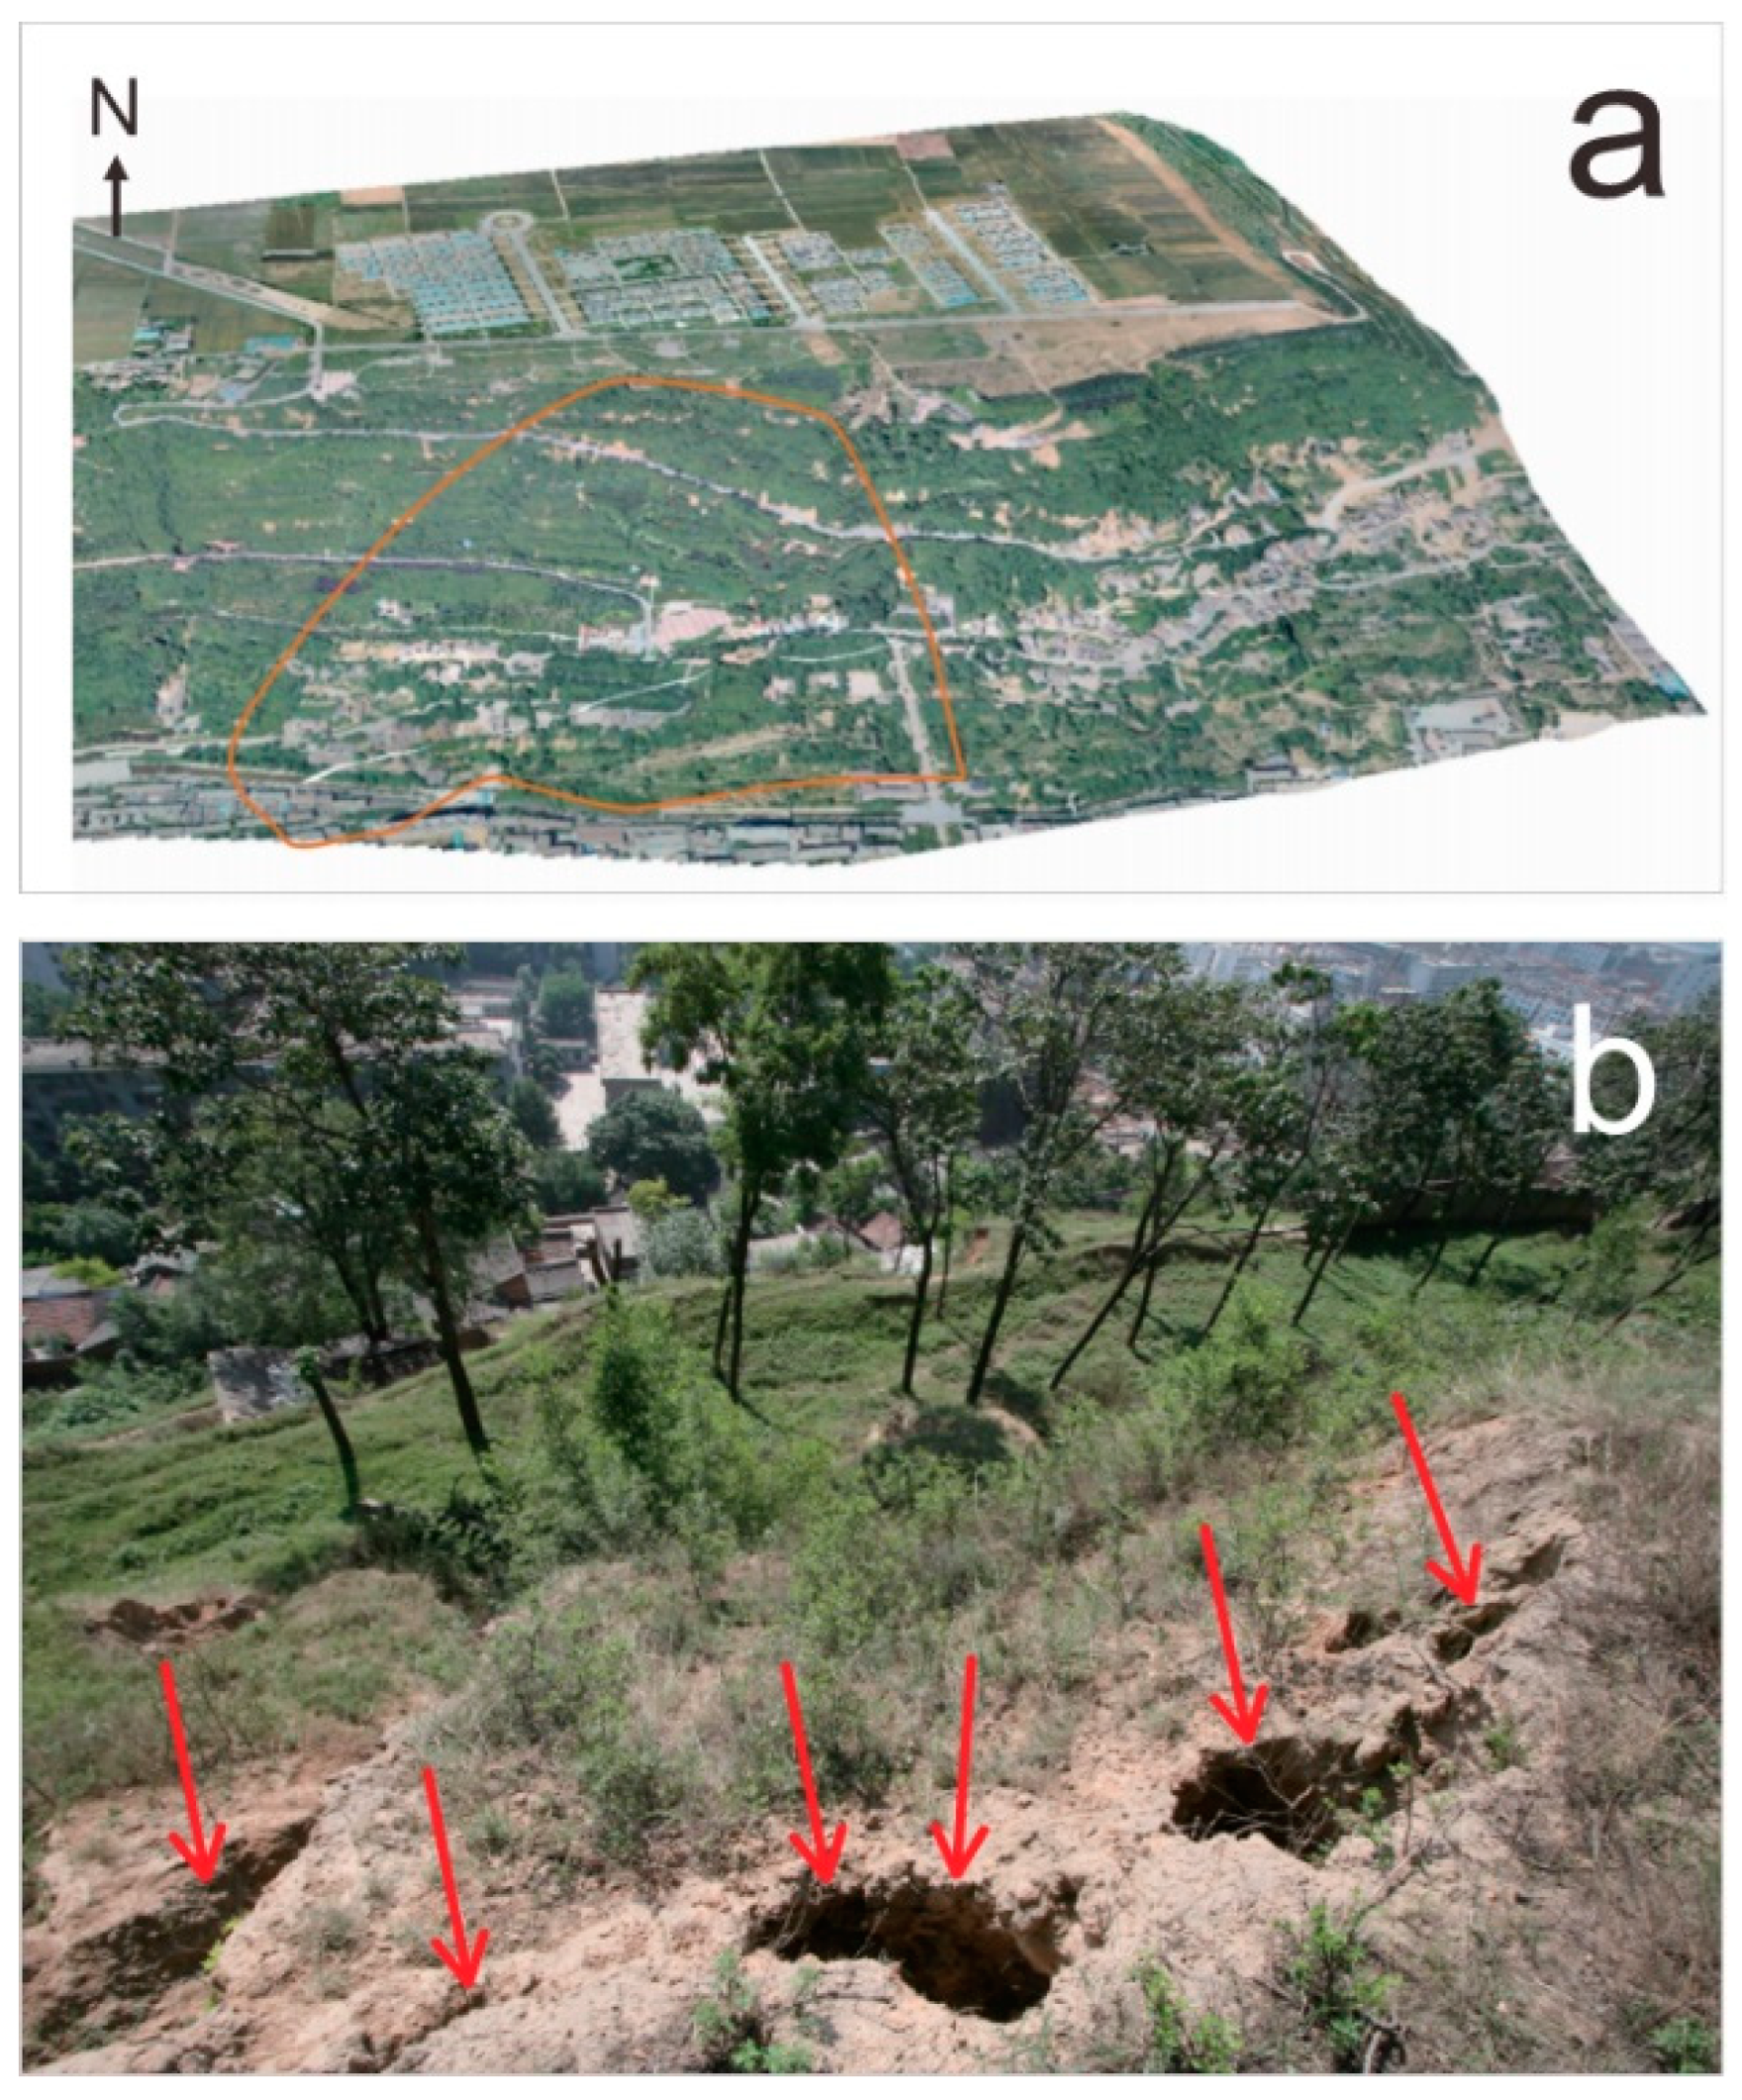
  • The rear wall of the landslide shows a lap-chair shape, an unusually curved ridgeline, arc-shaped tensile fissures, and steep ridges.
  • Closed depressions develop in the middle and rear of the landslide body with a gentle slope. Compared with the non-slip area, the surface unit has obvious depressions. However, some traction landslides tend to exhibit stepped sliding walls on the slope and steep central terrain.
  • Irregular echelon distribution is seen on the landslide body. These terrains are often transformed into farmland or residential areas.
  • Fissures are distributed in the middle and front edge of the landslide body, showing abnormal colors and textures.
  • The undulating terrain formed by the deposits on the leading edge of the landslide is often in a tongue-like shape.
  • Dramatic slope changes are observed in the source and accumulation areas: both steep slopes and gentle slopes exist.
  • The vegetation on the landslide body exhibits the pattern of “sabal” trees and “drunken” forests.
  • There are gullies developed on both sides of the landslide body, showing the shape of “double ditch homology”.
  • Accumulations on the front edge of the landslide leads to river diversion and even the formation of dammed lakes.
The criteria mentioned above should be used selectively and flexibly for landslide identification in different terrains, and there is no particular combination of criteria that is applicable to all scenarios [18]. For landslides with multi-phase slips, the identified boundary is the range covered by the largest slip area. Figure 5 shows several typical large-scale landslides based on the above characteristics. Large-scale landslides can be seen in clusters on both sides of the river valley or in the farmland plateau area (Figure 6). Comparing with the existing literature [19,20] and hazard records (Figure 7 and Figure 8), we cross-checked and supplemented the previous interpretation results repeatedly and finally obtained a relatively complete inventory of large-scale landslides in Baoji City.
However, the visual interpretation used in this study also has some limitations, mainly in the following three aspects: (1) our database only includes landslides larger than 5000 m2, which cannot guarantee the completeness of the inventory of smaller landslides; (2) due to the geomorphological evolution, the boundaries of some landslides are blurred, and multiple landslide boundaries are superimposed during the interpretation; and (3) there is not yet an accepted standard for interpretation, and the topographic features we mention are only applicable to Baoji city or areas with similar topography.

4. Conclusions

The target area of this study is Baoji City, which is located in the southwest corner of the Loess Plateau. We visually interpreted all the large-scale (area > 5000 m2) landslides in the study area using multi-temporal high-resolution remote sensing images provided by the Google Earth platform. As a result, we identified a total of 3422 landslides, the distribution of which is shown in Figure 9. The total landslide area was 360.7 km2 and the average area was 105,400 m2 for each individual landslide; the largest landslide had an area of 1.71 km2, and the smallest one was 6042 m2. Compared with previous results, the large-scale landslide database in Baoji City obtained in our study is more complete. The landslide inventory is shared in shp format, providing basic data for various future studies.

Author Contributions

C.X. and Z.Z. proposed the research concept and provided basic data; Z.Y. and M.L. provided basic data; L.L. processed the initial data and wrote the manuscript. All authors have read and agreed to the published version of the manuscript.

Funding

This study was supported by the National Institute of Natural Hazards, Ministry of Emergency Management of China (ZDJ2021-12) and the Lhasa National Geophysical Observation and Research Station (NORSLS20-07).

Institutional Review Board Statement

Not applicable.

Informed Consent Statement

Not applicable.

Data Availability Statement

Publicly available datasets are described in this study, and these can be found at https://doi.org/10.5281/zenodo.6668092 (accessed on 20 June 2022) under a Creative Commons Attribution 4.0 International license.

Acknowledgments

We are grateful to the anonymous reviewers for their constructive comments and suggestions that improved the quality of the manuscript.

Conflicts of Interest

The authors declare no conflict of interest.

References

  1. Peng, J.; Leng, Y.; Zhu, X.; Wu, D.; Tong, X. Development of a loess-mudstone landslide in a fault fracture zone. Environ. Earth Sci. 2016, 75, 658. [Google Scholar] [CrossRef]
  2. Peng, J.; Wang, S.; Wang, Q.; Zhuang, J.; Huang, W.; Zhu, X.; Leng, Y.; Ma, P. Distribution and genetic types of loess landslides in China. J. Southeast Asian Earth Sci. 2018, 170, 329–350. [Google Scholar] [CrossRef]
  3. Dai, F.; Lee, C.; Ngai, Y. Landslide risk assessment and management: An overview. Eng. Geol. 2002, 64, 65–87. [Google Scholar] [CrossRef]
  4. Stanley, T.; Kirschbaum, D.B. A heuristic approach to global landslide susceptibility mapping. Nat. Hazards 2017, 87, 145–164. [Google Scholar] [CrossRef]
  5. Guzzetti, F.; Malamud, B.D.; Turcotte, D.L.; Reichenbach, P. Power-law correlations of landslide areas in central Italy. Earth Planet. Sci. Lett. 2002, 195, 169–183. [Google Scholar] [CrossRef]
  6. Larsen, I.J.; Montgomery, D.R. Landslide erosion coupled to tectonics and river incision. Nat. Geosci. 2012, 5, 468–473. [Google Scholar] [CrossRef]
  7. Xu, Y.; Allen, M.B.; Zhang, W.; Li, W.; He, H. Landslide characteristics in the Loess Plateau, northern China. Geomorphology 2020, 359, 107150. [Google Scholar] [CrossRef]
  8. Xu, L.; Dai, F.; Gong, Q.; Tham, L.G. Irrigation-induced loess flow failure in Heifangtai Platform, north-West China. Environ. Earth Sci. 2012, 66, 1707–1713. [Google Scholar] [CrossRef]
  9. Piacentini, D.; Troiani, F.; Daniele, G.; Pizziolo, M. Historical geospatial database for landslide analysis: The Catalogue of Landslide Occurrences in the Emilia-Romagna Region (CLOCkER). Landslides 2018, 15, 811–822. [Google Scholar] [CrossRef]
  10. Constantine, J.A.; Dunne, T. Meander cutoff and the controls on the production of oxbow lakes. Geology 2008, 36, 23–26. [Google Scholar] [CrossRef]
  11. Xu, C.; Xu, X.W.; Shen, L.L.; Yao, Q.; Tan, X.B.; Kang, W.J.; Ma, S.Y.; Wu, X.Y.; Cai, J.T.; Gao, M.X.; et al. Optimized volume models of earthquake-triggered landslides. Sci. Rep. 2016, 6, 29797. [Google Scholar] [CrossRef] [PubMed]
  12. Sato, H.P.; Harp, E.L. Interpretation of earthquake-induced landslides triggered by the 12 May 2008, M7.9 Wenchuan earthquake in the Beichuan area, Sichuan Province, China using satellite imagery and Google Earth. Landslides 2009, 6, 153–159. [Google Scholar] [CrossRef]
  13. Li, W.L.; Huang, R.Q.; Pei, X.J.; Zhang, X.C. Historical Co-seismic Landslides Inventory and Analysis Using Google Earth: A Case Study of 1920 M8.5 Haiyuan Earthquake, China. Eng. Geol. Soc. Territ. 2015, 2, 709–712. [Google Scholar]
  14. Li, L.; Xu, C.; Xu, X.W.; Zhang, Z.J.; Cheng, J. Inventory and Distribution Characteristics of Large-Scale Landslides in Baoji City, Shaanxi Province, China. ISPRS Int. J. Geo-Inf. 2022, 11, 10. [Google Scholar] [CrossRef]
  15. Fisher, G.B.; Amos, C.B.; Bookhagen, B.; Burbank, D.W.; Godard, V. Channel widths, landslides, faults, and beyond: The new world order of high-spatial resolution Google Earth imagery in the study of earth surface processes. Geol. Surv. Am. 2012, 492, 1–22. [Google Scholar]
  16. Crosby, C.J. Lidar and Google Earth: Simplifying access to high-resolution topography data. Spec. Pap. Geol. Soc. Am. 2012, 492, 37–47. [Google Scholar]
  17. Denys, B. Mass movement; the research frontier and beyond: A geomorphological approach. Geomorphology 1993, 7, 85–128. [Google Scholar]
  18. Thomas, M.L.; Ralph, W.K.; Jonathan, W.C. Remote Sensing and Image Interpretation, 7th ed.; Wiley: New York, NY, USA, 2015. [Google Scholar]
  19. Shi, J.S.; Wu, L.Z.; Wu, S.R.; Li, B.; Wang, T.; Xin, P. Analysis of the causes of large-scale loess landslides in Baoji, China. Geomorphology 2016, 264, 109–117. [Google Scholar] [CrossRef]
  20. Xu, L.; Yan, D.; Zhao, T. Probabilistic evaluation of loess landslide impact using multivariate model. Landslides 2020, 18, 1011–1023. [Google Scholar] [CrossRef]
  21. Shi, J.S.; Wu, L.Z.; Wu, S.R.; Li, B.; Wang, T.; Xin, P. Graphic Collection of Typical Landslide Hazards in Baoji; Geological Press: Beijing, China, 2016. (In Chinese) [Google Scholar]
Figure 1. Geographical location and tectonic setting of the study area (Baoji City).
Data 07 00114 g001
Figure 2. Data acquisition flow.
Data 07 00114 g002
Figure 3. Google Earth imagery from three different time periods at the same site. The white dashed line indicates the landslide boundary, and the arrow indicates the sliding direction.
Data 07 00114 g003
Figure 4. The scale and spatial distribution of landslides.
Data 07 00114 g004
Figure 5. Interpretation of nine typical landslides (ai) in the study area, with white lines indicating the back wall of the landslide and arrows indicating the sliding direction.
Data 07 00114 g005
Figure 6. Landslides are distributed in clusters (a,b) in the study area. Yellow lines indicate the landslide boundary, and arrows indicate the sliding direction.
Data 07 00114 g006
Figure 7. Bojishan landslide [21]. (a) Landslide panorama (orange line indicates landslide boundary); (b) Deformation cracks on the eastern leading edge of the landslide.
Data 07 00114 g007
Figure 8. Liujiashan landslide [21]. (a) Landslide panorama (Lens facing W); (b) Steep steps on the back edge of the landslide; (c) Longitudinal tension cracks on the front edge of the landslide.
Data 07 00114 g008
Figure 9. Distribution of 3422 landslides in the study area.
Data 07 00114 g009
Table 1. Satellite images commonly used in the Google Earth platform [15].
Type of ImageryResolutionMajor Imagery ProviderMore Information
Aerial Imagery (USA)0.5–2 mU.S. Department of Agriculture;eros.usgs.gov;
U.S. Geological Survey;www.fsa.usda.gov;
Bluesky;www.bluesky-world.com;
Aerodata International Surveys; etc.www.aerodata-surveys.com
Worldview-1, Worldview-2, Quickbird.0.5–2.5 mDigitalGlobe, Inc.www.digitalglobe.com
GeoEye-1, IKONOS0.5–3.2 mGeoEye, Inc.www.geoeye.com
SPOT5, FORMOSAT-2, KOMPSAT-2, Pleiades0.5–8 mSpot Image S.A.www.spot.com
Landsat 7 ETM+30 m or 15 m pan-sharpenedTerra Metrics, Inc.;
NASA
www.truearth.com; landsat.gsfc.nasa.gov
Ocean and lake bathymetry>100 mNOAA; SIO; U.S. Navy; NGA; GEBCO.earth.google.com/ocean
NOAA—National Oceanic and Atmospheric Administration; SIO—Scripps Institute of Oceanography; NGA—National Geospatial Intelligence Agency; GEBCO—General Bathymetric Chart of the Oceans.
Publisher’s Note: MDPI stays neutral with regard to jurisdictional claims in published maps and institutional affiliations.

