Abstract
Hyperspectral imaging is an innovative technology for non-invasive mapping, with increasing applications in many sectors. As with any novel technology, robust processing workflows are required to ensure a wide use. We present an open-source hypercloud dataset capturing the complex but spectacularly well exposed geology from the Black Angel Mountain in Maarmorilik, West Greenland, alongside a detailed and interactive tutorial documenting relevant processing workflows. This contribution relies on very recent progress made on the correction, interpretation and integration of hyperspectral data in earth sciences. The possibility to fuse hyperspectral scans with 3D point cloud representations (hyperclouds) has opened up new possibilities for the mapping of complex natural targets. Spectroscopic and machine learning tools allow or the rapid and accurate characterization of geological structures in a 3D environment. Potential users can use this exemplary dataset and the associated tools to train themselves or test new algorithms. As the data and the tools have a wide range of application, we expect this contribution to benefit the scientific community at large.
Dataset:http://doi.org/10.14278/rodare.1642 (direct link: https://rodare.hzdr.de/record/1642).
Dataset License: The dataset is published in RODARE under Creative Commons Attribution 4.0 International license. The used tools are based on the hylite toolbox that is published in github with an MIT license.
1. Summary
Oblique (non-nadir) hyperspectral imaging has advanced to become a valuable tool for geoscience and mineral exploration, in particular for the mapping of steep and otherwise inaccessible outcrops [1,2]. Yet despite recent advances in hyperspectral imaging technology, the processing of the data continues to be a complex task. Achieving meaningful and accurate results requires careful data processing and a thorough understanding of the underlying spectroscopic and geologic processes. The best practices for data acquisition and processing have not yet been established, and properly documented open-source datasets are practically non-existent.
We recently developed and published open-source software tools for the accurate processing of oblique hyperspectral scenery, including geometric, atmospheric and topographic corrections [1,2,3]. Several of those procedures are compiled in the open-source python package hylite [4], which, for the first time, provided a comprehensive and open-source workflow for the creation of fully corrected reflectance hyperclouds and their basic analysis.
In this contribution, we build on this to publish a three-dimensional, km-scale hyperspectral dataset of a well-exposed mineral deposit—the Black Angel at Maarmorilik (West Greenland, Figure 1)—along with interactive tools that fully document an open-source workflow for data projection, correction, analysis and visualization. With this dataset we aim to (1) showcase good practices in oblique hyperspectral data processing, (2) demonstrate the added value of fully corrected 3D hyperspectral data to mineral exploration, (3) motivate further workflow development, and (4) provide a relevant geological test case for spectral analysis and machine learning, e.g., the development of deep spectral unmixing methods that could help to make more specific predictions of mineral abundances. In an accompanying paper [5], we extend on the actual geological interpretation and validation of the dataset. There, we demonstrate the dataset’s value in increasing the understanding of the deformation style in the Mârmorilik marbles and the subdivision between evaporite–carbonate platform facies and carbonate slope facies.
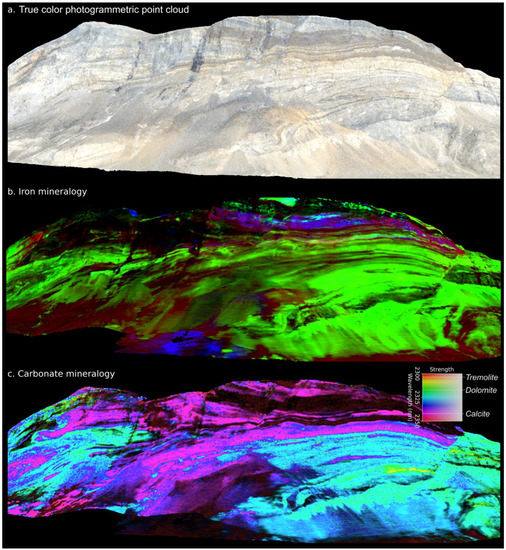
Figure 1.
Example visualizations showing part of the Maarmorilik dataset, including (a) true-color RGB projection of the photogrammetric pointcloud, (b) a false-color composite iron index (red = Fe3+, green = Fe2+, blue = FeOH in e.g., chlorite or biotite), and (c) a minimum wavelength map sensitive to carbonate mineralogy.
The Black Angel is the largest carbonate-hosted Zn–Pb deposit in Greenland, located on the north side of the Affarlikassaa Fjord at Maarmorilik (71° N, 51° W; Figure 2), West Greenland. Smaller satellite ore bodies are also located at Nunngarut, on the southern side of the Affarlikassaa Fjord. The Black Angel mine produced 11.2 million tons of Zn–Pb concentrate (12.3% Zn, 4.0% Pb and 29 ppm Ag) between 1973 and 1990 [6]. Mineralization occurs as strata-bound lenses up to 30 m thick [6] within metamorphosed carbonates (marbles) of the Paleoproterozoic Mârmorilik Formation, and is thought to represent deformed MVT-type mineralization [7,8]. These lenses appear to be structurally controlled, although the complex deformation and metamorphism of the ore body and surrounding host rock, and the associated ore remobilization, make it difficult to distinguish primary and secondary controls at ore location [9]. The ore is mainly composed of pyrite, sphalerite and galena, with abundant rotated marble fragments and quartz inclusions. Accessory minerals are pyrrhotite, chalcopyrite, tennantite and arsenopyrite [10].
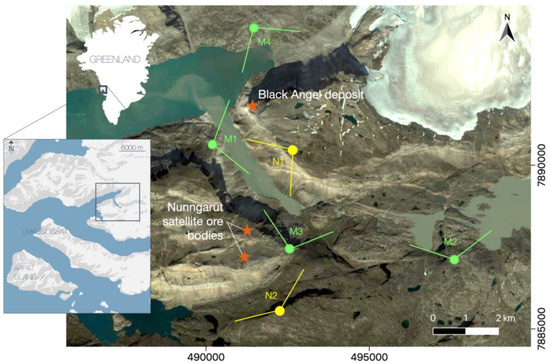
Figure 2.
Location of Maarmorilik and surrounding hyperspectral scanning positions M1–M4 and N1–N2 (reference system: UTM 22 N. Imagery from Google Earth Inc., Mountain View, CA, USA, 2018).
With the continuous, well-exposed, km-scale cliffs surrounding the Black Angel Mountain of Greenland, the locality presents ideal exposures for oblique hyperspectral mapping. The technique proves not only to be beneficial for mineralization targeting and mineral mapping, but also helps mitigate the limited access and logistical challenges associated with exploration in the Arctic. These challenges often hinder the acquisition of good-quality airborne and satellite hyperspectral data (e.g., AVIRIS-NG, PRISMA), and include frequent cloud and snow cover, rapidly changing weather conditions and sparse infrastructure. Further, the nadir view and the insufficient spatial resolution of most traditional hyperspectral remote sensing platforms limit the mapping performance at the steep cliffs and small-scale structures of the Maarmorilik mineralization.
We believe that the challenges associated with the acquisition of high-quality hyperspectral data in the Arctic and comparably challenging environments underline the value of the presented dataset. Ultimately, the workflow allows for the accurate, fast and non-invasive surface mapping of any steep and/or topographically complex targets. Potential applications outside geoscience and mining include environmental studies or infrastructure monitoring.
2. Data Description
The published dataset includes the 3D reflectance hypercloud, examples of relevant map derivatives and all necessary data to interactively reconstruct the undergone processing steps. Specifically, the radiometrically uncorrected input data includes:
- 6 input radiance images that were corrected and projected to derive the hypercloud,
- 2 photogrammetric RGB point clouds, split into four subsets,
- relevant metadata (reference panel spectra, initial camera locations, time and date, etc.).
These data were fused, corrected and projected to derive:
- 4.
- a merged reflectance hypercloud, split into four subsets,
- 5.
- a variety of hypercloud derivatives as exemplary visualizations of mineral compositional variations.
To ensure reproducibility and help make hyperspectral digital outcrop analysis more accessible to the broader scientific community, we also document the workflow required to perform these corrections and analyses as:
- 6.
- an interactive Google Colab implementation of the processing workflow based on the tools included in hylite,
- 7.
- PDF printouts of these notebooks to ensure lasting documentation.
These sub-datasets are described in detail in the following:
2.1. Input Radiance Images
The radiance image sub-dataset includes six files of an identical data structure. The data are comprised of a flat-binary raster file, with the accompanying metadata stored in an ASCII header file (this is the standard ENVI Image File format: for details, please refer to https://tinyurl.com/envifmt (accessed on 25 July 2022)). The binary data stream is stored in the least significant byte first (LSF) 16-bit unsigned integer format using Band Sequential (‘BSQ’) image encoding (i.e., each line of the data is followed immediately by the next line in the same spectral band). The ASCII header file includes all relevant metadata of the hyperspectral image, e.g., dimensions, information on the binary encoding, measurement parameters, list of wavelengths, and external metadata that are described in detail in Section 2.3.
The ENVI format is now an established unofficial standard for the storage of large hyperspectral data cubes, and is accepted by most software and libraries for the visualization and processing of imaging spectroscopic data, including ENVI, ArcGIS, QGIS, GDAL, SPy, HypPy and hylite.
Each of the six presented file pairs store a hyperspectral scene representing the radiance measured from six overlooks (Table 1) with panoramic views of ~1 km high cliffs bounding the Affarlikassaa Fjord at Maarmorilik (Figure 2). As described in Section 3, these data were derived by merging and radiometrically calibrating multiple consecutive Specim AisaFENIX acquisitions to maximize the signal-to-noise ratio. Once converted to floating point values by division with the reflectance scale factor (see Section 3.3), radiance values are given in [μWcm−2 nm−1 sr−1] for each pixel of the image over 450 spectral bands, and are masked to remove sky and other background pixels for convenience.

Table 1.
Hyperspectral scenes used to construct the hypercloud. Coordinates in ETRS89 UTM zone 22N.
2.2. Photogrammetric RGB Point Clouds
Four photogrammetric RGB point clouds serve as a base for the hyperspectral point clouds, with two for Mârmorilik and two for Nunngarut. These are derived from photogrammetric reconstructions of the Mârmorilik and Nunngarut area, respectively (see below), which were subset to create four point clouds, one for each of the Nunngarut scenes, and one for each side of the Black Angel Mountain. Apart from RGB color, the point clouds each contain two scalar fields: (a) illuminance, calculated using the PCV (portion de ciel visible) plugin [11] in the open-source software CloudCompare (v. 2.12.0), and (b) a scree vs bedrock classification, based on a manual interpretation of the RGB and the slope values. Both point clouds are saved in the Stanford Triangle Format (.ply) and can be imported and visualized with most 3D visualization and modeling software such as the open-source tool CloudCompare.
2.3. Relevant Metadata
Image metadata are stored in ASCII *.hdr text files with the same filename as the corresponding binary image data (Section 2.1). These contain all relevant information required for the conversion of the radiance data to a reflectance hypercloud, including:
- data dimensions and band counts,
- acquisition date and time,
- integration time used for each of the two sensors in the Specim AisaFENIX,
- reflectance spectra of the reference targets used during data acquisition,
- information on the wavelength and full-width half-max (FWHM) sensitivity of each band,
- the reflectance scale factor needed to convert 16-bit integer values stored in the binary image file to floating point radiance measurements.
The implementation of the metadata in the processing scheme is described in detail in Section 3.
2.4. Merged Reflectance Hypercloud
As described in detail in Section 3, the radiance data were corrected to derive reflectance estimates and fused to create a 3D hypercloud [1,3,4] containing ~1 m spaced spectral measurements covering the visible–near to short-wave infrared range (380–2500 nm). These points are stored as vertices in a Stanford Triangle Format *.ply file, with scalar attributes for each hyperspectral band’s reflectance. These files can be loaded using open-source software such as CloudCompare or hylite [4].
2.5. 3D Hypercloud Derivatives
The corrected 3D hypercloud can be analyzed using a plethora of well established and emerging hyperspectral processing techniques [12,13,14,15]. To help constrain the geology of the target area, we have included the results from several well-established analysis techniques, specifically:
- a saturation-enhanced false-color composite image showing variation in reflectance around three diagnostic short-wave infrared absorption features at 2200 nm, 2250 nm and 2350 nm,
- a false-color composite iron index comprised of several band ratios sensitive to iron-bearing minerals,
- a series of minimum wavelength maps sensitive to specific variations in carbonate and silicate mineralogy,
- a ternary visualization of the three dominant absorption features mapped by the minimum wavelength technique.
These derivative products are described in detail in Section 3.
2.6. Google Colab Implementation and GitHub Repository
As a primary goal of this publication is to promote open and reproducible hyperspectral data processing and facilitate the uptake of hyperspectral imaging techniques in the geoscience community, we have included the processing workflow that was used to derive our results as a detailed and interactive Google Colab notebook. This interactive notebook is available here: https://tinyurl.com/Maamorilik01 (accessed on 25 July 2022). Google Colab notebooks for subsequent minimum wavelength mapping and visualization are also available at https://tinyurl.com/Maamorilik02 (accessed on 25 July 2022) and https://tinyurl.com/Maamorilik03 (accessed on 25 July 2022).
2.7. Jupyter Notebook Printouts
To ensure the lasting documentation of the Google Colab workflow, non-interactive printouts (in PDF format) of the processing notebooks have also been included for reference.
3. Methods
3.1. Structure from Motion Photogrammetry
A photogrammetric survey of the field area was conducted in 2015 by the Geological Survey of Denmark and Greenland (GEUS) for the KarratZinc project [16] to generate high-resolution digital outcrop models. In total, 859 RGB images were collected from the Maarmorilik and Nunngarut area from a helicopter using a pre-calibrated 36.3-megapixel Nikon D800E digital-SLR camera equipped with a 35 mm 1.4 L Zeiss lens (focus fixed to infinity). The photos were geotagged using an external GPS (error ± 5–10 m). Agisoft Metashape Professional version 1.6.3 was used to generate a photogrammetric reconstruction following the protocols outlined by [17,18,19]. For Maarmorilik, 712 photos were used to build a dense cloud with a ground resolution of 26.3 cm/pixel and a mean reprojection error of 0.2 pixels. For Nunngarut, 512 images were aligned to produce a dense cloud with a ground resolution of 26.6 cm/pixel and a mean reprojection error of 1.3 pixels. The processing reports for the Maarmorilik and Nunngarut area describing this photogrammetric model in more detail are included in the dataset.
3.2. Hyperspectral Data Acquisition
For data acquisition, a SPECIM AisaFENIX hyperspectral push-broom scanner was operated from a tripod with a rotary stage (Figure 3). This hyperspectral camera acquires data in the visible and near-infrared (VNIR) to short-wave infrared (SWIR) range in a line of 384 pixels with 624 spectral bands. The spectral resolution of the sensor varies between 3.5 nm in the VNIR range (380–970 nm) to 12 nm in the SWIR (970–2500 nm). Acquisitions were performed between 21–22 August 2016 (Table 1), during which the hyperspectral camera was deployed on cliffs at six locations around the Black Angel Mountain and Nunngarut peninsula, respectively (Figure 2). The distance from the scanning positions to the target varied from between 1 and 4 km, resulting in a mean ground sampling distance of between 2 and 5 m (Table 1). At each location, a series of three to six consecutive datasets were captured (using identical exposure settings), and the GPS position of the camera, acquisition time and general viewing direction of the scan were recorded. A Spectralon™ white reference panel (with >99% reflectance in the VNIR and >95% in the SWIR) was set up within the field of view and in an orientation similar to the outcrop for characterizing the illumination conditions. The reference was set 10–20 m away from the sensor to ensure a sufficient pixel coverage. Atmospheric conditions during data acquisition were overall dry and sunny, but locally hazy, possibly due to upwelling water vapor from the Affarlikassaa and Qaamarujuk fjords.
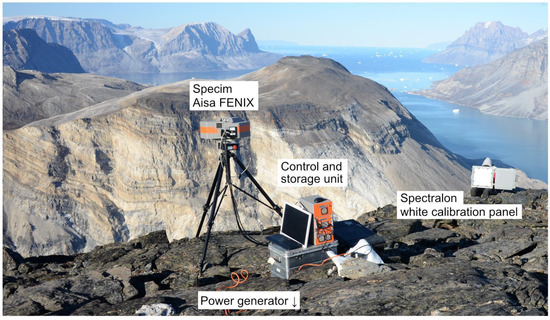
Figure 3.
Measurement setup for hyperspectral data acquisition.
3.3. Hyperspectral Data Correction
Hyperspectral data from each of the viewing stations were corrected individually and then fused to create a seamless 3D hypercloud (Figure 4). First, acquisitions from each location were corrected for sensor effects by subtracting dark current measurements and applying a radiometric and optical calibration to derive a lens-corrected radiance image. Next, these were averaged to improve the signal-to-noise ratio and condense data from each imaging location into a single image file (cf. Section 2.1). As described in [4], the scale invariant feature detector (SIFT) [20] was then used to identify matching points between the image and high-resolution photogrammetric point cloud data and the PnP algorithm [21] used to estimate the camera pose (location and orientation) relative to the point cloud. This alignment allowed topographic information (surface orientation, sky view fraction and viewing distance) to be projected onto the hyperspectral image, and the radiometric correction methods described by [1,3] were applied to correct for illumination effects and path radiance, respectively. Following this illumination correction, the resulting reflectance estimates were projected onto the photogrammetric point cloud and averaged (weighted by ground sampling distance to preserve resolution) with the other images. This resulted in the reflectance hyperclouds that are provided as part of this open dataset (Figure 5).
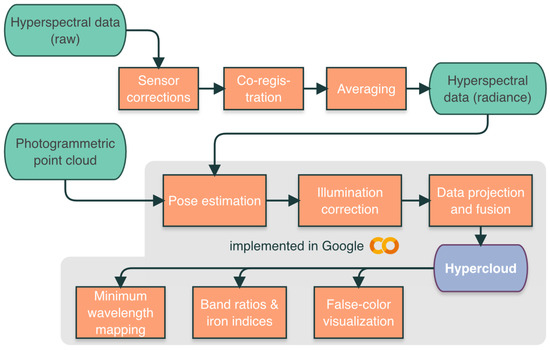
Figure 4.
Processing workflow to generate the Maarmorilik and Nunngarut 3D hyperclouds.
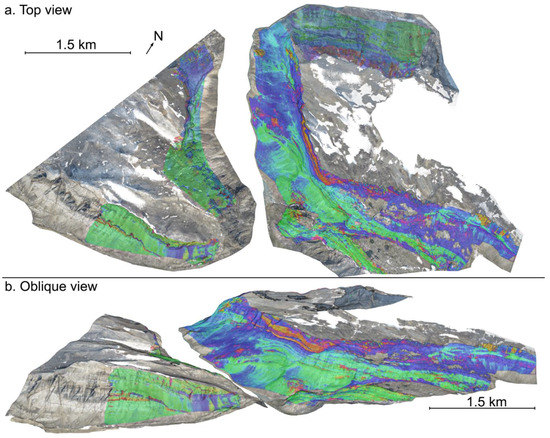
Figure 5.
Top (a) and oblique (b) view of the four hyperclouds (M1, M4, N1 and N2). Colors are saturation-enhanced hull-corrected absorbance at 2200, 2250 and 2350 nm. Background RGB values are from the photogrammetric point cloud.
3.4. Analysis and Visualization
As the geology at Maarmorilik is dominated by calcitic and dolomitic marbles (with subordinate metapelite units), several standard algorithms have been applied to these reflectance spectra to distinguish the main lithological units. The spectral signatures of carbonate minerals within the Vis, VIR and SWIR have been described in depth by [13,22,23,24,25,26]. Calcite and dolomite show distinctive absorption features at 2300–2350 nm, caused by vibrational overtone processes of carbonate ion bonds [14,27]. For pure calcite, this absorption feature is located at ~2340 nm, while the features of pure dolomite shifted to ~2320 nm [28]. A shift to even shorter wavelengths can identify an additional occurrence of tremolite [25], which exhibits a broad absorption feature at ~2310 nm due to the vibrational overtones of the Mg–OH bond, and exhibits additional absorption at ~2385 nm. The amplitude of these various absorption bands correlates with the abundance of the respective minerals, and physical properties such as porosity, grain size and texture [28,29]. Iron band ratios sensitive to the presence of Fe3+ (600 nm/570 nm), Fe2+ ((920 nm + 1650 nm)/(1230 nm + 1035 nm)) and FeOH (2280 nm/2245 nm) also reveal interesting geological variability, including iron oxides associated with a gossanized ore body and mine drainage (Figure 1b).
The presence of intimate mixtures of, e.g., calcite, dolomite and tremolite, in the marbles of the Mârmorilik Formation [9,16], and the lack of access for validation sampling, makes the accurate identification of mineral abundance from remotely sensed hyperspectral spectra a significant scientific challenge (Figure 6). These complexities are further compounded by the presence of various lichen species, which can be abundant in the Maarmorilik area, and sometimes exhibit absorption features in the 2180–2300 nm range [30].
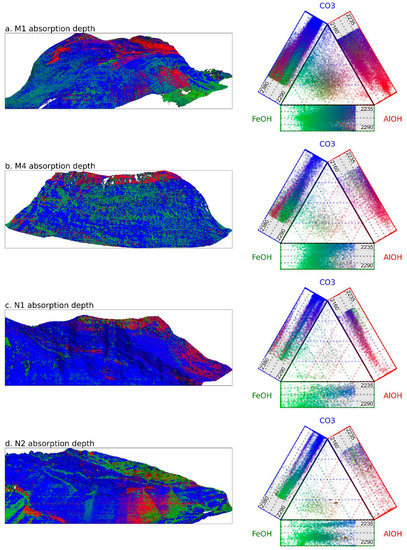
Figure 6.
Ternary image and corresponding diagram showing the relative depths of the Al–OH (red), Fe–OH (green) and CO3/MgOH (blue) absorptions in the Mârmorilik (a,b) and Nuungarut (c,d) hyperclouds. Marginal plots on the ternary diagrams show the variation in position of these respective absorption features, highlighting, e.g., the range in position of the CO3 absorption. These results emphasise the spectral mixing caused by variation in the abundance of different carbonate minerals (calcite and dolomite; spectrally represented by the CO3 feature) and silicate minerals that are also present in the marbles (phlogopite and tremolite; spectrally represented by the FeOH and MgOH features).
In spite of these challenges, analysis techniques such as minimum wavelength mapping [14,15] are able to distinguish distinct calcitic, dolomitic and tremolite-rich horizons within the Mârmorilik Formation. Figure 6 shows the results from a multi-minimum wavelength algorithm implemented in hylite [4]. Three asymmetric gaussian absorption features were fit to hull corrected spectra in the 2150–2440 nm range, quantifying the position and depth of the ~2200 nm AlOH, 2250 FeOH and ~2300–2350 MgOH/CO3 absorptions.
These results can distinguish, e.g., metapelite spectra dominated by the AlOH absorption from carbonate spectra dominated by the CO3 absorption. The metapelite units can also be distinguished by the comparatively low albedo (dark color) and the presence (in some areas) of absorption features associated with white micas (notably the Al–OH vibrational overtone located at ~2200 nm) [31] and biotite or chlorite (the Fe–OH vibrational overtone at ~2250 nm) [31].
Visualizations of the three main absorptions in the SWIR range created by mapping the absorption depth and position to the saturation and hue (respectively) [15] resolves more subtle variation in mineralogy within the Maarmorilik marbles, especially in the carbonate units. The geometries outlined by contacts between the calcitic and dolomitic marbles (Figure 7) highlight a structural complexity that is not apparent using only RGB data from photogrammetric overflights. An interpretation of these geometries is beyond the scope of this data descriptor, but is the subject of an accompanying paper [5].
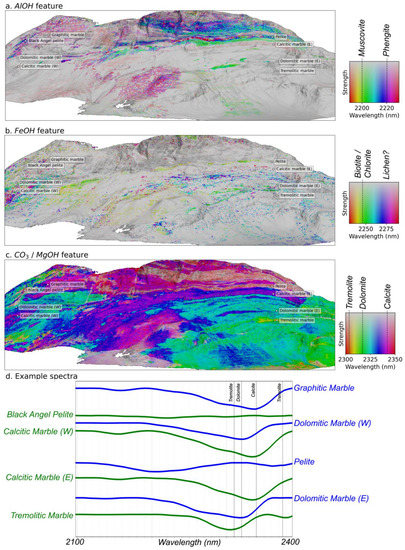
Figure 7.
Example minimum wavelength mapping results showing the position (hue) and depth (saturation) of the diagnostic AlOH (a), FeOH (b) and overlapping CO3/MgOH (c) absorption features in the SWIR for the M1 hypercloud. Gray indicates the absence of an absorption feature. Some example spectra are plotted for reference (d). Variations within the metapelite units, for example, due to different mica and clay minerals, can be seen in (a), while dolomitic (green) and calcitic (purple) marbles can be distinguished in (c). The FeOH feature (b) is more difficult to interpret, but suggests the presence of chlorite or biotite (possibly phlogopite) in the marbles.
While the relatively simplistic data visualizations (minimum wavelength maps and band ratios) presented here accurately resolve these geometries, overlaps between the absorption features characteristic of the rock-forming minerals in the Mârmorilik Formation (e.g., muscovite, biotite, tremolite, calcite and dolomite) require more sophisticated unmixing techniques to accurately disentangle. We thus suggest that this presents a challenging test for, e.g., deep spectral unmixing methods, which could help to resolve these difficulties and make more specific and quantitative predictions of mineral abundances.
4. User Notes
All relevant links to the dataset, online visualization and CoLabs are listed below:
- download dataset: http://doi.org/10.14278/rodare.1642 (accessed on 25 July 2022)
- online PoTree preview: https://tinyurl.com/Maamorilik (accessed on 25 July 2022)
- corrections colab: https://tinyurl.com/Maamorilik01 (accessed on 25 July 2022)
- processing colab: https://tinyurl.com/Maamorilik02 (accessed on 25 July 2022)
- analysis colab: https://tinyurl.com/Maamorilik03 (accessed on 25 July 2022)
The folder/file structure of the dataset is visualized in Figure A1. The folders Inputs, hyperclouds and visualizations are organized to be compatible with the hylite “HyCollection” file structure to allow for the easy import and handling of the contained files. The folders are indicated by the ending *.hyc, can also be opened without the usage of hylite and contain the published datasets as described in Section 2.
The collection folder Inputs.hyc contains the input radiance data as described in Section 2.1, grouped by locality (Nunngarut = nngt.hyc, Maarmorilik = mmlk.hyc) and named after the scanning positions (N1, N2, M1, …). A .png preview image accompanies each input file. Pointcloud files indicated by topo_**.ply contain the related photogrammetric pointclouds as described in Section 2.2. The processing reports documenting the creation of the photogrammetric pointclouds can be found in the folder photogrammetry_reports.
The collection folder hyperclouds.hyc contains the reflectance hypercloud, split into four subsets, again indicated by the name of the scanning position. Here, the input of M1, M2 and M3 has been merged into one hypercloud, indicated by the name M1.
The collection folder visualizations.hyc contains the derivatives of each hypercloud as described in Section 2.5. Here, **_F2200.ply, **_F2250.ply and **_F2350.ply are the minimum wavelength maps sensitive to 2200, 2250 and 2350 nm, respectively. **_Fe.ply visualizes the false-color composite iron index, **_domF.ply the ternary visualization of the three dominant absorption features and **_ENH.ply the saturation-enhanced false-color composite.
The folder processing_notebooks contains the PDF printouts as described in Section 2.7.
Author Contributions
Conceptualization, S.L., R.G. and G.U.; methodology, S.L. and S.T.T.; software, S.T.T. and S.L.; validation, D.R., P.G., E.V.S. and R.Z.; formal analysis, S.T.T., G.U., R.Z., S.L. and M.K.; data curation, S.T.T., M.K. and S.L.; visualization, S.T.T., M.K. and S.L.; writing—original draft preparation, S.L., S.T.T., M.K., R.G. and G.U.; writing—review and editing, S.L., S.T.T., M.K., G.U., R.Z., P.G., N.B., E.V.S., D.R. and R.G. All authors have read and agreed to the published version of the manuscript.
Funding
Data acquisition was supported by GEUS (Geological Survey of Denmark and Greenland), and MMR (Ministry of Mineral Resources of Greenland) within the project “Karrat Zinc” (project No. 11734).
Institutional Review Board Statement
Not applicable.
Informed Consent Statement
Not applicable.
Data Availability Statement
The data presented in this study are openly available. Please refer to "User notes".
Conflicts of Interest
The authors declare no conflict of interest. The funders had no role in the design of the study; in the collection, analyses, or interpretation of data; in the writing of the manuscript or in the decision to publish the results.
Appendix A
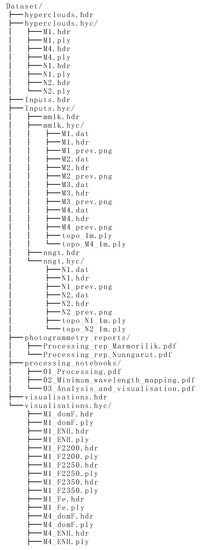
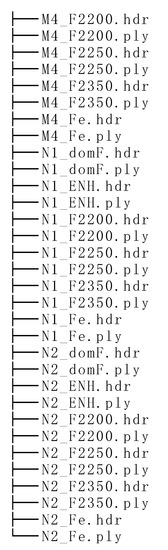
Figure A1.
Folder/file structure of the published dataset (http://doi.org/10.14278/rodare.1642, accessed on 25 July 2022).
References
- Lorenz, S.; Salehi, S.; Kirsch, M.; Zimmermann, R.; Unger, G.; Vest Sørensen, E.; Gloaguen, R. Radiometric Correction and 3D Integration of Long-Range Ground-Based Hyperspectral Imagery for Mineral Exploration of Vertical Outcrops. Remote Sens. 2018, 10, 176. [Google Scholar] [CrossRef] [Green Version]
- Kirsch, M.; Lorenz, S.; Zimmermann, R.; Tusa, L.; Möckel, R.; Hödl, P.; Booysen, R.; Khodadadzadeh, M.; Gloaguen, R. Integration of Terrestrial and Drone-Borne Hyperspectral and Photogrammetric Sensing Methods for Exploration Mapping and Mining Monitoring. Remote Sens. 2018, 10, 1366. [Google Scholar] [CrossRef] [Green Version]
- Thiele, S.T.; Lorenz, S.; Kirsch, M.; Gloaguen, R. A Novel and Open-Source Illumination Correction for Hyperspectral Digital Outcrop Models. IEEE Trans. Geosci. Remote Sens. 2021, 60, 5511612. [Google Scholar] [CrossRef]
- Thiele, S.T.; Lorenz, S.; Kirsch, M.; Acosta, I.C.C.; Tusa, L.; Herrmann, E.; Möckel, R.; Gloaguen, R. Multi-scale, multi-sensor data integration for automated 3-D geological mapping. Ore Geol. Rev. 2021, 136, 104252. [Google Scholar] [CrossRef]
- Guarnieri, P.; Thiele, S.; Baker, N.; Sørensen, E.V.; Kirsch, M.; Lorenz, S.; Rosa, D.; Unger, G.; Zimmermann, R. Unravelling the deformation of Paleoproterozoic marbles and Zn-Pb ore deposits, combining 3D-photogeology and hyperspectral data (Black Angel mine, central West Greenland). Minerals 2022, 12, 800. [Google Scholar] [CrossRef]
- Thomassen, B. The Black Angel lead-zinc mine at Maarmorilik in West Greenland. Geol. Ore 2003, 2-2003, 1–12. [Google Scholar]
- Partin, C.A.; DeWolfe, Y.M.; Magee, T. Origin of sediment-hosted Pb-Zn mineralization in the Paleoproterozoic Mârmorilik and Qaarsukassak formations, Karrat Group, West Greenland. Ore Geol. Rev. 2021, 134, 104164. [Google Scholar] [CrossRef]
- Rosa, D.; Leach, D.; Guarnieri, P.; Bekker, A. The Black Angel Deposit, Greenland: A Paleoproterozoic Evaporite-Related Mississippi Valley-Type Zn-Pb Deposit. Miner. Depos. 2022, in press. [Google Scholar] [CrossRef]
- Pedersen, F.D. Remobilization of the massive sulfide ore of the Black Angel Mine, central West Greenland. Econ. Geol. 1980, 75, 1022–1041. [Google Scholar] [CrossRef]
- Kolb, J.; Keiding, J.K.; Steenfelt, A.; Secher, K.; Keulen, N.; Rosa, D.; Stensgaard, B.M. Metallogeny of Greenland. Ore Geol. Rev. 2016, 78, 493–555. [Google Scholar] [CrossRef]
- Berthaume, M.A.; Winchester, J.; Kupczik, K. Ambient occlusion and PCV (portion de ciel visible): A new dental topographic metric and proxy of morphological wear resistance. PLoS ONE 2019, 14, e0215436. [Google Scholar] [CrossRef]
- Ghamisi, P.; Yokoya, N.; Li, J.; Liao, W.; Liu, S.; Plaza, J.; Rasti, B.; Plaza, A. Advances in Hyperspectral Image and Signal Processing: A Comprehensive Overview of the State of the Art. IEEE Geosci. Remote Sens. Mag. 2017, 5, 37–78. [Google Scholar] [CrossRef] [Green Version]
- Van der Meer, F. Spectral reflectance of carbonate mineral mixtures and bidirectional reflectance theory: Quantitative analysis techniques for application in Remote Sensing. Remote Sens. Rev. 1995, 13, 67–94. [Google Scholar] [CrossRef]
- van der Meer, F. Analysis of spectral absorption features in hyperspectral imagery. Int. J. Appl. Earth Obs. Geoinf. 2004, 5, 55–68. [Google Scholar] [CrossRef]
- van Ruitenbeek, F.J.A.; Bakker, W.H.; van der Werff, H.M.A.; Zegers, T.E.; Oosthoek, J.H.P.; Omer, Z.A.; Marsh, S.H.; van der Meer, F.D. Mapping the wavelength position of deepest absorption features to explore mineral diversity in hyperspectral images. Planet. Space Sci. 2014, 101, 108–117. [Google Scholar] [CrossRef]
- Rosa, D.; Dewolfe, M.; Guarnieri, P.; Kolb, J.; LaFlamme, C.; Partin, C.; Salehi, S.; Sørensen, E.V.; Thaarup, S.; Thrane, K.; et al. Architecture and Mineral Potential of the Paleoproterozoic Karrat Group, West Greenland—Results of the 2016 Season. Danmarks og Grønlands Geologiske Undersøgelse Rapport 2017, 98p. Available online: https://data.geus.dk/gpub-landingpage/?id=32501 (accessed on 25 July 2022). [CrossRef]
- Carrivick, J.L.; Smith, M.W.; Quincey, D.J. Structure from Motion in the Geosciences; John Wiley and Sons, Ltd.: Chichester, UK, 2016; p. 208. [Google Scholar]
- James, M.R.; Robson, S.; d’Oleire-Oltmanns, S.; Niethammer, U. Optimising UAV topographic surveys processed with structure-from-motion: Ground control quality, quantity and bundle adjustment. Geomorphology 2017, 280, 51–66. [Google Scholar] [CrossRef] [Green Version]
- James, M.R.; Chandler, J.H.; Eltner, A.; Fraser, C.; Miller, P.E.; Mills, J.P.; Noble, T.; Robson, S.; Lane, S.N. Guidelines on the use of structure-from-motion photogrammetry in geomorphic research. Earth Surf. Processes Landf. 2019, 44, 2081–2084. [Google Scholar] [CrossRef]
- Lowe, D.G. Object recognition from local scale-invariant features. In Proceedings of the Seventh IEEE International Conference on Computer Vision, Kerkyra, Greece, 20–27 September 1999; Volume 1152, pp. 1150–1157. [Google Scholar]
- Bradski, G.; Kaehler, A. Learning OpenCV: Computer vision with the OpenCV Library; O’Reilly & Associates: Sevastopol, CA, USA, 2008; p. 575. [Google Scholar]
- Hunt, G.R.; Salisbury, J.W. Visible and near infrared spectra of minerals and rocks. II. Carbonates. Mod. Geol. 1971, 2, 23–30. [Google Scholar]
- Clark, R.N.; King, T.V.V.; Klejwa, M.; Swayze, G.A.; Vergo, N. High spectral resolution reflectance spectroscopy of minerals. J. Geophys. Res. 1990, 95, 12653–12680. [Google Scholar] [CrossRef] [Green Version]
- Clark, R.N. Spectroscopy of Rocks and Minerals, and Principles of Spectroscopy; John Wiley and Sons: New York, NY, USA, 1999; pp. 1–50. [Google Scholar]
- Gaffey, S.J. Reflectance spectroscopy in the visible and near-infrared (0.35–2.55 µm): Applications in carbonate petrology. Geology 1985, 13, 270–273. [Google Scholar] [CrossRef]
- Gaffey, S.J. Spectral reflectance of carbonate minerals in the visible and near infrared (0. 35–2.55 microns); calcite, aragonite, and dolomite. Am. Mineral. 1986, 71, 151–162. [Google Scholar]
- Hunt, G.R. Spectral signatures of particulate minerals in the visible and near infrared. Geophysics 1977, 42, 501–513. [Google Scholar] [CrossRef] [Green Version]
- Zaini, N.; Van der Meer, F.; Van Ruitenbeek, F.; De Smeth, B.; Amri, F.; Lievens, C. An Alternative Quality Control Technique for Mineral Chemistry Analysis of Portland Cement-Grade Limestone Using Shortwave Infrared Spectroscopy. Remote Sens. 2016, 8, 950. [Google Scholar] [CrossRef] [Green Version]
- Turner, W.A.; Laamrani, A.; Rivard, B. Laboratory reflectance spectra of hydrothermally altered carbonate facies, Pine Point mining camp, NWT, Canada. Geochem. Explor. Environ. Anal. 2003, 3, 369–379. [Google Scholar] [CrossRef]
- Salehi, S.; Rogge, D.; Rivard, B.; Heincke, B.H.; Fensholt, R. Modeling and assessment of wavelength displacements of characteristic absorption features of common rock forming minerals encrusted by lichens. Remote Sens. Environ. 2017, 199, 78–92. [Google Scholar] [CrossRef]
- Laukamp, C.; Rodger, A.; Legras, M.; Lampinen, H.; Lau, I.C.; Pejcic, B.; Stromberg, J.; Francis, N.; Ramanaidou, E. Mineral physicochemistry underlying feature-based extraction of mineral abundance and composition from shortwave, mid and thermal infrared reflectance spectra. Minerals 2021, 11, 347. [Google Scholar] [CrossRef]
Publisher’s Note: MDPI stays neutral with regard to jurisdictional claims in published maps and institutional affiliations. |
© 2022 by the authors. Licensee MDPI, Basel, Switzerland. This article is an open access article distributed under the terms and conditions of the Creative Commons Attribution (CC BY) license (https://creativecommons.org/licenses/by/4.0/).