1. Introduction
The development of modern Smart Cities relies on integrating digital infrastructure and real-time monitoring systems to reach sustainable development goals [
1]. Effective energy management in key urban sectors depends on data-driven decision-making to optimize resources and reduce environmental impact [
2,
3,
4]. In this context, the Marginal Abatement Cost Curve (MACC) is a widely used visual tool that shows the relationship between the Marginal Abatement Cost (MAC) and the Abatement Potential (
) of Greenhouse Gas (GHG) emissions [
5,
6,
7]. The MAC is defined as the additional cost of preventing one more unit of carbon dioxide equivalent (CO
2e), while
measures the total potential CO
2e reduction [
8,
9]. The MACC helps prioritize options, guide budget decisions, and clearly illustrate the trade-offs between costs and emissions reductions [
10,
11].
The assessment of decarbonization pathways fundamentally relies on tools that link mitigation costs to emission reductions. Historically, the MACC has served as the cornerstone for such evaluations across complex sectors, ranging from shipping and aviation [
9,
12] to heavy industry [
10,
13]. Methodological approaches in the current literature span from top-down macroeconomic evaluations using Computable General Equilibrium (CGE) and directional distance function (DDF) models [
6,
14] to bottom-up engineering models employing linear optimization [
6,
13]. To address flaws in classical MACCs, such as the inaccurate ranking of negative-cost options, authors have proposed extended methodologies that continuously rank interventions by abatement magnitude rather than by distorted cost ratios [
10]. Despite these algorithmic advances, the vast majority of existing MACC frameworks remain fundamentally deterministic, assuming idealized implementation conditions and largely ignoring the complex, stochastic nature of urban ecosystems.
For smart cities, bottom-up strategies are particularly important because they leverage detailed data and traceability of assumptions to clearly link technologies to their potential to reduce energy consumption [
15,
16]. However, the literature indicates that the MACC has methodological shortcomings that may bias its use as an urban prioritization tool [
17,
18]. Deterministic estimates often omit parametric uncertainty in costs and prices, as well as the heterogeneity in adoption conditions among users [
19,
20,
21]. A key limitation is the rebound effect: when an efficiency improvement lowers the cost of using a service (e.g., lighting or mobility), users may increase their demand, partially or fully offsetting the expected savings [
22]. The rebound effect is defined as the difference between the expected savings based on technical estimates and the savings actually realized [
14,
23]. The theory identifies at least three levels: (i) direct, where there is an increase in demand for the specific improved service [
24]; (ii) indirect, when the monetary savings are spent on other goods that also use energy [
25]; and (iii) systemic, which includes overall effects like changes in prices and competitiveness [
26]. This distinction is especially helpful in Smart Cities contexts because it clearly shows that a strategy’s success depends not only on the technology but also on the socioeconomic system where it is implemented.
A critical vulnerability in current climate policy modeling is the prediction-performance gap, often driven by the behavioral rebound effect [
27]. When energy efficiency measures reduce the marginal cost of energy services, consumers routinely adjust their behavior, such as prioritizing greater thermal comfort over expected energy savings, thereby triggering direct, indirect, and macroeconomic rebound effects [
14,
24,
28]. The external literature has attempted to quantify these phenomena ex post using tools such as Stochastic Frontier Analysis (SFA) [
29], Generalized Method of Moments (GMM) [
30], and dynamic CGE models [
31]. In this context, energy management in the transportation sector is increasingly complex, requiring not only technical efficiency but also advanced optimization. Recent research has highlighted the potential of adaptive large neighborhood search algorithms for green vehicle routing [
32] and the use of collaborative robotic vehicles to improve the sustainability of urban supply chains [
33]. While these econometric models successfully identify economy-wide efficiency offsets, they do not provide localized, predictive risk metrics that decision-makers can apply prospectively. Consequently, traditional assessments treat behavioral adjustments as static historical averages rather than as dynamic sources of risk. This highlights the essential need for the Abatement Erosion Probability (AEP), Financial Backfire Probability (FBP), and Environmental Backfire Probability (EBP) metrics proposed in the manuscript. Unlike retrospective econometric measures, these novel metrics explicitly quantify the tipping points at which behavioral backfire neutralizes the financial viability or environmental benefits of a specific urban intervention, providing a targeted risk-assessment tool sorely lacking in conventional frameworks.
To address uncertainties in energy planning, standard literature has typically relied on one-dimensional sensitivity analyses [
9,
27]. However, these static approaches fall short in Smart City environments, which are characterized by massive datasets and highly nonlinear interdependencies among technological, economic, and behavioral variables [
6,
34,
35]. Advanced probabilistic methods have been used in isolation to address these complexities. To handle this complexity in urban big data analysis, probabilistic methods are crucial. Monte Carlo (MC) simulation is a suitable technique for assessing parametric uncertainty by repeatedly sampling random inputs, thereby characterizing the dispersion of results and the stability of strategy rankings [
36,
37]. For instance, MC simulations are widely used to propagate parametric uncertainty in equipment performance, energy prices, and climate variability [
38]. However, since simulation alone does not establish a dependency structure, it is helpful to supplement it with Bayesian networks (BN) [
39,
40]. BN enables the representation of relationships among variables and supports conditional inference, thereby aiding decision-making by updating probabilities in response to new evidence related to urban scenarios or rebound levels [
34,
39,
41]. Therefore, from a machine learning perspective, a BN model can examine complex relationships under uncertainty [
39]. Despite their individual strengths, these computational techniques are rarely integrated. BNs are often limited to high-level sustainability or health diagnostics [
34], while MC simulation and Bayesian sampling are often confined to localized building load predictions [
38]. The lack of integration means that current models cannot simultaneously propagate large-scale parametric uncertainty and infer conditional behavioral outcomes, leaving a significant methodological gap in holistic urban planning.
Hence, this manuscript explicitly addresses these critical limitations by integrating MC simulation and BN into a cohesive, fully probabilistic framework. This approach bridges the computational gap by using MC to generate large-scale stochastic simulations across varying environmental and market conditions and employing BNs to map the causal flow from these exogenous drivers to specific behavioral rebound scenarios. This integration establishes a comprehensive virtual testbed absent from the current literature, directly translating vast arrays of stochastic data into actionable posterior probabilities for Smart City planning. By establishing clear metrics for rebound tolerance rather than relying solely on nominal abatement costs, the proposed methodology advances the frontier of urban decarbonization from static, deterministic modeling toward dynamic, risk-aware climate governance. The main goal of this research is to establish a data-driven probabilistic framework that integrates behavioral rebound effects into a bottom-up MACC construction to evaluate the robustness and risk profiles of urban mitigation strategies in Smart Cities. To achieve this, the study addresses the following research objectives:
To characterize parametric uncertainty in technical and economic inputs through large-scale MC simulations.
To quantify the impact of the direct rebound effect by incorporating a stochastic behavioral response parameter ().
To develop a BN model that captures conditional dependencies between exogenous market drivers and mitigation outcomes.
To establish probabilistic risk metrics, including FBP, EBP, and AEP, to assess portfolio resilience across diverse behavioral scenarios.
The remainder of this paper is organized as follows.
Section 2 describes the materials and methods used to develop the probabilistic framework, focusing on integrating MC simulations with BN to model the rebound effect.
Section 3 presents the results of the stochastic analysis, including the performance of the nine mitigation strategies and the quantification of the proposed risk metrics.
Section 4 provides a comprehensive discussion of these findings, exploring their implications for urban energy policy and the governance of Smart Cities. Finally,
Section 5 summarizes the main contributions of the research and addresses its limitations and potential future work.
2. Materials and Methods
A dataset of mitigation strategies was developed and organized into comparable technological setups (conventional versus efficient technologies) to estimate annual costs, emissions, and the MAC [
42]. The model incorporated the direct rebound effect using a scenario-specific behavioral parameter (
), which adjusts efficient consumption based on relative savings and then recalculates the MAC. Finally, an MC simulation was conducted using discrete scenarios for exogenous variables (energy price, discount rate, and emission factor) and for uncertainties in each strategy’s variables (initial investment, annual energy consumption, and useful life). Its outputs were discretized to train a BN that captures probabilistic dependencies and characterizes the MAC classification under uncertainty.
2.1. Dataset
The dataset is built from a combination of mitigation strategies documented in scientific literature and real-world urban case studies. It is arranged at the measure level to enable straightforward, data-driven comparisons between a traditional (conventional) technology and its high-efficiency alternative. Each entry is categorized by economic sector (ES), mainly residential, commercial, and transportation systems, and characterized by a set of technical-economic and environmental variables vital for calculating annual costs, GHG emissions, and the resulting MAC.
The core analytical unit is defined as strategy m with two distinct technological configurations, , where represents the conventional (reference) technology and the efficient alternative. To ensure structural comparability and consistency in the incremental analysis, the dataset only includes measures with complete information for both configurations within the same sector.
Furthermore, reference values are set for key exogenous variables that represent the economic and environmental conditions of the urban environment: energy price (
), annual discount rate (
r), and emission factor (
). These parameters form the basis for creating discrete scenarios in the probabilistic simulation, allowing for a thorough sensitivity analysis of environmental and market fluctuations. The overall architecture of the dataset and the definitions of its constitutive variables are summarized in
Table 1. Ultimately, this structured data serves as the foundation for both deterministic estimates and the subsequent propagation of uncertainty through MC simulations, aimed at characterizing the risk of counterproductive responses in efficient technology implementation.
2.2. Procedure for Estimating MACs
This section formalizes the analytical process for calculating the costs and emissions of each mitigation strategy. For this model, consider
m as a mitigation measure and the index
as the technological configuration, where
denotes the conventional technology and
the efficient alternative. The subscript
t indicates the respective evaluation period. First, the annualized investment is calculated using the following formula:
where
denotes the initial investment of strategy
m under alternative
i, and
is the capital recovery factor. The parameters
and
refer to the annual discount rate and the technology’s useful life, respectively. Consequently,
is represented in annual monetary units.
The operating and maintenance costs (
) are based on the direct cost structure and energy usage (Equation (
2)).
In this equation,
indicates the maintenance costs (assuming
if no specific data is available),
is the annual energy consumption of fuel
f, and
is its unit price during period
t. For applications with a single energy carrier, the expression simplifies to:
The total annual cost (
) is determined by adding the capital and operating components (Equation (
4)).
At the same time, annual GHG emissions are measured based on energy use.
where
is the emission factor associated with fuel
f. As with operating costs, for a single energy carrier, the relationship simplifies to:
Finally, the MAC of strategy
m is defined as the ratio of the increase in annual cost to the actual reduction in emissions when switching from the conventional to the efficient alternative.
This metric measures the net cost for each unit of emission avoided. A value of indicates a cost-saving strategy with overall savings and reduction, while signifies an additional cost per unit of emission reduction. It should be noted that if , the indicator loses numerical stability; such cases are classified as undefined. Similarly, if , a counterproductive environmental outcome is identified after adopting the efficient technology.
2.3. Quantifying the Rebound Effect
To integrate the rebound effect into the model, a parsimonious behavioral mechanism is introduced that adjusts the annual energy consumption of the efficient alternative. This adjustment is parameterized by a single scenario–defined behavioral response parameter (
), which quantifies the intensity of the usage response relative to the annual energy savings (
). In the present study,
is used rather than a time–varying function, a deliberate choice consistent with the scope of the proposed framework. The analysis is expressed in annualized terms because costs, energy consumption, and emissions are evaluated annually to construct the probabilistic MACC. In this setting,
is not intended to capture the full temporal evolution of behavioral adaptation but to represent alternative rebound–intensity scenarios in a parsimonious and interpretable way. The use of a scalar
was considered appropriate for this first probabilistic extension of bottom–up MACCs because it preserves model transparency and supports conditional inference in the BN stage. Therefore, the selected values of
should be interpreted as stylized behavioral scenarios rather than as estimates of an explicit intertemporal rebound trajectory. In this context, the relative energy savings are defined as:
In this expression, the operator sets a lower limit of zero to avoid rebound adjustments when there are no technical savings; therefore, measures the size of the relative energy savings for fuel f.
From this saving, the annual rebound effect (
) is determined using the following relationship:
where
represents the behavioral sensitivity parameter. The term
serves as a dimensionless multiplicative factor applied to efficient consumption; values greater than 1 indicate greater attenuation of technical savings due to user behavior.
Consequently, the annual efficient energy consumption adjusted for the rebound effect is calculated as:
For scenarios involving a single energy carrier, the expression simplifies to:
. Subsequently, this adjusted value is used to update the operating costs and emissions of the efficient alternative, replacing the nominal consumption (
) with the estimated actual consumption (
):
In single-fuel contexts, these equations reduce to their linear forms:
and
. As a final step, the Total Annual Cost (
) and the
are recalculated following the procedures described in Equations (
4) and (
7).
2.4. Monte Carlo Simulation
To characterize the stochastic variability of performance indicators in complex urban environments, an MC simulation was conducted to propagate parametric uncertainty in the technical-economic and environmental inputs for each strategy. This method enables a shift from point estimates to empirical distributions of costs, emissions, and the MAC, thereby supporting the assessment of the robustness of mitigation measures. The experimental design was organized into two related and complementary levels (see
Table 2):
Level of Exogenous Scenarios. A discrete grid of scenarios was created by combining environmental variables such as energy price (), emission factor (), and discount rate (r), along with the scenario-specific behavioral response parameter () related to the rebound effect. Each variable was tested at three levels (low, medium, and high), resulting in 81 unique scenarios for each strategy (). Symmetric proportional disturbances were applied to and , while an additive disturbance with a positivity constraint was used for r. The parameter took on deterministic values to represent different assumptions about user behavior.
Intrinsic Uncertainty Level. The natural variability of each strategy’s technological parameters was modeled using probability distributions centered on their base values. The initial investment (I) and useful life () were represented by symmetric triangular distributions with specified supports. Annual energy consumption () was modeled using a normal distribution with a standard deviation proportional to the mean, including a positive support constraint to exclude non-physical outcomes.
For each strategy-scenario combination, independent realizations were generated with a fixed seed to ensure reproducibility. In the efficient scenario, calculating includes the rebound adjustment described in the previous section, ensuring that total annual costs () and emissions () accurately reflect the response to changes in the service cost. Additionally, critical rebound factors were calculated for each realization to identify the transition points of each strategy: (i) a critical financial rebound factor (), which determines the point at which the strategy no longer remains net profitable, and (ii) a critical environmental rebound factor (), which marks the threshold where the effective reduction is stopped or becomes negative.
2.5. Bayesian Networks
To explicitly model the probabilistic dependencies among exogenous conditions, behavioral responses, and the economic-environmental performance of strategies, two complementary discrete behavioral BN were developed: one for environmental performance and another for financial performance. This representational framework allows a multivariate system to be decomposed using a directed acyclic graph (DAG), where each node represents a system variable, and the arrows indicate direct dependencies between variables [
43]. In this setup, the joint probability distribution of the system can be split according to the local Markov property.
where
represents the set of discrete variables and
denotes the set of parent nodes (direct predecessors) of
in the DAG. This property is essential for the model’s operation in Smart Cities because it enables conditional inference; that is, it allows calculating subsequent distributions of target variables by using evidence from a subset of observed variables or from scenarios defined by the analyst.
2.5.1. Discretization and Construction of the Training Set
The networks were trained on a set of realizations generated through MC simulation, thereby turning the extensive synthetic data into a probabilistic knowledge structure. To ensure the model’s full discretization and facilitate easier interpretation of the results, categorized variables derived from the simulation were used:
Performance Variables: Rebound factor class (class_rf), change in total annual cost class (class_TAC), and change in emissions class (class_Em).
Risk Indicators: Abatement-erosion probability (AEP_ind) and the binary financial (cross_fin) and environmental (cross_env) indicators.
Context and Scenarios: The strategy identifier (id_action), the economic sector (ES), and the discrete levels of the energy price (scen_ep), discount rate (scen_r), and emission factor scenarios were integrated as contextual and exogenous covariates, along with the emission factor scenario (scen_ef) and behavioral-response scenario (scen_eta).
The variable
class_rf was discretized into seven ordinal intervals to flexibly capture different rebound intensity regimes (see
Table 3). For
class_TAC and
class_Em, the categories were created based on the variation in total annual cost or the decrease in total emissions, using a specified relative tolerance threshold (
). For example, no change, increased cost, decreased cost, reduction, or increased emissions, as applicable. Additionally,
AEP_ind was defined as an indicator of abatement very close to zero, defined by
, that is, the abatement-erosion probability (AEP), which measures the risk of significant loss in mitigation effectiveness due to the rebound effect. It is important to note that all simulated strategies were included in the environmental network training set; in contrast, only the probability of losing this condition under uncertainty and rebound was estimated in the financial network, based on the strategies classified as profitable in the baseline.
2.5.2. DAG Structures
The architecture of the DAGs was manually designed based on the technical and economic principles of the MAC framework (see
Table 4). This design aims to illustrate the causal flow from exogenous drivers to performance indicators. In the Environmental Network, the realized rebound-factor class (
class_rf) depends on the sector and the behavioral scenario. Emission changes (
class_Em) rely on the specific strategy, the sector, the emission factor scenario, and the realized rebound class. Lastly, the environmental backfire (
cross_env) is determined jointly by the emission class and the abatement-erosion probability indicator.
In the Financial Network, the logic follows a similar pattern: cost changes (class_TAC) are influenced by strategy, sector, energy prices, discount rate, and rebound intensity. The financial impact (cross_fin) is directly based on the resulting cost class. This setup creates conditional independence, where scenarios and sectoral contexts first affect rebound behavior, which then determines the final economic and environmental outcomes.
2.5.3. Probabilistic Inference and Parameter Estimation
The Conditional Probability Tables (CPTs) for both networks were derived from empirical frequencies obtained from the discretized MC realization set. To address potential instabilities caused by sparsely observed evidence configurations, Bayesian smoothing was applied using a Bayesian Dirichlet equivalent uniform (BDeu) prior. An effective sample size of
was specified to allocate pseudo-counts across states. This method prevents zero probabilities and stabilizes inference when rare combinations of evidence are encountered. Once the model parameters were adjusted, exact inference was carried out using the variable elimination algorithm. In the Financial Network, the main goal was to calculate posterior distributions for the financial backfire indicator:
Simultaneously, the Environmental Network provided posterior distributions for the abatement effectiveness:
In these expressions, e represents the evidence set used with variables such as id_action, ES, class_rf, and the exogenous scenarios. This inferential framework enables explicit quantification of the probability that a mitigation strategy will lose its cost-effectiveness or fail to produce net abatement under specific scenarios of parameter and behavioral uncertainty. Consequently, it offers urban planners a robust probabilistic framework for evaluating the reliability of each strategy in a Smart City decision-making context.
2.6. Baseline Data Characterization
Before proceeding with the stochastic simulation, the baseline parameters for the nine mitigation strategies were statistically characterized.
Table 5 summarizes the descriptive statistics for the paired strategy-level variables and baseline exogenous parameters used in the probabilistic analysis. Across the portfolio, the initial investment for efficient alternatives (
) exhibits significant heterogeneity, with mean values reflecting the distinct scales of the urban sectors involved. Specifically, the residential sector strategies (IDs 1–6 and 8) required a mean investment of
, while the commercial (ID 7) and transportation (ID 9) sectors averaged
and
, respectively. This variability in investment, useful life (
), and annual energy consumption (
) underscores the need to use MC simulation to propagate uncertainty across the portfolio assessment.
3. Results
This section outlines the main findings on how the rebound effect influences the evaluated mitigation strategies. First, the key rebound thresholds for each strategy are presented. Then, the conditional backfire probabilities and probabilistic inferences under specific evidence are explored. Finally, the impact of the rebound on the MACC is assessed to highlight its implications for mitigation potential and the economic performance of the urban portfolio.
3.1. Critical Rebound Thresholds per Strategy
Table 6 presents the critical rebound thresholds for each mitigation strategy (ID) and ES under two criteria: the FRF and the ERF. These thresholds indicate the critical level of the rebound factor at which a strategy reaches a financial (
) or environmental (
) tipping point. In this context, values close to one indicate low tolerance to increases in the rebound effect, while higher values suggest greater resilience to behavioral responses that increase consumption after adoption in smart urban settings.
The results reveal clear differences among the strategies (see
Table 6). Strategy 1 leads with the highest thresholds (
;
), indicating that its economic and environmental performance remains strong at relatively high critical rebound-factor thresholds. Based on this comparison, it appears to be the most effective strategy in the portfolio. On the other hand, several strategies (2–5) have thresholds only slightly above 1 (FRF
; ERF
), suggesting that even moderate increases in the rebound factor can push them into a critical state. A similar pattern is seen for Strategy 7 (FRF
; ERF
), indicating comparable vulnerability across both criteria.
Finally, the ERF is slightly higher than the FRF in several cases; in this instance, the estimated threshold suggests that financial viability might be lost before environmental effectiveness as the rebound factor increases. Overall, these results show that the rebound effect does not affect the portfolio evenly; some measures are resilient, while others have narrow tolerance margins. Estimating differentiated critical thresholds provides a useful criterion for urban planners to prioritize resilient strategies and identify those that may require complementary measures to mitigate performance erosion under behavioral uncertainty, thereby safeguarding their net contribution to urban mitigation goals. This emphasizes that strategy prioritization should not depend only on traditional MACC metrics but also include rebound tolerance as a crucial part of urban data-driven decision-making.
3.2. Risk Probabilities Across Behavioral Scenarios
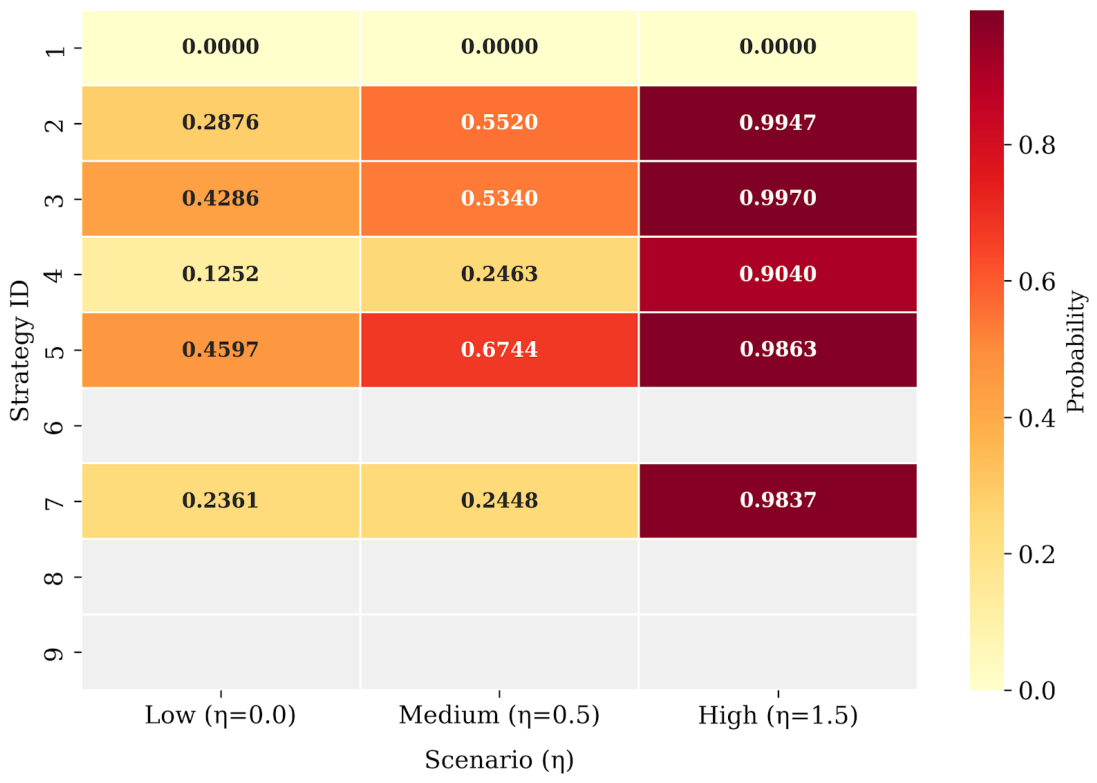
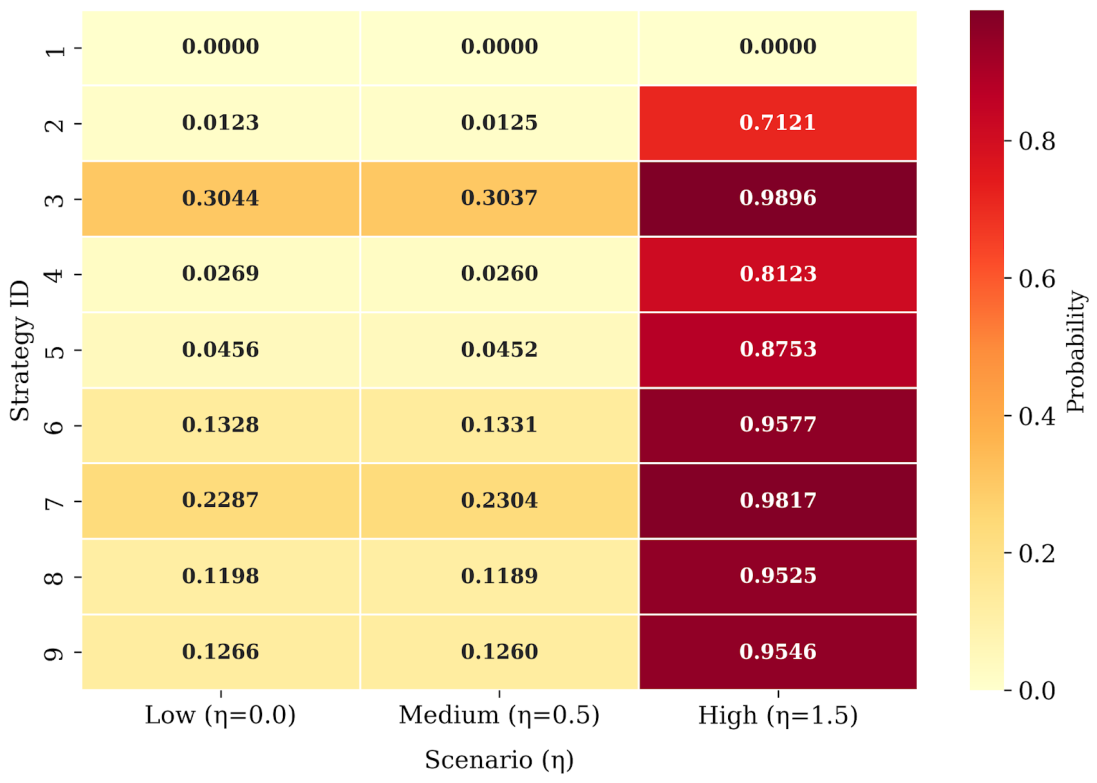
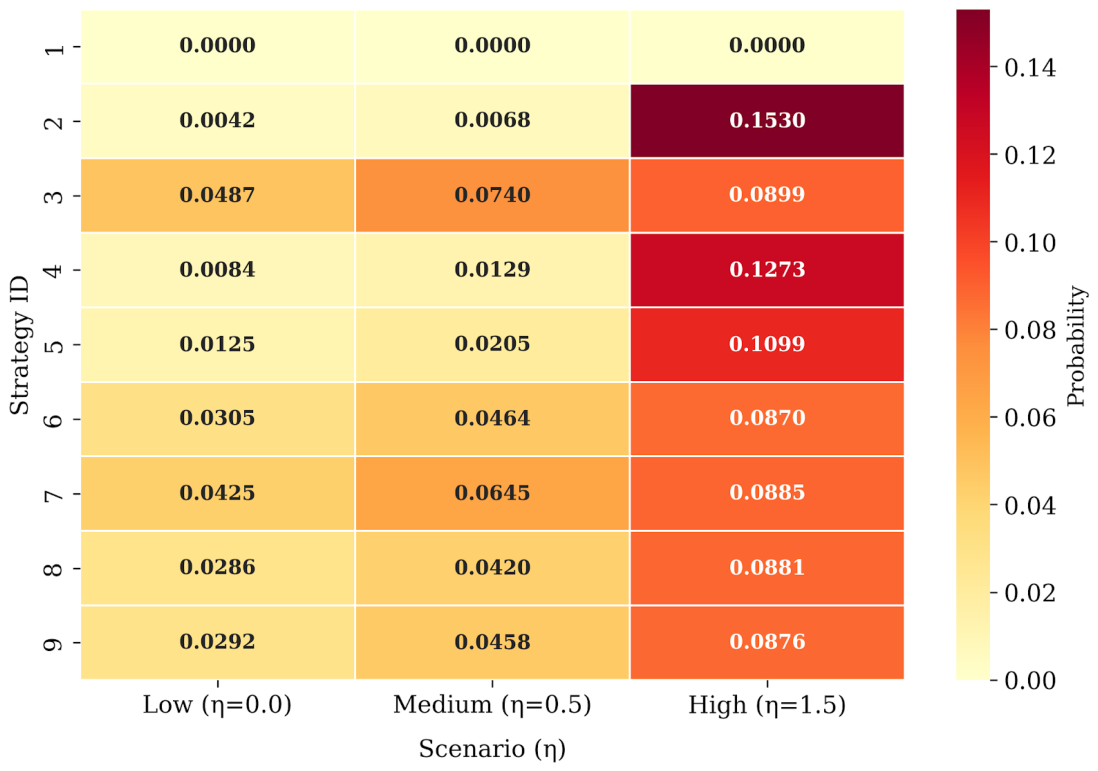
To complement the critical threshold analysis,
Figure 1,
Figure 2 and
Figure 3 display the conditioned probabilities for each mitigation strategy (ID) and economic sector across three different behavioral-response scenarios defined by the parameter
. These visualizations report: (i) the Financial Backfire Probability (FBP) in
Figure 1, (ii) the Environmental Backfire Probability (EBP) in
Figure 2, and (iii) the Abatement-Erosion Probability (AEP) in
Figure 3. The panels represent low (
), medium (
), and high (
) levels of the behavioral response. To ensure the statistical stability of the posterior estimates, each probability reported in this section was calculated over 135,000 independent stochastic realizations for each strategy and
level.
The FBP analysis shows that the residential portfolio is highly sensitive to rising total costs (see
Figure 1). While Strategy 1 (Residential) remains completely resilient with a zero FBP across all scenarios, other strategies experience a quick decline. For example, Strategy 5 (Residential) sees a sharp increase in FBP from 0.4597 in the low scenario to 0.6744 in the medium scenario, eventually reaching a critical level of 0.9863 when
. Strategies 6, 8, and 9 are marked as
NA because their baseline MAC is already positive (gray cells in the heatmap of
Figure 1), so the financial backfire concept does not apply. In these cases, the investment is justified by non-economic reasons from the start. The EBP highlights a more severe risk to the portfolio’s stability (see
Figure 2). A key finding is the behavior of Strategy 3 (Residential), which shows an EBP of 0.3044 even in the absence of a rebound effect (
), indicating environmental vulnerability. At high behavioral response levels (
), nearly the entire portfolio (IDs 2–9) exceeds the critical threshold, with EBP values over 0.71 and reaching up to 0.9896 for Strategy 3. This demonstrates that extreme rebound effects can turn mitigation efforts into net sources of emissions, a problem that requires strict demand-side management.
Finally, AEP provides a detailed view of mitigation loss rather than complete failure (see
Figure 3). Although AEP’s magnitude is lower than that of EBP, reaching a maximum of 0.1530 for Strategy 2 in the high scenario, it consistently indicates a decrease in the abatement potential. Even when a strategy does not backfire (EBP), it consistently loses effectiveness. For example, Strategy 7 (Commercial) sees its AEP rise from 0.0425 to 0.0885 as
increases, showing that although the strategy remains beneficial, its contribution to urban climate targets is significantly reduced. Together, these findings confirm that the rebound effect impacts the urban portfolio in diverse ways. While some measures, such as Strategy 1, are notably resilient, others are highly sensitive to even small behavioral changes. These results imply that high-sensitivity strategies need a dual-policy approach: technical implementation combined with data-driven demand management tools to ensure the intended net mitigation benefits in Smart City environments.
3.3. Conditioned Probabilistic Inference
Table 7 shows the posterior probabilities for three representative strategies under specific evidence configurations. In all cases, the exogenous scenarios were fixed at their
medium level, with only the behavioral scenario (
) varying. This approach isolates the impact of human response on the estimated risk, offering a clear view of how behavioral changes influence the probability of policy failure. To isolate the effect of the behavioral response, the BNs were queried with a fixed evidence set (
e). For the Environmental Network, the strategy identifier and the emission factor (EF) were set to their medium levels. Similarly, for the Financial Network, the strategy ID,
, and
r were kept at their medium values. The resulting posterior probabilities for the chosen mitigation strategies, representing their sensitivity to
low,
medium, and
high behavioral-response scenarios (
), are summarized in
Table 7.
The results demonstrate that Bayesian inference effectively preserves the overall pattern of relative vulnerability among different strategies. Strategy 1 consistently exhibits low posterior probabilities across all indicators, reflecting its strong risk profile. In contrast, Strategy 3 shows a clear rise in risk as the behavioral-response parameter increases, highlighting its sensitivity to user behavior. Finally, Strategy 9 emphasizes the environmental dimension, as it does not participate in the financial network due to its inherent lack of cost-effectiveness at the baseline. In this context, the BN acts as a virtual testbed, transforming the learned probabilistic structure into conditioned posterior distributions. This provides a probabilistic basis for scenario-specific risk assessment, enabling urban planners to evaluate risks and develop data-driven rules for specific analytical configurations of interest.
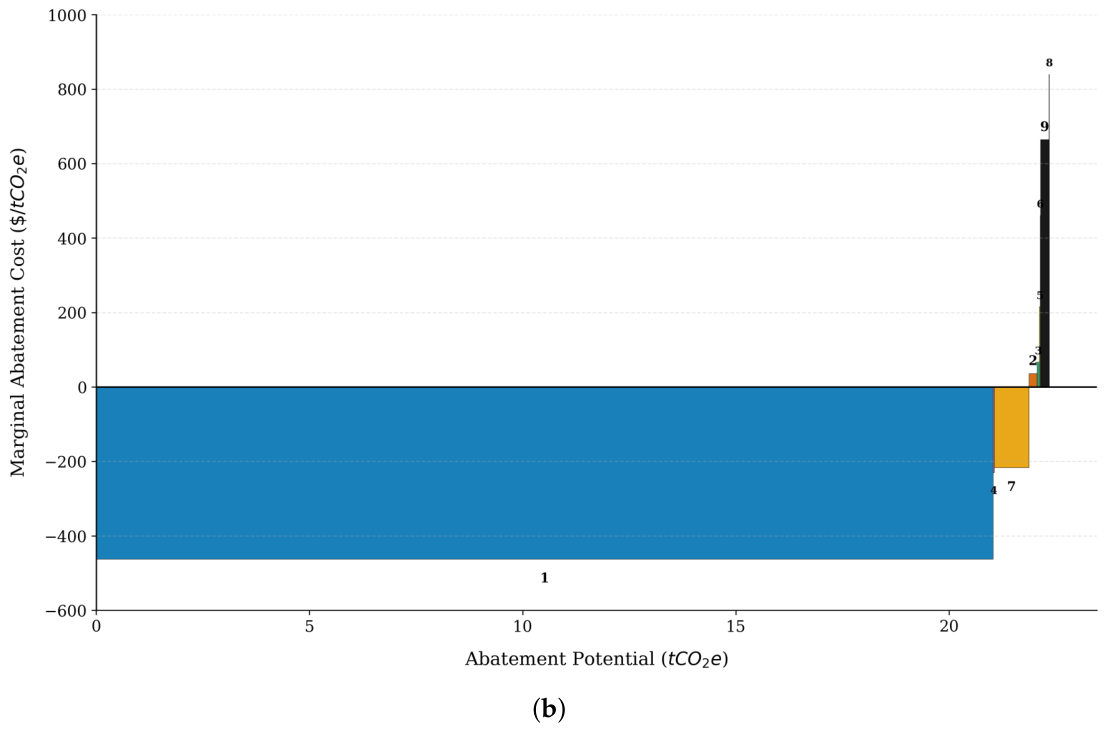
3.4. Rebound Effect on the MACC
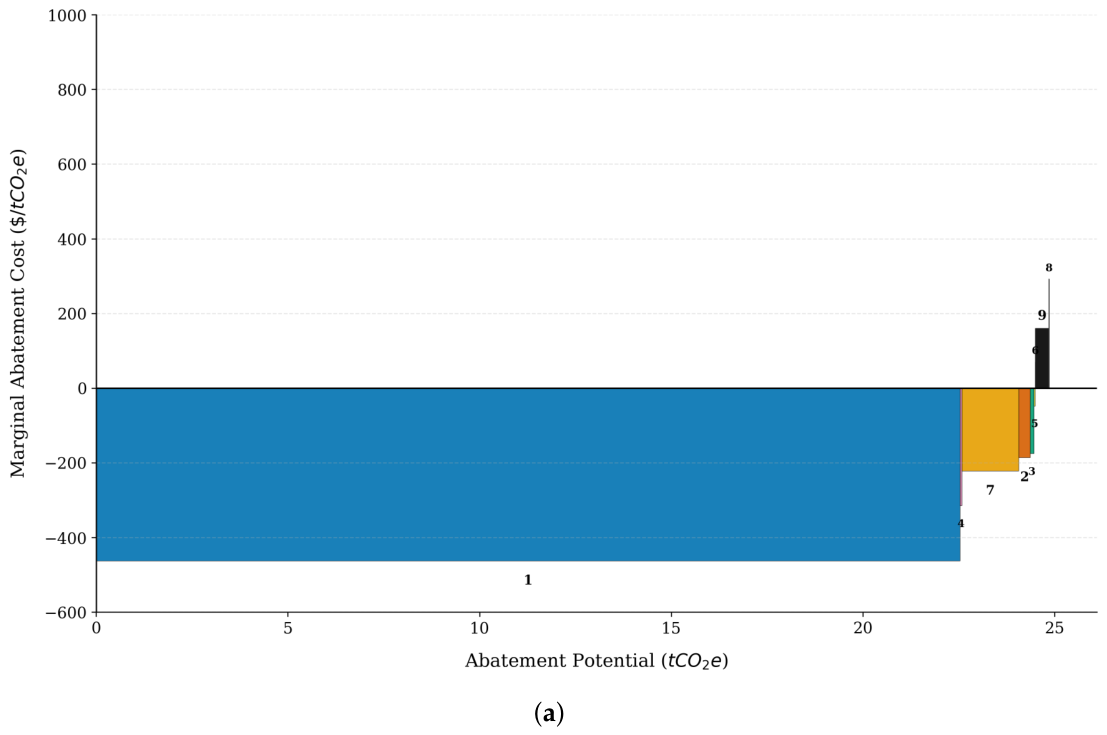
Figure 4 shows the structure of the urban mitigation portfolio under two different conditions. A dominant block (Strategy 1) accounts for most of the total
, while the other strategies yield relatively smaller marginal reductions. Panel (a) of
Figure 4 shows the baseline scenario, in which strategies are assessed without including the rebound adjustment. In this case, a large portion of the total abatement occurs within the beneficial zone (
), indicating strategies that yield net savings while reducing emissions. In contrast, bars above the zero line represent strategies that add a cost per unit mitigated; these are typically justified by non-economic reasons, such as climate goals, technological needs, or urban rules. Panel (b) of
Figure 4 includes the rebound effect with a behavioral parameter of
. This shows a situation in which users partly offset the technical energy savings by increasing their consumption, thereby reducing the overall mitigation effectiveness. This effect appears through two main patterns:
A decrease in total potential occurs as drops due to increased effective consumption.
An upward shift in the occurs as the rebound effect increases energy-related operational costs while simultaneously decreasing the denominator ().
As a result, several strategies become less economically attractive, and the opportunity zone for cost-effective measures () is substantially reduced. Specifically, including the rebound effect decreases the net total abatement from to tCO2e, representing a reduction compared to the baseline. Regarding portfolio composition, the number of strategies classified as strictly beneficial () drops from 6 to 3, while those with non-negative marginal costs increase from 3 to 6. This comparison demonstrates that even moderate rebound effects () can greatly overestimate both the abatement potential and the economic benefits of energy-efficiency strategies during initial assessments. Therefore, accounting for the rebound effect significantly changes the interpretation of the MACC, accurately reflecting the real-world energy behaviors. This data-driven approach offers a more dependable foundation for climate policy development in Smart Cities.
4. Discussion
The integration of MC simulations and BN in this study overcomes the key limitations of traditional deterministic MACCs. While standard MACCs offer a useful snapshot of mitigation costs and potential, they often neglect parametric uncertainty and behavioral feedback inherent in complex urban systems. By adopting a data-driven probabilistic framework, this research shows that the rebound effect is not just a theoretical detail but a crucial factor that can significantly change the approach to urban climate prioritization.
The results show that even moderate behavioral responses () can significantly reduce net abatement potential and increase costs across the strategy portfolio. This demonstrates that ex-ante evaluations that focus only on technical savings often overestimate both the economic benefits and the environmental impact of energy efficiency measures. Identifying financial and environmental backfire (FBP and EBP) provides a clear metric for assessing the risk of policy failure. In a smart urban setting, where sustainability goals are becoming more ambitious, understanding these backfire risks is crucial for developing resilient energy policies.
The estimated critical rebound thresholds (FRF and ERF) provide additional diagnostic criteria for comparing the robustness of mitigation strategies under behavioral uncertainty. The significant variability observed, ranging from the high resilience of Strategy 1 to the extreme fragility of strategies 2–5, indicates that strategy choice should not rely solely on the lowest nominal MAC. Instead, rebound tolerance becomes a key factor for data-driven decision-making. Strategies with low thresholds require additional interventions, such as real-time monitoring via IoT infrastructure or targeted demand-side management [
44], to prevent technical efficiency gains from being offset by increased consumption, which increases the risk of performance decline.
Using BN transforms static simulation data into a dynamic knowledge structure capable of inferential reasoning. The ability to compute posterior probabilities for specific evidence sets (such as high-price scenarios or sectoral contexts) enables decision-makers to conduct advanced what-if analyses. This capability is especially crucial for Smart Cities, where the large volume of data from diverse systems can be used to update risk assessments in real time. By measuring the AEP, the model assesses the likelihood that a mitigation strategy yields little to no effective abatement amid uncertainty.
Ultimately, this research supports shifting from deterministic planning to risk-aware urban management. The probabilistic MACC presented here serves as a robust analytical tool that can be integrated into city management systems. By leveraging Big Data to identify behavioral profiles and market fluctuations, urban agencies can focus on technologies that offer not only potential savings but also high stability across a range of future scenarios. This method helps ensure that urban growth remains sustainable, efficient, and aligned with citizens’ actual energy consumption patterns.
Despite the robustness of the proposed probabilistic framework, certain limitations must be acknowledged. First, this study primarily focuses on the direct rebound effect within specific urban sectors. However, indirect and systemic rebound effects, which involve economy-wide shifts in consumption and price structures, were not explicitly modeled and remain an area for future work. Second, while the MC engine’s use of stochastic distributions effectively handles parametric uncertainty, the framework’s accuracy is inherently tied to the quality of the input data. Integrating real-time IoT sensor data could further refine these estimates, transitioning the model from a predictive tool to a real-time monitoring system. Finally, the behavioral parameter offers a robust approximation of user response, but future research should incorporate more granular socio-psychological variables to better capture the heterogeneity of human behavior across cultural and geographic contexts.
Beyond the numerical characterization of abatement costs and potentials, these findings underscore a fundamental shift in the logic of urban climate governance. The identification of significant FBP and AEP in certain strategies suggests that reliance on nominal, deterministic performance indicators is insufficient for long-term planning. By using the proposed framework as a virtual testbed, decision-makers can identify tipping points at which behavioral responses neutralize the economic and environmental benefits of technical interventions. This perspective is especially critical for Smart Cities, where the integration of digital infrastructure and real-time data should be leveraged not only for efficiency but also for behavioral resilience. The results show that strategies with lower nominal savings but higher probabilistic stability may be preferable to high-performance options that are highly sensitive to rebound triggers. Consequently, adopting these probabilistic metrics enables the design of more robust subsidy schemes and regulatory policies explicitly tailored to the risk tolerance and socio-technical characteristics of each urban sector.
5. Conclusions
This research established a data-driven probabilistic framework that integrates behavioral rebound effects into a bottom-up MACC, providing a robust assessment of climate mitigation strategies in the context of Smart Cities. The main conclusions are summarized as follows:
The hybrid approach (MC + BN) transforms uncertain static data into a dynamic virtual testbed for policy testing. The BN conditional inference model allows urban planners to conduct what-if analyses for various economic and behavioral scenarios. The results indicate that the rebound effect is a significant factor in assessing strategy risk. Even a moderate behavioral response () caused a reduction in overall net abatement. More importantly, it significantly altered the portfolio’s economic profile by decreasing the number of cost-effective (“win–win”) strategies from six to three.
The introduction of FBP and EBP offers a precise way to evaluate a strategy’s vulnerability. These metrics enable prioritization based on rebound tolerance rather than nominal costs alone, helping identify which measures are truly resilient in real-world scenarios. Technical efficiency alone is not enough for sustainable urban growth. To meet climate goals, city leaders may need to add monitoring and demand-side strategies (likely IoT-based), especially for measures with low rebound tolerance. This ensures energy savings from technology are not offset by changes in consumer behavior. In summary, this probabilistic MACC framework acts as a robust decision-support tool, promoting a shift from deterministic planning to risk-aware urban governance in response to climate change.
Nevertheless, rebound effects may change over time as users adapt their practices, technologies mature, or consumption patterns saturate. This temporal heterogeneity was not explicitly modeled here and should be considered a limitation of the present framework. A relevant extension of this work would be to replace the scenario-based scalar with a time-dependent behavioral parameter , allowing rebound intensity to vary as users adapt to the efficient technology. Such an extension could support dynamic MACCs and Bayesian models that capture learning effects, saturation, and delayed behavioral responses. However, this would require longitudinal data and a multi–period formulation beyond the annualized scope used in the present study.
Furthermore, future extensions of this research include integrating this probabilistic MACC framework into a Digital Twin architecture for Smart Cities, which could enable real-time policy adjustments using live data streams from IoT sensors, transforming the model from a planning tool into a dynamic governance system. Finally, expanding the framework to include multi-objective optimization and to incorporate social equity and environmental justice indicators alongside cost-effectiveness would provide a more holistic tool for urban decision-making. These advancements will be crucial to ensuring that the transition to low-carbon cities is not only technically efficient but also behaviorally resilient and socially inclusive.




 ,
,