Article

Optimization of Ultrasound-Assisted Cold-Brew Method for Developing Roselle (Hibiscus sabdariffa L.)-Based Tisane with High Antioxidant Activity

by
Intan Dewi Larasati
1,
Nurul Mutmainah Diah Oktaviani
1,
Hanifah Nuryani Lioe
2,
Teti Estiasih
3,
Miguel Palma
4 and
Widiastuti Setyaningsih
1,*
1
Department of Food and Agricultural Product Technology, Faculty of Agricultural Technology, Universitas Gadjah Mada, Yogyakarta 55281, Indonesia
2
Department of Food Science and Technology, Faculty of Agricultural Engineering and Technology, IPB University, Bogor 16680, Indonesia
3
Department of Food Science and Biotechnology, Faculty of Agricultural Technology, Universitas Brawijaya, Jl. Veteran, Malang 65145, Indonesia
4
Department of Analytical Chemistry, Faculty of Sciences, Instituto de Investigación Vitivinícola y Agroalimentaria (IVAGRO), University of Cadiz, Campus del Rio San Pedro, 11510 Puerto Real, Spain
*
Author to whom correspondence should be addressed.
Beverages 2023, 9(3), 58; https://doi.org/10.3390/beverages9030058
Submission received: 1 June 2023 / Revised: 30 June 2023 / Accepted: 4 July 2023 / Published: 10 July 2023
(This article belongs to the Special Issue Process Intensification on Beverages Production)

Abstract

:
Edible flowers, including roselle, contain a varied composition of phenolic compounds that may inhibit the oxidative stress mechanism. Roselle-based tisane with appealing sensory properties is commonly consumed worldwide. However, the conventional hot-brew method may ruin the stability of thermolabile phenolic compounds during the tisane preparation. Hence, this study aimed to develop a new alternative brewing method linked with the new cold-brew method, which involves a lower temperature and applying ultrasound to maximize the extraction of phenolic compounds and to avoid degradation during the tisane preparation. The brewing factors, including particle size (10, 20, 30 mesh), temperature (4, 15, 26 °C), time (10, 20, 30 min), and ultrasound amplitude (20, 60, 100% of the maximum amplitude) have been optimized simultaneously using Box–Behnken design in conjunction with response surface methodology. Seven major phenolic compounds were identified by HPLC-DAD and classified into hydroxycinnamic acid derivatives (HCA) and flavonoids. The optimum extraction condition to reach the highest level of the studied phenolic compounds was set to brew roselle with particle size of 30 ± 3.25 mesh at 26 ± 1.32 °C for 18 ± 2.00 min applying 78 ± 5.64% ultrasound amplitude. This method successfully extracted almost all HCA and flavonoid during the first cycle with less than 10% CV and provided higher antioxidant activity in terms of DPPH (IC50 9.77 ± 0.01 µg mL−1), ABTS (IC50 8.05 ± 0.02 µg mL−1), and FRAP (IC50 10.34 ± 0.03 µg mL−1) than the roselle tisane prepared using the conventional method. Additionally, the resulting cold-brew product was stable for up to five days of storage.

1. Introduction

People’s lifestyles have evolved during the last few decades. Fast food, which has high cholesterol, sugar, and fat [1], is preferred by people involved in an increased number of activities and with considerable mobility. This behavior entrapped people in oxidative stress and led to the development of non-communicational diseases (NCDs) such as cancer, hyperglycemia, cholesterol, and stroke, which are currently rising [2]. However, healthy foods attract consumers as they become more conscious and worried about their health, mainly after the COVID-19 pandemic.
Phenolic compounds are secondary metabolites found in natural sources such as flowers that function as antioxidants and assist in regulating oxidative activity in the human body. Phenolic compounds, including cinnamic acid and flavonoids, have been shown to reduce oxidative stress [3]. These compounds also contribute to the distinct scent, flavor, and color of food [4]. These considerations have prompted the food and beverage industries to create functional foods that are not only high in phenolic compounds but also have appealing specific sensory characteristics.
Beverages have grown dramatically and attracted consumers’ interest in recent years [5]. Flower tisane is a non-coffee and tea beverage seen as a healthy source of hydration and an alternative to other beverages with high caffeine content. The most popular flower tisane on the planet is roselle (Hibiscus sabdariffa L.), which contains cinnamic acid and several flavonoid compounds that act as antioxidant compounds [6]. Roselle is a Malvaceae family plant native to West Africa and has been extensively cultivated worldwide. Two varieties of roselle (red and purple) are commonly consumed [7]. Roselle tisane is a red-colored infusion with a sweet-sour flavor that has high economic interest due to its color and its health benefit [8]. Roselle tisane is usually made using the conventional hot-brew method (100 °C water, 5 min). However, the high-temperature exposure during tisane preparation may cause degradation of the thermolabile phenolic compounds [9] then, reducing the benefits of this beverage.
The cold-brew method (4−26 °C, 24 h) is also used to make roselle tisane. Several studies have shown that cold brewing yields more bioactive compounds than hot brewing methods while also reducing the bitterness of the tisane [10,11]. Furthermore, for beverage industries that manufacture a large number of products, the cold brew method has attractive benefits, mainly because hot brewing requires a large quantity of energy to boil water and causes a high production cost [12]. Alternatively, the cold-brew method may be a viable development of ready-to-drink roselle tisane with high levels of phenolic compounds. Furthermore, to maximize the benefits of phenolic compounds in roselle tisane while enhancing the effectiveness of extraction in the cold-brew method, ultrasound-assisted extraction (UAE) appears as an advanced solution to make roselle tisane in less time at a lower temperature. UAE produces cavitation bubbles near the matrix, which generate several effects, i.e., matrix degradation and particle breakdown, thus boosting the targeted analytes to release into the solvent [13].
However, various factors may have an impact on the performance of the UAE in producing phenolic compounds-rich roselle tisane. UAE amplitude may affect the production of cavitation bubbles that enhance the disintegration of the matrix. In contrast, the effectivity of water diffusion into the matrix is affected by particle size, and the brewing temperature is likely to influence both the transmission of the ultrasound and the solubility of the phenolic compounds in the water. The extraction time also defines the amount of extracted phenolic compound from the roselle matrix [14]. Henceforth, these UAE factors must be evaluated and optimized.
A Box–Behnken design (BBD) in conjunction with response surface methodology was used together with desirability functions to establish the optimum condition of the UAE to extract multi-phenolic compounds. Furthermore, the stability and antioxidant activities (DPPH, FRAP, and ABTS assay) of phenolic compounds in the resulting roselle tisane by the UAE cold-brew method were estimated during five days of cold storage.

2. Materials and Methods

2.1. Chemical and Reagents

The standard compounds of ascorbic acid, chlorogenic acid, and rutin, as well as reagents including DPPH (2,2-diphenyl-1-picrylhydrazyl), ABTS (2,2′-azino-bis3-ethylbenzothiazoline-6-sulfonic acid), and TPTZ (2,4,6-tripiridyl-s-triazine), were obtained from Sigma Aldrich (St. Louis, MO, USA). Methanol (HPLC grade), acetic acid glacial, NaCO3, KCl, Na2HPO4, KH2PO4, and FeCl3·6H2O were obtained from Merck (Darmstadt, Germany). Aquapro for injection was supplied by PT. Ikapharmindo Putramas (Jakarta, Indonesia).

2.2. Plant Materials

The fresh roselle calyx was purchased from a local farmer in Kemloko, Selopampang, Temanggung, Central Java, Indonesia. Roselle calyx was harvested at four months old during the rainy season. Red and purple varieties of roselle calyx were used in this study. Subsequently, the flowers were dried using a dehydrator (LocknLock Food Dehydrator EJO316PIK/LBLU, Suzhou, China) at 80 °C for 4 h until the moisture content reached 5%. The particle size of the dried roselle was then reduced using a grinder (KLAZ, CG9100, Guangzhou, China) with 10 s on and 10 s off and sifted with 10, 20, and 30 mesh sifters. The sample was stored in an amber air-tight container at −24 °C.

2.3. Ultrasound-Assisted Extraction

An ultrasonic system was used to assist in extracting cold-brew methods. The ultrasound UP200St was completed with a titanium horn probe Ø 7 mm, amplitude horn 70 µm, 26 kHz, 200 W (Hielscher Ultrasonic GmbH, Teltow, Germany). The brewing temperature was controlled using a circulated water bath (J.P. Selecta, Barcelona, Spain). One gram sample was weighed and placed in a 60 mL bottle with 50 mL water as a solvent. The extraction condition was set based on the experimental design’s particle size (10, 20, 30 mesh); temperature (4, 15, and 26 °C); time (10, 20, and 30 min); and ultrasound amplitude (20, 60, and 100%). The pulse duty cycle was fixed at 1 s−1. After the extraction, the roselle extract was separated from the solid part using a Sorvall ST-8R centrifuge (Thermo Fisher Scientific, Langenselbold, Germany) at 4000 rpm for 10 min. Then, the extract volume was adjusted to 50 mL, stored in closed vials wrapped with aluminum foils, and kept at 4 °C until chromatographic analysis.

2.4. Analysis of the Phenolic by HPLC-DAD

The roselle extracts were analyzed using high-performance liquid chromatography coupled with a diode array detector (HPLC-DAD) (Shimadzu Corp., Kyoto, Japan) system. The phenolic compound separation was carried out by a C18 reverse-phase column (5 µm, 4.6 × 150 mm, Shimadzu Corp., Kyoto, Japan), and the column oven was set at 30 °C. The mobile phase consisted of phase A (2% acetic acid, 5% methanol in water) and phase B (2% acetic acid, 88% methanol in water). The gradient of elution (time, % solvent B) was 0 min, 20%; 15 min, 100%; and 18 min, 100%. The flow rate was 1 mL min−1. The extracts were filtered through a 0.45 µm nylon filter. The chromatogram was processed using LabSolutions CS (Shimadzu Corp., Kyoto, Japan). For identifying phenolic compounds, a complete scanning for the spectra (200–400 nm) was performed by DAD. Identification was carried out by comparing the retention times and spectra of compounds found in samples with standard compounds. For the quantification, a specific wavelength was used at the maximum absorbance for the corresponding compounds: 320 nm for HCA derivatives and 355 nm for flavonoid derivatives. Calibration curves with a low (0.01–10 µg mL−1) and high (20–100 µg mL−1) range were used to quantify the compounds.

2.5. Analysis of the Phenolic Stability by HPLC-DAD

The total peak area of HCA and flavonoid derivatives was used to measure and evaluate the stability of phenolic compounds in roselle extracts during five days of storage. The roselle extracts were placed in a 60 mL transparent bottle glass and stored in a 4 °C refrigerator. Phenolic stability was evaluated by checking the levels of HCA and flavonoid derivatives every 12 h with a total evaluation of 96 h by chromatographic analyses.

2.6. Evaluation of the Extraction Process

The precision of the optimized method was evaluated to observe the quality consistency of the developed ultrasound-assisted cold-brew method. Precision was reported as the coefficient of variation (CV, %) and was assessed at two levels: repeatability and intermediate precision. On the same day, nine extractions were performed for repeatability assessment, and four extractions were done on each of three different days to evaluate the intermediate precision with a total of twelve experiments. A cycle study was also performed to determine if the solid residue still contains interesting levels of phenolic compounds after the extraction under the optimum conditions defined by the MRO. Therefore, the extraction was conducted in seven cycles to confirm the optimum extraction cycle for beverage production. The extract was collected after centrifugation in the first extraction cycle, while the residue was extracted with a new solvent for subsequent extractions until the seventh extraction. The phenolic compounds in the extract from each cycle were measured. The experiment was carried out in triplicate.

2.7. DPPH Assay

Antioxidant activity assay using DPPH (α-diphenyl-β-pricylhydrazyl) expressed in radical scavenging activity (RSA, %) and IC50 value. The DPPH method was referred to by Sompong et al. (2011) [15]. One mL DPPH reagent 0.1 mM in 100% methanol was mixed with 0.2 mL roselle extract, then vortexed and incubated in dark condition for 1 h. After being incubated, the absorbance was measured at a wavelength of 515 nm. Controls were made from DPPH reagents without adding samples, and ascorbic acid was used as a standard. The percentage of RSA% was calculated using the following formula, while the IC50 (µg mL−1) value was obtained from regression analysis, with sample concentrations as the x-axis and RSA% as the y-axis.
R a d i c a l   s c a v e n g i n g   a c t i v i t y   % = [ A b s o r b a n c e   o f   c o n t r o l A b s o r b a n c e   o f   s a m p l e ] A b s o r b a n c e   o f   c o n t r o l × 100

2.8. FRAP Assay

The ferric-reducing antioxidant potential (FRAP) method was performed according to Assefa et al. [16]. FRAP reagent was prepared fresh before being used by mixing 300 mM acetate buffer (pH 3.6), TPTZ (2,4,6-tripyridyl-s-triazine) solution in 40 mM HCl and 20 mM FeCl3·6H2O with a ratio of 10:1:1 (v/v). Then, 3 mL of FRAP reagent was mixed with 0.3 mL of water and 0.1 mL of the extract and then incubated at 37 °C for 30 min. Ascorbic acid was used as standard, and a UV-Vis spectrophotometer (Thermo Scientific GENESYS 10 UV-Vis Spectrophotometer, Madison, WI, USA) was used to measure the absorbance of the mixture with the wavelength set at 593 nm. The percentage of RSA% was calculated using the following formula. At the same time, the IC50 (µg mL−1) value was obtained from regression analysis, with sample concentrations as the x-axis and the absorbance value as the y-axis.
R a d i c a l   s c a v e n g i n g   a c t i v i t y   % = [ A b s o r b a n c e   o f   s a m p l e A b s o r b a n c e   o f   c o n t r o l ] A b s o r b a n c e   o f   s a m p l e × 100

2.9. ABTS Assay

The 2,2′-azino-bis-3-ethylbenzothiazoline-6-sulfonicacid (ABTS) method was evaluated according to the method from Re et al. [17]. ABTS reagent was freshly prepared for 12–16 h incubated in the darkroom before being used with mixed 5 mL of 7 mmol L−1 of ABTS solution and 88 µL of 140 mmol L−1 potassium persulfate solution. After the incubation, then the mixture was diluted with Phosphate Buffer Saline (PBS 5 mM (pH 7.4) until the absorbance value of the mix was 0.700 ± 0.02 (Δ734 nm); this absorbance value was taken as blank absorbance value, and ascorbic acid was used as standard. For the analysis, the sample (3 mL) was mixed with 3 mL of ABTS mixture reagent and then incubated for 6 min. The sample absorbance value was calculated with the RSA% formula and the IC50 (µg mL−1) value obtained from regression analysis, with sample concentrations as the x-axis and the absorbance value as the y-axis.
R a d i c a l   s c a v e n g i n g   a c t i v i t y   % = [ A b s o r b a n c e   o f   c o n t r o l A b s o r b a n c e   o f   s a m p l e ] A b s o r b a n c e   o f   s a m p l e × 100

2.10. Experimental Design and Data Analysis

BBD was used in this study to measure the effects of four independent factors that are particle size (X1), temperature (X2), time (X3), and ultrasound amplitude (X4) on the total of HCA derivatives and flavonoids. As the design consists of four factors with three levels −1 (low), 0 (medium), and 1 (high), including three repetitions at their center points, the experimental design thus consisted of 27 experimental runs (Table 1).
Minitab software (Minitab Ltd., Brandon Curt, UK) was utilized for data analysis once the BBD experimental run was finished. Analysis of variance (ANOVA) was defined as the statistical significance of the studied factor and the evaluation of the fitting quality of the polynomial model. A second-order polynomial equation including all possible main, interaction, and quadratic effects was applied as follows:
Y = β 0 + β 1 X 1 + β 2 X 2 + β 3 X 3 + β 4 X 4 + β 12 X 1 X 2 + β 13 X 1 X 3   + β 14 X 1 X 4 + β 23 X 2 X 3 + β 24 X 2 X 4 + β 34 X 3 X 4 + β 11 X 1 2 + β 22 X 2 2 + β 33 X 3 2 + β 44 X 4 2
From the equation, Y was the dependent variable, while X1, X2, X3, and X4 were the studied factors. β0 corresponded to the ordinate coefficients; βi represented the linear coefficients; βij was the cross-product coefficients between two factors; and βii indicated the quadratic coefficients. Multi-response optimization–response surface methodology (MRO-RSM) was used simultaneously to optimize the response of cinnamic acid and flavonoid after the response surface equations from the response over the BBD domain were established.
Roselle extracts from optimized conditions are tested with an antioxidant activity assay. Antioxidant activity assay (DPPH, ABTS, and FRAP) and phenolic stability are tested triplicate and present as IC50. Analysis of variance (ANOVA) was used as a statistical analysis method with a completely randomized design by Minitab software. If ANOVA suggests a significant difference, Tukey’s HSD Test at a 5% level was used to check the differences among the means.

3. Results and Discussion

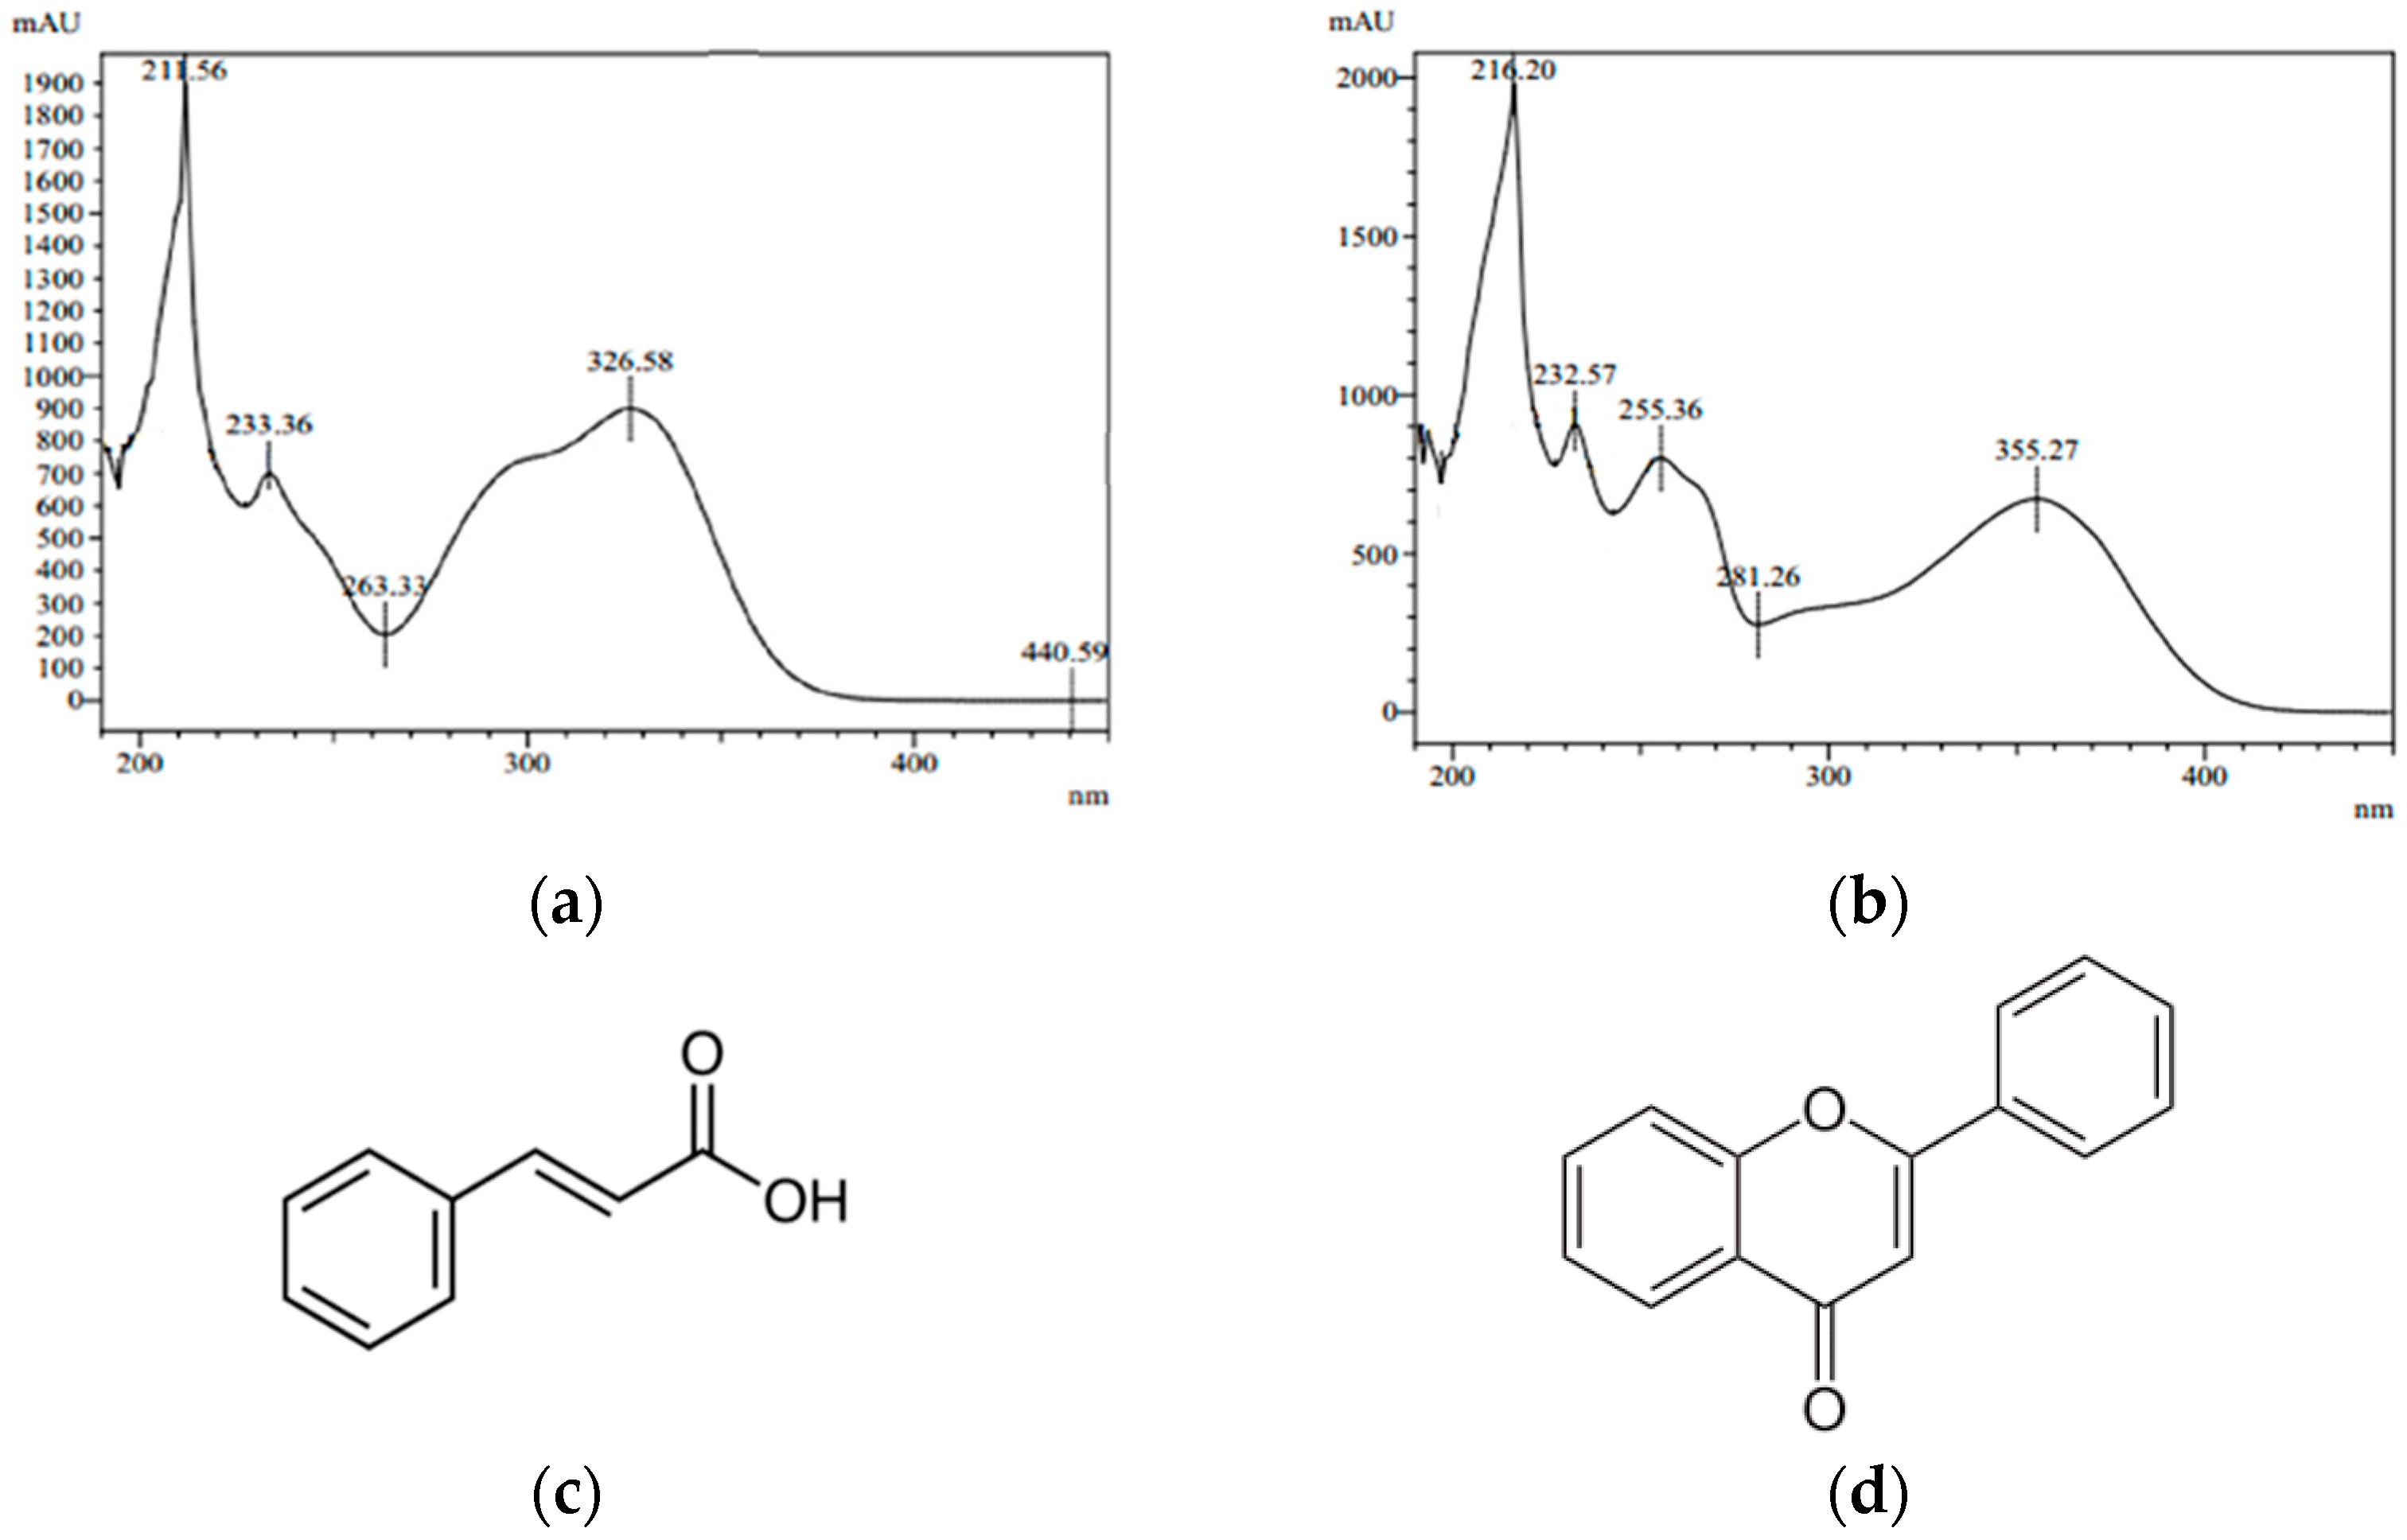
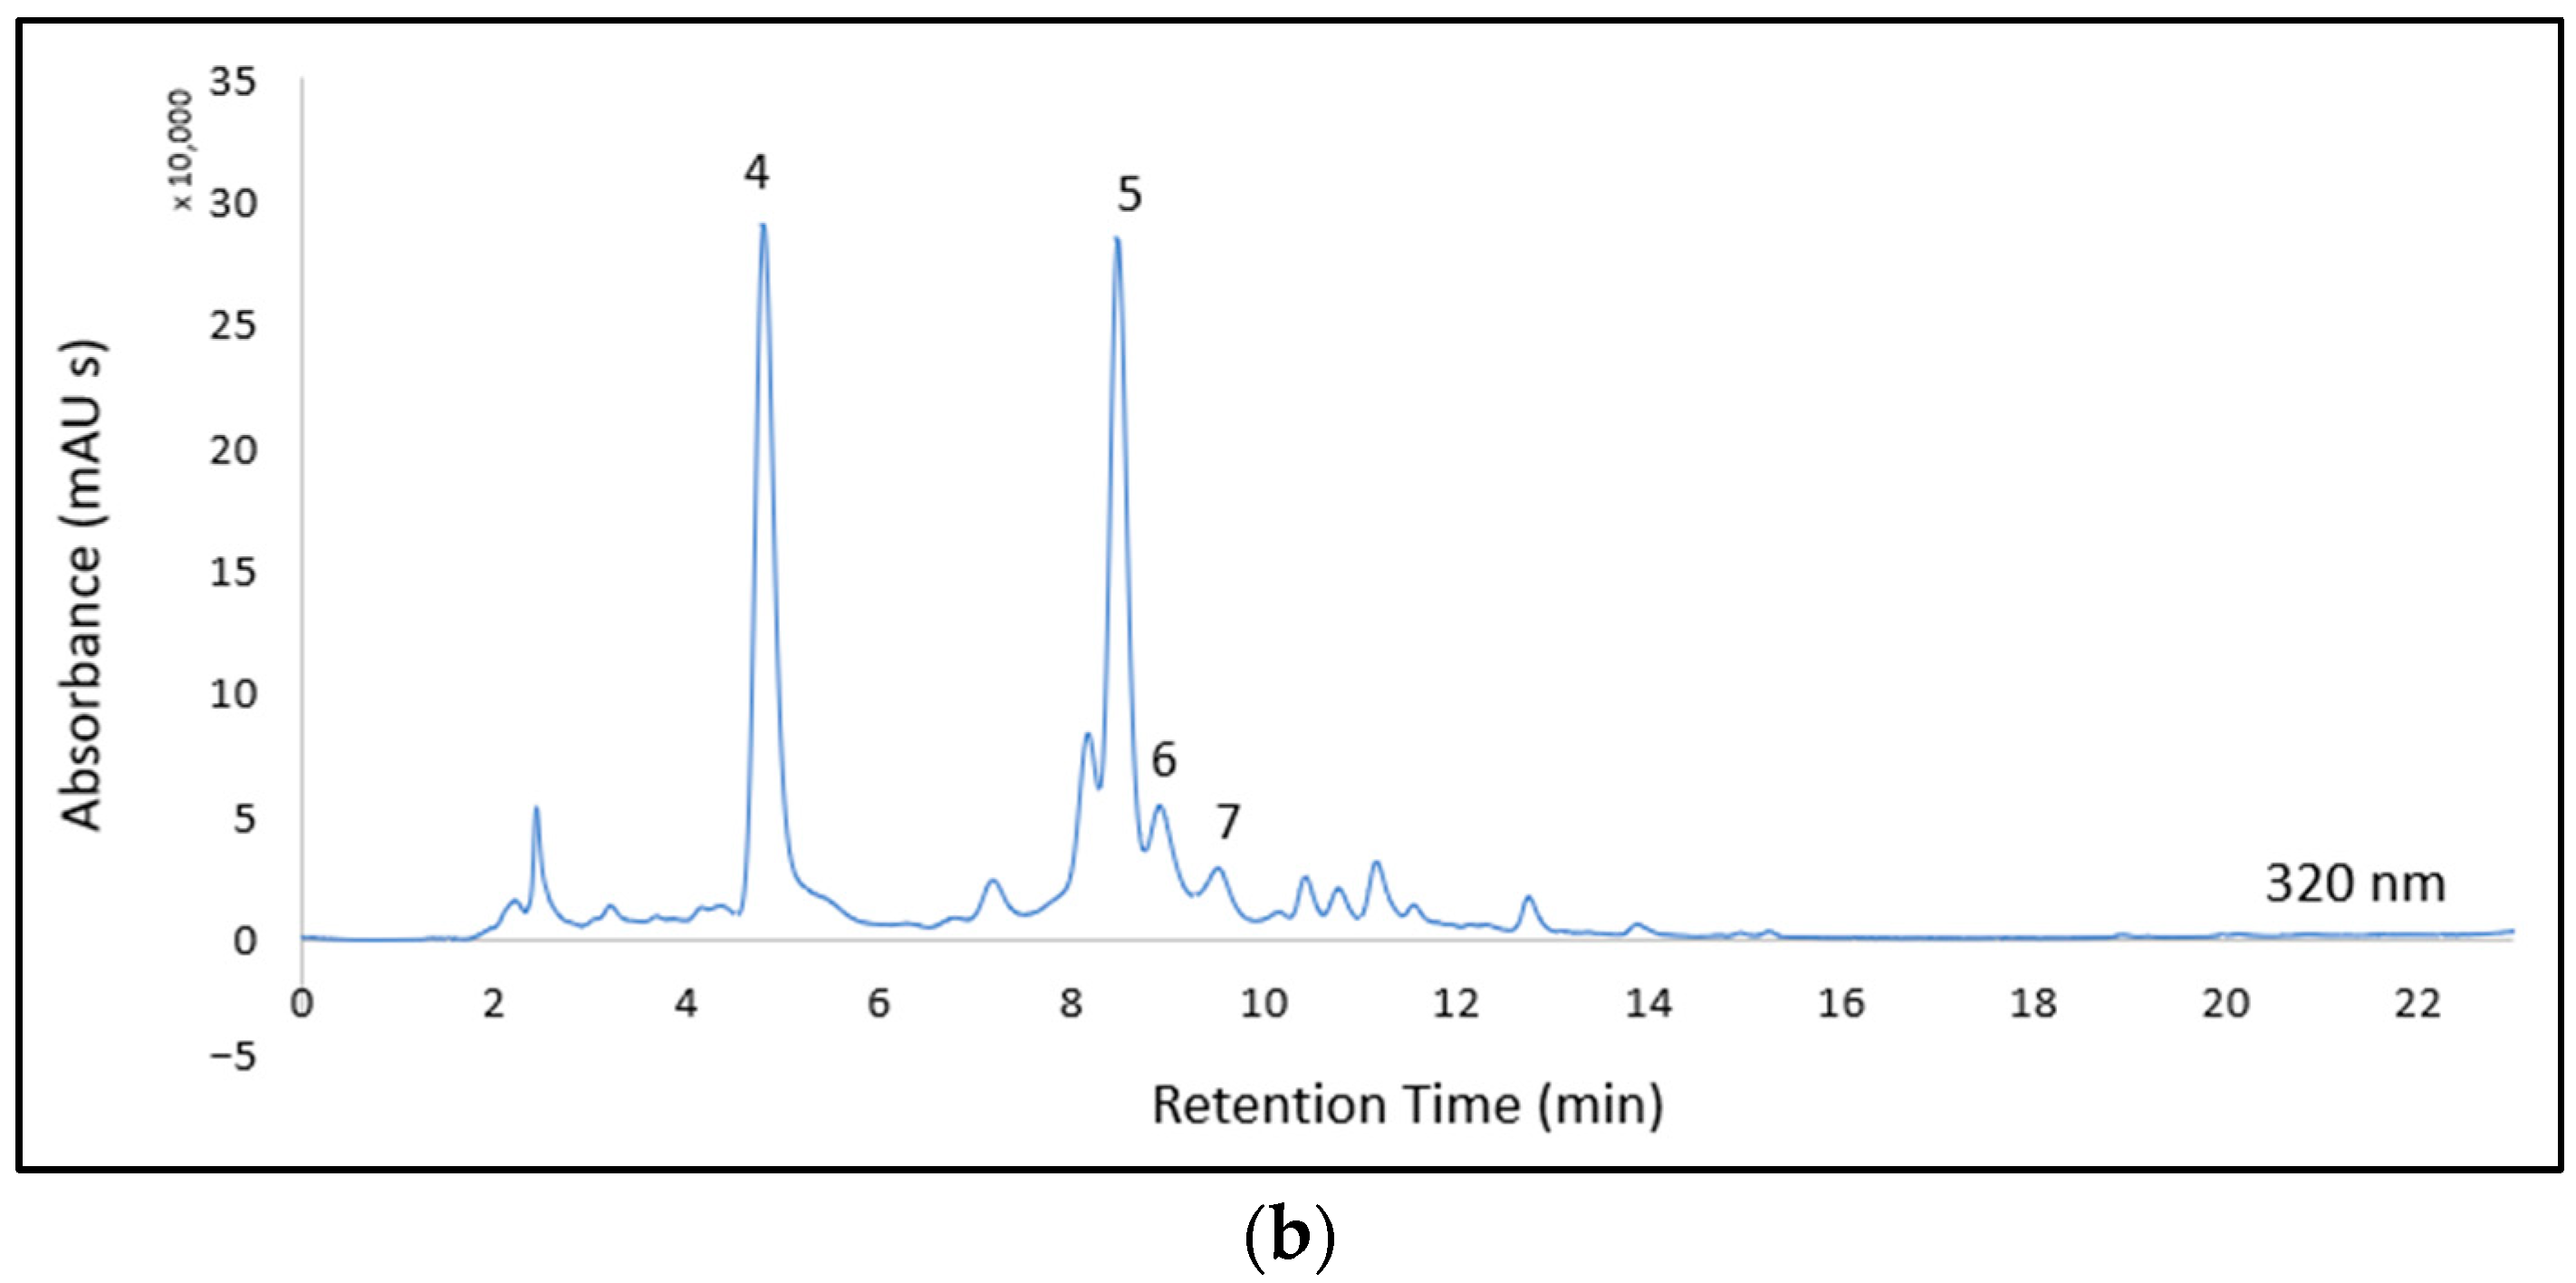
3.1. HPLC Performance for Analysis of Phenolic Compound

The chromatographic system was validated in accordance with ICH guideline Q2 (R1) [18]. The performance of HPLC-DAD in detecting and quantifying phenolic compounds from roselle tisane using the UAE cold-brew method was assessed using standard curves. Low range (0.01–10 µg mL−1) and high range (20–100 µg mL−1) of chlorogenic acid and rutin standard calibration curves were prepared to cover the concentration range from the sample. Table 2 shows the performance of the HPLC-DAD method for the determination of both chlorogenic acid and rutin.
In order to quantify individual phenolic compounds in the sample, regression analysis was utilized to find the determination coefficient (R2) to evidence the linearity within the studied range. The result indicates high R2 values for chlorogenic acid (0.99) and rutin (0.99). The limit of detection (LOD) and quantification (LOQ) were estimated using the slope and the standard deviation at the origin from the regression analysis of the calibration curve. Hence, the chromatographic method used in this study was reliable for determining the studied compounds in roselle tisane samples.

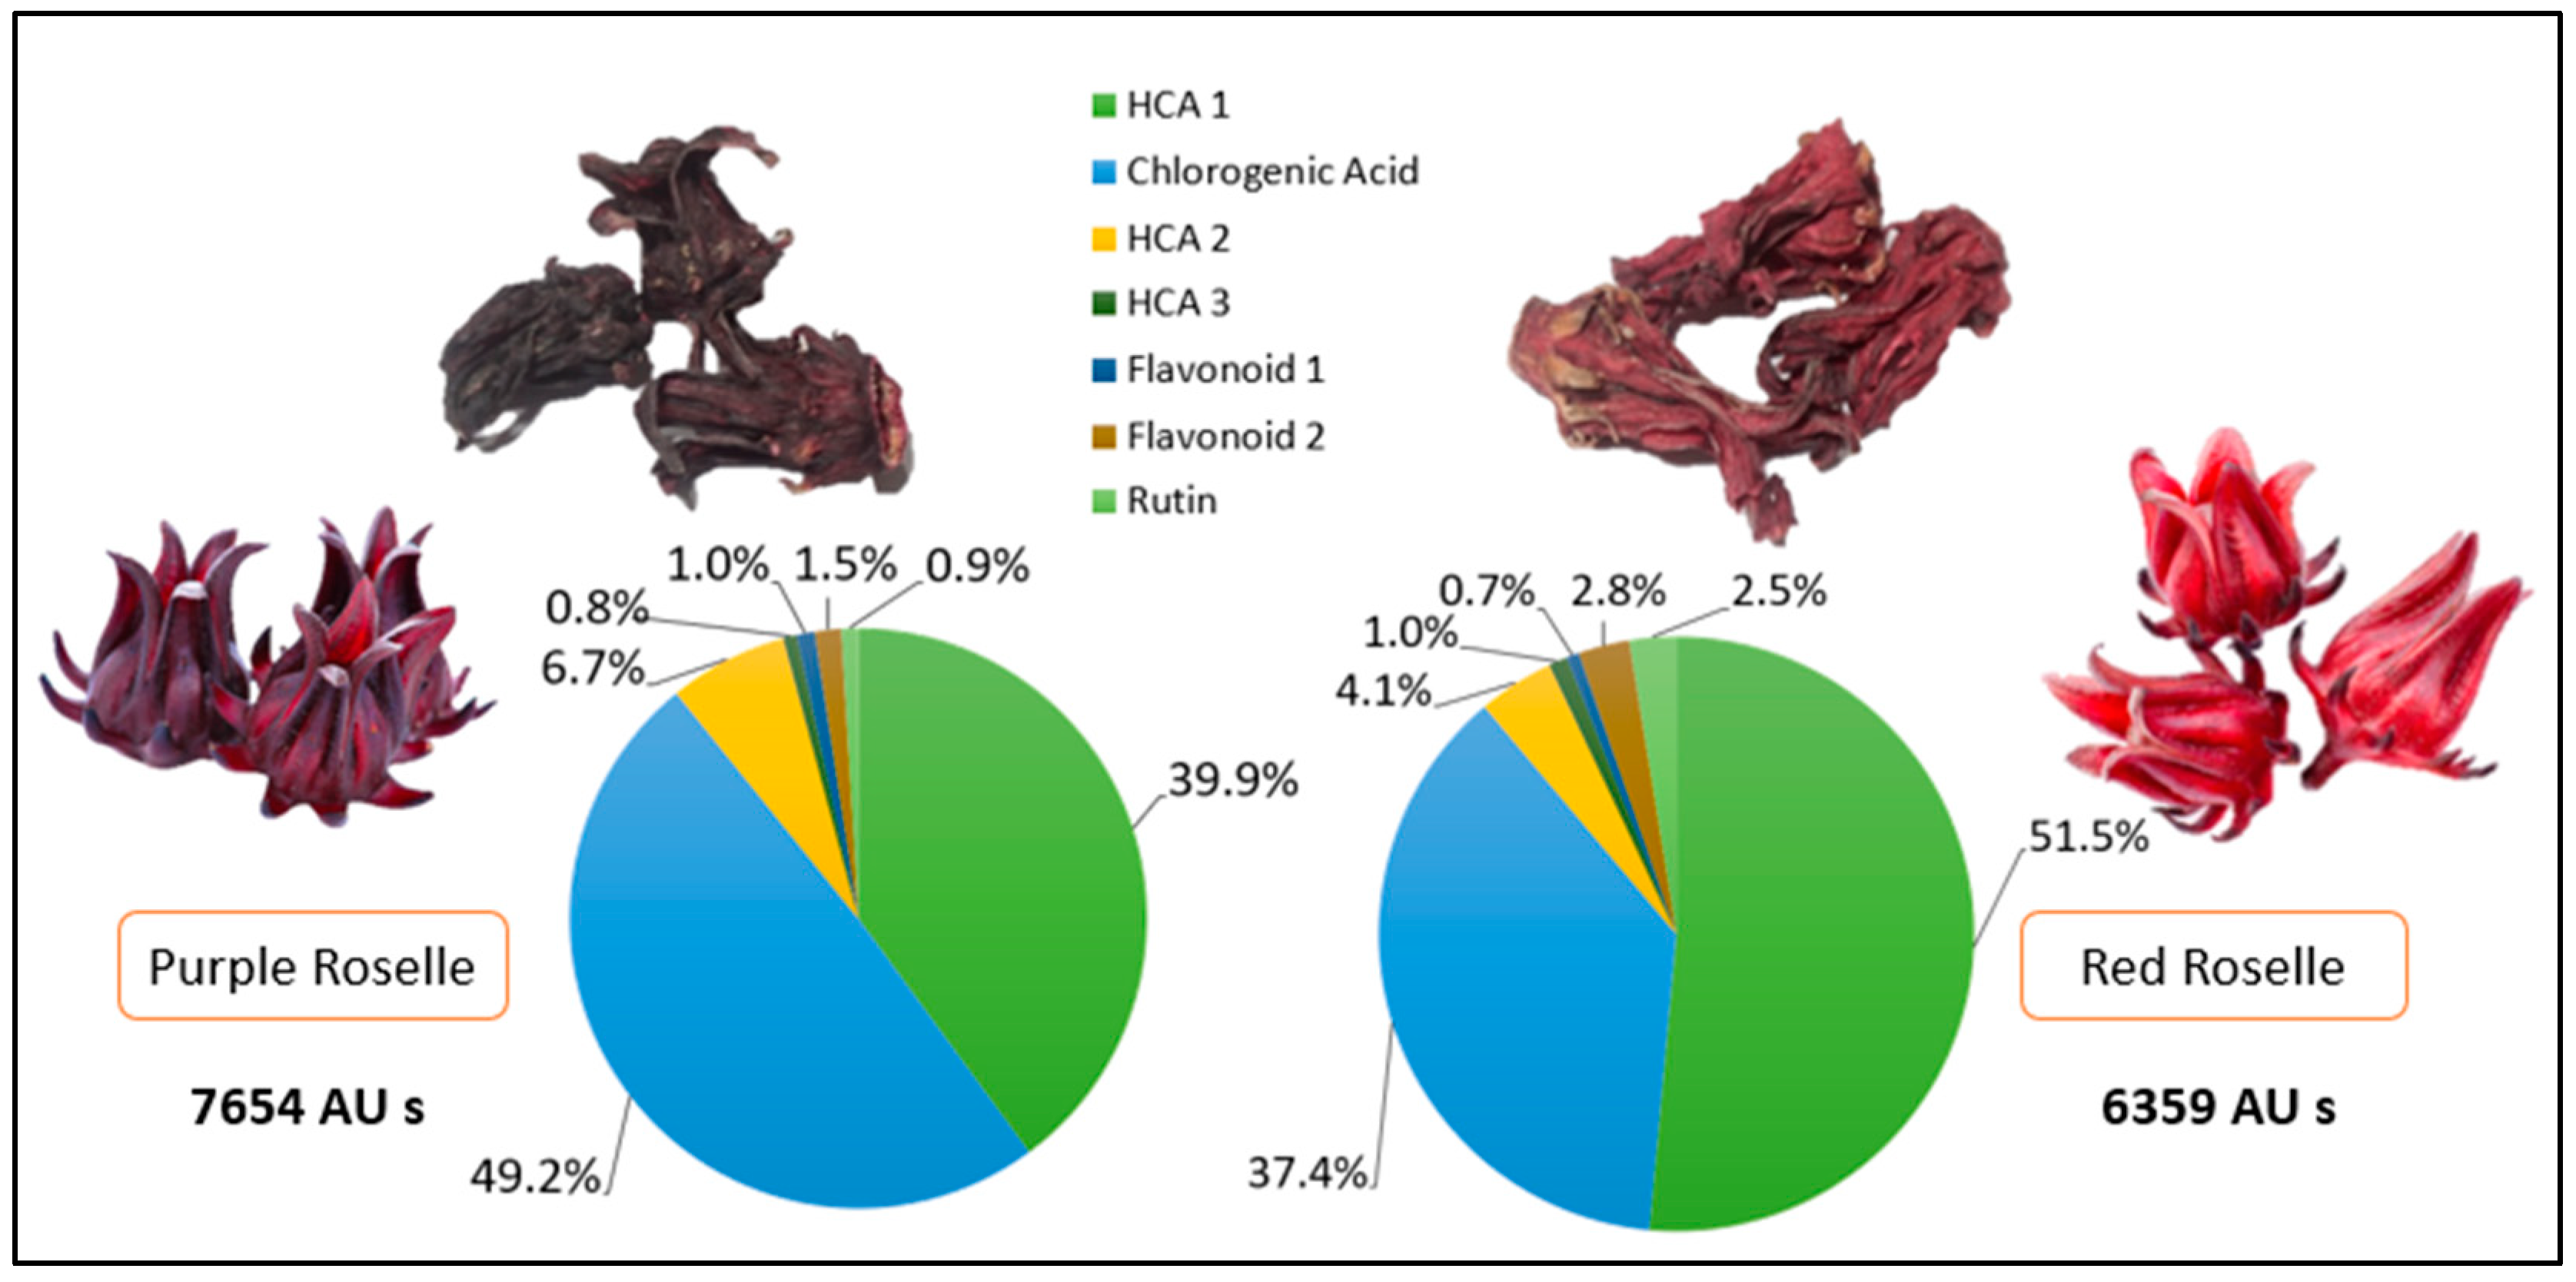
3.2. Phenolic Profile of Roselle Tisane

The individual phenolic compounds in roselle tisane were identified using HPLC-DAD by comparing the UV-Vis spectra and retention time of each compound with the standard. Seven compounds were detected as major compounds in roselle tisane and divided into two groups: HCA and flavonoid derivatives. Figure 1 represents the UV-Vis spectra of the HCA derivatives (Figure 1a) and the flavonoids (Figure 1b). These phenolic compounds were classified based on their molecular structure (Figure 1c,d), which has a substantial influence on their activity and also has similar UV-Vis spectra within the group [19,20].
Figure 2a shows the chromatogram of roselle tisane at 355 nm for flavonoids derivatives identification, and peak 3 was identified as rutin. In contrast, Figure 2b shows the chromatogram of roselle tisane at 320 nm for HCA derivatives identification, and peak 2 was identified as chlorogenic acid. Those identified compounds were confirmed with the analyses of available standards and then by comparing their chromatographic and spectroscopic properties. Chlorogenic acid is one of the phenolic compounds that is rarely found in most edible flowers [21]. Previous studies have also shown that roselle extract contains cinnamic acid derivatives and flavonoids, including chlorogenic acid and rutin [6,22].

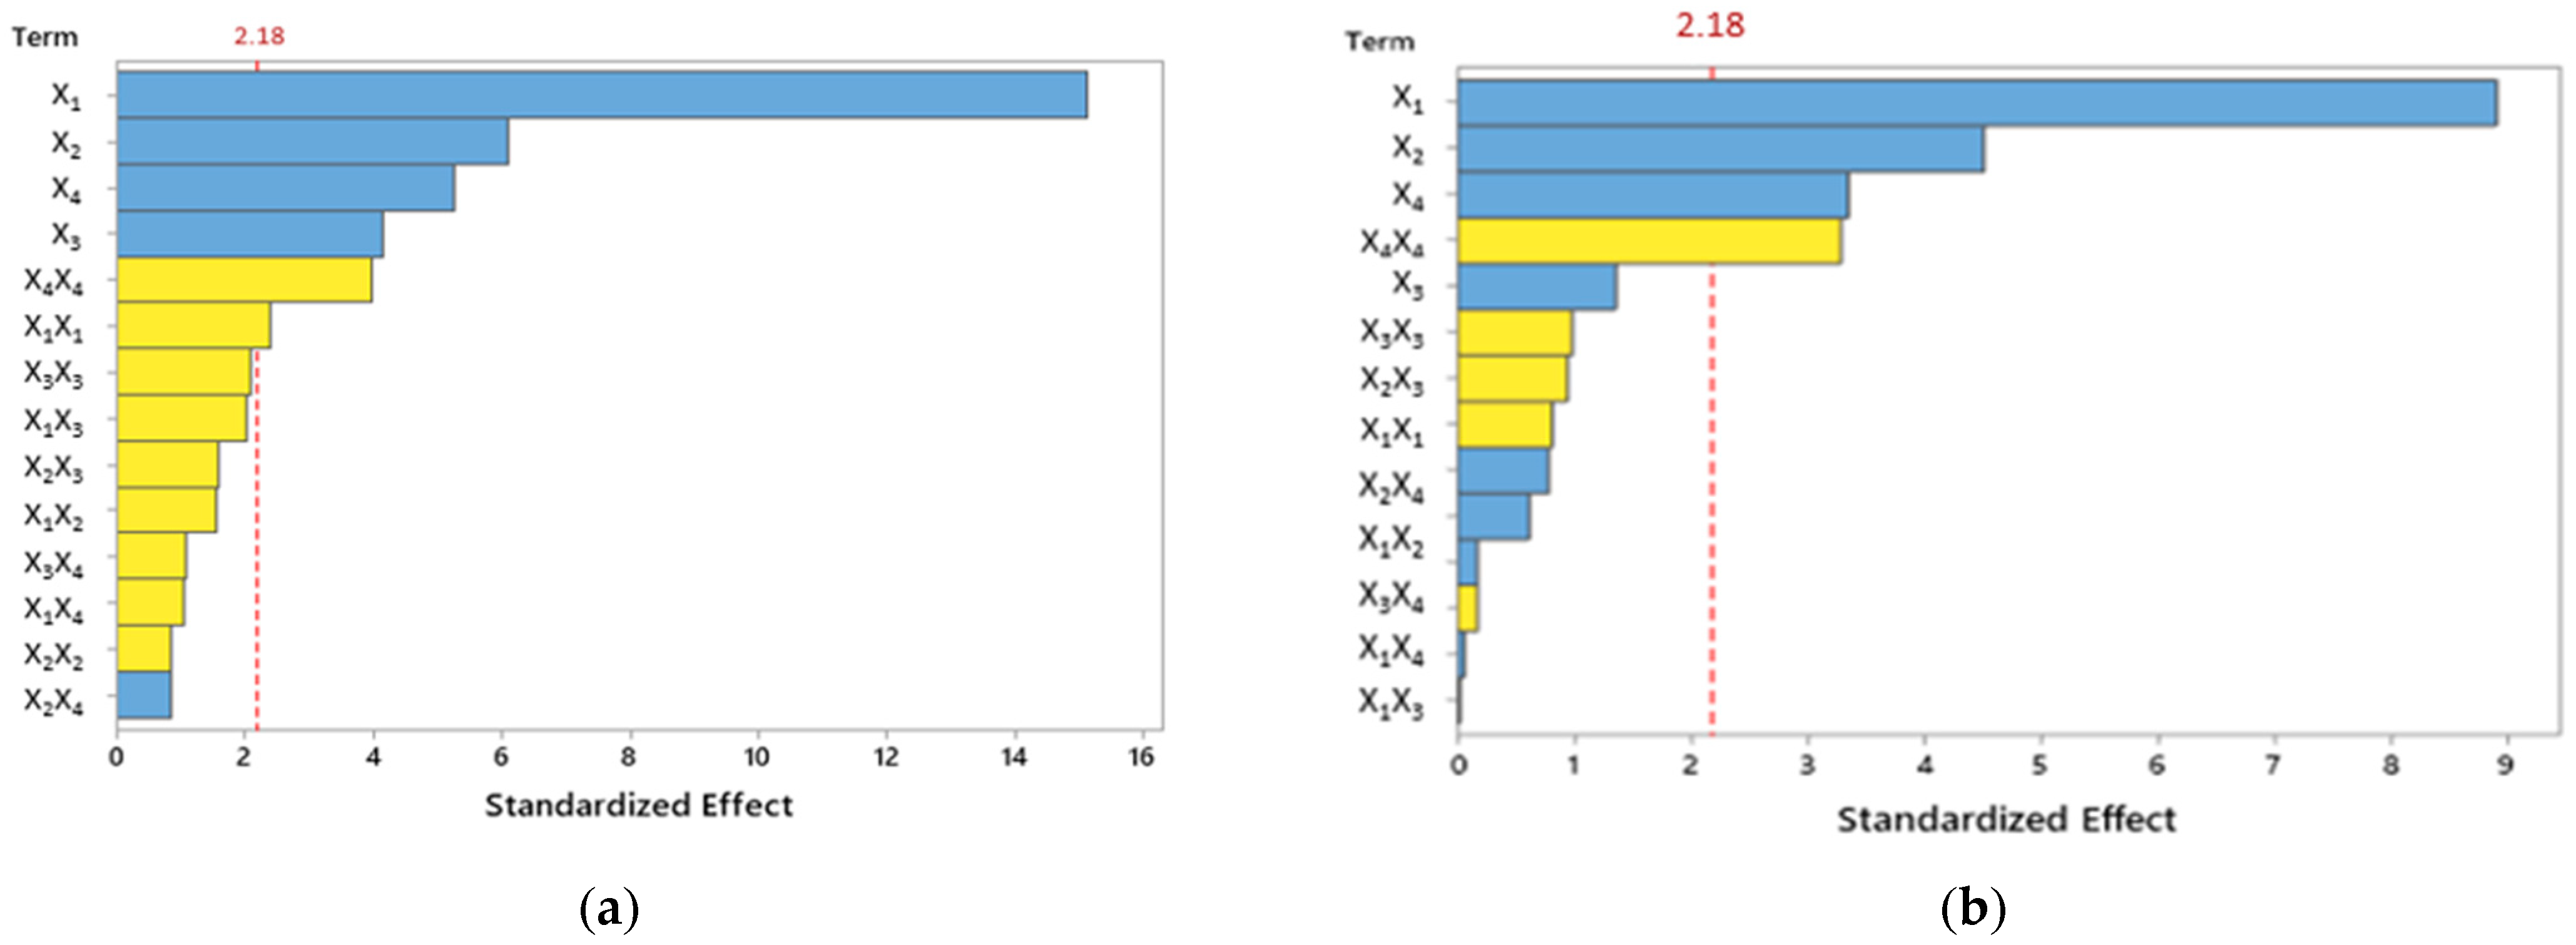
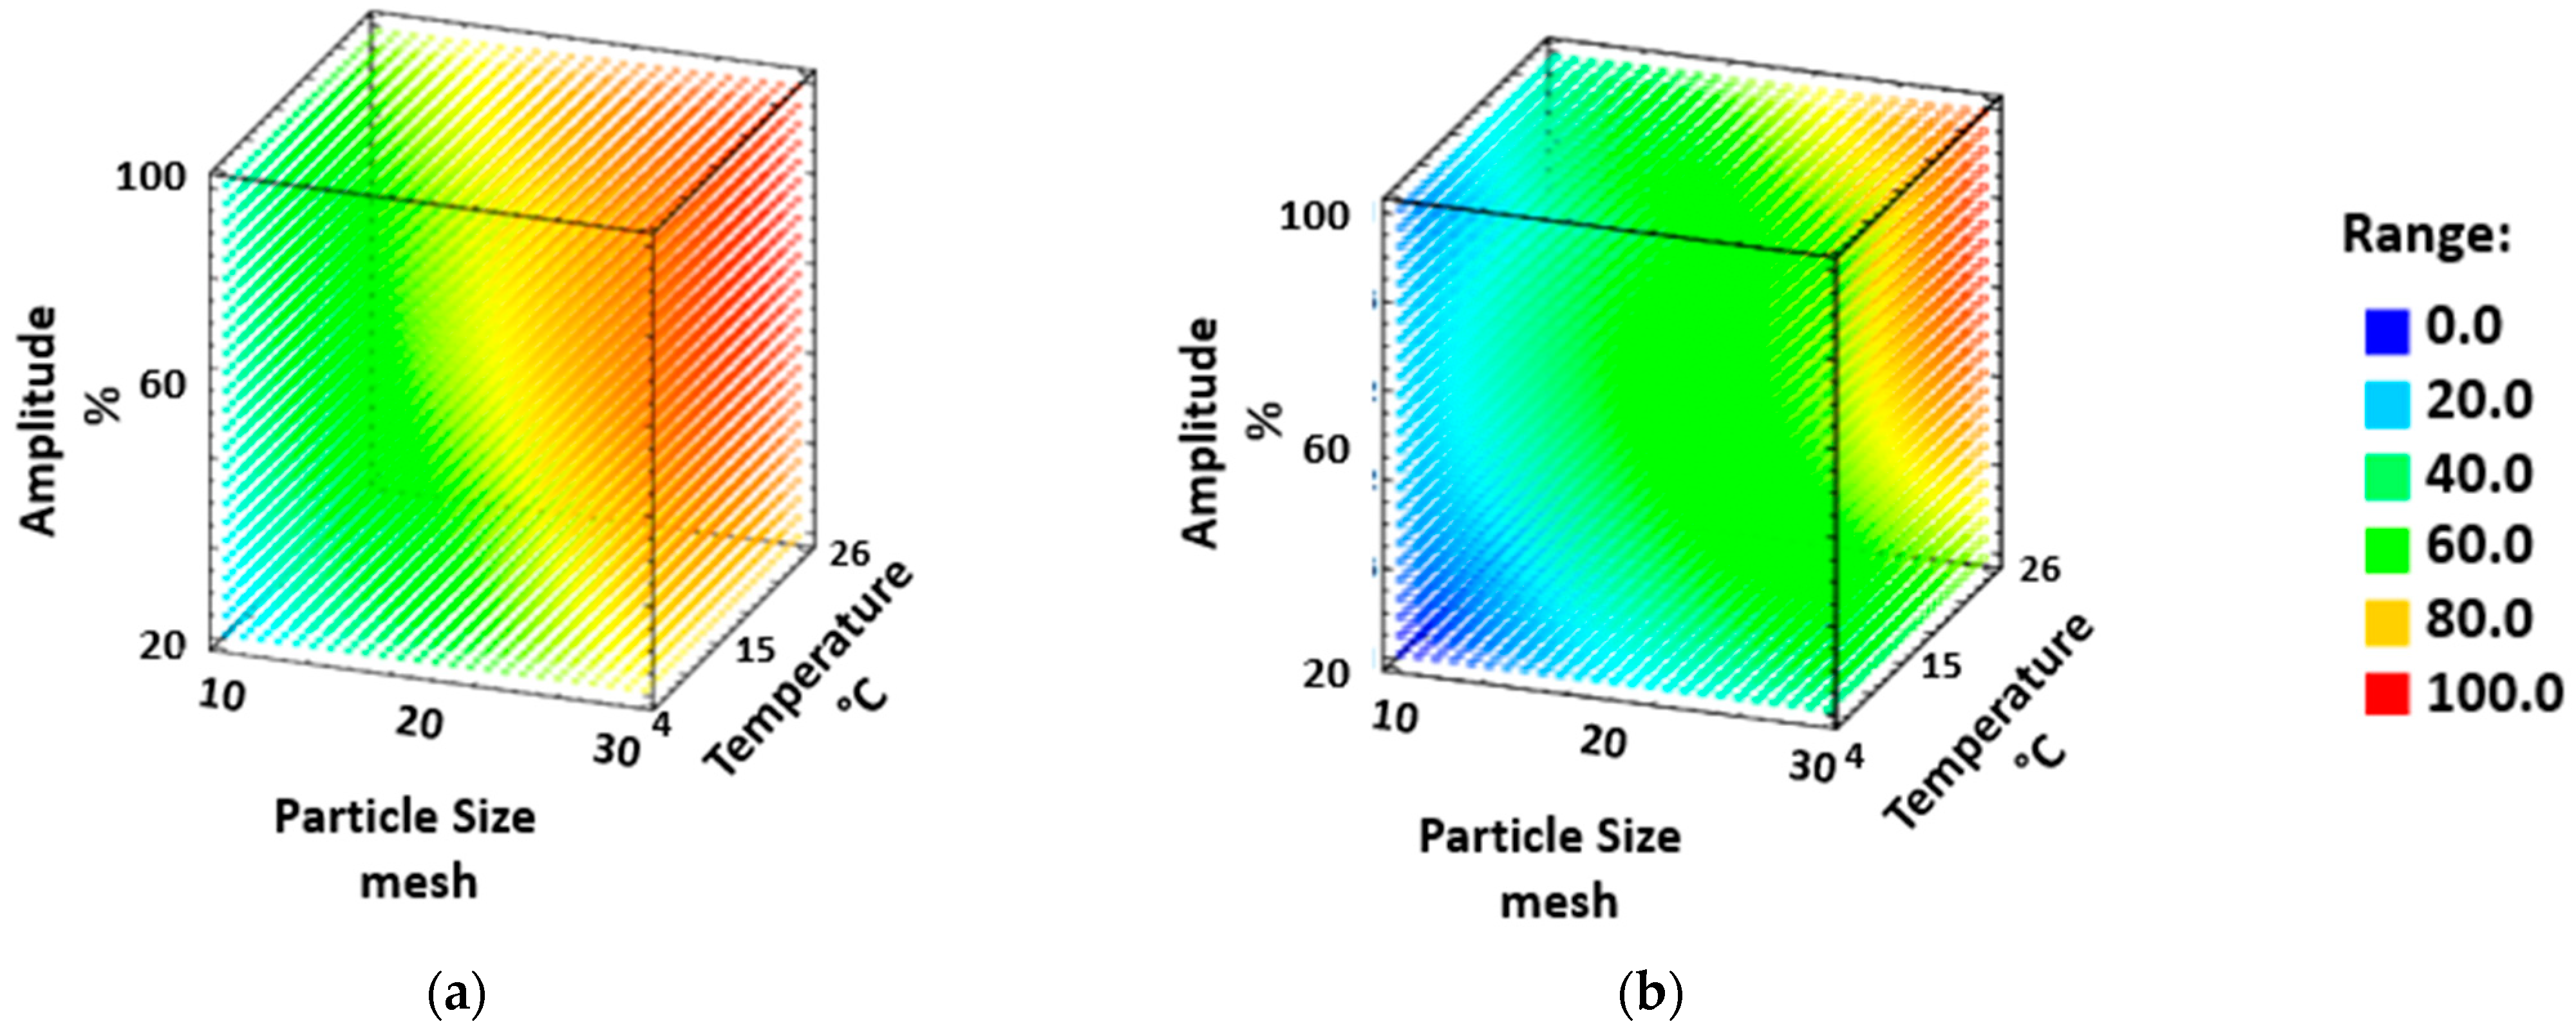
3.3. Optimization of UAE Method

The factors that were likely to affect the UAE cold-brew efficiency were optimized and studied based on BBD-RSM. The level for the extraction factors was chosen based on previous information in the literature on the brewing method and extraction of phenolic compounds from edible flowers [23,24,25]. After 27 experiments of BBD, including 3 center points, the responses were recorded as two groups of HCA derivatives and flavonoids. Analysis of Variance (ANOVA) was performed to estimate the main, interaction, and quadratic effects of the studied factors on the recovery of HCA and flavonoid derivatives. A Pareto chart (Figure 3) represents the standardized effect on BBD response graphically, while a response surface plot (Figure 4) represents the predicted response due to the combination of the level of UAE factors.
As shown in Figure 3, it can be observed that particle size (X1) was the most critical factor that significantly had a positive effect on the amount of HCA and flavonoid derivatives in roselle tisane. Particle size will influence the effectivity of the solvent to diffuse in the roselle matrix. It must be noted that the lower the particle size is, the larger the surface between the liquid and the solid material is. Therefore, higher extraction should be expected at lower particle sizes. However, the opposite effect has been found. It is because the small particles were not fully immersed in the liquid but in the surface, while the big particles were fully immersed. Therefore, a larger contact surface was found for big particle sizes. The response surface plot (Figure 4) shows that the optimum point of particle size is near high point (30 mesh), implying that the larger the particle size, the higher the extraction efficiency.
The second factor that affected the amount of HCA and flavonoid derivatives was the temperature (X2). Temperature changes influence the solubility and mass transfer rate. The analytes’ solubility and mass transfer rate will increase as the temperature rises [26,27]. However, some phenolic compounds, including flavonoids, are unstable above 70 °C. In this cold-brew method, the low temperature was used to ensure stability and avoid phenolic compound breakdown caused by high temperature [28,29]. The response surface plot (Figure 4) shows that the optimum point of extraction temperature was located near the high point (26 °C). This result indicates that higher temperature increases the yield of HCA and flavonoid derivatives.
Amplitude (X4) was another factor significantly affecting the extraction of HCA and flavonoid derivatives in roselle. The change of amplitude (X4) affected the rate of cavitation bubbles formation in the medium as well as the interaction between the medium and the roselle matrix. The Pareto chart suggests that the higher the amplitude is, the larger the recovery is. The response surface plot (Figure 4) shows that the optimum point of amplitude is between medium (60%) and high (100%) points. It is supposed that the higher the amplitude is, the more intense the cavitation bubble production is, which increases matrix cell wall rupture due to local shear stress and consequently increases the target compounds released into the solvent. Even so, utilizing a high amplitude, some phenolic compounds could be degraded because high energy promotes oxidation reactions [12]. The extraction process using a higher amplitude than the optimum point will decrease the yield of the analytes. It must be noted that the quadratic effect of the amplitude (X4X4) has a negative impact on extraction yield.
Extraction time (X3) only significantly affects the yield of HCA derivatives, in this case, with a positive relationship (Figure 3). The more extended the extraction time is, the larger the extraction yield is due to more chances for the solvent to interact with the roselle matrix and extract the analyte. On the other hand, extraction time did not significantly affect the yield for flavonoids. Therefore, the extraction of flavonoids is fast enough to avoid additional extraction due to additional extraction time [30]. The response surface plot (Figure 4b) shows that the extraction time for flavonoid derivatives was near 0.
The second-order polynomial equation was established using the results for HCA and flavonoids. This mathematical model can predict the concentration of both HCA and flavonoid derivatives under different experimental conditions.
H C A = 76.313 + 22.238 X 1 + 8.946 X 2 + 6.087 X 3 + 7.706 X 4 3.895 X 1 X 2 5.127 X 1 X 3 2.657 X 1 X 4 4.025 X 2 X 3 + 2.105 X 2 X 4 2.740 X 3 X 4 5.255 X 1 2 1.837 X 2 2 4.574 X 3 2 8.699 X 4 2
F l a v o n o i d s = 56.037 + 25.576 X 1 + 12.957 X 2 + 3.902 X 3 + 9.620 X 4 + 3.082 X 1 X 2 + 0.112 X 1 X 3 + 0.327 X 1 X 4 4.710 X 2 X 3 + 3.917 X 2 X 4 + 0.885 X 3 X 4 3.515 X 1 2 0.749 X 2 2 4.235 X 3 2 14.157 X 4 2
Table 1 summarizes the experimental run corresponding to the measured and predicted response value. The average difference between the measured and predicted response of HCA and flavonoid derivatives was 4.87 and 21.20%, while the R2 of the prediction models for HCA was 0.9659 and for flavonoids was 0.9134, respectively. The high error of flavonoid response is directly related to the errors found for the experiments showing very low recoveries. It must be noted that the experiments with recoveries higher than 60% show errors below 10%—in most cases, below 5%. Therefore, the model has reliable prediction results for the experiments showing high recoveries, which means the optimum extraction conditions. The variability of the current model residuals to the variability between observations at replicate settings for the factors was calculated for the test. The p-values for lack-of-fit in the ANOVA table of HCA derivatives (0.334) and flavonoids (0.448) were more significant than 0.05. Therefore, the models were suitable for the intended purpose at a confidence level of 95%.
The developed models proposed the optimum conditions of the studied factors for cinnamic acid and flavonoid responses over the BBD result. Subsequently, the MRO was applied to acquire the most compromised UAE cold-brew condition in order to obtain satisfactory recoveries for each group of phenolic compounds. The suggested extraction conditions were 30 mesh particle size (X1), temperature 26 °C (X2), time 18 min (X3), and 78% amplitude of UAE (X4).

3.4. Extraction Process Evaluation

The developed BBD-RSM model has suggested the optimal conditions of the studied factors, and Minitab was used for further analysis. Hence, the precision was evaluated to ensure that the newly developed method consistently extracted phenolic compounds in the roselle matrix. The consistency of the extraction will maintain the quality of the product.
To determine the level of precision, nine repeated extractions were performed on the same day (repeatability) and four repeated extractions on three different days (intermediate precision). Table 3 presents the %CV of the two levels of precision with values less than 10% for both repeatability and intermediate precision. Hence, the developed method is considered a precise extraction method for beverage production, providing a certain level of phenolic compounds.
The multi-cycle extraction of phenolic compounds from roselle tisane at predetermined optimum extraction conditions was used to assess the recovery of the newly developed method extraction process. The extraction was repeated for up to seven cycles and then using the total sum area as the total level of the compound in the sample. The first extraction cycle recovered 91.25% for HCA derivatives and 98.74% for flavonoid derivatives. This result confirmed that the flavonoid derivatives are more easily extracted than the HCA derivatives. Hence, working at the best extraction conditions, less than 10% of total HCA and flavonoid derivatives remained in the roselle solid material. Furthermore, to obtain the consistency of the optimum value of each compound, the extraction condition should maintain at a certain interval condition. These interval conditions were predicted by the measurement of robustness using model error and intermediate precision. Then, the optimum condition of the UAE cold-brew method were as follows: particle size 30 ± 3.25 mesh, temperature 26 ± 1.32 °C, time 18 ± 2.00 min, and ultrasound amplitude 78 ± 5.64%.

3.5. Roselle Tisane Production

Two varieties of roselle are commonly found in Indonesia, namely red roselle and purple roselle. The variety differences can affect the amount and the composition of phenolic compounds. In order to assess the highest antioxidant activities in roselle tisane products, the developed method was applied to extract the red roselle and purple roselle to evaluate the amount and composition of phenolic compounds in the tisane. The contents of identified phenolic compounds (mg L−1), namely chlorogenic acid and rutin, are shown in Table 4, while the HCA and flavonoids derivatives are presented with relative values to the total peak area (%) in Figure 5.
This study shows that purple roselle (69.22 ± 1.67 mg L−1) has higher chlorogenic acid than red roselle (43.48 ± 0.39 mg L−1), while red roselle (4.58 ± 0.20 mg L−1) has higher rutin than purple roselle (2.13 ± 0.06). This result is in accordance with a previous study [22], which reported that chlorogenic acid is the predominant compound identified in roselle, where purple roselle has a higher amount of chlorogenic acid, while red roselle has higher rutin than purple roselle. But overall, purple roselle exhibits higher total phenolic compounds than red roselle. This result is also in accordance with a previous study that demonstrated that the darker the color of roselle calyx was, the higher the level of total phenolic compounds was [31].
The level of HCA and flavonoid derivatives from each roselle flower sample is shown in Figure 5. In general, roselle tisane with the cold-brew method was 90% dominated by HCA and only had small amounts of flavonoid compounds. Chlorogenic acid is the dominant compound in purple roselle tisane, while in red roselle, HCA 1 is more dominant than chlorogenic acid. Chlorogenic acid is an important compound that should be identified since chlorogenic acid contributes to sensory characteristics such as acidity, bitterness, and astringency in beverage products [32].
Several studies showed that roselle extract contains hydroxybenzoic acid (HBA) derivatives such as protocatechuic acid and gallic acid [33,34,35]. However, this study did not show the same result. This might be influenced by the solvent and extraction condition that was used for the optimization. Additionally, protocatechuic acid and gallic acid have poor solubility in room temperature water [36].

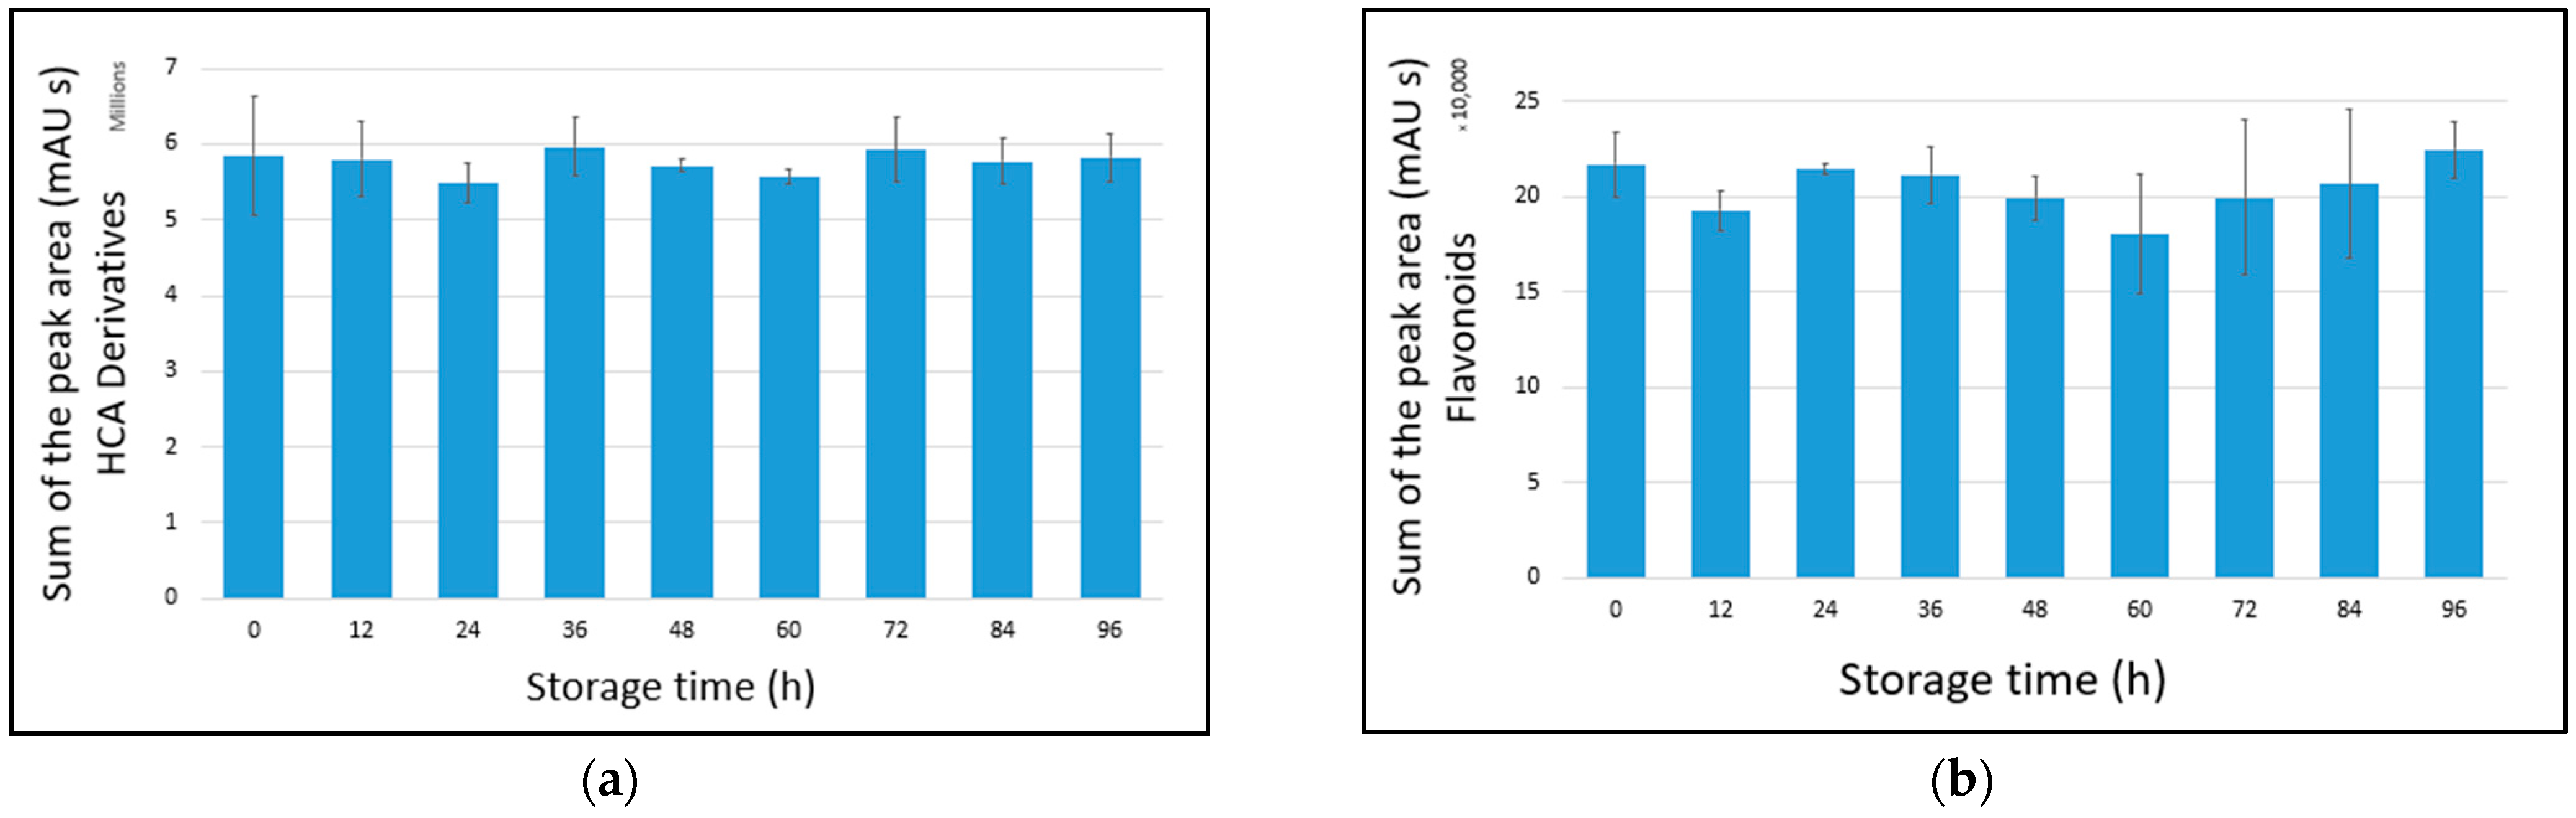
3.6. Phenolic Stability

The stability of ultrasound-assisted cold brew in roselle tisane was done by measuring the total sum of the peak area from HCA and flavonoid compounds by HPLC analysis and antioxidant activity by DPPH assay in the optimized condition (Figure 6). The five-day observation was chosen due to the lack of heat treatment, which could contain mesophilic flora and degrade the freshness of cold brew products [37].
Phenolic compounds play an antioxidant role in roselle tisane, naturally known as a thermolabile compound. A previous study shows that antioxidant activities decrease 23–66% during 72 h storage time at room temperature [38]. However, low storage temperature can inhibit the phenolic compounds degradation [39]. From Figure 6, generally, the phenolic compound from 0 till 96 h is relatively stable without any significant decrease (p = 0.05). The storage of roselle tisane at 4 °C for five days successfully maintains the phenolic compounds. According to Chang [40], the phenolic compounds remained stable until 15 days of 4 °C storage. However, the matrix can modify this behavior. A previous study stated that cinnamic acid derivatives were stable and did not show significant degradation after 30 days [41]. Flavonoid also offers good stability during storage time. Rutin and quercetin are the predominant flavonoid compound found in roselle that easily degrade in high temperatures but are relatively stable at ambient and cold temperatures [42,43]. Therefore, no losses were detected for up to 5 days in the cold-brew roselle tisane.
Additionally, there were no significant differences in antioxidant activity in roselle tisane during five days of storage at 4 °C (Figure 7). The pH of roselle tisane was 2.43 for red roselle extract and 2.55 for purple roselle extract. The low pH also contributed to the stability of phenolic compounds [42,44].

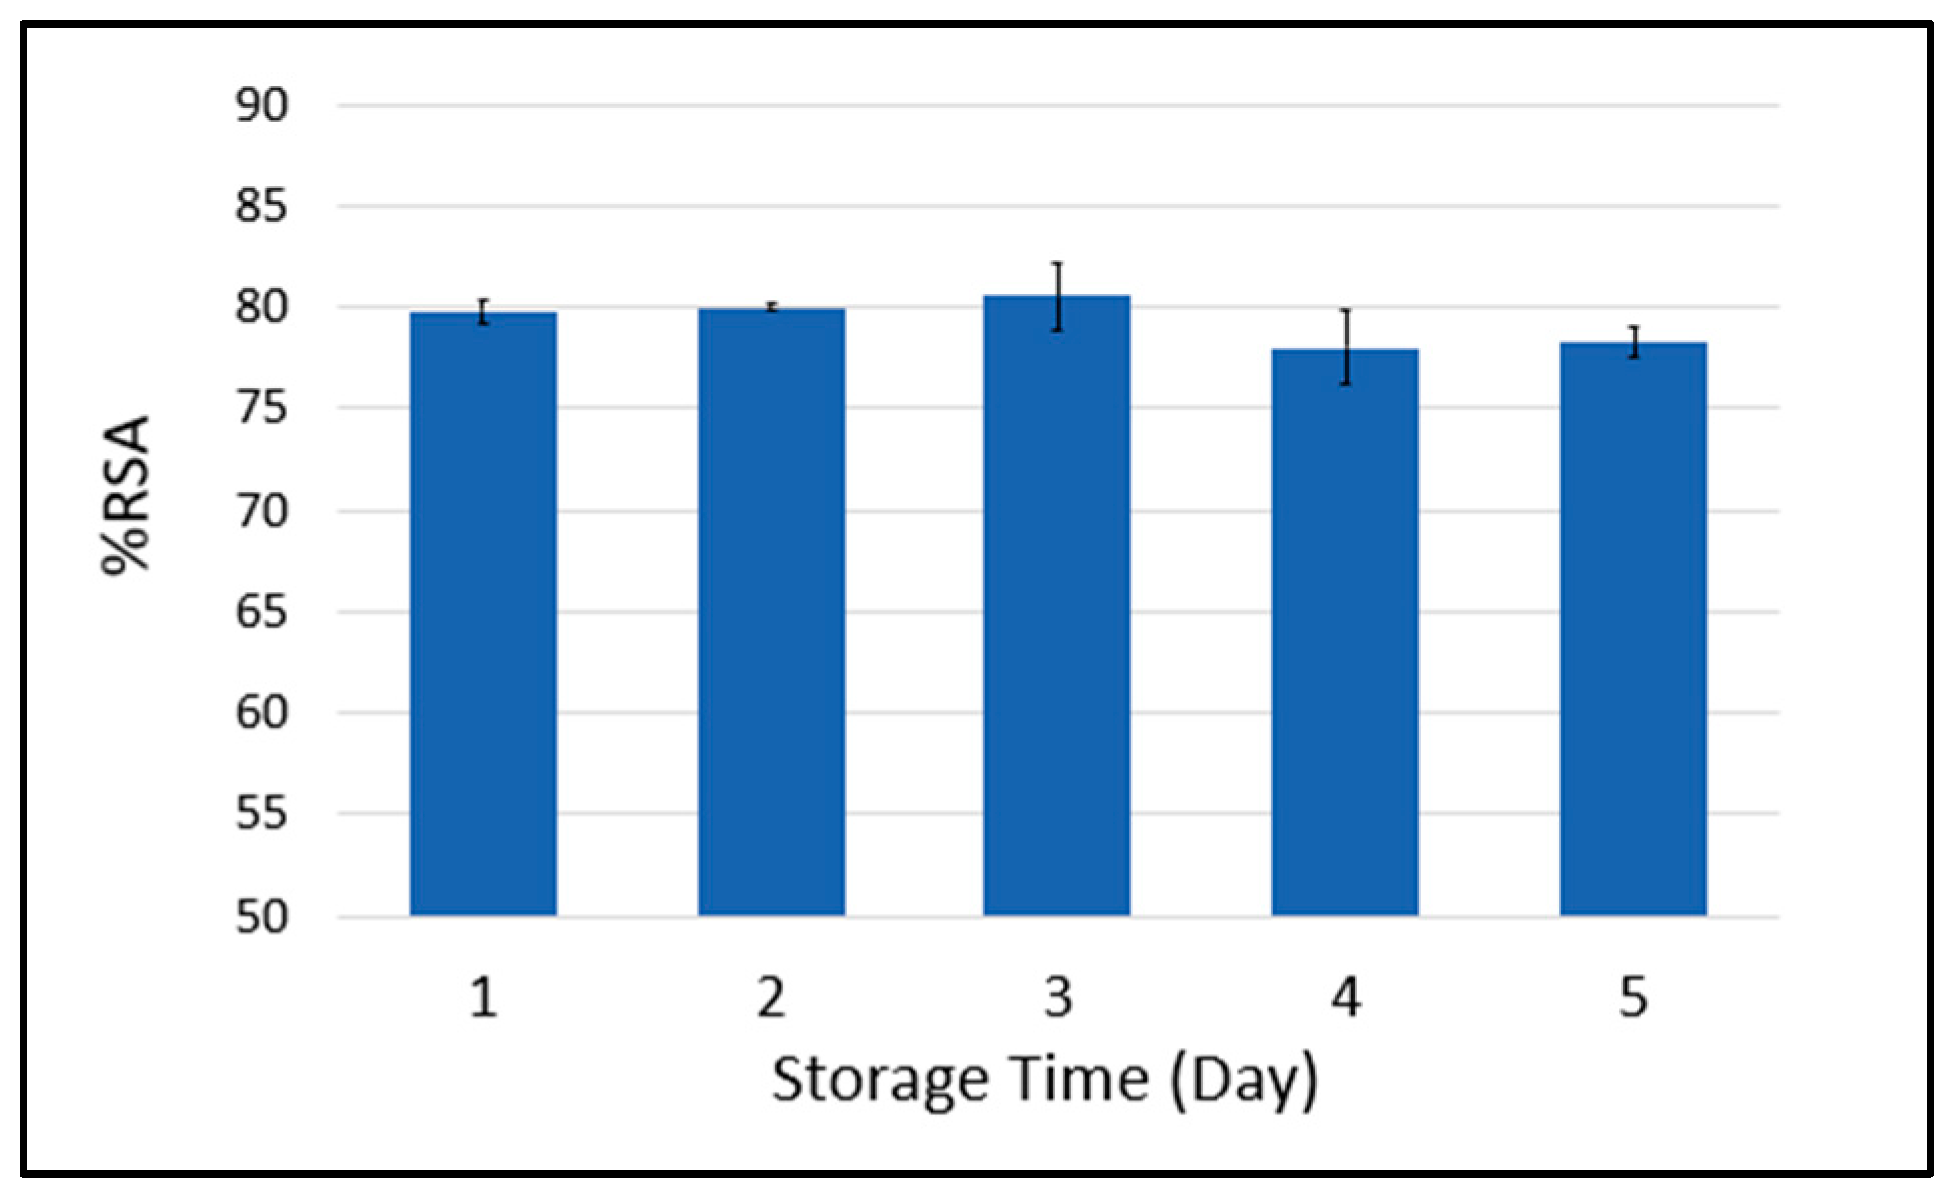
3.7. Antioxidant Activity Characteristic

The antioxidant activity of roselle tisane was determined using the DPPH, ABTS, and FRAP assay and presented as an IC50 value on days one and five. The IC50 value is the total amount of antioxidant content in a sample that may inhibit the radical compounds of selected assays by 50%. Thus, the lower the IC value is, the greater the antioxidant activity is [45]. Three different antioxidant assays were performed, and the correlation between the antioxidant activity assay and the total phenolic compound was discovered. Phenolic compounds present in roselle tisane contribute to antioxidant activity.
Table 5 shows the antioxidant activity of roselle tisane on day one and day five. Roselle tisane with UAE cold-brew method has DPPH, ABTS, and FRAP IC50 values with no significant difference between day one and day five. This result has a good correlation with Figure 6, which shows the phenolic compounds have good stability during five days of storage in cold conditions. Roselle tisane with the conventional cold-brew method has higher DPPH, ABTS, and FRAP IC50 values and significantly increases after five days of storage in the same condition as UAE cold brew method. Extracts produced by the conventional cold brew methods have lower antioxidant activity (higher IC50) than those obtained using the UAE cold brew method and become more significantly different after five days of storage. The decreasing antioxidant activity may be affected by microbial growth. However, UAE can inhibit microbial growth due to the production of cavitation bubbles that can lead to sonoporation, local shear stress, and detexturation to disrupt the microbial cell [1,13].

4. Conclusions

A fast and reliable UAE cold brew for developing roselle tisane to maintain high antioxidant activity was successfully optimized using BBD in conjunction with RSM. The optimum extraction yield can be achieved by applying the following UAE cold-brew condition: particle size 30 ± 3.25 mesh, temperature 26 ± 1.32 °C, time 18 ± 2.00 min, and ultrasound amplitude 78 ± 5.64%. The developed method successfully extracted almost all HCA and flavonoid derivatives during the first extraction cycle with less than 10% CV for both repeatability and intermediate precision, showing a good extraction process to produce consistent quality of roselle tisane. Purple roselle offers higher phenolic compounds and antioxidant activities than red roselle. With the evaluated primary phenolic compound found in roselle tisane, the method produced roselle tisane that was relatively stable during five days of storage at 4 °C. The optimized method offers an alternative to the conventional brewing method, which has a substantial impact on the production and product quality of the beverage industry, which focuses on functional and healthy beverages. Furthermore, product formulation could be developed to obtain consumer preferences.

Author Contributions

Conceptualization, W.S. and I.D.L.; methodology, W.S. and M.P.; software, I.D.L.; validation, M.P., H.N.L. and T.E.; formal analysis, W.S. and I.D.L.; investigation, I.D.L. and N.M.D.O.; resources, W.S. and M.P.; data curation, M.P.; writing—original draft preparation, I.D.L. and N.M.D.O.; writing—review and editing, W.S., M.P., H.N.L. and T.E.; visualization, I.D.L.; supervision, W.S. and M.P.; project administration, N.M.D.O.; funding acquisition, W.S., H.N.L. and T.E. All authors have read and agreed to the published version of the manuscript.

Funding

The research was funded through Riset Kolaborasi Indonesia (RKI) 2023 Program among Universitas Gadjah Mada, IPB University, Brawijaya University, and University of Cadiz with a grant number 2646/UN1/DITLIT/Dit-Lit/PT.01.03/2023.

Data Availability Statement

The data presented in this study is contained within the article.

Acknowledgments

This report forms part of the research activity carried out by I.D.L. at the Laboratory of Chemistry and Biochemistry facilitated by the Study Program of Master in Estate Crop Technology, Department of Food and Agricultural Product Technology, Universitas Gadjah Mada.

Conflicts of Interest

The authors declare no conflict of interest.

References

  1. Morales-de la Peña, M.; Welti-Chanes, J.; Martín-Belloso, O. Application of Novel Processing Methods for Greater Retention of Functional Compounds in Fruit-Based Beverages. Beverages 2016, 2, 14. [Google Scholar] [CrossRef] [Green Version]
  2. Sharifi-Rad, M.; Anil Kumar, N.V.; Zucca, P.; Varoni, E.M.; Dini, L.; Panzarini, E.; Rajkovic, J.; Tsouh Fokou, P.V.; Azzini, E.; Peluso, I.; et al. Lifestyle, Oxidative Stress, and Antioxidants: Back and Forth in the Pathophysiology of Chronic Diseases. Front. Physiol. 2020, 11, 694. [Google Scholar] [CrossRef] [PubMed]
  3. Tungmunnithum, D.; Thongboonyou, A.; Pholboon, A.; Yangsabai, A. Flavonoids and Other Phenolic Compounds from Medicinal Plants for Pharmaceutical and Medical Aspects: An Overview. Medicines 2018, 5, 93. [Google Scholar] [CrossRef] [PubMed]
  4. Reis Giada, M.d.L. Food Phenolic Compounds: Main Classes, Sources and Their Antioxidant Power. In Oxidative Stress and Chronic Degenerative Diseases—A Role for Antioxidants; InTech: London, UK, 2013. [Google Scholar]
  5. Chang, H.P.; Ma, C.C.; Chen, H.S. The Impacts of Young Consumers’ Health Values on Functional Beverages Purchase Intentions. Int. J. Environ. Res. Public Health 2020, 17, 3479. [Google Scholar] [CrossRef] [PubMed]
  6. Hapsari, B.W.; Manikharda; Setyaningsih, W. Methodologies in the Analysis of Phenolic Compounds in Roselle (Hibiscus sabdariffa L.): Composition, Biological Activity, and Beneficial Effects on Human Health. Horticulturae 2021, 7, 35. [Google Scholar] [CrossRef]
  7. Osei-Kwarteng, M.; Gweyi-Onyango, J.P.; Mahunu, G.K. Harvesting, Storage, Postharvest Management, and Marketing of Hibiscus sabdariffa. In Roselle (Hibiscus sabdariffa): Chemistry, Production, Products, and Utilization; Elsevier: London, UK, 2021; pp. 15–31. ISBN 9780128221006. [Google Scholar]
  8. Osei-Kwarteng, M.; Gweyi-Onyango, J.P.; Mahunu, G.K. Harvesting, Storage, Postharvest Management, and Marketing of Hibiscus sabdariffa. In Roselle (Hibiscus sabdariffa); Breeding, genetic diversity, and safe production of Hibiscus sabdariffa under climate change; Elsevier: London, UK, 2021; pp. 1–10. ISBN 9780128221006. [Google Scholar]
  9. Setyaningsih, W.; Saputro, I.E.; Palma, M.; Barroso, C.G. Stability of 40 Phenolic Compounds during Ultrasound-Assisted Extractions (UAE). In AIP Conference Proceedings; American Institute of Physics Inc.: College Park, MD, USA, 2016; Volume 1755. [Google Scholar]
  10. Müller, A.L.H.; De Oliveira, J.A.; Prestes, O.D.; Adaime, M.B.; Zanella, R. Design of Experiments and Method Development. In Solid-Phase Extraction; Elsevier: London, UK, 2019; pp. 589–608. ISBN 9780128169063. [Google Scholar]
  11. Damiani, E.; Bacchetti, T.; Padella, L.; Tiano, L.; Carloni, P. Antioxidant Activity of Different White Teas: Comparison of Hot and Cold Tea Infusions. J. Food Compos. Anal. 2014, 33, 59–66. [Google Scholar] [CrossRef]
  12. Willaert, R.G.; Baron, G. Wort Boiling Today-Boiling Systems with Low Thermal Stress in Combination with Volatile Stripping. Belgian J. Brewing Biotechnol. 2021, 26, 217–230. [Google Scholar]
  13. Chemat, F.; Rombaut, N.; Sicaire, A.G.; Meullemiestre, A.; Fabiano-Tixier, A.S.; Abert-Vian, M. Ultrasound Assisted Extraction of Food and Natural Products. Mechanisms, Techniques, Combinations, Protocols and Applications. A Review. Ultrason. Sonochem. 2017, 34, 540–560. [Google Scholar] [CrossRef]
  14. Cordoba, N.; Pataquiva, L.; Osorio, C.; Moreno, F.L.M.; Ruiz, R.Y. Effect of Grinding, Extraction Time and Type of Coffee on the Physicochemical and Flavour Characteristics of Cold Brew Coffee. Sci. Rep. 2019, 9, 8440. [Google Scholar] [CrossRef] [Green Version]
  15. Sompong, R.; Siebenhandl-Ehn, S.; Linsberger-Martin, G.; Berghofer, E. Physicochemical and Antioxidative Properties of Red and Black Rice Varieties from Thailand, China and Sri Lanka. Food Chem. 2011, 124, 132–140. [Google Scholar] [CrossRef]
  16. Assefa, A.D.; Saini, R.K.; Keum, Y.S. Extraction of Antioxidants and Flavonoids from Yuzu (Citrus Junos Sieb Ex Tanaka) Peels: A Response Surface Methodology Study. J. Food Meas. Charact. 2017, 11, 364–379. [Google Scholar] [CrossRef]
  17. Re, R.; Pellegrini, N.; Proteggente, A.; Pannala, A.; Yang, M.; Rice-Evans, C. Original Contribution Antioxidant Activity Applying an Improved ABTS Radical Cation. Free Radical Biology Med. 1999, 26. [Google Scholar] [CrossRef]
  18. ICH. ICH Topic Q 2 (R1) Validation of Analytical Procedures: Text and Methodology; European Medicines Agency: Amsterdam, The Nertherlands, 1995.
  19. Šamec, D.; Karalija, E.; Šola, I.; Vujčić Bok, V.; Salopek-Sondi, B. The Role of Polyphenols in Abiotic Stress Response: The Influence of Molecular Structure. Plants 2021, 10, 118. [Google Scholar] [CrossRef]
  20. Salum, M.L.; Arroyo Mañez, P.; Luque, F.J.; Erra-Balsells, R. Combined Experimental and Computational Investigation of the Absorption Spectra of E- and Z-Cinnamic Acids in Solution: The Peculiarity of Z-Cinnamics. J. Photochem. Photobiol. B 2015, 148, 128–135. [Google Scholar] [CrossRef]
  21. Chen, G.L.; Chen, S.G.; Xiao, Y.; Fu, N.L. Antioxidant Capacities and Total Phenolic Contents of 30 Flowers. Ind. Crops Prod. 2018, 111, 430–445. [Google Scholar] [CrossRef]
  22. Fathimah, R.N.; Setyaningsih, W.; Carrera, C.; Palma, M. Microwave-Assisted Extraction of Hibiscus sabdariffa Antioxidants: Method Development and Validation. Proceedings 2020, 70, 7681. [Google Scholar] [CrossRef]
  23. Jaya Prakkash, M.A.; Ragunathan, R.; Jesteena, J. Evaluation of Bioactive Compounds from Jasminum Polyanthum and Its Medicinal Properties. J. Drug Deliv. Ther. 2019, 9, 303–310. [Google Scholar] [CrossRef] [Green Version]
  24. Zannou, O.; Kelebek, H.; Selli, S. Elucidation of Key Odorants in Beninese Roselle (Hibiscus sabdariffa L.) Infusions Prepared by Hot and Cold Brewing. Food Res. Int. 2020, 133, 109133. [Google Scholar] [CrossRef]
  25. Zhao, L.; Fan, H.; Zhang, M.; Chitrakar, B.; Bhandari, B.; Wang, B. Edible Flowers: Review of Flower Processing and Extraction of Bioactive Compounds by Novel Technologies. Food Res. Int. 2019, 126, 108660. [Google Scholar] [CrossRef]
  26. Xu, D.P.; Zhou, Y.; Zheng, J.; Li, S.; Li, A.N.; Li, H. Bin Optimization of Ultrasound-Assisted Extraction of Natural Antioxidants from the Flower of Jatropha Integerrima by Response Surface Methodology. Molecules 2016, 21, 18. [Google Scholar] [CrossRef] [Green Version]
  27. Mota, F.L.; Carneiro, A.P.; Queimada, A.J.; Pinho, S.P.; Macedo, E.A. Temperature and Solvent Effects in the Solubility of Some Pharmaceutical Compounds: Measurements and Modeling Temperature and Solvent Effects in the Solubility of Some Pharmaceutical Compounds: Measure-Ments and Modeling. Eur. J. Pharm. Sci. 2009, 37, 499–507. [Google Scholar] [CrossRef] [PubMed] [Green Version]
  28. Kyroglou, S.; Laskari, R.; Vareltzis, P. Optimization of Sensory Properties of Cold Brew Coffee Produced by Reduced Pressure Cycles and Its Physicochemical Characteristics. Molecules 2022, 27, 2971. [Google Scholar] [CrossRef] [PubMed]
  29. Tarasevičienė, Ž.; Vitkauskaitė, M.; Paulauskienė, A.; Černiauskienė, J. Wild Stinging Nettle (Urtica Dioica L.) Leaves and Roots Chemical Composition and Phenols Extraction. Plants 2023, 12, 309. [Google Scholar] [CrossRef] [PubMed]
  30. Ferreira, O.; Pinho, S.P. Solubility of Flavonoids in Pure Solvents. Ind. Eng. Chem. Res. 2012, 51, 6586–6590. [Google Scholar] [CrossRef]
  31. Christian, K.R.; Jackson, J.C. Changes in Total Phenolic and Monomeric Anthocyanin Composition and Antioxidant Activity of Three Varieties of Sorrel (Hibiscus sabdariffa) during Maturity. J. Food Compos. Anal. 2009, 22, 663–667. [Google Scholar] [CrossRef]
  32. Upadhyay, R.; Mohan Rao, L.J. An Outlook on Chlorogenic Acids-Occurrence, Chemistry, Technology, and Biological Activities. Crit. Rev. Food Sci. Nutr. 2013, 53, 968–984. [Google Scholar] [CrossRef]
  33. Trinh, L.T.P.; Choi, Y.S.; Bae, H.J. Production of Phenolic Compounds and Biosugars from Flower Resources via Several Extraction Processes. Ind. Crops Prod. 2018, 125, 261–268. [Google Scholar] [CrossRef]
  34. Lourith, N.; Kanlayavattanakul, M. Antioxidant Activity and Stability of Natural Colour Recovered from Roselle Juice Production. Agro Food Industry Hi Tech 2013, 24, 40–43. [Google Scholar]
  35. Samadi, S.; Raouf Fard, F. Phytochemical Properties, Antioxidant Activity and Mineral Content (Fe, Zn and Cu) in Iranian Produced Black Tea, Green Tea and Roselle Calyces. Biocatal. Agric. Biotechnol. 2020, 23, 101472. [Google Scholar] [CrossRef]
  36. Srinivas, K.; King, J.W.; Howard, L.R.; Monrad, J.K. Solubility of Gallic Acid, Catechin, and Protocatechuic Acid in Subcritical Water from (298.75 to 415.85) K. J. Chem. Eng. Data 2010, 55, 3101–3108. [Google Scholar] [CrossRef]
  37. Kwok, R.; Lee Wee Ting, K.; Schwarz, S.; Claassen, L.; Lachenmeier, D.W. Current Challenges of Cold Brew Coffee—Roasting, Extraction, Flavor Profile, Contamination, and Food Safety. Challenges 2020, 11, 26. [Google Scholar] [CrossRef]
  38. Deng, M.; Deng, Y.; Dong, L.; Ma, Y.; Liu, L.; Huang, F.; Wei, Z.; Zhang, Y.; Zhang, M.; Zhang, R. Effect of Storage Conditions on Phenolic Profiles and Antioxidant Activity of Litchi Pericarp. Molecules 2018, 23, 2276. [Google Scholar] [CrossRef] [Green Version]
  39. Padda, M.S.; Picha, D.H. Effect of Low Temperature Storage on Phenolic Composition and Antioxidant Activity of Sweetpotatoes. Postharvest Biol. Technol. 2008, 47, 176–180. [Google Scholar] [CrossRef]
  40. Chang, M.Y.; Lin, Y.Y.; Chang, Y.C.; Huang, W.Y.; Lin, W.S.; Chen, C.Y.; Huang, S.L.; Lin, Y.S. Effects of Infusion and Storage on Antioxidant Activity and Total Phenolic Content of Black Tea. Appl. Sci. 2020, 10, 2685. [Google Scholar] [CrossRef] [Green Version]
  41. Li, Q.; Li, S.; Xu, T.; Xieli, C. Study on the Stability of the Effective Components Cinnamic Acid in the Decoction of Cinnamon. J. Pharm. Pract. 2020, 38, 255–258. [Google Scholar]
  42. Van Der Sluis, A.A.; Dekker, M.; Van Boekel, M.A.J.S. Activity and Concentration of Polyphenolic Antioxidants in Apple Juice. 3. Stability during Storage. J. Agric. Food Chem. 2005, 53, 1073–1080. [Google Scholar] [CrossRef]
  43. Lyu, J.I.; Kim, J.M.; Kim, D.G.; Kim, J.B.; Kim, S.H.; Ahn, J.W.; Kang, S.Y.; Ryu, J.; Kwon, S.J. Phenolic Compound Content of Leaf Extracts from Different Roselle (Hibiscus sabdariffa) Accessions. Plant Breed. Biotechnol. 2020, 8, 1–10. [Google Scholar] [CrossRef]
  44. Morales-Cabrera, M.; Hernández-Morales, J.; Leyva-Rúelas, G.; Salinas-Moreno, Y.; Soto-Rojas, L.; Castro-Rosas, J. Influence of Variety and Extraction Solvent on Antibacterial Activity of Roselle (Hibiscus sabdariffa L.) Calyxes. J. Med. Plants Res. 2013, 7, 2319–2322. [Google Scholar] [CrossRef] [Green Version]
  45. Larrauri, A.; Saura-Calixto, F. A Procedure to Measure the Antiradical Efficiency of Polyphenols. J. Sci. Food Agric. 1998, 76, 270–276. [Google Scholar] [CrossRef]
Figure 1. (a) UV-Vis spectra of chlorogenic acid, (b) UV-Vis spectra of rutin, (c) common chemical structure of cinnamic acid derivatives, (d) common chemical structure of flavonoid derivatives.
Beverages 09 00058 g001
Figure 2. Chromatogram of phenolic compounds in roselle tisane, (a) flavonoid compound at 355 nm, (b) HCA compound at 320 nm.
Beverages 09 00058 g002aBeverages 09 00058 g002b
Figure 3. Pareto chart of the factors in the extraction conditions. (X1, particle size; X2, temperature; X3, time; X4, amplitude). The vertical line across the diagram indicates that the limit value informing about the factor has significantly affected the recovery at 95% confidence. Blue bars mean positive effect, and yellow bars mean negative effect on the recovery. (a) Effects on the recovery of HCA; (b) effects on the recovery of flavonoid derivatives.
Beverages 09 00058 g003
Figure 4. Response surface plot displaying the effect of UAE factors, (a) response surface plot for HCA response, (b) response surface for flavonoid response.
Beverages 09 00058 g004
Figure 5. Pie charts of phenolic compounds composition of roselle tisane.
Beverages 09 00058 g005
Figure 6. Stability of phenolic compounds during storage time, (a) HCA derivatives, (b) Flavonoid derivatives. No significant differences were found for the storage time in ANOVA test at 95% of confidence level.
Beverages 09 00058 g006
Figure 7. Stability of Antioxidant activity during five days of storage. No significant differences were found for the storage time in ANOVA test at 95% of confidence level.
Beverages 09 00058 g007
Table 1. Box–Behnken design experimental runs with the corresponding responses * and prediction errors.
RunFactors* Response (%)
X1X2X3X4HCA DerivativesFlavonoid Derivatives
ObservedPredictedErrorObservedPredictedError
11100100.0096.513.49100.0093.396.61
2000075.7076.310.8060.4556.047.30
3011077.9180.913.8557.3263.2010.26
410−1087.4987.760.3175.7269.857.76
5−101056.4355.461.7120.7026.5028.04
60−1−1053.8250.845.5234.4129.4814.31
7010−171.8664.919.6652.1440.5522.23
80−11074.7771.074.9554.5746.7114.41
9100−175.7179.555.0846.4453.9916.27
1000−1−143.9146.515.9317.3025.0144.57
1101−1073.0676.795.1056.0064.8215.74
12000073.1776.314.3046.2356.0421.22
1300−1172.2567.406.7148.7642.4812.89
14001176.0274.092.5460.6452.0514.17
15010182.3384.532.6765.6167.633.07
16101091.6189.682.1178.5177.880.81
17−1−10029.9834.1413.8910.5916.3254.10
180−10156.1862.4311.1222.3633.8851.49
19−10−1031.8033.033.8618.3618.923.07
20−100154.3050.487.0328.6822.0823.02
211−10087.2486.410.9563.6861.313.72
22−100−131.8729.766.6310.483.5066.63
230−10−154.1351.235.3624.5622.478.49
24−110058.3259.822.5734.5836.074.30
25100187.5189.652.4465.9573.8912.03
26000080.0776.314.6961.4356.048.79
27001−158.6464.169.4125.6431.0421.07
* The relative value to maximum response (%) of the HCA derivatives or flavonoid derivatives in the sample.
Table 2. Performance of the HPLC-PDA method for individual phenolic compounds.
Phenolic
Compound
Linear EquationLOD
(µg mL−1)
LOQ
(µg mL−1)
High RangeR2Low RangeR2
Chlorogenic Acidy = 54,048x + 26,3700.999y = 54,147x − 3020.9990.240.73
Rutiny = 35,773x + 21,0280.999y = 37,588x − 11540.9970.712.15
Table 3. Precision of the extraction of phenolic compounds from roselle by ultrasound-assisted cold-brew method.
Phenolic CompoundPrecision CV (%)
RepeatabilityIntermediate Precision
HCA 11.993.19
Chlorogenic acid2.346.13
HCA 29.918.13
HCA 33.697.06
Flavonoid 18.548.46
Flavonoid 22.786.78
Rutin2.937.80
Table 4. The level of phenolic compounds in the studied roselle tisane produced using the best extraction conditions.
Phenolic CompoundsRoselle Tisane Sample (mg L−1)
PurpleRed
Chlorogenic Acid69.22 ± 1.6743.48 ± 0.39
Rutin2.13 ± 0.06 *4.58 ± 0.20
* The value was between LOD and LOQ.
Table 5. Antioxidant activity of roselle tisane cold brew.
Antioxidant Activity AssayIC50 Value (µg mL−1)
Ascorbic AcidConventionalUAE
Day 1Day 5Day 1Day 5
DPPH3.239.77 ± 0.01 a10.75 ± 0.04 b9.54 ± 0.06 a9.57 ± 0.01 a
ABTS3.588.06 ± 0.02 a8.69 ± 0.10 b7.80 ± 0.03 a7.82 ± 0.14 a
FRAP6.9910.34 ± 0.03 a10.88 ± 0.11 b9.96 ± 0.01 a10.01 ± 0.03 a
Note: different letter in one row means significant differences based on Tukey’s HSD (p < 0.05).
Disclaimer/Publisher’s Note: The statements, opinions and data contained in all publications are solely those of the individual author(s) and contributor(s) and not of MDPI and/or the editor(s). MDPI and/or the editor(s) disclaim responsibility for any injury to people or property resulting from any ideas, methods, instructions or products referred to in the content.

