1. Introduction
Biogenic amines (BAs) and amino acids (AAs) are natural components of grapes, wines, and sparkling wines, occurring at levels ranging from sub-milligram up to hundreds of milligrams per liter. Their concentrations depend on some grape features (cultivar variety, agricultural activity, climate, etc.) and, especially, on the fermentation practices [
1,
2,
3]. During alcoholic and malolactic fermentations, the enzymatic degradation of the proteins contained in the grapes takes place, thus increasing the concentration of free AA. In parallel, BAs are generated by the decarboxylation of the corresponding AA precursors by the action of yeast and lactic acid bacteria [
4]. In fact, malolactic fermentation (MLF) has been identified as the most important process contributing to the rise of BAs [
5].
Liquid chromatography with ultraviolet–visible (UV/Vis), fluorescence (FLD), or mass spectrometry (MS) detection are the techniques of choice for the determination of BAs and AAs in food matrices and, in particular, in wines [
6,
7,
8]. Apart from liquid chromatography, other separation techniques, including capillary electrophoresis (CE), gas chromatography (GC), and thin layer chromatography, have also been proposed in some applications [
9,
10,
11,
12]. Apart from separation methods, other spectrometric techniques such as nuclear magnetic resonance (NMR) have been used to determine AAs and BAs together with other relevant compounds (e.g., sugars, organic acids, and alcohols) as the basis of further characterization and authentication studies [
13,
14,
15].
Liquid chromatography, either with high-performance or ultra-high-performance modalities, offers a great separation capacity combined with other excellent analytical figures such as robustness and accuracy. When using UV–vis or fluorescence detection, AAs and BAs are usually derivatized with labeling reagents to improve their detectability and the sensitivity and detection limits of the methods. The derivatization is not strictly necessary with MS detection although it is highly recommendable to facilitate the separation. Indeed, derivatives can be separated more efficiently than free (underivatized) molecules by chromatographic modes such as reversed-phase or HILIC. Numerous labeling reagents with highly absorbent and/or fluorescent moieties are commercially available. For instance, 6-aminoquinolyl-N-hydroxysuccinicmidyl carbamate (AQC), o-phthalaldehyde (OPA), fluorenylmethyl chloroformate (FMOC), and dansyl chloride (dansyl-Cl) are highly popular [
8]. In this work, dansyl-Cl was selected as a derivatizing agent reacting with both primary and secondary amino groups to yield highly absorbent and fluorescent derivatives [
5].
The role of BAs as descriptors or biomarkers of some wine features has been pointed out in numerous papers [
3,
16,
17,
18]. As can be seen in representative examples commented below, different studies demonstrated the possibilities of this family of analytes to explain attributes related to geographical and varietal origin, vinification practices, or aging. In general, chemometric methods were applied to facilitate the extraction of the underlying information. In this regard, statistical analysis was used to assess the significance of the compositional differences among the different classes, principal component analysis (PCA) and cluster analysis (CA) were used for unsupervised exploratory studies, and linear discriminant analysis (LDA) and partial least square–discriminant analysis (PLS-DA) were commonly used for classification purposes [
19]. For instance, various red and white Croatian wines from different regions elaborated with several grape varieties were analyzed chromatographically to determine the BA contents [
20]. The PCA and statistical analysis revealed significant patterns such as the up-expressed levels of spermine, histamine, methylamine, and putrescine in Hrvatsko Zagorje red wines, while spermidine, tyramine, isopentylamine, ethanolamine, and ethylamine were down-expressed. In another study, Italian red wines from four protected designations of origin (PDO) were investigated to find out potential BA markers of their appellation of origin [
21]. Supervised chemometric methods such as LDA and PLS-DA provided suitable classification models to predict the PDOs with excellent sensitivities and specificities (100% rates). Furthermore, BAs profiles of Italian wines from Abruzzo were used as the source of information to establish an overall index of quality [
22]. Significant differences were found in BA levels of red, rosé, and white wines. Yañez and coworkers studied the possibilities of BAs to discriminate among organic and nonorganic Chilean wines [
23], and Garcia-Villar et al. explored the characterization based on aging [
24], finding noticeable differences among young, “crianza”, “reserva”, and “gran reserva” red wines. The information gained from BAs has also been combined with other types of analytes to achieve more comprehensive descriptions, such as in the case of their fusion with the elemental composition [
25], in which global classification models allowed to explain the vinification process. In the same line, Restuccia and coworkers evaluated the impact of cultivar varieties on the BA and polyphenol profiles of Calabrian red wines [
26], concluding that BA overall contents depended on the variety, thus being a factor that could be exploited for their characterization.
The potential of amino acids as possible descriptors of wine features has been scarcely studied, possibly because, unlike the biogenic amines, there are no toxicological implications that require specific studies. For instance, Miras-Abalos et al. attempted a varietal classification of Galician (Spanish) wines (Albarino, Godello, and Treixadura) from three different vintages based on AA contents [
27]. In general, Treixadura wines were richer in AAs and Albarino poorer, and based on that, the discrimination among the different varieties was accomplished. In another example, the over-lees aging of Brazilian sparkling wines was evaluated based on the AA content [
28]. A significant increase in the content of some compounds (e.g., citrulline, lysine, phenylalanine, glycine, aspartic acid, and others) was observed, attributable to their release from the yeast cells. Furthermore, some papers tackle the simultaneous determination of these related compounds because of the similarity between AAs and BAs in terms of derivatization and separation. Martinez-Lapuente and coworkers found out that the contents of some AAs and BAs decayed with the aging of sparkling wines from Tempranillo and Verdejo varieties [
29]. Arrieta and Prats-Moya characterized Monastrell wines of Alicante (Spain) PDO from AA and BA profiling [
30]; compositional differences among young, “crianza”, and “Fondillón” were the basis for their discrimination. In another case, Perestrelo and coworkers studied the classification of Verdelho wines according to vintage using concentrations of various polyphenols, BAs, and AAs as the data [
16]. Hungarian wines were characterized under a similar approach using PCA and LDA [
31]. Information from AA content was also combined with the profile of volatile compounds from GC to obtain enriched descriptions of wines [
32].
In this work, a new chromatographic method to determine simultaneously AAs and BAs in various oenological samples, such as musts, wines, and sparkling wines, was developed and validated. The method relies on a previous paper to quantify BAs in similar samples [
5]. Some modifications have been implemented to deal with the separation of a broader range of compounds, especially considering that, in general, AAs are more polar than BAs. Furthermore, tandem mass spectrometry (MS/MS) with multiple reaction monitoring was used to improve the sensitivity and selectivity of the detection. The method presents an excellent performance and is fully compatible with the quantification of the target analytes in the set of samples. Compositional information obtained in this way has been submitted to a chemometric analysis for the characterization and classification of samples. Interestingly, differences in concentration profiles depending on quality and variety attributes were exploited to implement highly promising classification strategies.
2. Materials and Methods
2.1. Reagents and Chemicals
Reagents used for the preparation of the stock solutions of amino acids AAs and BAs were as follows (unless otherwise indicated, the purity of these compounds is greater than 99%): L-glutamic acid, L-lysine monohydrochloride, L-aspartic acid, histamine dihydrochloride, octopamine hydrochloride, tryptamine hydrochloride (≥97%), spermine trihydrochloride, 2-phenylethylamine hydrochloride, spermidine trihydrochloride, and tyramine hydrochloride (≥97%) were supplied by Fluka (Buchs, Switzerland). L-ornithine monohydrochloride and L-asparagine were from Carlo Erba (Milan, Italy). L-histidine, L-Leucine, L-tryptophan, L-serine, L-alanine, L-phenylalanine, L-methionine, L-hydroxyproline, L-proline, and glycine were purchased from Merck (Darmstadt, Germany). L-tyrosine, L-isoleucine, L-valine (>98%), L-glutamine, L-arginine, L-cysteine (>98%), and L-threonine were supplied by Sigma-Aldrich (St. Louis, MO, USA). 1,5-diaminopentane (98%, cadaverine), 1,4-diaminobutane dihydrochloride (putrescine), and agmatine sulfate (98%) were purchased from Alfa Aesar (Kandel, Germany). 2-aminoethanol hydrochloride (>98%), ethylamine hydrochloride (>98%), and hexylamine hydrochloride were from Tokyo Chemical Industry (TCI, Tokyo, Japan). Individual standard solutions of each AA and BA at 1000 mg L−1 were prepared with Milli-Q water and stored at −20 °C until use. These stock solutions were used to prepare intermediate aqueous standards of 100, 50, and 20 mg L−1, kept at 4 °C in a refrigerator until use.
Dansyl-Cl (98%, Acros Organics, Geel, Belgium) was the derivatizing reagent. First, 50 mg of dansyl-Cl were dissolved in 40 mL of acetone (LichroSolv, Merck, Darmstadt, Germany). The pH of the reaction medium was adjusted to 9.5 with a regulating solution consisting of 1.4 mM NaOH and 0.1 mM Na2CO3, prepared from sodium hydroxide and sodium carbonate, both from Sigma-Aldrich. Acetonitrile (UHPLC Supergradient grade, AppliChem, Castellar del Vallès, Spain), formic acid (≥95%, ACS, Sigma-Aldrich, St. Louis, MO, USA), and purified Milli-Q water (Millipore Corporation, Bedford, MA, USA) were the components of the mobile phase.
2.2. Samples
Samples were kindly provided by Raventós Codorníu group (Sant Sadurní d’Anoia, Spain). They consisted of monovarietal musts, base wines, stabilized wines, and sparkling wines (3- and 7-month aged) prepared from xarel·lo and pinot noir grape varieties. Products were ranked according to quality in four classes, referred to as A, B, C, and D, with A denoting the highest and D the lowest quality. As a result, a total of 40 samples were available corresponding to five sample types (i.e., must, base wine, stabilized wine, 3-month-aged sparkling wine, and 7-month-aged sparkling wine), two grape varieties (xarel·lo and pinot noir), and four qualities (A, B, C, and D).
More information on the agricultural and oenological features to define the product qualities has been detailed elsewhere [
5]. Briefly, enologists from the winery preliminarily ranked the vineyard quality depending on the type of soil, the type of grape plantation (ecological or conventional), pruning, ripening, and grape production (ca. from 6000 for A to more than 10,000 kg per hectare for D). The harvesting and transport of A-type grapes were manual and refrigerated, while that for B, C, and D types were mechanized. The press load and pressure applied increased from A to D, so the must yield increased accordingly. Musts obtained under more energetic pressing conditions decreased the tartaric/malic acid ratio because of the precipitation of calcium and potassium tartrates. As a result, the best wines, obtained under milder pressing, were richer in tartaric acid and accordingly more suitable for aging for months or years. Conversely, wines of lower quality have to undergo malolactic fermentation to reduce the malic acid content and achieve a more pleasant taste. In short, the initial quality of the vineyard, the manual or mechanized harvesting, the productivity, the maturation and health state of the grape, the pressing yield, and the malolactic fermentation are key factors to define the qualities of subsequent products.
2.3. Instrumentation
The HPLC-MS instrument consisted of an Agilent 1100 LC System liquid chromatograph (Agilent, Technologies, Palo Alto, CA, USA) equipped with a degasser system (G1379A), a binary pump (G1312A), an autosampler (G1379A), a thermostat (G1330B), and diode array spectrophotometer (DAD, G1315B) coupled to an Applied Biosystems 4000 QTRAP hybrid triple quadrupole/linear ion trap mass spectrometer (ABSciex, Framingham, MA, USA). Analyst 6.2 software (AB Sciex) was used to control the instrument, record the chromatograms, and quantify the analytes.
The pH of the samples and the reaction medium was measured with a Crison potentiometer (Alella, Spain) with a combined glass electrode. Complementary laboratory equipment comprised an ultrasonic bath (Branson 5510, Danbury, CT, USA) and the Labofuge 400 centrifuge (Heraeus, Hanau, Germany), an IKA RCT Basic heater (IKA-Werke, Staufen, Germany), a Genius 3 Vortex mixer (IKA, Staufen, Germany), and a PB1502-L analytical balance (Mettler-Toledo, Columbus, OH, USA).
2.4. Chromatographic Method
The precolumn derivatization of AAs and BAs occurring in the samples (i.e., must, wine, and sparkling wine) or in the standard solutions was performed in glass vials of 1.5 mL by mixing 250 μL of the sample/standard, 250 μL of dansyl-Cl reagent solution, and 250 μL of carbonate/hydroxide pH-regulating solution (see
Section 2.1 for their compositions). The reaction was developed for 15 min at room temperature. The resulting mixture was filtered through syringe Nylon membranes (0.45 µm pore size, 20 mm diameter, Macherey-Nagel, Düren, Germany). The filtered solutions were kept in glass chromatographic vials for further analysis. Solutions obtained in this way were stable for one week when stored at 4 °C in the refrigerator. Samples were derivatized and analyzed in triplicate.
The chromatographic separation of analyte derivatives was carried out in a C18 Kinetex reversed-phase chromatographic column (2.6 μm particle size, 150 mm × 4.60 mm, and 100 Å pore size) with a C18 pre-column (4.00 mm length × 3.00 mm I.D), both from Phenomenex (Torrance, CA, USA). The elution gradient was created from 0.1% formic acid aqueous solution and acetonitrile (ACN) as follows: 20% to 95% ACN, from 0 to 25 min (linear increase); 95% ACN from 25 to 27 min; and 95% to 20% ACN, from 27 to 27.5 min (linear decrease). The column was conditioned with 20% ACN for 2.5 min before the next run. The flow rate was 0.7 mL min−1, and the injection volume was 10 μL. The UV chromatogram was recorded at 325 nm to detect the AA and BA derivatives.
HPLC with tandem MS/MS detection was used to quantify the analyte content in the set of samples based on multiple reaction monitoring (MRM). An electrospray (ESI) Turbo V™ ion source was used in positive mode. Gas 1, gas 2, curtain gas, and collision gas were nitrogen. The source conditions are as follows: Source voltage, 4500 V; source temperature, 500 °C; gas 1 pressure, 50 psi; gas 2 pressure, 50 psi; and curtain gas pressure, 10 psi.
Table S1 in the supplementary material shows the transitions for each analyte and the optimal values of declustering potential (DP), collision energy (CE), cell exit potential (CXP), and retention time of each analyte.
The concentrations of the 22 AAs and the 12 BAs were quantified using a regression model based on three calibration curves run at the beginning, middle, and end of the working sequence. For each sample, three independent replicates were prepared and were analyzed randomly to minimize the possible effect of instrumental and chemical drifts in the results. Further, a quality control (QC) sample solution was prepared by mixing equal volumes of each sample in the same vial. The QC was used to control the stability of the chromatographic runs throughout the injection sequence and provide statistical information on the significance of the results and conclusions.
2.5. Data Analysis
Compositional data obtained as indicated in the previous section were used as the source of information for further sample characterization and classification. The global data matrix was constructed for this targeted approach using analyte concentrations expressed in mg L−1, where each row represents a given sample replicate and each column an analyte. As a result, the matrix dimension was 135 samples × 34 analytes, which included the 120 sample replicates plus the 15 QC replicates.
The SOLO program from Eigenvector Research was used for the chemometric treatment of the data matrix. Data were preprocessed by autoscaling to equalize the magnitude and amplitude of the variables, so any AA or BA is equally weighted. Principal component analysis (PCA) was applied to explore the sample behavior, while partial least square–discriminant analysis (PLS-DA) was used to address classification issues.
3. Results and Discussion
3.1. Optimization of Working Conditions
Derivatization and separation conditions previously established by Mir-Cerdà et al. [
5] to determine BAs in oenological samples, including must, wine, and sparkling wine, were adapted here to carry out the simultaneous quantification of 22 AAs and 12 BAs (see the experimental section for the list of compounds under study). In particular, the pH of the reaction medium was slightly increased to allow more efficient derivatization of amino acids using a carbonate/hydroxide buffer (see the composition in the experimental section) instead of the former tetraborate one. Regarding the separation, the initial eluotropic power of the mobile phase was reduced for suitable retention of the most polar AA derivatives, such as arginine, asparagine, glutamine, serine, etc. Hence, a low ACN percentage (ca. 20–30%) was used to elute those polar derivatives, while higher ACN percentages (ca. 95%) were needed for BAs such as tyramine, spermine, and spermidine. The gradient time was 27 min to provide a better separation of analytes exhibiting a wide range of polarities.
Regarding the MS/MS detection, the multiple reaction monitoring (MRM) mode was chosen in which specific transitions for each compound were selected. The precursor ion consisted of the protonated dansyl derivative, while the product ion generally corresponded to the loss of a dansyl group or the loss of the dansyl-SO
2 moiety. Working conditions were carefully established to achieve the maximum sensitivity for the target analytes. Different parameters were evaluated including declustering potential (DP), collision energy (CE), and cell exit potential (CXP).
Table S1 summarizes the optimal value of these parameters.
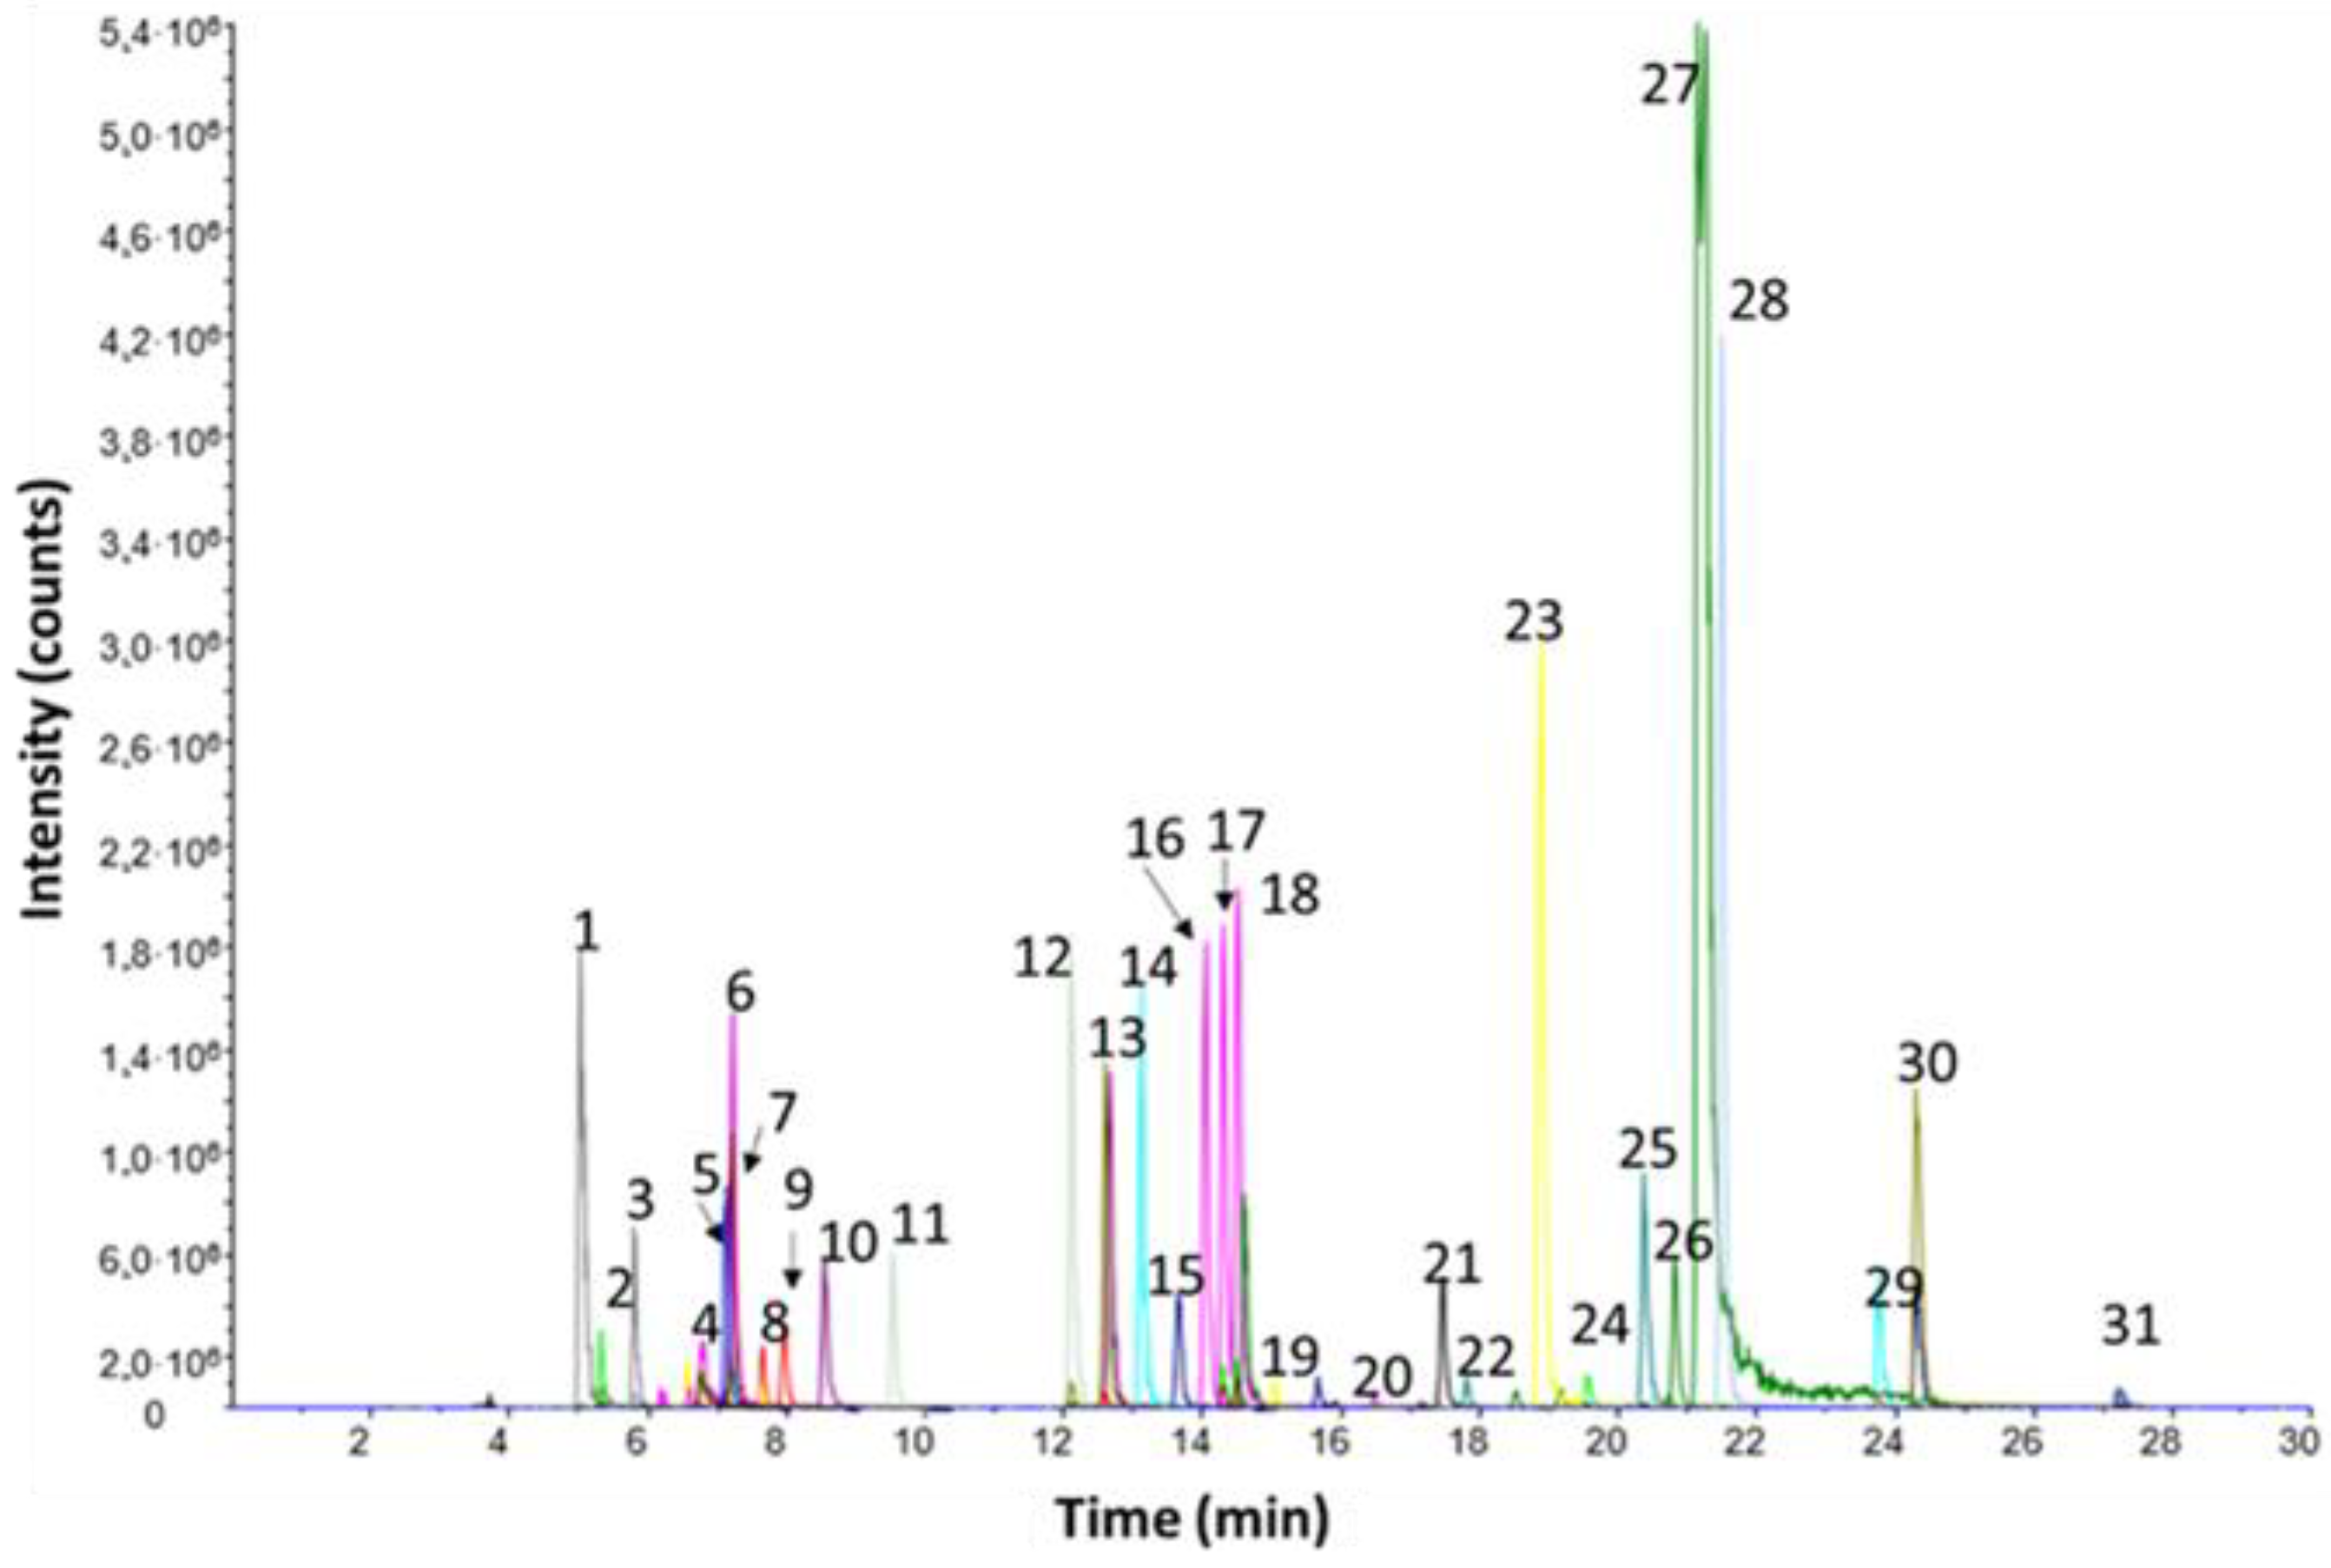
As an example, the chromatogram of derivatives from a standard composed of 34 analytes (22 AA and 12 BA) is shown in
Figure 1. Although some partial chromatographic overlapping occurred (such as aspartic acid and hydroxyproline or valine and methionine), no interferences were expected because of the improved selectivity given by the MS/MS detection in MRM mode. Most of the reaction products were monoderivatives, in which the amine group was labelled with the dansyl moiety. For agmatine, ornithine, lysine, histidine, histamine, putrescine, and cadaverine, di-derivatives were obtained. In addition, two dansyl moieties were attached to tyrosine, tyramine, and octopamine: one through the amino group and another via the phenol group. Finally, for the polyamines spermidine and spermine, tri and tetra derivatives were obtained, respectively.
3.2. Validation of the HPLC-MS/MS Method
Figures of merit of the HPLC-MS/MS method were established under the selected experimental conditions as follows: the linearity of the method was assessed from BA and AA standards in the concentration range of 0.02 to 10 mg L
−1 each. In particular, the following standards were prepared: 0.02, 0.05, 0.1, 0.2, 0.5, 1, 2, 5, and 10 mg L
−1 in duplicate. Linear ranges are detailed in
Table S2 in the supplementary material. As can be seen, many compounds displayed upper limits of linearity of 5 mg L
−1 or higher, while the lower limits were ca. 0.05 to 0.1 mg L
−1. Determination coefficients (R2) were always better than 0.99 (in some cases, >0.999).
The repeatability of the methods was evaluated at two levels, namely −0.2 and 2 mg L
−1 for each analyte, from six independent derivatization replicates (see
Table S2). For the peak areas of each analyte, RSD values were lower than 10% and usually below 5%. For the retention time, the repeatability was excellent and in general below 0.1%, thus indicating the great reproducibility of the chromatographic separation.
3.3. Determination of Amino Acids and Biogenic Amines in the Oenological Samples
The concentrations of AAs and BAs in the set of samples were determined according to the proposed method from three independent derivatizations of each sample. Samples were analyzed randomly to minimize segregations and trends associated with uncontrolled/unknown experimental drifts. Proline was the most abundant compound, with concentrations generally ranging from 200 to 600 mg L−1. Other remarkable amino acids were arginine, alanine, and lysine, with levels of ca. 10 to 30 mg L−1. Glutamic acid, asparagine, histidine, leucine, and ornithine were also present at concentrations around 10 mg L−1. For the BAs, contents were commonly lower than for AAs, with ethanolamine being the most abundant (with ca. 5–10 mg L−1). Putrescine (ca. 2–4 mg L−1), histamine, and tyramine (below 1 mg L−1) were also quantitatively relevant.
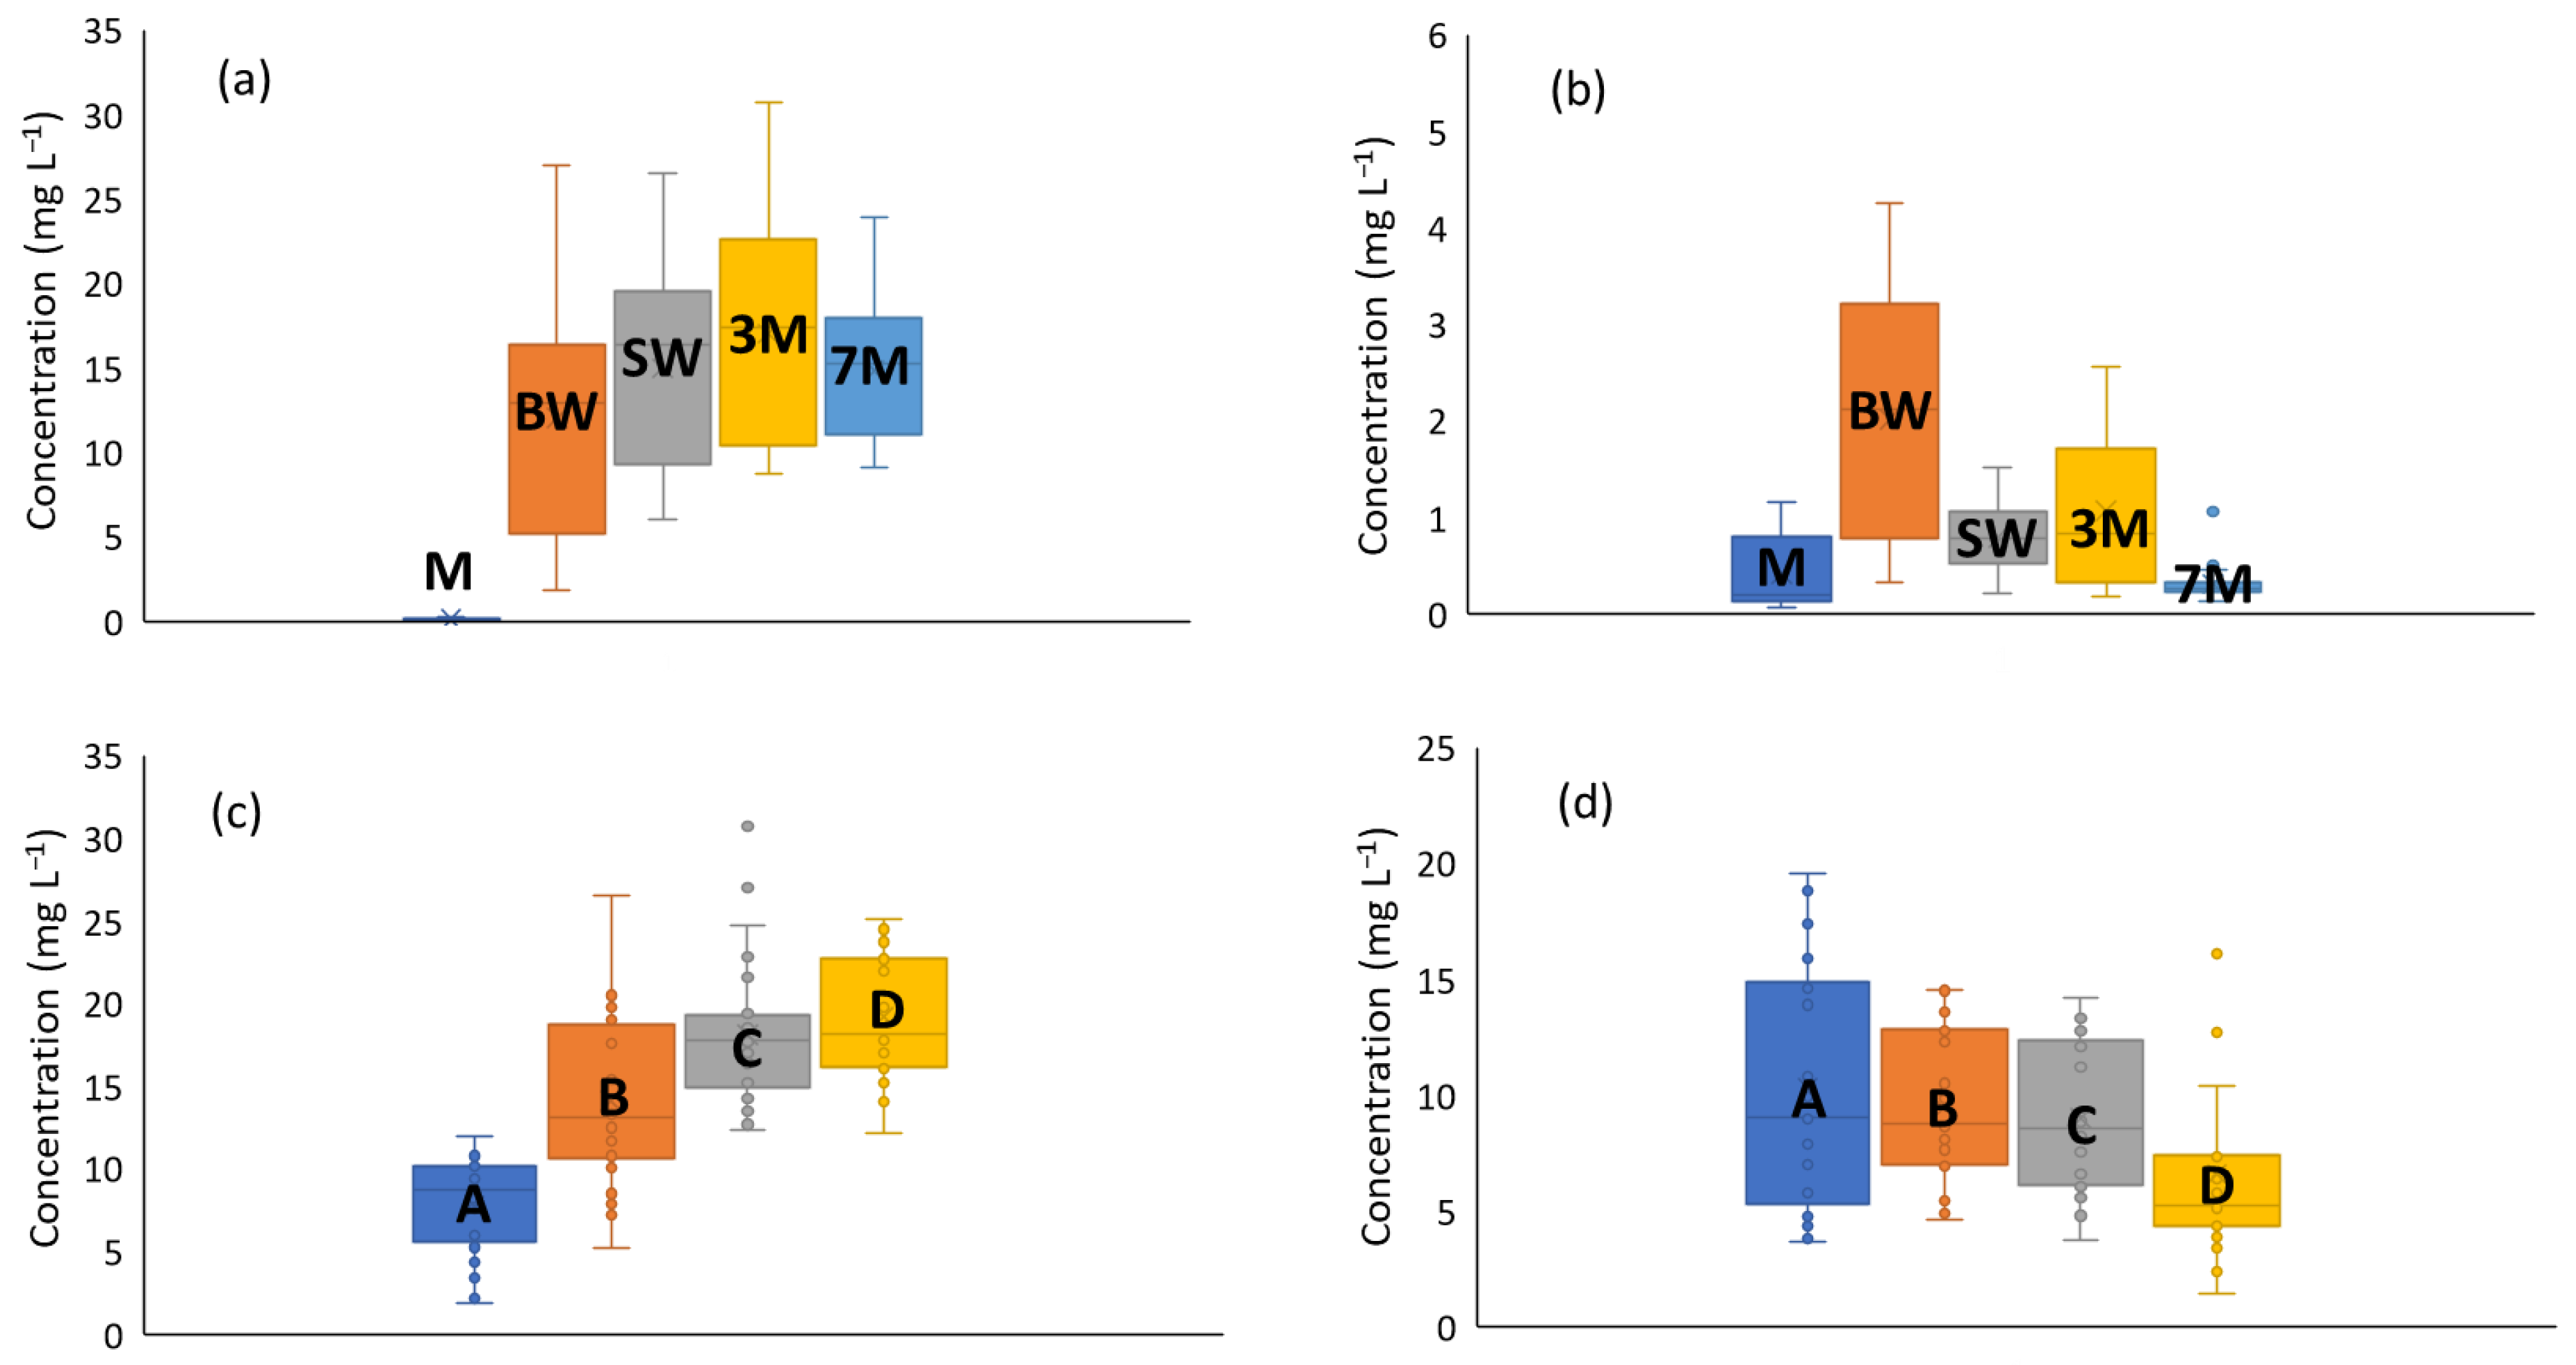
The most noticeable changes dealing with the AA and BA contents occurred for the sample type; musts contained poor levels of BAs and AAs compared with the fermented samples. This finding was attributed to the fact that these compounds were mainly generated by the degradation of proteins due to the activity of microorganisms, so they mainly occurred throughout the fermentative processes. As shown in some representative plots (see
Figure 2, subplots a and b), this pattern was general for most of the compounds. Moreover, levels of AAs and BAs were quite constant in further vinification steps. For some compounds such as glutamic acid, aspartic acid, and ethanolamine, concentrations slightly increased with the process from the first to the second fermentation and the aging period. In contrast, for histidine, serine, histamine, and putrescine, concentrations barely decayed from wines to sparkling wines.
The grape quality was another relevant factor influencing the concentration of AAs and BAs in the oenological samples. At the must stage, differences were not so noticeable although in general, grapes of lower qualities were richer in aminated species. For samples subjected to fermentation, the differences were more remarkable, as it can be seen in representative examples shown in
Figure 2 (see subplots c and d). For the AAs, a progressive increase in their levels from A to D quality was observed, as depicted in the model example of glutamic acid. Analogously, most of the BAs followed this trend, and concentrations of A and B classes were much lower than those of the C and D counterparts. Some particular exceptions, such as the tyrosine model (
Figure 2d), differ from this pattern.
In a previous work [
5], interesting patterns were found proving that BA levels increased with fermentations, especially when MLF was applied. Here, MLF has been reserved to wines of low quality, such as those of C and D classes, to minimize the unpleasant sour character and provide creamier flavors. Regardless, high-quality products have been developed under more controlled and neater conditions, thus minimizing the formation of BAs. These practices agree with the finding that C and D classes display higher BA levels.
Finally, the influence of the variety in AA and BA contents is much more limited. In many cases, differences between pinot noir and xarel·lo are not significant. In a few particular cases, such as leucine, asparagine, serine, glutamine, and methionine, AA and BA levels are slightly higher in xarel·lo than in pinot noir.
3.4. Characterization of Wines and Sparkling Wines by PCA
The potential role of BAs as the descriptors of some oenological and quality factors has been demonstrated elsewhere [
5]. In this paper, we want to explore the descriptive ability of AA precursors for characterization and classification issues. Some initial studies will attempt to exploit AA profiles as the source of information. Subsequently, AA data will be complemented with the BA profiles to enrich the dataset for a more comprehensive characterization of the samples.
The exploratory evaluation of AA profiles by PCA using a sample set comprising musts, wines, sparkling wines, and QCs was carried out. An autoscaled model was constructed with 20 variables (cysteine and tryptophan were excluded because their concentrations were in the order of magnitude of the limits of detection and mainly contributed to noise). Hence, the data matrix dimension was 120 samples plus 15 QCs and 20 analytes (135 × 20). The preliminary model with all sample types retained 72.6, 8.4, and 5.6% of the data variance by PC1, PC2, and PC3, respectively. The scores plot of PC1 vs. PC2 revealed two compact clusters corresponding to must and QCs and a more diffuse area in which samples were grouped according to their qualities (see
Figure S1 in the supplementary material). The compactness of the QCs confirmed the data quality in terms of reproducibility and robustness.
A further model was focused on fermented samples (only wines and sparkling wines) for a more detailed study of their characteristics. In this case, we found 60.1%, 12.2%, and 7.1% of the data variance by PC1, PC2, and PC3, respectively. The sample structuration according to quality was more marked, and A-type samples were located to the left, B-type samples spread in the central area, and those of lower quality (C- and D-type samples) overlapped on the right side. The map of loadings suggested that, in general, AAs were more abundant in C- and D-type samples (e.g., glutamic and aspartic acids, serine, methionine, valine, lysine, alanine, etc.), in agreement with our discussion in
Section 3.3. Other compounds such as glutamine and arginine displayed less-defined behavior, while histidine and tyrosine occurred at slightly higher levels in those samples of higher quality.
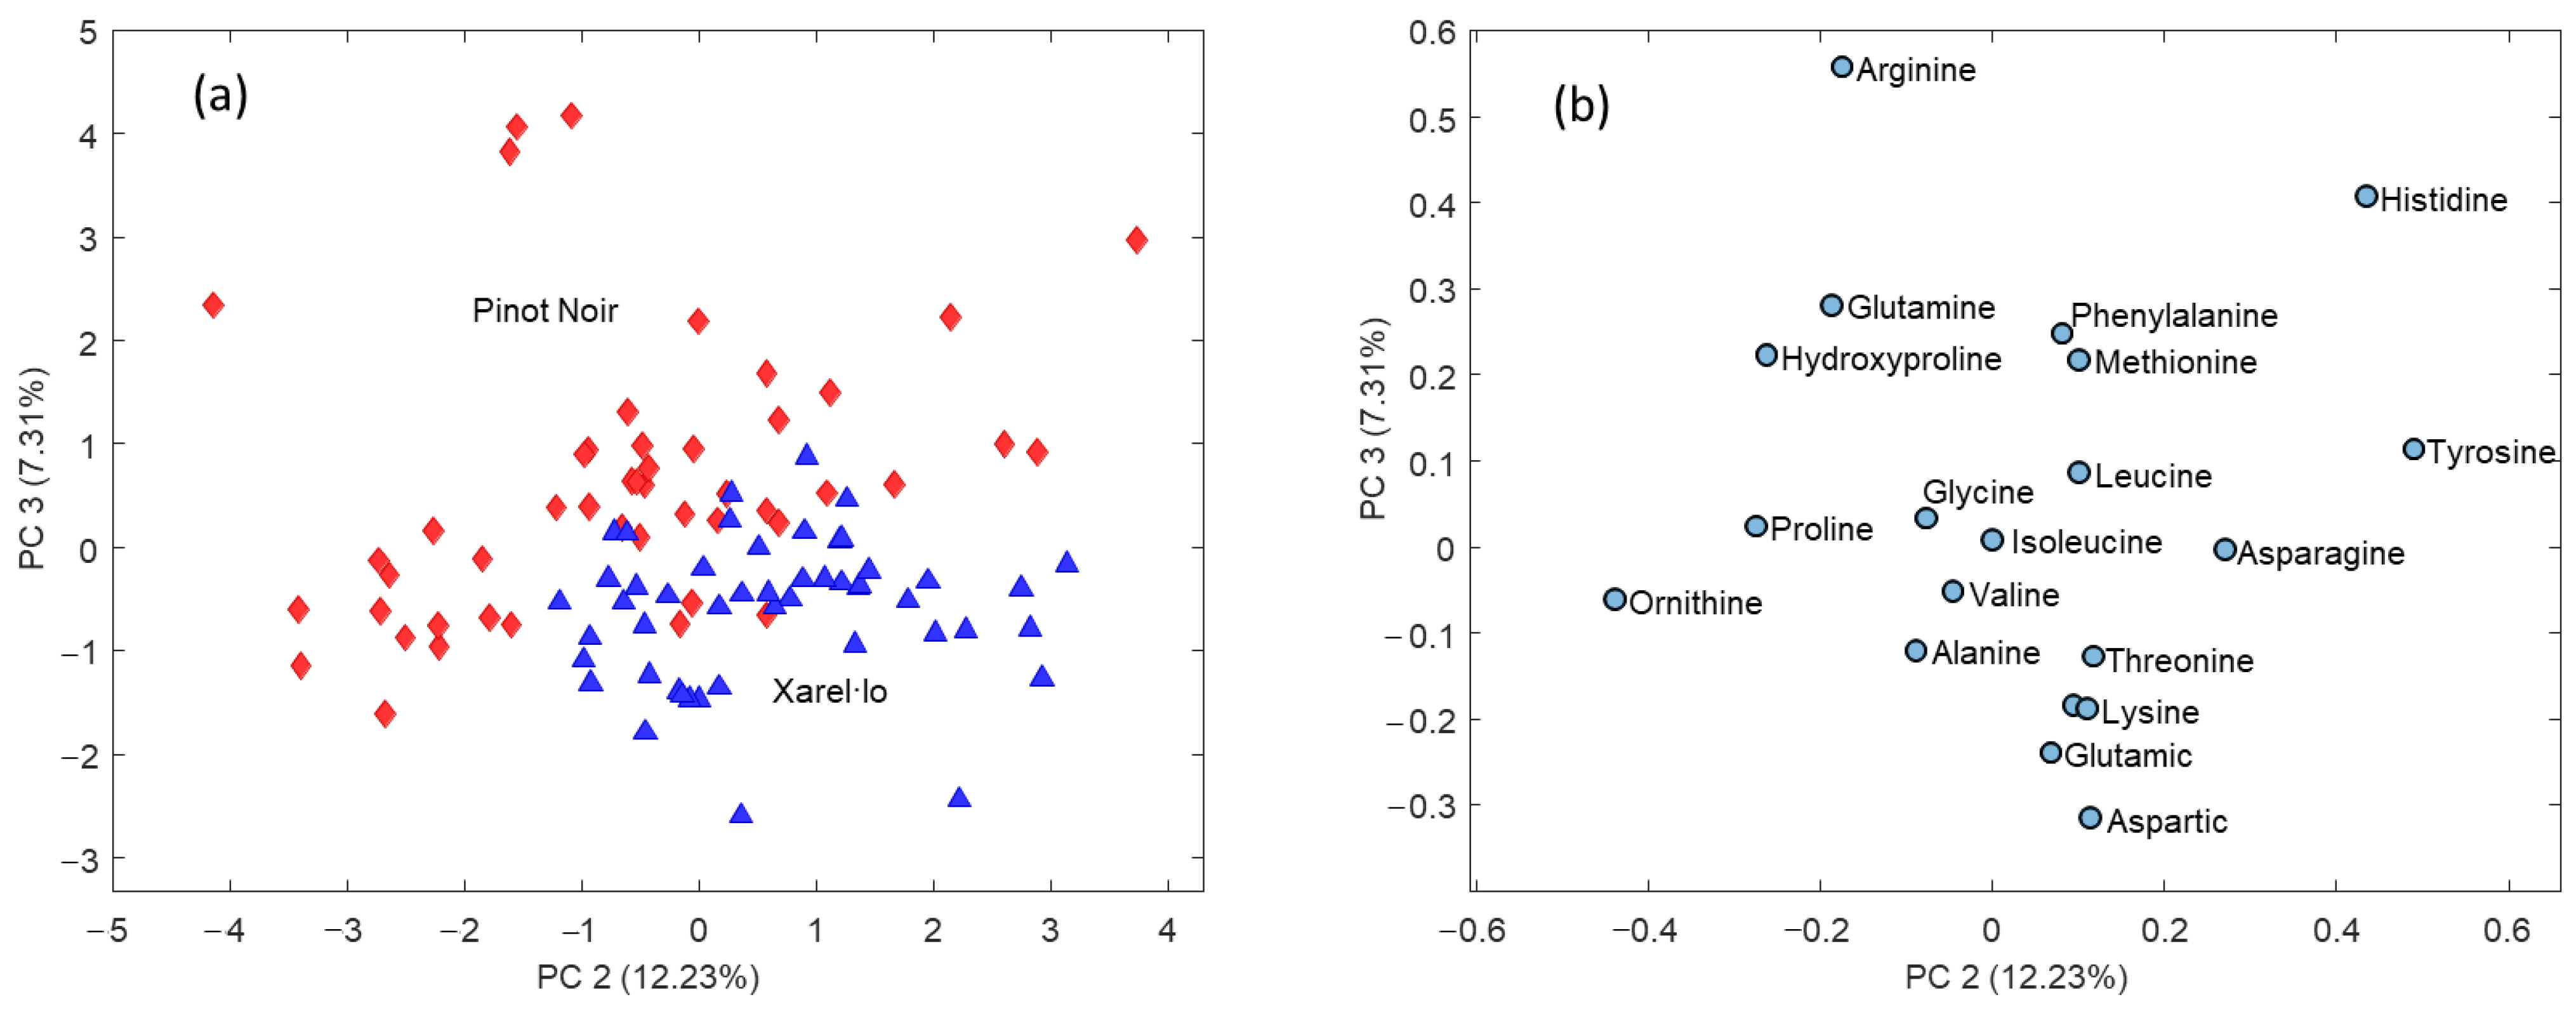
The information provided by the compositional profiles of amino acids in the fermented samples was also related to the varietal issues, as can be seen in
Figure 3, depicting the scatter plot of scores of PC2 vs. PC3. As can be seen, pinot noir samples are mainly spread on the upper part, while xarel·lo samples are concentrated in the lower part. From the plot of loadings, it can be deduced that xarel·lo samples are, in general, richer in AAs such as aspartic and glutamic acid, serine, lysine, threonine, valine, asparagine, etc. More exceptionally, species such as histidine and arginine are up-expressed in pinot noir.
A PCA model focused on musts (not fermented) samples revealed that the AA profile is not descriptive of either quality or grape variety in this type of samples. As commented above, the AA content as well as the BA content is quite constant in all the must samples studied irrespective of the quality or the grape variety, pointing out that protein degradation and thus generation of AA and BA occurs mainly during the fermentation processes.
Compositional data from AA and BA were further combined to try to achieve a more global description of samples and variables. Raw data consisted of 120 samples plus 15 QCs and 34 analytes (matrix dimensions 135 × 34). As in the previous case, the data were autoscaled to equalize the influence of all the variables regardless of their concentration levels and amplitude of scales. A preliminary PCA model working with this data set showed that QCs presented a certain dispersion due to the presence of some noisy compounds such as spermine, spermidine, octopamine, and cysteine, which were subsequently discarded to make the model since their variability in the QCs was higher than 40%. Additionally, other species such as tryptamine, agmatine, ethylamine, and tryptophan were excluded because their concentrations were practically negligible.
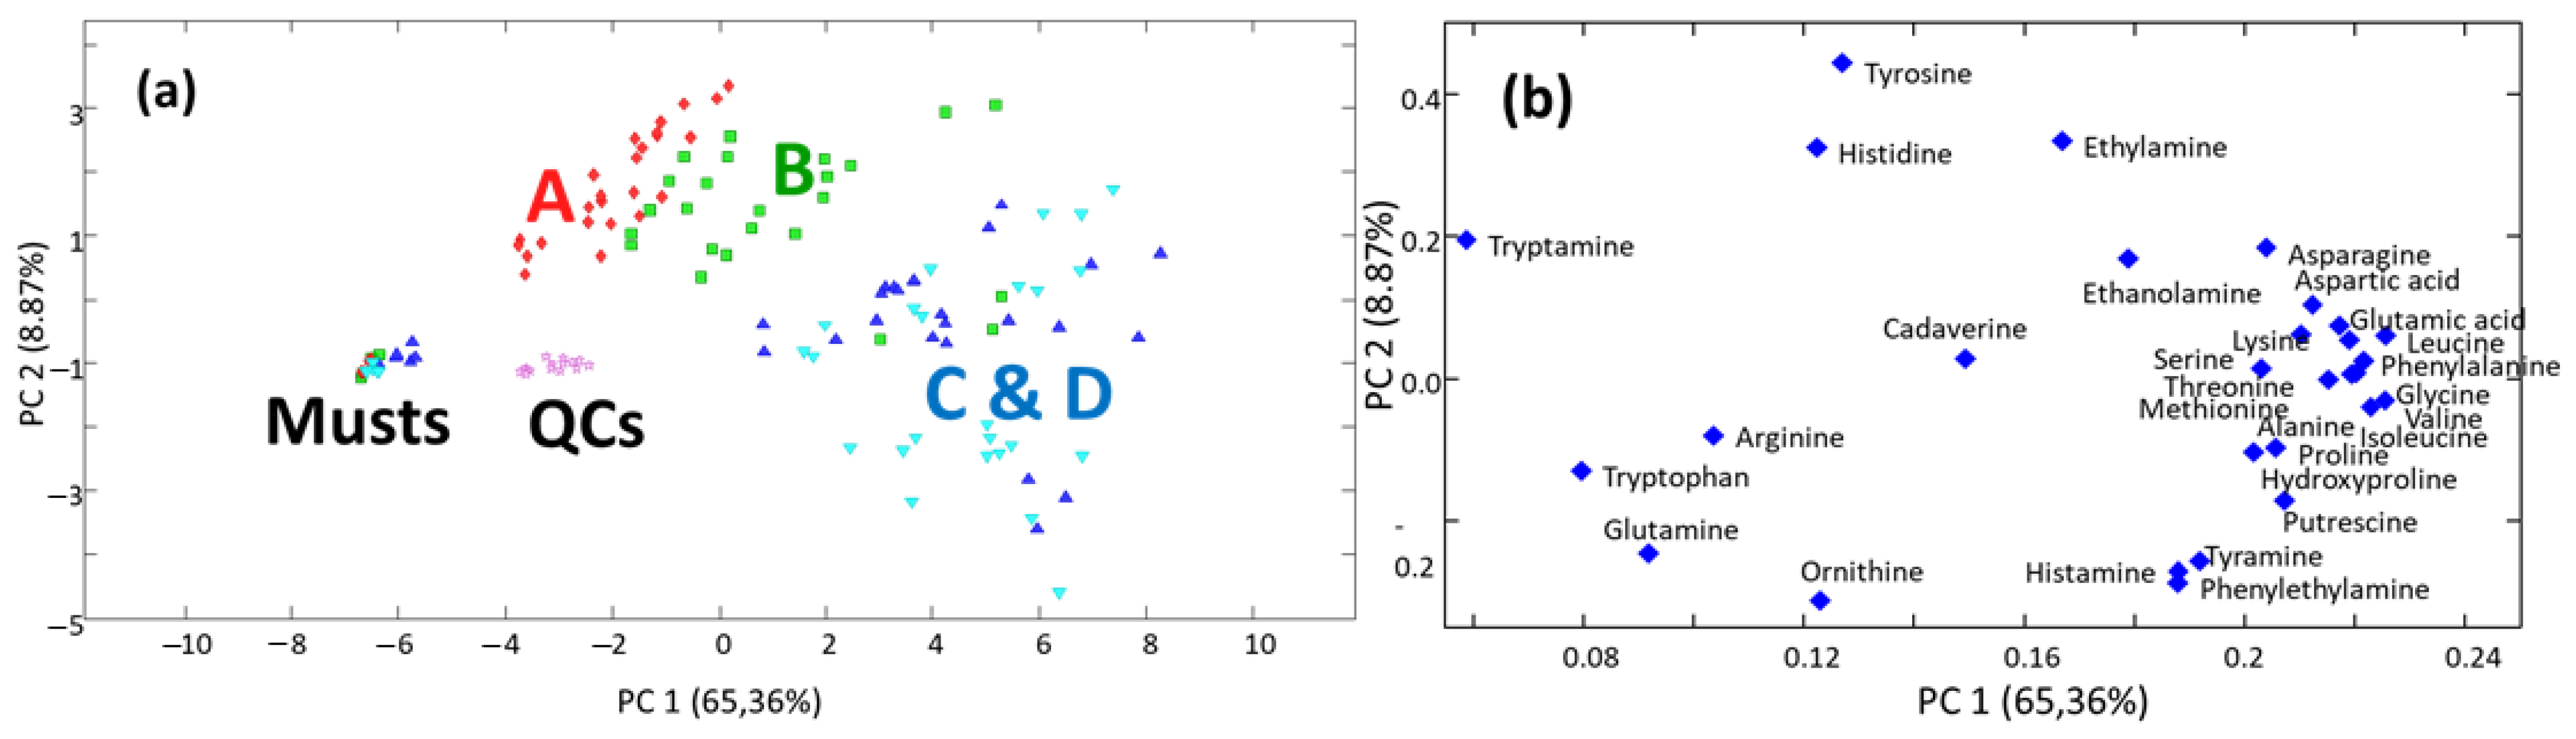
After this variable selection from which 26 compounds were chosen, the new PCA model constructed showed a scatter plot of scores in which the QCs grouped in a compact cluster in the center of the graph, without trends dealing with instrumental drifts. Hence, results from the reduced data matrix demonstrated the high quality and robustness of the resulting data. PC1 and PC2 explained 65.36% and 8.87% of the variance, respectively. The scatter plot of scores of these PCs showed sample groupings according to wine variety, sample types, or quality. As can be seen in
Figure 4, a distant and compact group including all the musts was found on the left side of the graph, thus suggesting that these samples were highly different from the rest (this agrees with previous compositional discussion in
Section 3.3, from which the concentration of free amines and amino acids is much lower before starting any fermentation). The central and right parts of the graph allocate the fermented samples. Although they show some patterns dealing with the type of wine (i.e., base and stabilized and sparkling wines), the principal sample structuration was according to the quality. Quality A samples appear grouped in the upper left part of the score graph, followed by the quality B, which is roughly centered; these two qualities show a clear difference between groups, but qualities C and D are on the right side of the graph, showing a single group with a clear overlap.
3.5. Classification of Wines and Sparkling Wines by PLS-DA
The relationships among the compositional profiles and the oenological features depicted by PCA foresaw that these compounds could be used as descriptors to classify samples as a function of qualities (A, B, C, and D) and varieties (xarel·lo and pinot noir) using PLS-DA as the chemometric method.
A preliminary model with fermented samples (wine, stabilized wine, and 3-months-aged and 7-months-aged sparkling wines) was constructed using eight classes defined by quality and variety, namely A-type pinot noir (PA), A-type xarel·lo (XA), B-type pinot noir (PB), B-type xarel·lo (XB), C-type pinot noir (PC), C-type xarel·lo (XC), D-type pinot noir (PD), and D-type xarel·lo (XD). As in the best PCA model, 26 AA and BA variables were considered as the source of information. Promising results were depicted in the scatter plot of LV1 versus LV2, in which several classes were already separated in this projection (
Figure 5). PC and PD samples were not mixed with the other classes. The PB class was almost discriminated from the other products. PA, XA, and XB were grouped in the same area, and XC and XD were located in the upper right sector.
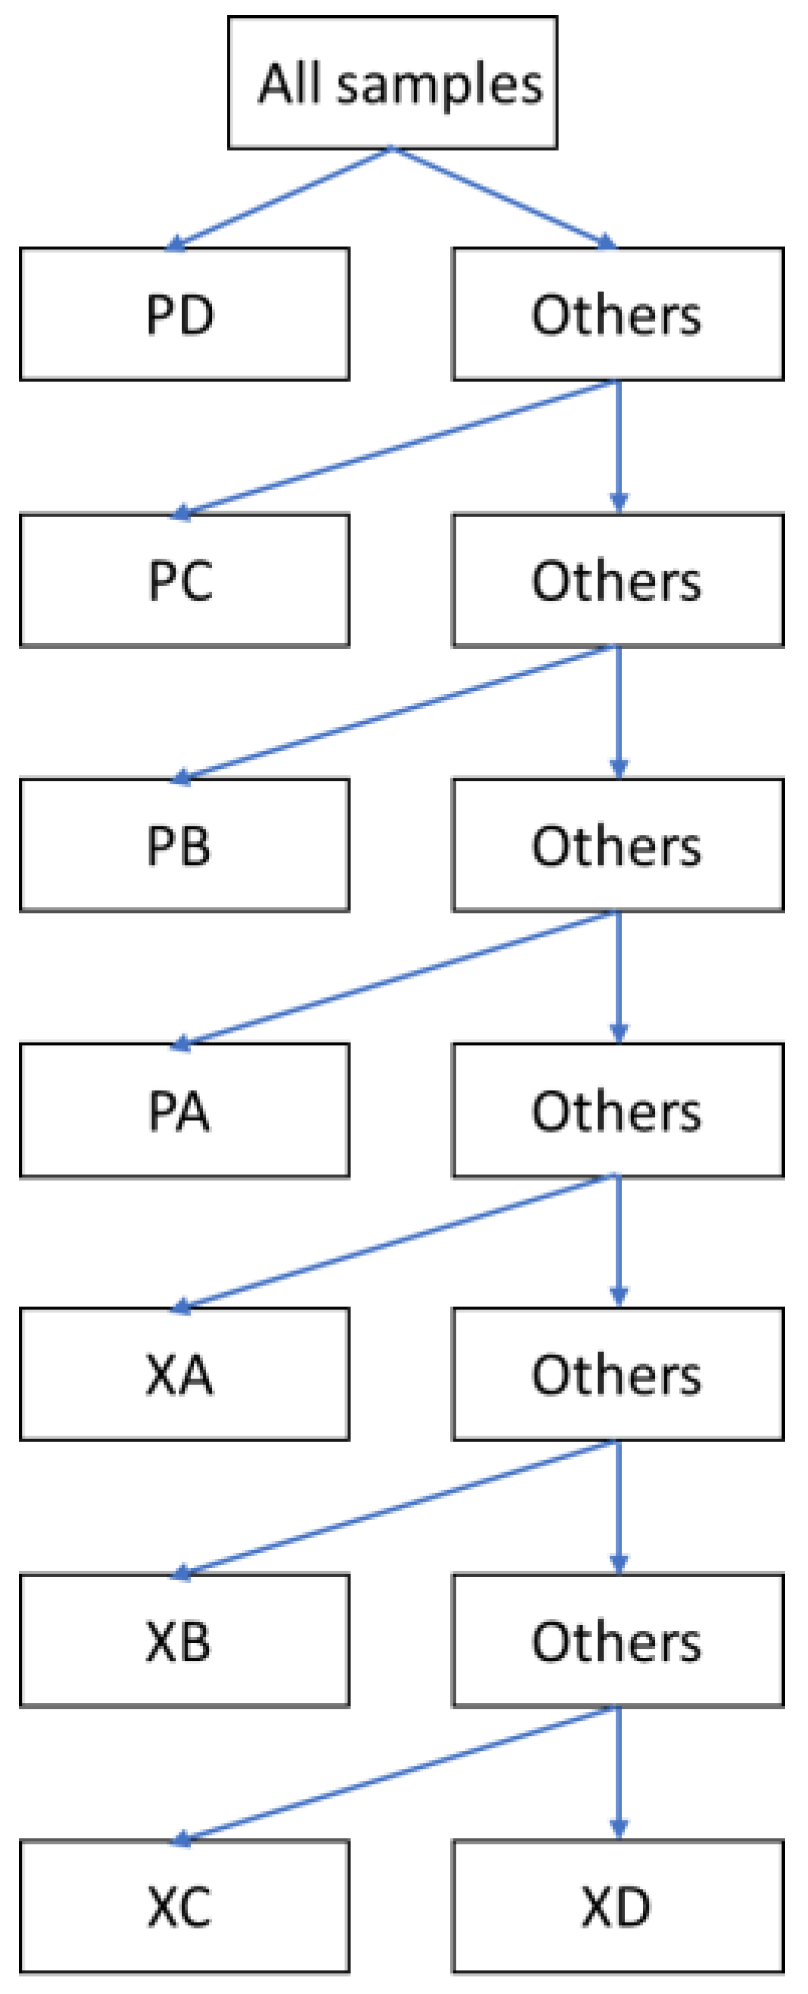
A classification tree was designed based on successive two-class PLS-DA models until all the classes were separated. The criterion for constructing such a tree relied on selecting the most different class within the set of samples and considering the other classes as a single group. Hence, two memberships were defined each time, i.e., (i) those samples belonging to the target class and (ii) those samples out of the class. Once the assignations were made, the following model was built using only the remaining out-of-class samples, so the new PLS-DA classification was created under the same considerations. The number of proper latent variables (LVs) was chosen each time by cross-validation. The classification tree process finished when the last model was built, in which only two classes remained (the most similar ones). A graphical scheme of this process is given in
Figure 6.
To assess this strategy under a realistic situation, the set of samples was divided into two subsets for calibration, which comprised 60% of samples, and prediction, with the remaining 40% of samples. Samples were assigned randomly to each submatrix.
Results from the classification tree are summarized in
Table 1 and
Figure S2. As can be seen, they are highly satisfactory, with a perfect sample assignation in most of the cases. The principal confusion occurred between xarel·lo samples of lower quality (C and D types) in both cross-validation and prediction steps. This finding was attributed to the similarities in the compositional profiles of C and D types, thus making it more difficult to establish feasible patterns for the prediction of each class. In addition, in the calibration step, a XB sample was identified as a XA; in the cross-validation, a XA sample was recognized as PA. Regarding misclassification in the prediction step, a PB sample was identified as PD. In this case, the three replicates of the same samples were wrongly classified, indicating that probably, this sample was wrongly labelled during the analysis. Overall, the strategy followed allowed us to successfully classify 89% of samples according to their variety and quality (except for samples corresponding to XC and XD: 73% if these two classes are considered). It was thus concluded that the proposed classification tree approach was recommendable for the assessment of the quality and variety of the wine samples with the only exception of xarel·lo C and D. As mentioned, their composition was highly dependent on the oenological practices, so this could be an additional factor to be introduced to try to achieve better discrimination.
As pointed out above, apart from varietal and quality discrimination, there are underlying differences associated with the type of sample that could potentially be exploited to classify products according to this feature. Unfortunately, the number of samples available for this study is limited to model and validate a classification tree considering quality, variety, and type simultaneously.


