Article

A Digital Approach to Evaluate the Effect of Berry Cell Death on Pinot Noir Wines’ Quality Traits and Sensory Profiles Using Non-Destructive Near-Infrared Spectroscopy

Digital Agriculture, Food and Wine Sciences Group, School of Agriculture and Food, Faculty of Veterinary and Agricultural Sciences, University of Melbourne, Melbourne, VIC 3010, Australia
*
Author to whom correspondence should be addressed.
Beverages 2020, 6(2), 39; https://doi.org/10.3390/beverages6020039
Submission received: 27 April 2020 / Revised: 28 May 2020 / Accepted: 5 June 2020 / Published: 9 June 2020
(This article belongs to the Special Issue Improving Wine Quality and Safety)

Abstract

:
Berry cell death (BCD) is linked to the development of flavors and aromas in berries and wine. The BCD pattern and rate within a growing season start at around 90–100 days after anthesis (DAA), and the rate until harvest depends on environmental factors. This study assessed the BCD effects on berry and wine composition from a boutique commercial vineyard in Victoria, Australia, using fluorescent imaging. Results showed differences in wine sensory profiles from the two blocks studied, mainly related to variations in BCD, due to differences in altitude between blocks. Furthermore, two machine learning (ML) models were constructed using near-infrared spectroscopy (NIR) measurements from full berries as inputs and living tissue (LT) and dead tissue (DT) from berries as targets (Model 1). Model 2 was developed using Brix, LT, DT from the east and west sides of canopies as inputs and using 19 sensory descriptors from wines as targets. High correlation and performances were achieved for both models without signs of overfitting (R = 0.94 and R = 0.80, respectively). These models could be used for decision-making purposes as an objective and comprehensive berry maturity assessment obtained in a non-destructive, accurate, and in a real-time fashion close to harvest, to secure specific wine styles.

1. Introduction

In grapevines, programmed berry cell death (BCD) is a genetically triggered process that starts at around 90–100 days after anthesis (DAA) for winemaking cultivars [1,2,3,4,5], which is close to veraison, where berry cell division stops and commences berry cell elongation. The rate of cell death throughout the remainder of the season is dependent on biotic stresses, such as increased temperatures (heat waves) and water stress [2,6], which can accelerate the process and influence berry composition and sensory perception [7]. The BCD process correlates with the berry dehydration process or shrivel; however, these two processes are not coupled [1,2,8,9,10,11,12,13], and mitigation treatments can be imposed to reduce shrivel [14] that can reduce yield up to 30% in Shiraz, as an example [15,16]. In Pinot Noir berries, the onset of ripening has also been correlated with the accumulation of hydrogen peroxide (H2O2), which could be a product of the BCD process [17]. It has been suggested that BCD could be an evolutionary trait linked to seed dispersal [18], and it has been shown that the pattern and level of cell death in Pinot Noir can reach up to 50% at harvest and is cultivar dependent [1]. This cultivar dependency may be linked to different levels of flavors and aromas developed that are characteristic of different cultivars.
Previous research linking BCD to berry quality traits, sensory profiles, and development of flavors and aroma that are later passed to wines in the winemaking process suggests that BCD may be an objective parameter to describe berry maturity [19]. However, BCD is difficult to assess, since it requires berry collection from veraison to harvest, laboratory analysis using fluorescent and non-fluorescent dyes, and the implementation of computer vision algorithms for the analysis of digital images [19]. Due to the complexity of processes and compounds generating throughout the berry development, more integrative and non-destructive methods could be applied to assess BCD and compound dynamics.
A recent body of research has been using non-destructive near-infrared spectroscopy (NIR), which can obtain a chemical fingerprint of objects and liquids through the analysis of light spectra absorbance. This technology has been coupled with machine learning (ML) modeling and analysis to obtain integrative models for food and beverages, such as chocolate, beer, wines, and cider, among others [20]. Furthermore, these techniques have also been used as an integrative approach to link the effect of seasonality on wine quality traits and aroma profiles [21], canopy architecture on cocoa bean aroma profiles [22], discrimination of grapevine cultivars from leave NIR [23], and even smoke-related compound and taint in leaves and wines due to bushfires [24].
This paper proposed a digital viticulture approach to assess the effect of BCD on berry composition and wine quality traits measured by sensory analysis. Two models were constructed based on NIR and ML modeling, which could be used as an objective measure of berry maturity based on the prediction of quality traits of final Pinot Noir wines. The methodology proposed can be applied to other grapevine cultivars of economic importance for different wine regions.

2. Materials and Methods

2.1. Vineyard and Berry Sampling Description

Samples of Pinot Noir were collected in the 2014–15 season from a 14.5 ha commercial boutique vineyard located in Romsey/Lancefield, Victoria, Australia (−37.297496° S, 144.710095° E), at an elevation of 532 m.a.s.l. The soils in this vineyard are composed of sand, silt and clay in % up to 100 cm depth of 25, 12 and 45, respectively, supporting potato and grape growing, with a bulk density of 1.35 g cm3, 15% available water content to 100 cm and depth of soil of 75 cm. More details of the boutique vineyard can be found in the study by Fuentes et al. [25]. Two blocks were selected, namely B92 (elevation 520 m.a.s.l) and B96 (elevation 545 m.a.s.l.), planted with Pinot Noir with rootstock clones MV6 in 1992, and clone D5V12 in 1996, respectively. Berries were collected from each block using three middle and adjacent rows per block. From one plant per row, two representative bunches were selected, one from the east and one from the west side of the canopy. From each bunch, two berries were collected from the top, middle, and bottom (per plant, n = 12 berries; per block, n = 36 berries; and total berries per collection date, n = 72). This collection was repeated four times every fortnight from days after anthesis (DAA) 92, 104, 112, and 117 (N = 288 berries for the experiment). These dates corresponded to the period from post-veraison (DAA92) to one day before commercial harvest (DAA117) that corresponded to the 26th of March 2015. Grapevines are irrigated using a drip irrigation system, and the canopy training system corresponds to a double cordon.
This commercial boutique winery produces wines made from 100% berries grown in their site and fermented using wild yeast from the site’s environment to produce wines with improved sensory attributes, such as mouthfeel and flavors. Bottles of 750 mL of three different wines were obtained from i) B92, ii) B96, and iii) blend of all Pinot Noir blocks (6 blocks).

2.2. Living and Dead Mesocarp Tissue Assessment—Berries

2.2.1. Berry Analysis

The berries were cut in two longitudinal sections along the middle of the pericarp at the maximum diameter, using a sharp blade. One section was used to extract juice to measure total soluble solids (TSS; Brix), using a temperature-compensated digital refractometer (Model PR101; ATAGO, Tokyo, Japan). The osmolality was calculated using relationships published from a previous calibration of TSS versus osmolality [1]. The other half sections of the berries were stained with fluorescein diacetate (FDA) and viewed under a fluorescent microscope. Stock solutions of FDA dissolved in acetone (4.8 mM) were freshly prepared after berry collection and maintained on ice. Sucrose solutions were prepared corresponding to the TSS of the berries. FDA stock was added into the sucrose solutions to a final concentration of 0.1%. This solution was applied to the intact half section of each berry until a maximum concave meniscus was formed. After 30–60 min incubation in FDA, excess solution was blotted and the berries were positioned under a fluorescent dissecting microscope (Leica DMC2900, Leica, Wetzlar, Germany), set at minimum magnification (1.0 X objective lens), under high-intensity light beam supplied by Leica EL6000 compact light source (Leica, Wetzlar, Germany), filtered with a green fluorescent protein (GFP) filter (excitation filter 425/60 n (395–455 nm; barrier filter 480 LP). Images were obtained using a Leica M205 FA camera (Leica, Wetzlar, Germany), with the Leica Application Suite (LAS) software (Leica, Wetzlar, Germany), using the same gain and exposure settings for all images.

2.2.2. Analysis of Berry Tissue Vitality MATLAB® Code Improvement

A new computer script was developed using MATLAB® R2020a, and the Image Analysis Toolbox™, which was based on previous codes developed [1], to analyze fluorescent digital images of sliced berries stained with FDA to detect: berry morphometrics and living tissue (LT) and dead tissue (DT) as a percentage (%). For this study, only vitality and dead tissue data were used. The code uses computer vision algorithms to detect the berry and binarize fluorescent images (Figure 1). The detection system recognizes the berry automatically to align the brush portion of the berry that attaches to the pedicel (Figure 1A). Automatic recognition of berry vitality as binarization of the intensity image can be modified to incorporate whole-cell sections of living tissue (Figure 1B–D). From the automatic berry recognition, a whole binarized berry is extracted and considered as 100% of the berry surface (Figure 1E). An inverted binary image is extracted from Figure 1D to obtain berry cell death patterns (Figure 1F). Berry living tissue (LT) and cell death (DT) are calculated by comparing Figure 1D and Figure 1F against Figure 1E, respectively.

2.3. Near-Infrared Spectroscopy—Berries

Whole berries were measured before undergoing the FDA stain procedure previously described, using a near-infrared spectroscopy (NIR) handheld device (microPHAZIR™ RX Analyzer, Thermo Fisher Scientific, Waltham, MA, USA). This device has a tungsten light bulb and a 5 mm measuring region [26] and analyzes the light absorbance within the 1598–2396 nm range every 7–9 nm and was calibrated using a white background, which is required at the start and for every 15 readings. All samples were measured at room temperature (20–24 °C). For plotting purposes and to enhance the peaks, data were transformed into the first derivative using the Savitzky–Golay function in Unscrambler X ver. 10.3 software (CAMO Software, Oslo, Norway; [27,28]). Three NIR samples per berry were obtained in the laboratory for 72 berries per four dates in the experiment (n = 432 NIR).

2.4. Descriptive Sensory Evaluation—Wines

A sensory session was conducted with 12 trained panelists (females; 25–35 years old) from staff and graduate students at The University of Melbourne (Ethics ID: 1545786.2), using the quantitative descriptive analysis method (QDA®). All panelists were regular/social wine consumers and trained specifically for red wine tasting. The session was conducted in the sensory laboratory at The University of Melbourne, which consists of individual booths equipped with Android (Google, Mountain View, CA, USA) tablets. The serving size of the samples was 30 mL, and they were poured in standard wine tasting glasses at ~ 20 °C. Furthermore, plain water and water crackers were provided as palate cleansers between samples. The questionnaire was displayed in the tablets using the Bio-Sensory App (The University of Melbourne, Parkville, Vic, Australia) [29]; the descriptors (Table 1) were rated using a 15-cm non-structured scale.

2.5. Statistical Analysis and Machine Learning Modeling

An ANOVA was conducted for all data using SAS® 9.4 software (SAS Institute Inc., Cary, NC USA) to assess significant differences among the different blocks. Fisher’s least significant difference (LSD; α = 0.05) was used as a post-hoc test for pairwise comparisons.
Two machine learning (ML) regression models were developed with artificial neural networks (ANN), using a Matlab® R2020a (Mathworks Inc., Natick, MA, USA) customized code, to evaluate 17 different supervised training algorithms to find the most accurate models and with the highest performance. Model 1 was developed using the NIR absorbance values of berries within the 1598–2396 nm range, as inputs to predict the percentage of living and dead tissue. The total n = 432 NIR berry measurements x 2 was used for machine learning modeling since the same readings were considered for the LT and DT targets (n = 864). After outlier analysis using the Unscrambler, the total number of samples used for modeling was n = 858. On the other hand, Model 2 was constructed using Brix, living, and dead tissue from berries collected from east and west, as inputs to predict the intensity of 19 sensory descriptors of wine (Table 1). The total number of samples for Model 2 used a total of 6 rows with averaged measurements for low, middle, and high samples from two bunches per row (n = 36) in the four dates of the experiment and 19 targets with a total n = 2736 (Table 2).
For both models, data were divided randomly using 70% of the samples for training with the Levenberg–Marquardt algorithm, 15% for validation with a means squared error (MSE) performance algorithm, and 15% for testing with a default derivative function. Both were developed using 10 neurons, which provided the best models, with no overfitting. Figure 2 shows the model diagram of the two-layer feedforward models with tan-sigmoid function in the hidden layer and linear transfer function in the output layer.

3. Results

3.1. LT and Brix Patterns through the Season

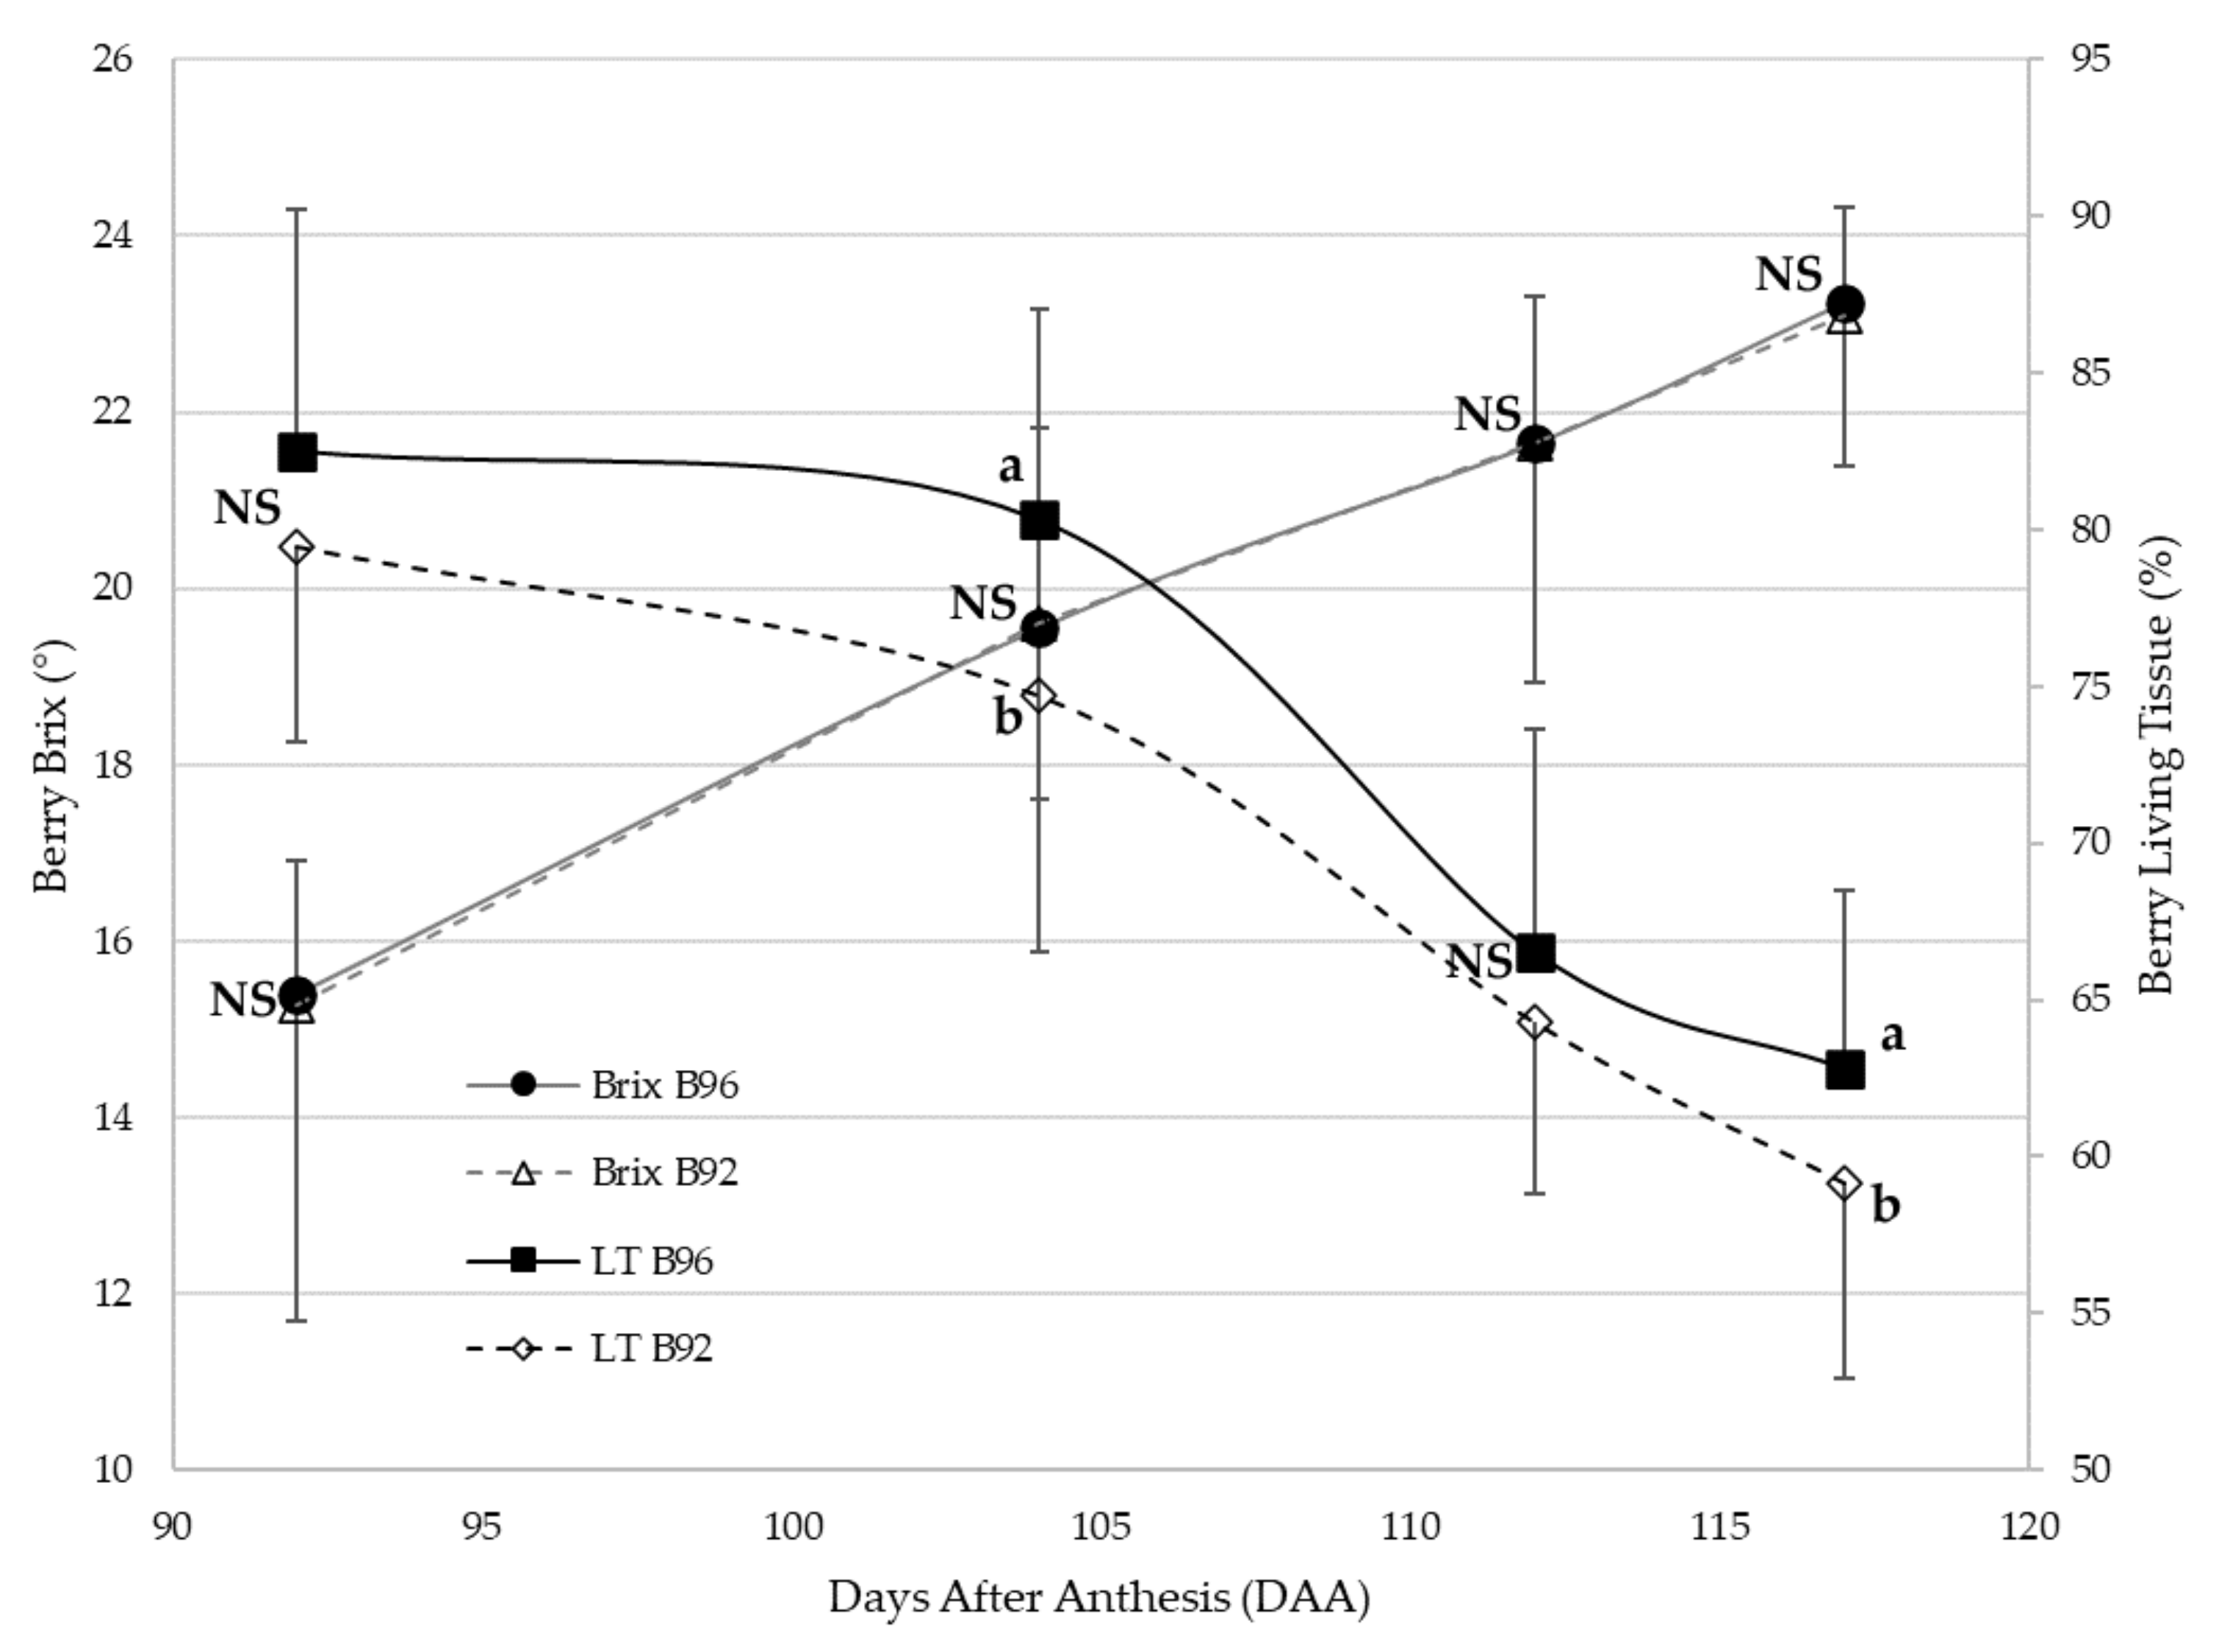
Figure 3 shows the progression of sugar accumulation (Brix) and LT for the two blocks studied from DAA92 to DAA 117 (before harvest). There were non-significant differences in Brix from berries between blocks (B92 and B96) for the studied period, which started from 15.4 Brix, finishing at 23.3 Brix. However, lower variations (SD = 1.60 Brix) between berry samples were found for B96 compared to B92 (SD = 2.51 Brix). In the case of LT, this parameter decreased from an averaged 81% down to 61% at harvest, with significant differences between blocks at DAA104 and harvest (DAA117).

3.2. Near-Infrared Spectroscopy

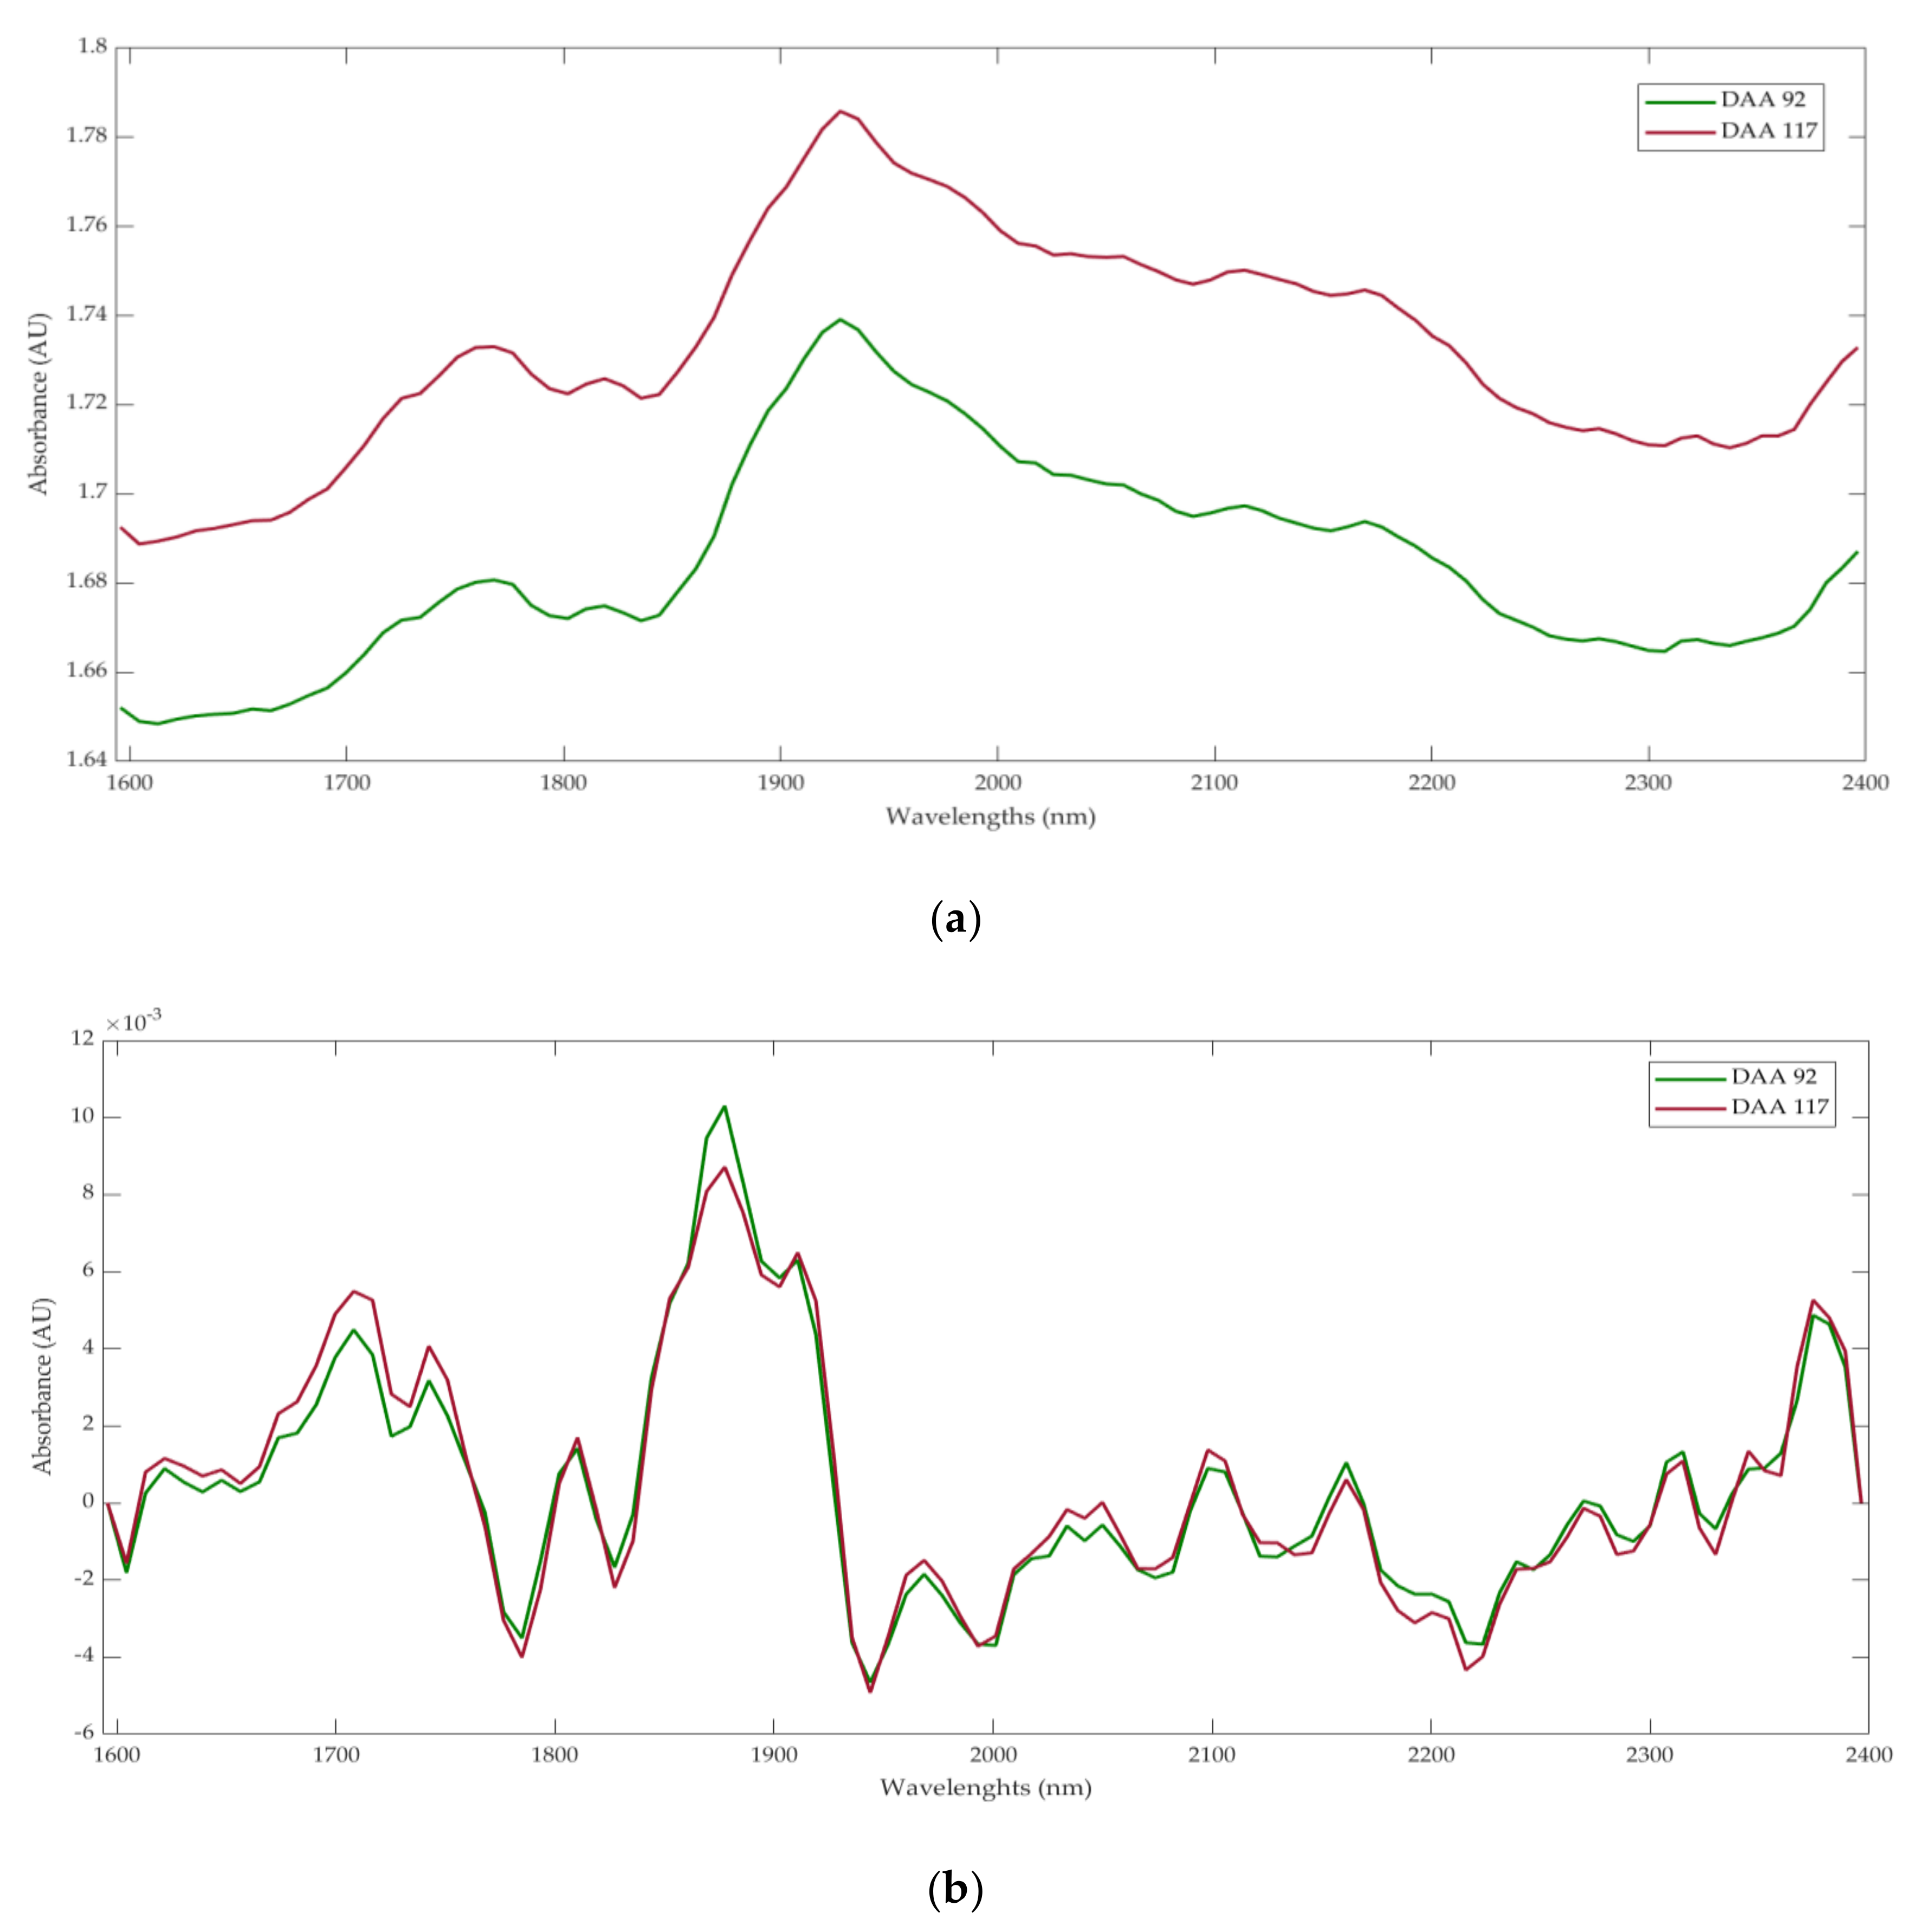
Figure 4 shows the NIR curves using the raw absorbance values (Figure 4a) and first derivative transformation (Figure 4b), from the berries at DAA 92 and DAA 117. In both graphs, overtones corresponding to H2O2 between 1596–1650 nm (grey rectangle) [27] and H2O [28] between 1790 and 1940 nm (grey dotted rectangles) can be observed. Furthermore, in general, in Figure 4b, enhanced peaks and valleys can be seen in the 1600–1800 nm range.

3.3. Descriptive Sensory Evaluation

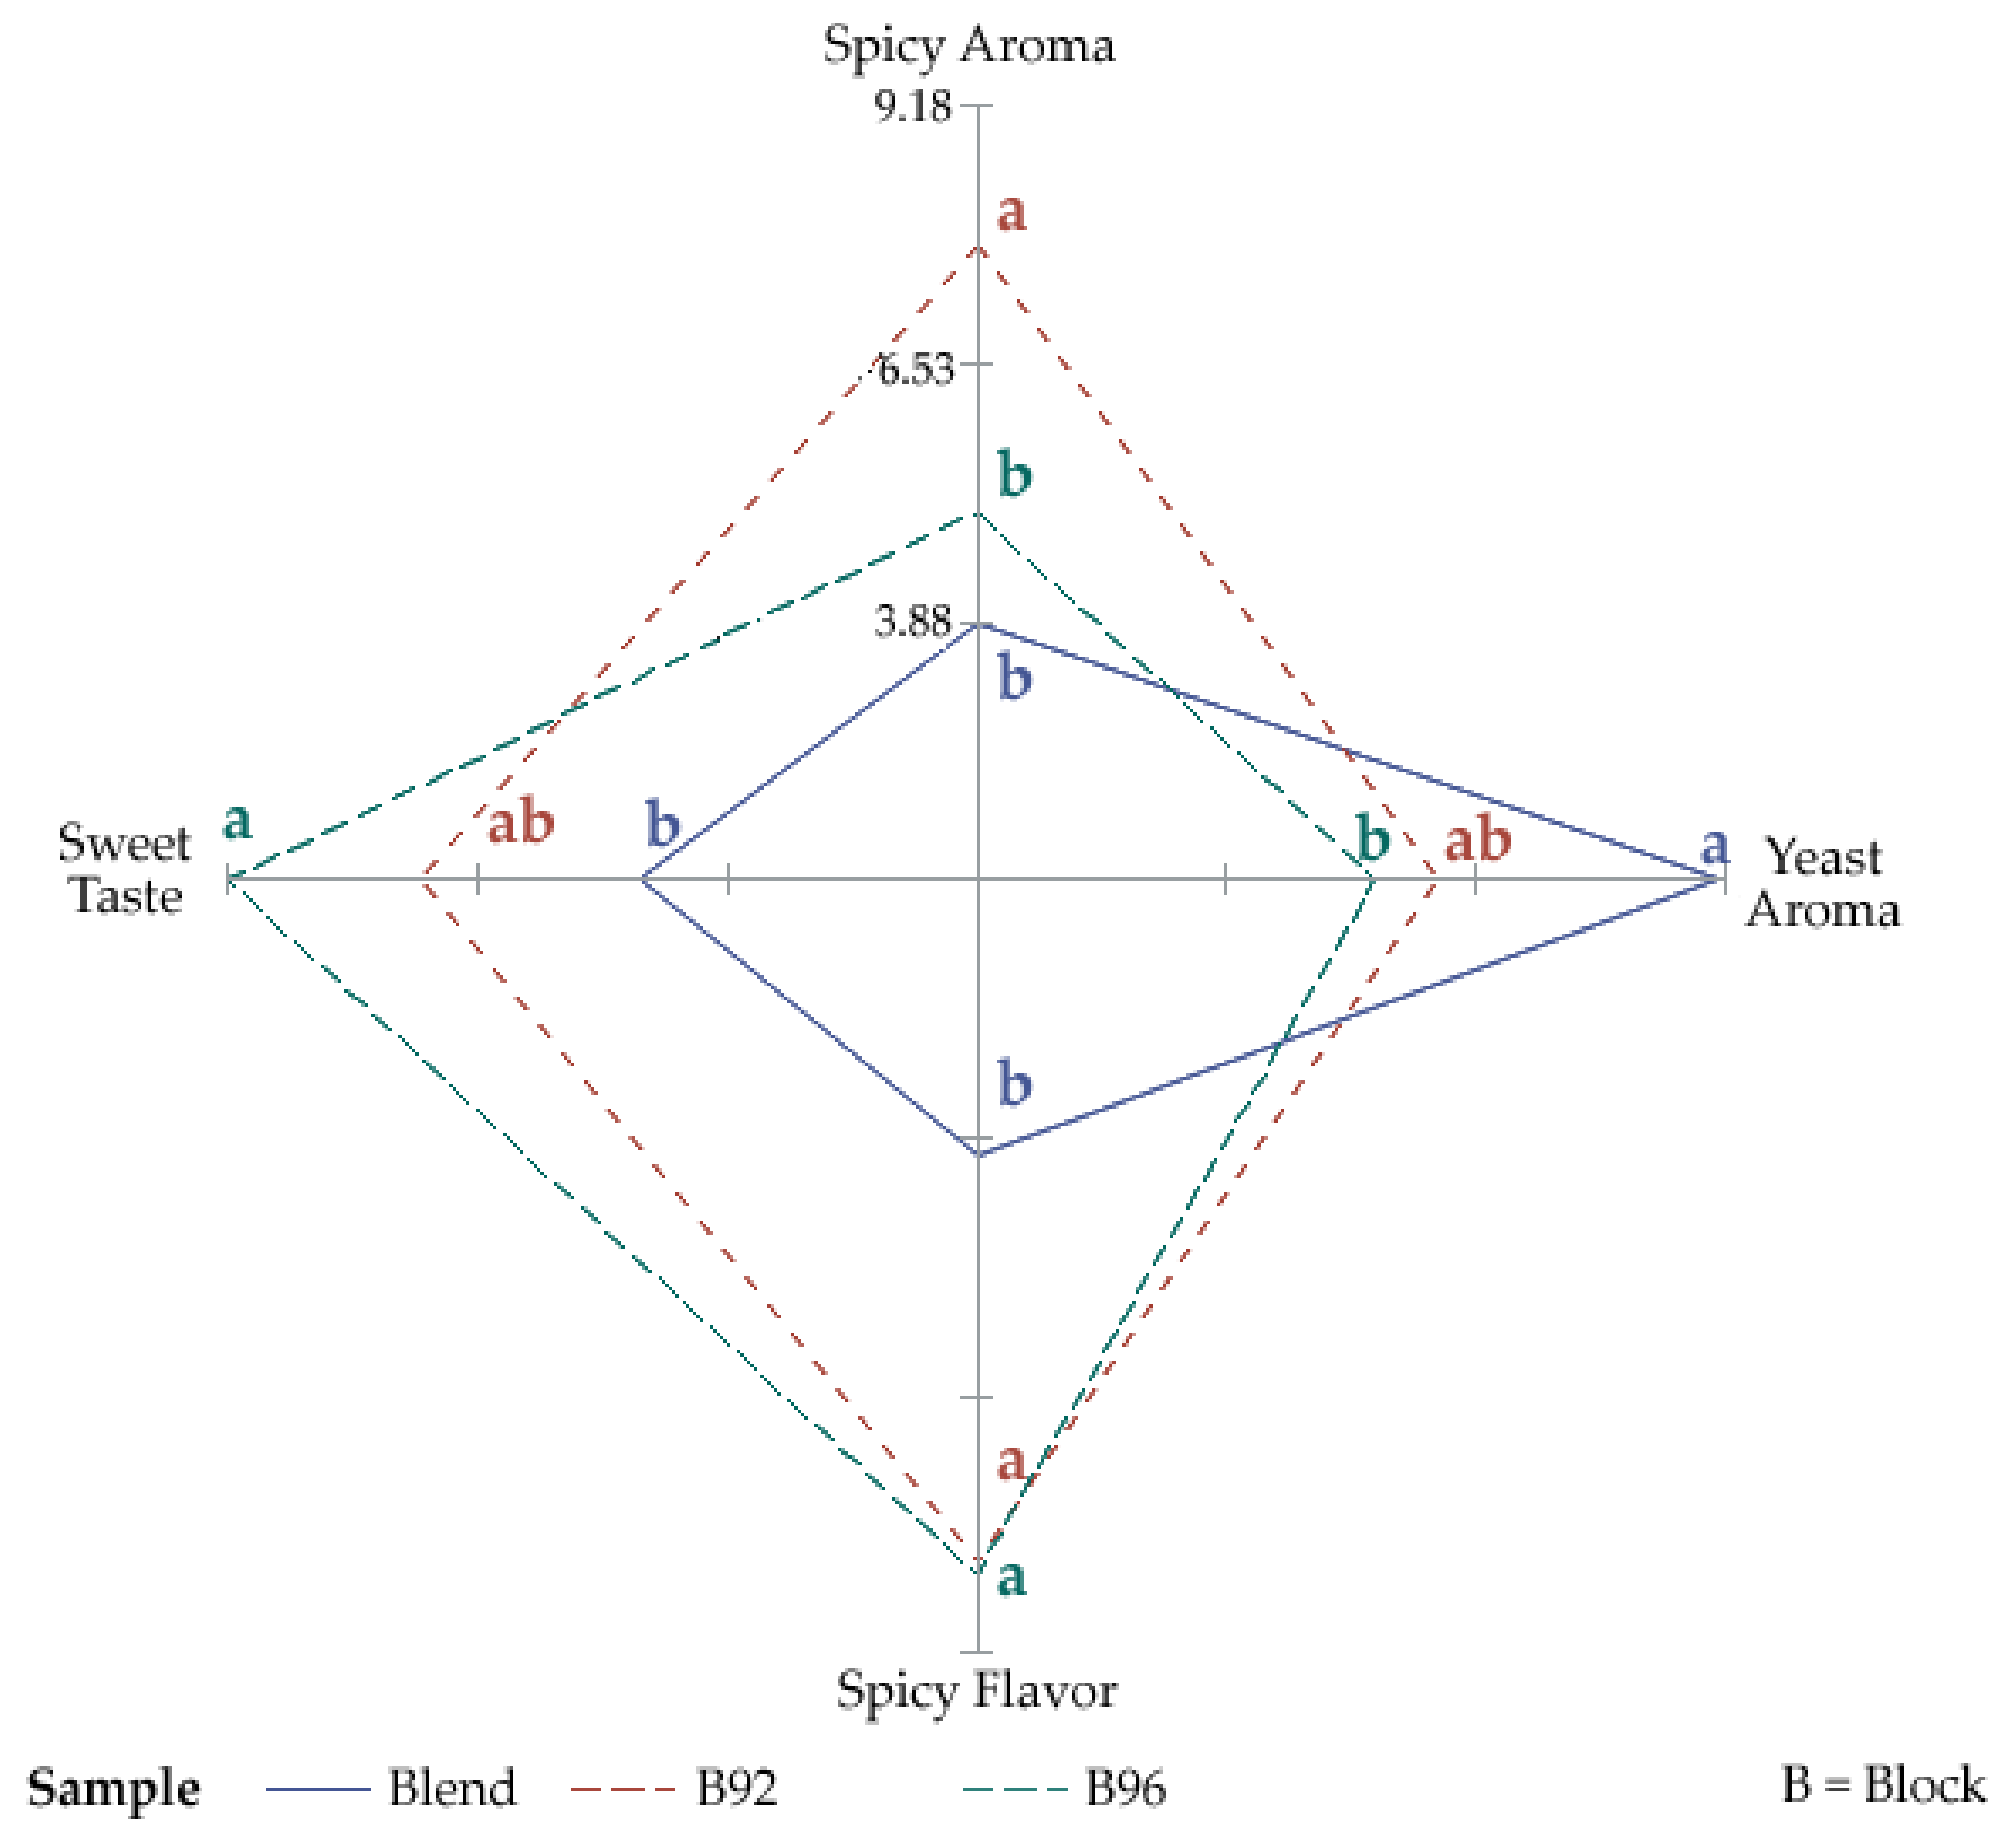
Figure 5 shows the spider chart with pairwise comparisons of the sensory descriptors, with significant differences according to the ANOVA and LSD test. Wine from B92 was significantly different to B96 and the Blend for ASpicy (B92 = 7.74; B96 = 5.00; Blend = 3.88). Meanwhile, both blocks had significant differences in FSpicy (B92 = 8.24; B96 = 8.36) compared to the Blend (4.05). In TSweet, B96 (9.18) was statistically different from the Blend (4.80), but both were similar to B92 (7.14). The Blend wine was the highest in AYeast (9.13) and was different from B96 (5.46). On the other hand, all other descriptors did not present significant differences between samples.

3.4. Machine Learning Models

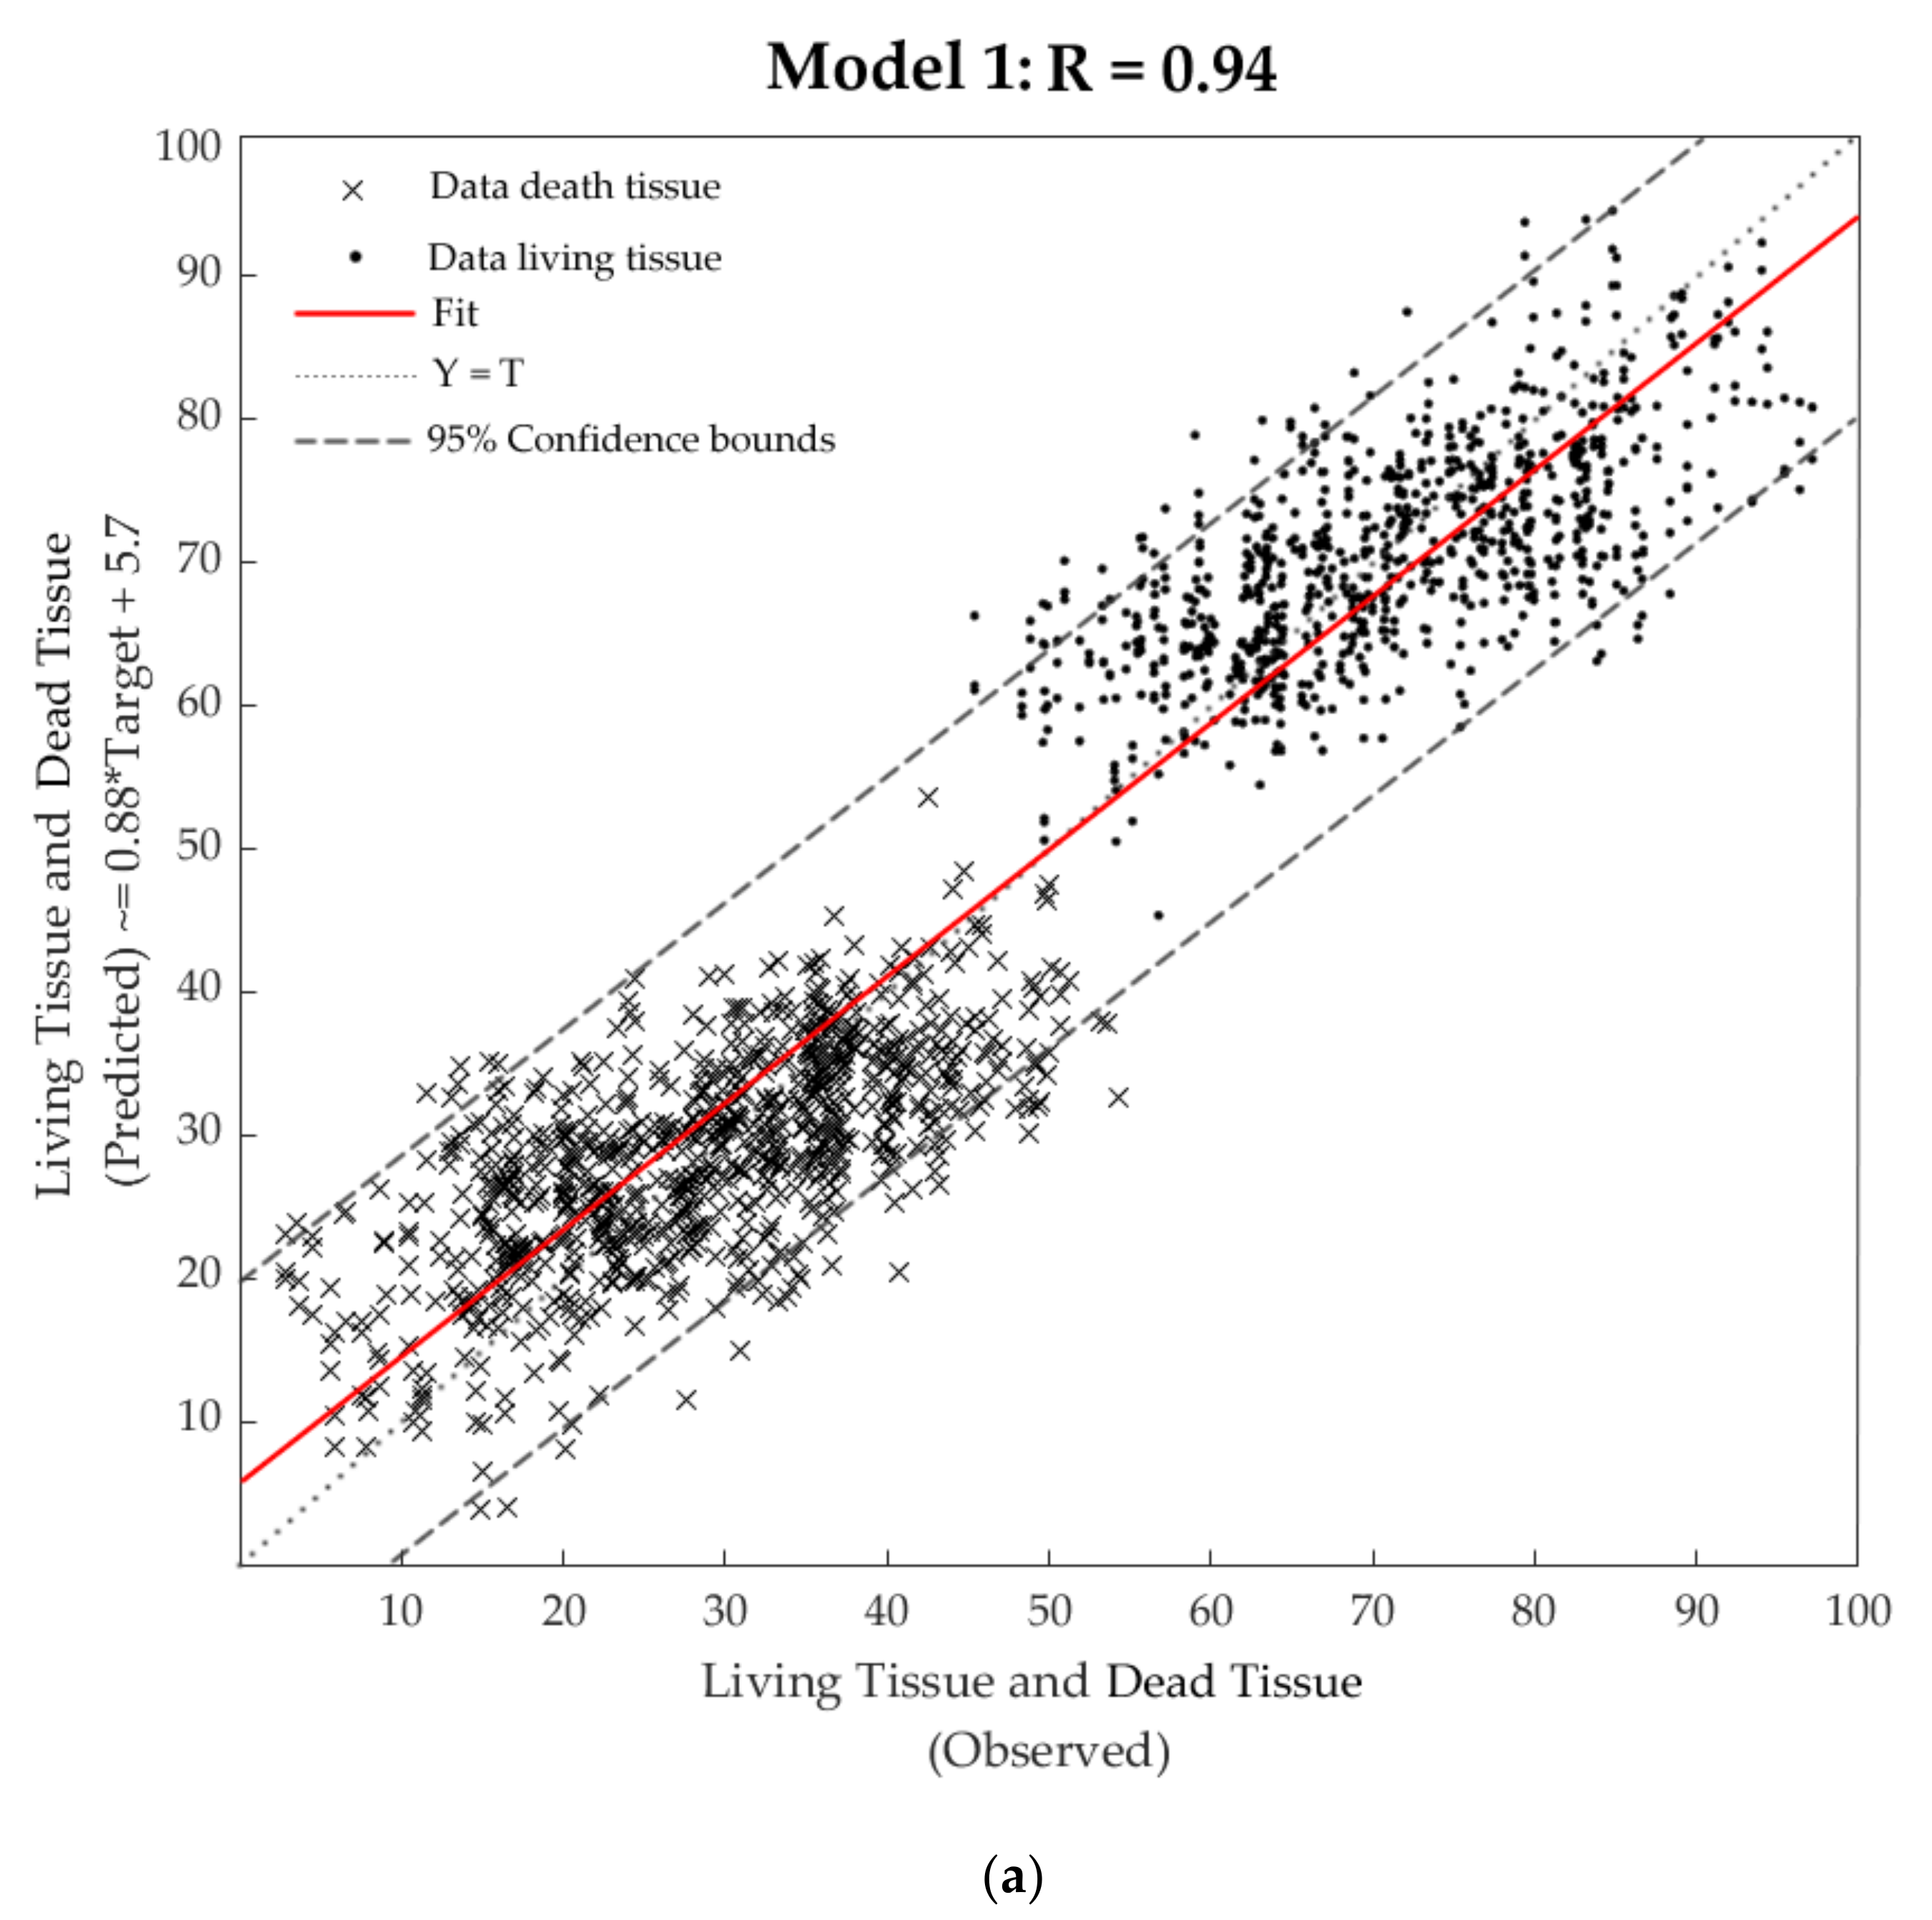
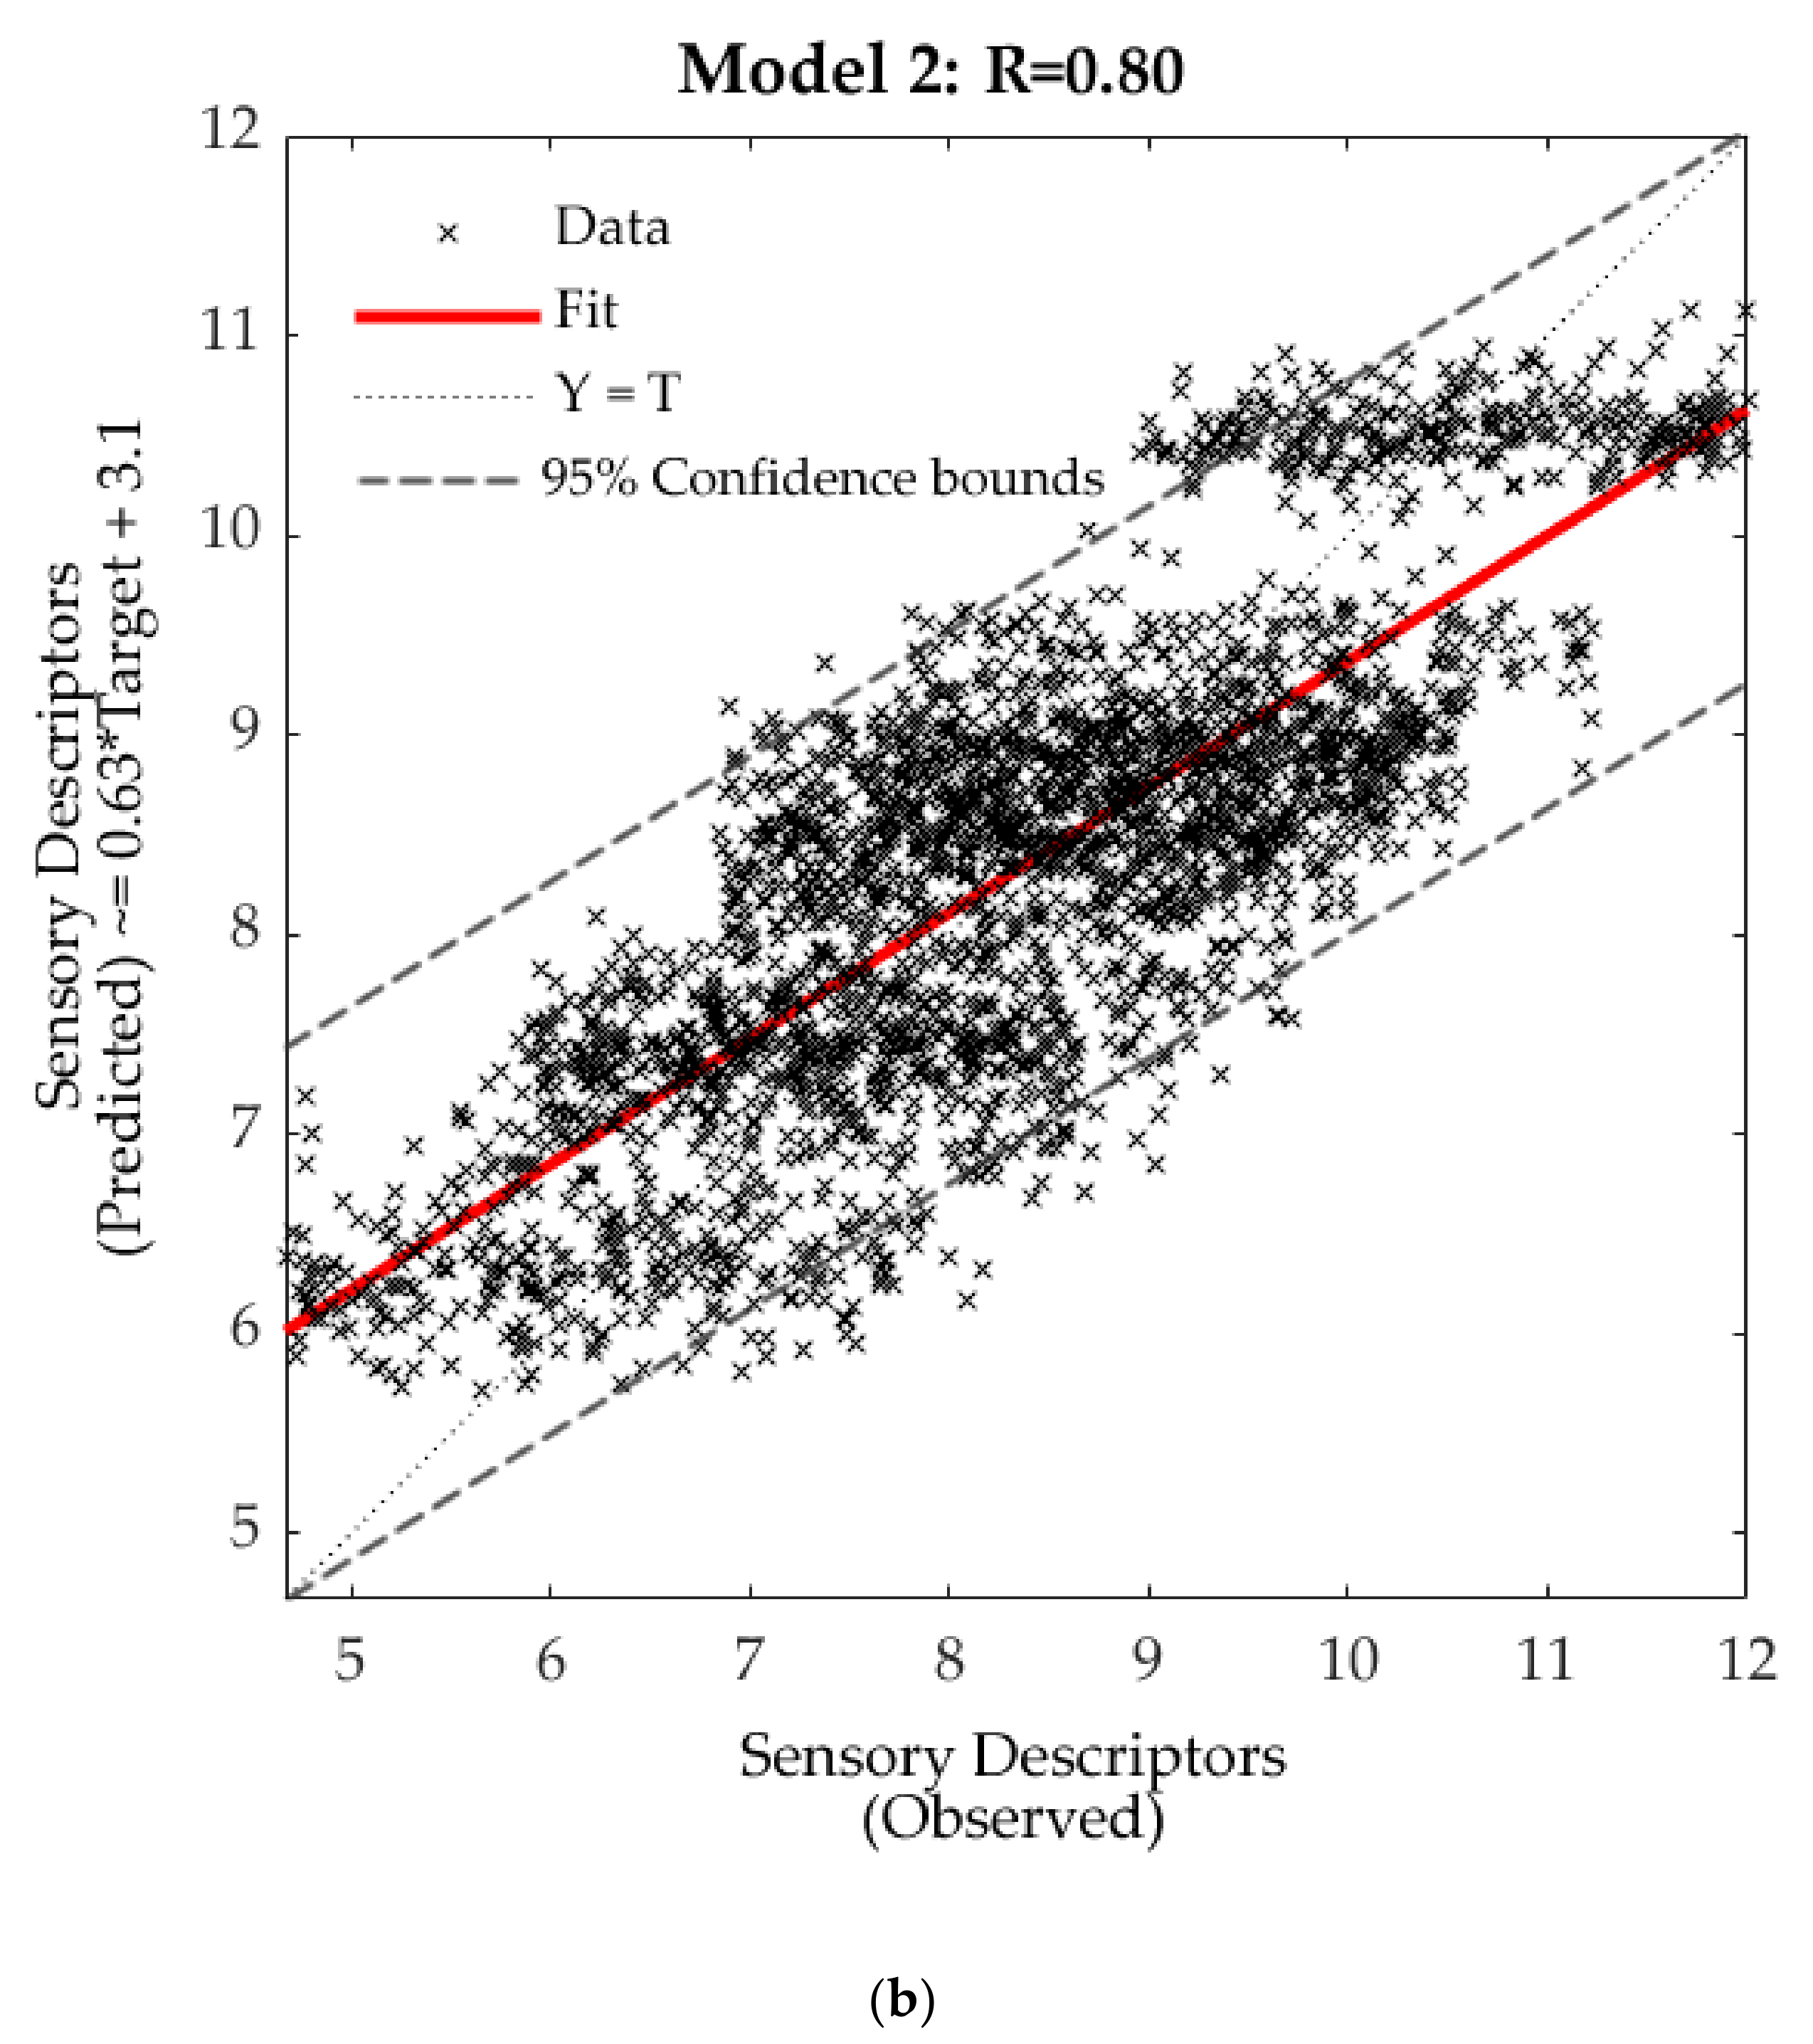
Table 2 shows the results of the ML models; it can be observed that Model 1 had a very high overall accuracy based on the correlation coefficient (R = 0.94). The similar accuracy between training and validation stages (R = 0.95 and R = 0.93, respectively), along with the lower performance (MSE = 56) of the training stage compared to validation (MSE = 71) and testing (MSE = 81), show that there were no signs of overfitting. Model 2 presented a moderate-high overall accuracy (R = 0.80). Similar to Model 1, it did not present signs of overfitting, as the training and validation R values were the same (R = 0.81), and the testing performance (MSE = 0.76) was lower than validation (MSE = 0.83) and testing (MSE = 0.99).
Figure 6a shows the overall Model 1 displaying the living tissue (•) and dead tissue (×) data points and the 95% confidence bounds. Based on the latter, there were 4.96% outliers (85 out of 1716). On the other hand, Figure 6b shows the overall Model 2 with 5.01% of outliers (137 out of 2736), according to the 95% confidence bounds.

4. Discussion

4.1. Berry LT and Brix Dynamics

Berry LT for Pinot Noir grapes started from an average of 80%, finishing at harvest at an average of 61%. This LT progression coincides with previous studies for final LT in Pinot Noir from Adelaide, Australia, reaching 50% at harvest [1]. The seasonal LT decline coincides with previous research for Shiraz and Chardonnay [6,7,30].
A trend of higher LT is consistently seen in Figure 3 for B96 compared to B92. These two blocks have a difference in altitude of 25 m, with B96 at higher altitudes. From temperature sensors located in these two blocks (data not shown), and through anecdotal evidence from the vineyard manager and viticulturist, B92 has consistently lower temperatures than B96. Furthermore, the accelerated slope of LT observed in B92 and B96 between DAA104 and 112 corresponded to consistent air temperatures between 28 and 30 °C. The average temperature for the whole month was 25.0 °C; hence, it can be considered as a warm period compared to normal temperatures for that month. This effect in LT is in accordance with studies of the effect of higher temperatures on BCD, which accelerates DT in berries [6,7].
The altitude difference between B92 and B96 did not significantly affect Brix (Figure 3). The reduced variability in Brix accumulation in the season of B92 compared to B96 is consistent with previous studies with control and heated treatments for Shiraz and Cabernet Franc [31].
Berry cell death in winemaking cultivars may have been inadvertently selected from ancient times by the effect on the development of flavor and aroma. This can be supported by the evidence of minimal BCD found in table grapes at harvest, in which berries are required to be crunchier, firm, sweet, and juicy for fresh consumption [1]. These berry characteristics are related to the integrity of mesocarp cellular membranes.

4.2. Wine Sensory Profiles

From wine sensory descriptors assessed (Table 1), spicy and yeast aromas, and spicy flavor and sweet taste were significantly different (Figure 5). A spicy aroma is related to sesquiterpene production in berries, specifically to rotundone concentration, which is associated with the “peppery” aroma in final wines [32]. Higher rotundone concentrations are found in vineyards located in cooler areas [33], which is consistent with the higher and significant score for spicy aromas found in wines from B92, compared to B96 (Figure 5). A trend of higher sweet taste was found for wines from B96 compared to B92, which can be associated with higher residual sugar after fermentation. This may be linked with higher sugar variability found in berries from the same block (Figure 3). The blended wine was significantly different from wines from B96 and B92, and this can be attributed to the mix of other blocks planted in 1993, 1995, 1997, and 1998, which may have contributed to higher variations in these descriptors. Finally, B92 was perceived with a lower sweet taste, which could be attributed to less residual sugar and higher yeast activity in the fermentation process, leaving more lees that contribute to the yeast aroma. This is supported by the alcohol content found in the same wines of 14.1 for wines produces from B92 and 13.7 for wines from B96 and 14.2 for the Blend, measured using an Alcolyzer Wine M alcohol meter (Anton Paar GmbH, GRAZ, Austria), with a precision of < 0.1% v v−1.

4.3. Machine Learning Modeling for LT and Sensory Descriptors

Differences in absorbances found on overtones for H2O2 and H2O for DAA92 compared to DAA117 are consistent with expected progressions in time of these two compounds (Figure 4). DAA117 (harvest) had a higher absorbance for H2O2, which is consistent with higher DT. These results make the NIR modeling strategy consistent with variations targeted in this paper related to berries LT, DT (Model 1), and the sensory profile of final wines (Model 2).
The NIR instrument measuring whole berries may have a penetration of a few millimeters, with the signal penetrating LT and DT (Figure 1A,D,E). Hence, incorporating DT and LT as targets in Model 1 makes it more robust, as can be seen from the R values (R = 0.94; slope = 0.88) obtained and the performances for its construction. In the case of Model 2, even though the R-value and performances are very acceptable, the dispersion of data is higher compared to Model 1. This can be attributed to the actual targets considered, which are based on a sensory panel. Even though the panel was trained according to the QDA® method, human perception has a degree of subjectivity when processing aromas and tastes, due to the possible interference of feelings and acceptability of each panelist [34,35]. Furthermore, Model 2 may increase accuracy by adding other inputs related to winemaking that contribute to attributes such as oak and yeast aromas and flavors. Additionally, for the Model 2 presented in this study, those descriptors may be silenced in the deployment stage, without affecting the overall accuracy.

5. Conclusions

From the results obtained in this research, it can be seen that a digital approach incorporating non-invasive assessments of berries and machine learning modeling was effective in the assessment of dynamics of LT and DT of Pinot Noir grapes. These techniques could offer powerful tools to winegrowers and winemakers to implement management strategies to manipulate LT within the season, to achieve specific wine quality traits and to maintain wine styles. It is expected that this study will encourage further research, incorporating different wine regions and cultivars to obtain a more objective characterization of the effects of weather and seasonality on berry composition and the quality traits of final wines. The rapid and accurate assessment of DT and the implementation of ML models developed could result in a new and more objective berry maturity assessment linked directly to final wines.

Author Contributions

Conceptualization, S.F. and C.G.V.; Data curation, S.F.; Formal analysis, S.F. and C.G.V.; Investigation, S.F., E.T., J.C., and C.G.V.; Methodology, S.F., E.T., and J.C.; Software, S.F.; Validation, S.F., and C.G.V.; Visualization, S.F. and C.G.V.; Writing—original draft, S.F. and C.G.V.; Writing—review and editing, E.T. All authors have read and agreed to the published version of the manuscript.

Funding

This research received no external funding.

Conflicts of Interest

The authors declare no conflict of interest.

References

  1. Fuentes, S.; Sullivan, W.; Tilbrook, J.; Tyerman, S. A novel analysis of grapevine berry tissue demonstrates a variety-dependent correlation between tissue vitality and berry shrivel. Aust. J. Grape Wine Res. 2010, 16, 327–336. [Google Scholar] [CrossRef]
  2. Tilbrook, J.; Tyerman, S.D. Cell death in grape berries: Varietal differences linked to xylem pressure and berry weight loss. Funct. Plant Biol. 2008, 35, 173–184. [Google Scholar] [CrossRef] [Green Version]
  3. Xiao, Z.; Rogiers, S.; Sadras, V.; Tyerman, S. Hypoxia in the grape berry linked to mesocarp cell death: The role of seed respiration and lenticels on the berry pedicel. bioRxiv 2017, 209890. [Google Scholar] [CrossRef] [Green Version]
  4. Clarke, S.J.; Rogiers, S.Y. The role of fruit exposure in the late season decline of grape berry mesocarp cell vitality. Plant Physiol. Biochem. 2019, 135, 69–76. [Google Scholar] [CrossRef]
  5. Krasnow, M.; Matthews, M.; Shackel, K. Evidence for substantial maintenance of membrane integrity and cell viability in normally developing grape (vitis vinifera l.) berries throughout development. J. Exp. Bot. 2008, 59, 849–859. [Google Scholar] [CrossRef] [PubMed] [Green Version]
  6. Bonada, M.; Sadras, V.O.; Fuentes, S. Effect of elevated temperature on the onset and rate of mesocarp cell death in berries of shiraz and chardonnay and its relationship with berry shrivel. Aust. J. Grape Wine Res. 2013, 19, 87–94. [Google Scholar] [CrossRef]
  7. Bonada, M.; Sadras, V.; Moran, M.; Fuentes, S. Elevated temperature and water stress accelerate mesocarp cell death and shrivelling, and decouple sensory traits in shiraz berries. Irrig. Sci. 2013, 31, 1317–1331. [Google Scholar] [CrossRef]
  8. Bondada, B.; Keller, M. Morphoanatomical symptomatology and osmotic behavior of grape berry shrivel. J. Am. Soc. Hortic. Sci. 2012, 137, 20–30. [Google Scholar] [CrossRef]
  9. Keller, M.; Shrestha, P.M.; Hall, G.E.; Bondada, B.R.; Davenport, J.R. Arrested sugar accumulation and altered organic acid metabolism in grape berries affected by berry shrivel syndrome. Am. J. Enol. Vit. 2016, 67, 398–406. [Google Scholar] [CrossRef]
  10. Tilbrook, J.; Tyerman, S.D. Hydraulic connection of grape berries to the vine: Varietal differences in water conductance into and out of berries, and potential for backflow. Funct. Plant Biol. 2009, 36, 541–550. [Google Scholar] [CrossRef]
  11. Griesser, M.; Martinez, S.C.; Weidinger, M.L.; Kandler, W.; Forneck, A. Challenging the potassium deficiency hypothesis for induction of the ripening disorder berry shrivel in grapevine. Sci. Hortic. 2017, 216, 141–147. [Google Scholar] [CrossRef]
  12. Rogiers, S.Y.; Holzapfel, B.P. The plasticity of berry shrivelling in ‘shiraz’: A vineyard survey. Vitis-J. Grapevine Res. 2015, 54, 1–8. [Google Scholar]
  13. Krasnow, M.; Matthews, M.; Smith, R.; Benz, J.; Weber, E.; Shackel, K. Distinctive symptoms differentiate four common types of berry shrivel disorder in grape. Calif. Agric. 2010, 64, 155–159. [Google Scholar] [CrossRef]
  14. Caravia Bayer, L. Heat Wave Mitigation Strategies for Wine Grape Production and Measures of the Impact of Heat on Berry Ripening and Wine Composition; University of Adelaide, School of Agriculture, Food and Wine: Adelaide, SA, Australia, 2016. [Google Scholar]
  15. Tyerman, S.D.; Fuentes, S.; Collins, C.; Bastian, S. Is the Shiraz berry the biggest loser? Grapegrow. Winemak. 2012, 583, 42–44. [Google Scholar]
  16. Xiao, Z.; Liao, S.; Rogiers, S.; Sadras, V.O.; Tyerman, S. Effect of water stress and elevated temperature on hypoxia and cell death in the mesocarp of Shiraz berries. Aust. J. Grape Wine Res. 2018, 24, 487–497. [Google Scholar] [CrossRef]
  17. Pilati, S.; Brazzale, D.; Guella, G.; Milli, A.; Ruberti, C.; Biasioli, F.; Zottini, M.; Moser, C. The onset of grapevine berry ripening is characterized by ROS accumulation and lipoxygenase-mediated membrane peroxidation in the skin. BMC Plant Biol. 2014, 14, 87. [Google Scholar] [CrossRef] [Green Version]
  18. Hardie, W.J.; O’Brien, T.P.; Jaudzems, V.G. Morphology, anatomy and development of the pericarp after anthesis in grape, Vitis vinifera L. Aust. J. Grape Wine Res. 1996, 2, 97–142. [Google Scholar] [CrossRef]
  19. Bonada, M. The impact of Water Deficit and High Temperature on Berry Biophysical Traits and Berry and Wine Chemical and Sensory Traits. Ph.D. Thesis, University of Adelaide, School of Agriculture, Food and Wine, Adelaide, SA, Australia, 2014. [Google Scholar]
  20. Gonzalez Viejo, C.; Torrico, D.D.; Dunshea, F.R.; Fuentes, S. Emerging technologies based on artificial intelligence to assess the quality and consumer preference of beverages. Beverages 2019, 5, 62. [Google Scholar] [CrossRef] [Green Version]
  21. Fuentes, S.; Gonzalez Viejo, C.; Wang, X.; Torrico, D.D. Aroma and quality assessment for vertical vintages using machine learning modelling based on weather and management information. In Proceedings of the 21st Giesco, Thessaloniki, Greece, 23–28 June 2019; pp. 23–28. [Google Scholar]
  22. Fuentes, S.; Chacon, G.; Torrico, D.D.; Zarate, A.; Gonzalez Viejo, C. Spatial variability of aroma profiles of cocoa trees obtained through computer vision and machine learning modelling: A cover photography and high spatial remote sensing application. Sensors 2019, 19, 3054. [Google Scholar] [CrossRef] [Green Version]
  23. Fuentes, S.; Hernández-Montes, E.; Escalona, J.M.; Bota, J.; Gonzalez Viejo, C.; Poblete-Echeverría, C.; Tongson, E.; Medrano, H. Automated grapevine cultivar classification and water stress assessment based on machine learning using leaf morpho-colorimetry, fractal dimension and near-infrared spectroscopy. Comput. Electron. Agric. 2018, 151, 311–318. [Google Scholar] [CrossRef]
  24. Fuentes, S.; Tongson, E.J.; De Bei, R.; Gonzalez Viejo, C.; Ristic, R.; Tyerman, S.; Wilkinson, K. Non-invasive tools to detect smoke contamination in grapevine canopies, berries and wine: A remote sensing and machine learning modeling approach. Sensors 2019, 19, 3335. [Google Scholar] [CrossRef] [PubMed] [Green Version]
  25. Fuentes, S.; Tongson, E.; Torrico, D.D.; Gonzalez Viejo, C. Modeling pinot noir aroma profiles based on weather and water management information using machine learning algorithms: A vertical vintage analysis using artificial intelligence. Foods 2020, 9, 33. [Google Scholar] [CrossRef] [PubMed] [Green Version]
  26. Gonzalez Viejo, C.; Fuentes, S.; Torrico, D.; Howell, K.; Dunshea, F.R. Assessment of beer quality based on foamability and chemical composition using computer vision algorithms, near infrared spectroscopy and machine learning algorithms. J. Sci. Food Agric. 2018, 98, 618–627. [Google Scholar] [CrossRef] [PubMed]
  27. Pimenta, A.M.; Scafi, S.H.; Pasquini, C.; Raimundo, I.M., Jr.; Rohwedder, J.J.; Montenegro, M.D.; Araújo, A.N. Determination of hydrogen peroxide by near infrared spectroscopy. J. Near Infrared Spectrosc. 2003, 11, 49–53. [Google Scholar] [CrossRef]
  28. De Bei, R.; Cozzolino, D.; Sullivan, W.; Cynkar, W.; Fuentes, S.; Dambergs, R.; Pech, J.; Tyerman, S. Non-destructive measurement of grapevine water potential using near infrared spectroscopy. Aust. J. Grape Wine Res. 2011, 17, 62–71. [Google Scholar] [CrossRef]
  29. Fuentes, S.; Gonzalez Viejo, C.; Torrico, D.D.; Dunshea, F.R. Development of a biosensory computer application to assess physiological and emotional responses from sensory panelists. Sensors 2018, 18, 2958. [Google Scholar] [CrossRef] [Green Version]
  30. Xiao, Z.; Rogiers, S.Y.; Sadras, V.O.; Tyerman, S.D. Hypoxia in grape berries: The role of seed respiration and lenticels on the berry pedicel and the possible link to cell death. J. Exp. Bot. 2018, 69, 2071–2083. [Google Scholar] [CrossRef] [Green Version]
  31. Sadras, V.O.; Moran, M.A. Elevated temperature decouples anthocyanins and sugars in berries of Shiraz and cabernet franc. Aust. J. Grape Wine Res. 2012, 18, 115–122. [Google Scholar] [CrossRef]
  32. Zhang, P.; Barlow, S.; Krstic, M.; Herderich, M.; Fuentes, S.; Howell, K. Within-vineyard, within-vine, and within-bunch variability of the rotundone concentration in berries of vitis vinifera l. Cv. Shiraz. J. Agric. Food Chem. 2015, 63, 4276–4283. [Google Scholar] [CrossRef]
  33. Zhang, P.; Howell, K.; Krstic, M.; Herderich, M.; Barlow, E.W.; Fuentes, S. Environmental factors and seasonality affect the concentration of rotundone in vitis vinifera l. Cv. Shiraz wine. PLoS ONE 2015, 10, e0133137. [Google Scholar] [CrossRef] [Green Version]
  34. Moskowitz, H.R.; Muñoz, A.M.; Gacula, M.C., Jr. Viewpoints and Controversies in Sensory Science and Consumer Product Testing; Food & Nutrition Press, Inc.: Trumbull, CT, USA, 2008. [Google Scholar]
  35. FAO. Sensory assessment of fish quality. In Torry Advisory; Torry Research Station, MAFF: Aberdeen, UK, 2001; Volume 91. [Google Scholar]
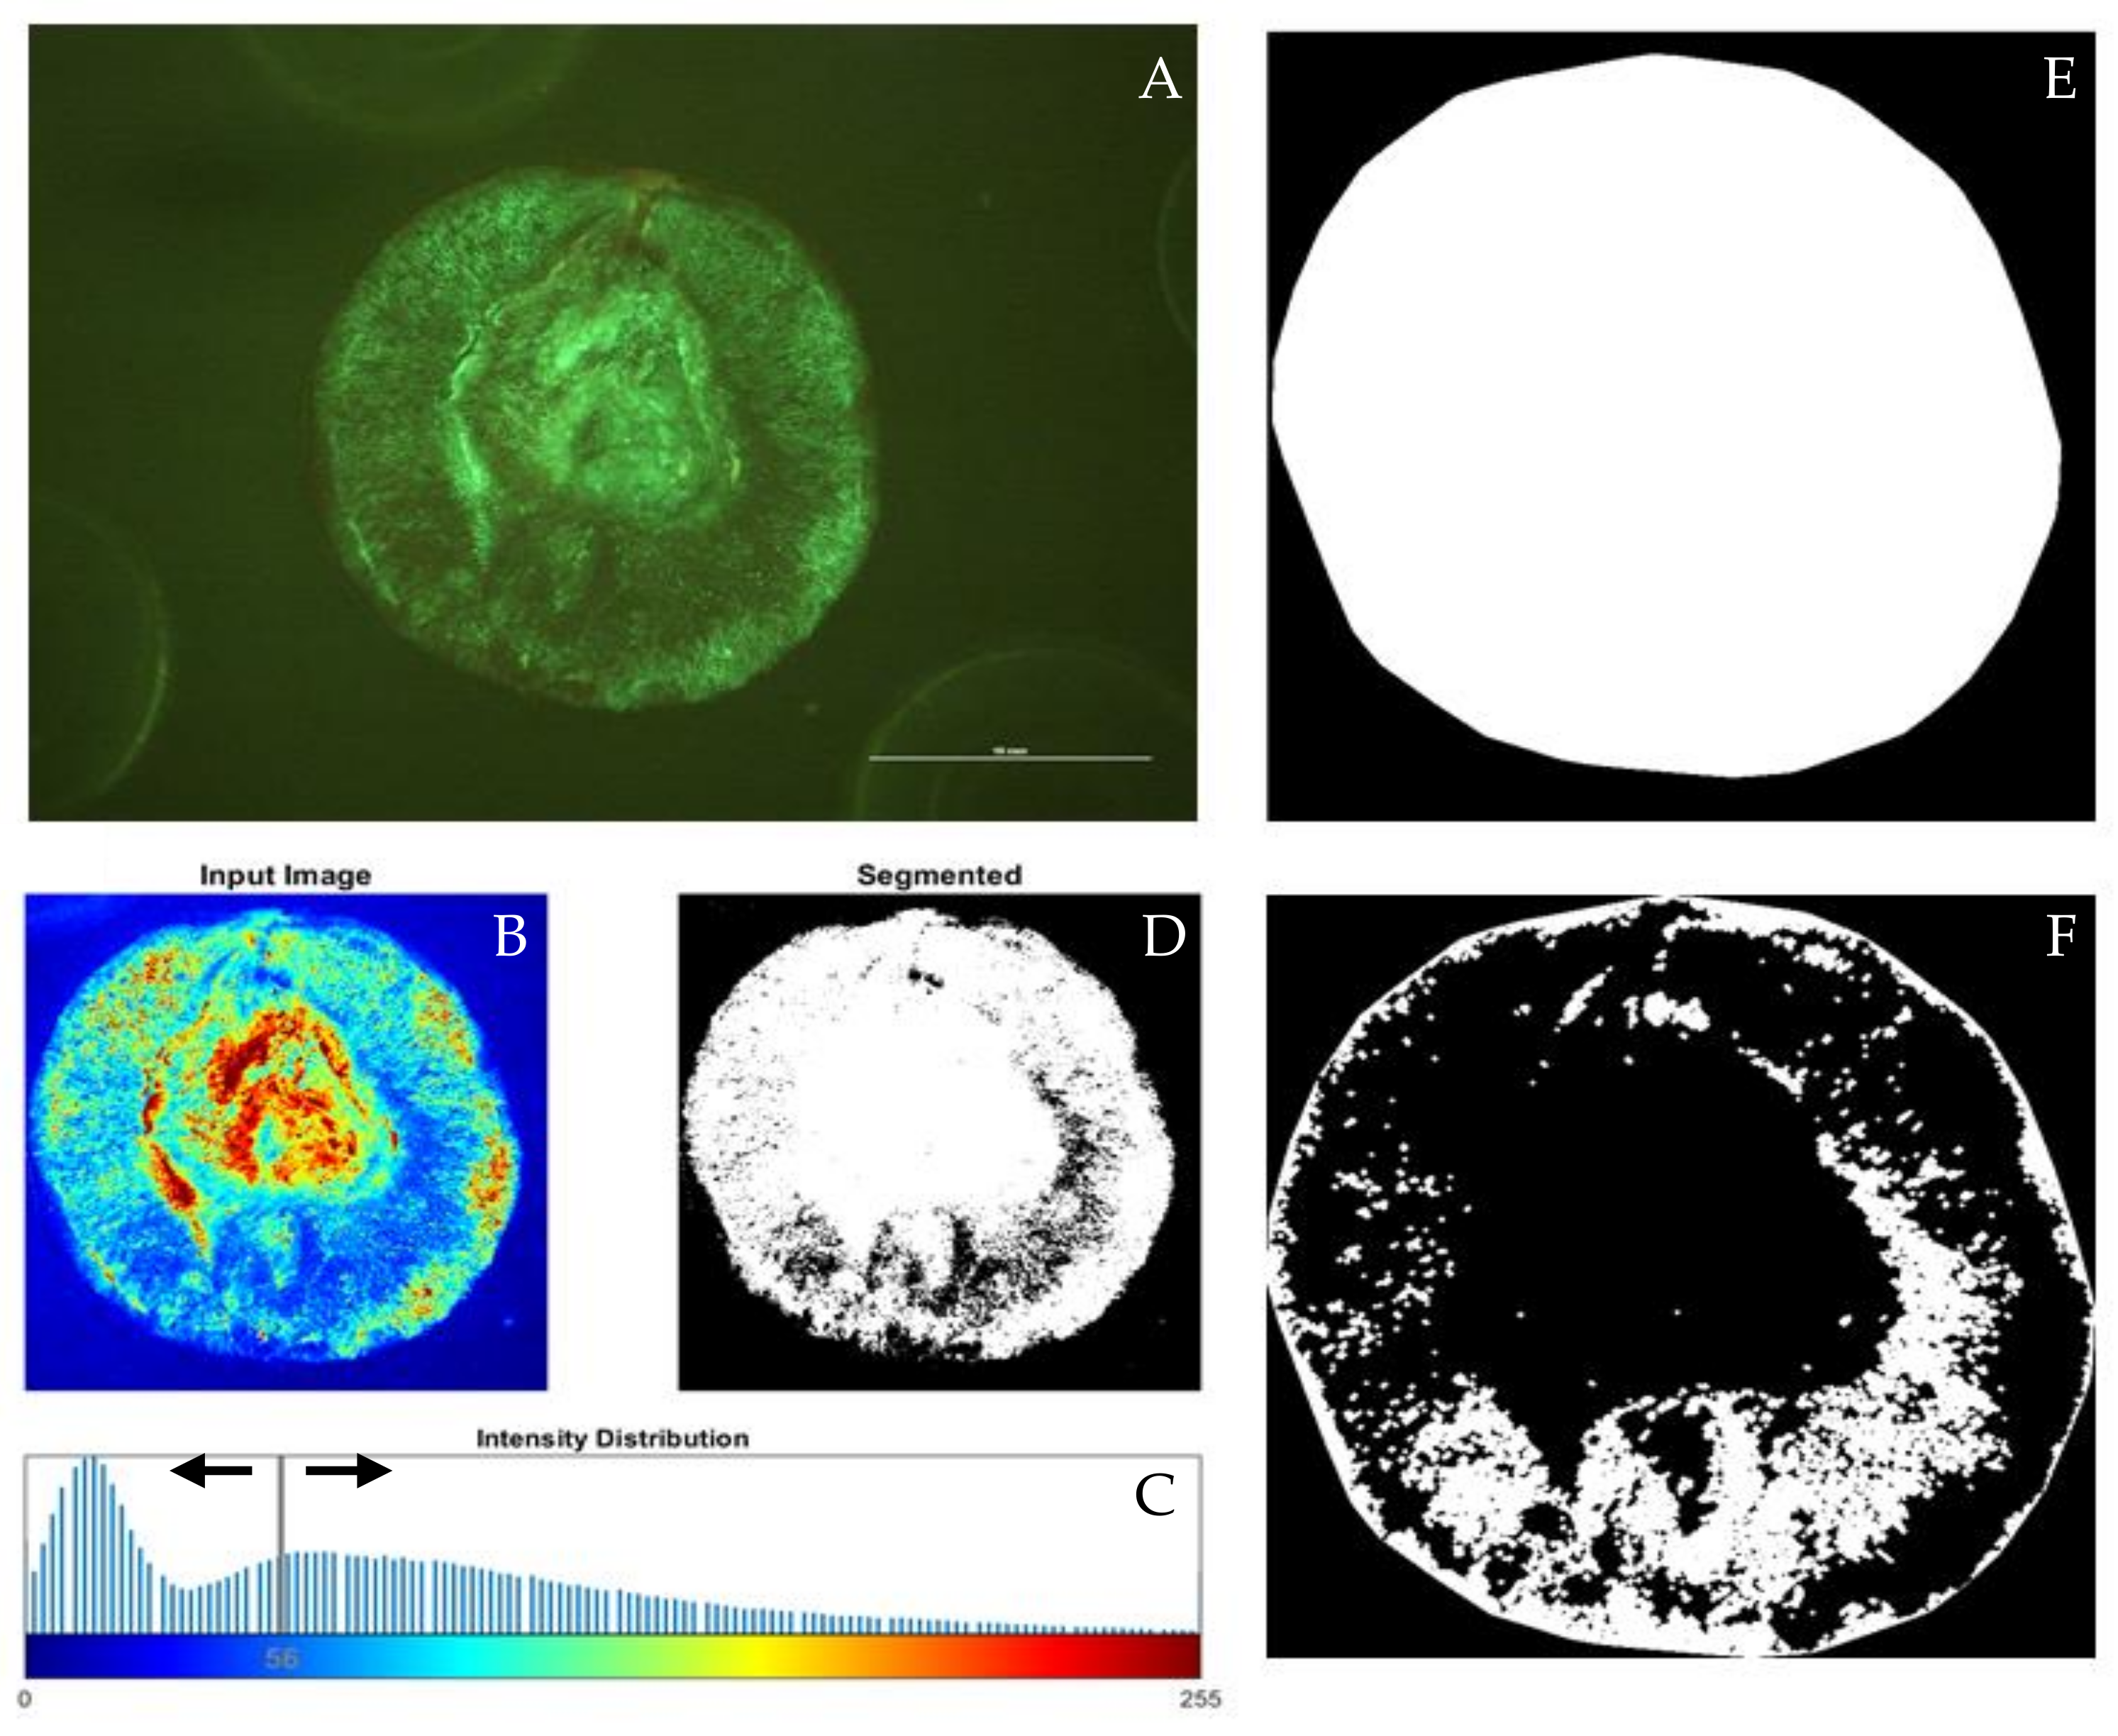
Figure 1. Computer vision analysis of digital images obtained from fluorescein diacetate (FDA) stained Pinot Noir berries. (A) original FDA fluorescent image; (B) intensity image to enhance living tissue; (C) thresholding to adjust binarization using a sliding line; (D) living tissue (LT) assessment (white) and dead tissue (black); (E) binary image of the whole contour of berry for percentage calculation; (F) binary image of dead tissue assessment (DT), which for this specific image was 85%.
Beverages 06 00039 g001
Figure 2. Diagram of the artificial neural network models showing the inputs, neurons, and outputs of each model. Detailed sensory descriptors may be found in Table 1. Abbreviations: W = weights, b = bias.
Beverages 06 00039 g002
Figure 3. Results of data for ANOVA for Brix and living tissue (LT), from the two blocks in four different dates after anthesis (DAA), from post-veraison (DAA90) to harvest (DAA117). Different letters (a, b) denote significant differences among samples according to the Fisher’s least significant differences (LSD) post hoc test (α = 0.05).
Beverages 06 00039 g003
Figure 4. Near-infrared spectroscopy curves using (a) the raw absorbance values and (b) the first derivative for the 92 and 117 days after anthesis (DAA). Black rectangle in both graphs corresponds to the H2O2 overtones, and grey dotted rectangle to the H2O overtones.
Beverages 06 00039 g004
Figure 5. Spider chart of the sensory descriptors, showing the results of the ANOVA for the attributes, with significant differences according to the Fisher’s least significant differences (LSD) post-hoc test (α = 0.05). Different letters (a,b) denote significant differences among samples.
Beverages 06 00039 g005
Figure 6. Overall regression of (a) Model 1 to predict living and dead tissue (%), throughout four measurement dates within the 2014-15 season for Pinot Noir berries and (b) Model 2 for 19 sensory descriptors (Table 1) for wines (scale 1–15) from blocks 92 and 96. R = correlation coefficient.
Beverages 06 00039 g006aBeverages 06 00039 g006b
Table 1. Descriptors and abbreviations evaluated in the sensory session.
DescriptorAbbreviations
Color intensityCInt
Red fruits aromaARF
Black fruits aromaABF
Yeast aromaAYeast
Spicy aromaASpicy
Floral aromaAFloral
Oak aromaAOak
Sweet aromaASweet
Sweet tasteTSweet
Acidic tasteTAcidic
Bitter tasteTBitter
Oak flavorFOak
Herbs flavorFHerbs
Red fruits flavorFRF
Black fruits flavorFBF
Spicy flavorFSpicy
BodyBody
AstringencyAstringency
Warming mouthfeelMWarm
Table 2. Statistical results from the two artificial neural network models.
StageSamplesObservations
(Samples x Targets)
RPerformance
(MSE)
Slope
Model 1—Living and dead tissue
Training60012000.95560.88
Validation1292580.93710.92
Testing1292580.92810.85
Overall85817160.94-0.88
Model 2—Sensory descriptors
Training10019000.810.760.64
Validation224180.810.830.61
Testing224180.760.990.59
Overall14427360.80-0.63
Abbreviations: R = correlation coefficient, MSE = means squared error.