Abstract
In this experiment, the effect of pulsed electric field (PEF) technology on the extractability of anthocyanins and polyphenols in early-harvested Sangiovese red grapes (16.9°Bx sugar, 3.26 pH, and 10.4 g/L titratable acidity) from Emilia Romagna (Italy) was investigated. Electric field strengths were in the range of 0.9–3 kV/cm, generated by the application of short, high-voltage pulses, and the grapes were subjected to specific energies from 10.4 to 32.5 kJ/kg immediately after crushing and destemming to produce a pre-fermentative pulsed electric field treatment on a pilot scale. Grape musts and wines were analyzed for color components and polyphenols content from pressing of juices up to 3 months from the end of the fermentation of wines. Furthermore, the freshly-fermented wines were subjected to accelerated aging conditions (i.e., warming under 40 °C for 32 days) to simulate the evolution of color parameters with time. The color intensity was generally higher in treated musts and wines compared to the control, further increased by raising the intensity of the electric field. Results suggested the potentialities of pulsed electric fields (PEFs) as a mild pre-fermentative process to assist maceration and to increase the polyphenolic content of musts obtained by early-harvested Sangiovese grapes.
1. Introduction
The application of mild technologies aimed at the extraction of phenolic and aromatic components from the solid parts of grapes (skin and seeds) during the maceration process is a challenging task for the oenological industry. It is well known that the color stability of red wines plays a key role in product value, with flavonoids (i.e., polyphenols, tannins, anthocyanins) that account for distinguishing in-mouth sensory attributes of wines. Therefore, the improvement of the flavonoids extraction from grapes contributes to getting stable and high-quality red wines with enhanced commercial value [1,2].
In the last decade, an increasing unbalance between optimal sugar/acid ratio and accumulation of phenolic compounds has been observed in grapes, related to significant changes in the climatic conditions. In particular, grape juices often reach high sugar content (i.e., potential high alcohol content), low acidity and high pH values, therefore inducing wine producers to anticipate the harvest period. This results in unripe grape skins and seeds, with a negative effect on the extractable polyphenols [3].
To face this situation, winemakers have two main strategies: (i) early harvest of grapes based on expected alcohol content, which requires the adaptation of specific winemaking processes to manage the extraction of valuable polyphenols in the pre-fermentative stage; (ii) harvesting of fully mature grapes and subsequent adjustment of alcohol and pH levels in finished wines [4,5].
In particular, the processing of early harvested grapes with incomplete phenolic maturity requires the adoption of short macerations to limit the extraction of bitter, astringent, and herbaceous tannins primarily sourced from unripe grape seeds. It is well known that early harvested grapes usually have low sugar/acids ratio and are low in anthocyanins as well, which implies grape must (and wine) with low color intensity [6].
To solve this problem, both thermal and non-thermal techniques currently available to maximize the extraction of bioactive compounds from the pomaces can be adopted to assist the vinification of early harvested red grapes (Figure 1).
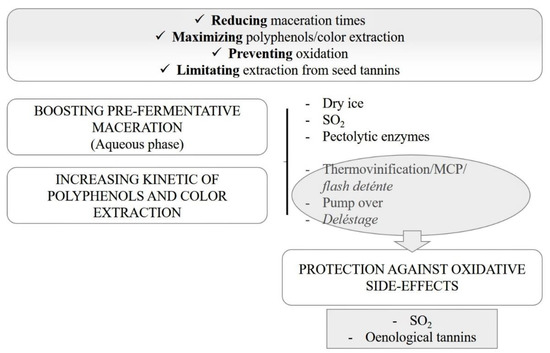
Figure 1.
Schematic overview of main technological strategies to boost polyphenolics and color extraction in red winemaking. MCP: pre-fermentation hot maceration.
Classic, non-thermal extraction techniques include the use of additives like sulfur dioxide, maceration enzymes (e.g., pectolytic) and solid CO2, high-power ultrasounds, and, more recently, the application of the microwaves technology in grapes or grape juices at the pre-fermentative stage [7,8,9,10]. Nevertheless, there are some critical issues related to the application of the above-mentioned methods: SO2 is an allergen, whereas ultrasound and microwaves need expensive equipment and experienced staff for its use [1,11,12,13].
In the scenario, the pulsed electric field (PEF) is a mild processing technique gaining increasing interest due to the relatively low-cost equipment and the reduced processing time. The method consists of the intermittent application of high voltage, short-duration pulses (ms-µs) to crushed grapes, which induces the degradation of cells (referred to as the “dielectric breakdown” effect), producing the disintegration of connective vegetal tissues and the release of polyphenolic compounds contained therein. Detailed explanations of the theoretical premises underlying the application of the PEF technologies and potential applications in the food industry are available in the literature [14,15,16].
In the present work, the use of PEFs immediately after destemming/crushing of early-harvested Sangiovese red grapes was explored to improve the extraction of polyphenolic compounds. Sangiovese is the most widespread red grape cultivar in Italy, producing highly valued wines (e.g., Brunello di Montalcino in Tuscany). The Romagna Sangiovese appellation counts a total surface under vine of approximately 7000 hectares (17,500 acres) produced in the Emilia-Romagna region, including twelve appellation production sub-zones. Moreover, recent climatology studies on the Emilia-Romagna wine production area disclosed a trend with a significant increase in the temperatures concurring to the ripening of grapes, which implies an increasing level of potential alcohol in Sangiovese wines [17,18].
The present study aims at the exploitation of the PEF technology to maximize the extraction of polyphenolic compounds during the vinification of Sangiovese red grapes, which were collected at an early ripening stage for limiting the alcohol level in wine. The present work constitutes an advancement in terms of the application of PEF technology in assisting “Sangiovese di Romagna” wine production from early harvested grapes.
2. Materials and Methods
2.1. Grapes Collection
Red grapes of Vitis vinifera “Sangiovese Romagnolo” biotype, vintage 2016, were supplied by Turricchia Vini Srl (Bologna, Italy). Approximately 200 kg of grape bunches were manually harvested at the 16.9°Bx sugar, 3.26 pH, and 10.4 g/L titratable acidity levels from a 2.5-acre parcel of vineyard located in the lower hills of Imola, in the province of Bologna, and conferred at the nearby cellar where the pilot plant described in Section 2.2. was arranged for the experiment. Grapes were carefully selected by visual inspection to avoid mold contaminations. Indeed, the incomplete ripening of grapes is a common scenario with climate change; thus, the trial challenged a practical case study for the use of PEFs as a tool to minimize the effect of adverse climatic conditions that may unpredictably occur.
2.2. Experimental Facilities
The experimental set-up aimed at reproducing on a pilot-scale the red vinification procedure from grape picking to pressing of the pomaces, with the application of the PEF treatment directly after destemming and crushing.
The pilot plant was set using the following facilities, provided and assembled by Diemme Enologia S.p.A. (Lugo, IT):
- (1)
- Manual destemmer-crasher machine with a plastic roller;
- (2)
- Supply tank with square hopper;
- (3)
- Self-priming, flexible rubber impeller pump (Liverani);
- (4)
- Power supply/pulse adapter;
- (5)
- PEF cell;
- (6)
- Flexible hoses;
- (7)
- Discharge tank;
- (8)
- Technical balance 50 × 50 cm dimension, 150 kg capacity, sensitivity of +1 g;
- (9)
- Automatic stirrers with adjustable synchronized speed (diameter of the helix 80 mm);
- (10)
- Hydraulic press, 1 L capacity.
2.3. PEF Apparatus
2.3.1. Power Supply/Pulse Adapter
The power supplier provided by Alintel Srl (Bologna, IT) produced a train of 10 µs pulses, characterized by maximum frequency of 1500 Hz, maximum voltage 3 kV, and a peak current of 30 A; electric field strengths ranged 0.9–3 kV/cm, generated by the application of square waveform pulses, producing specific energies ranging from 10.4 to 32.5 kJ/kg.
2.3.2. PEF Treatment Cell
The cell for the continuous-flow treatment (Diemme Enologia) was obtained by molding a plexiglas tube into a circular transparent chamber having a 40 mm inner diameter and a 105 mm length, containing a couple of circular stainless-steel electrodes, each of them with a 0.62 cm2 area, placed at a distance of 40 mm each other. The chamber was hermetically sealed with silicone gaskets and then connected to the pumping and discharging tubes by means of steel clamps and flanges.
On the basis of the flow rates of the juices which ranged 200–300 L/h and applying electrical pulses with a 1500 Hz frequency, crushed grapes were expected to receive a number of pulses ranging 712–1069 while passing through the treatment cell, with an estimated residence time in the cell ranging 475–713 ms.
2.4. PEF Treatment and Vinification Protocol
In this experiment, the effectiveness of the PEF treatment in the polyphenolic and color enhancement was stepwise monitored to account for both immediate effects following grape crushing and long-term impact in the polyphenolic and color profiles in musts and wines. Each sampling has been compared to the experimental control (Ctrl), obtained by adopting the same technological procedures with the exclusion of the PEF treatment.
For the purpose of the discussion, the samples obtained were coded according to the treatment (Ctrl, Pef1, Pef2, Pef3) and the winemaking step (-m-a, -m-b, m-c for musts; v-1, v-2, and v-3 for wines); coding is described below and further synthesized in Table 1.

Table 1.
Sample codes and descriptions of related technological processes.
Table 1 reports sample codes and the relative description.
In the “-m-a” series, grapes were divided into four aliquots (approximately 50 kg each), then crushed and destemmed without any SO2 addition. The crushed grapes were pumped into the plexiglass tube containing the treatment cell by monitoring the flow rate, which ranged 200–300 kg/h and remained constant within each PEF experiment under continuous flow conditions. The electric field strengths produced by pulses ranged 0.9–3 kV/cm, resulting in the following specific energies on the grape juice/pomaces during the treatments: 10.4 (Pef1), 23.8 (Pef2), and 32.5 kJ/kg (Pef3), calculated by the sensible heat values reached by juices after the treatments [19]. The different energies applied aimed at verifying the effect of the treatment intensity in terms of technological advantages, to obtain optimized process parameters. The temperature values recorded before the pumping of grape juices and marcs into the cell remained 16 ± 2 °C for the duration of the experiments; temperature values were controlled by a probe and visualized by a digital thermostat (Sous-Vide, TFA Dostmann, Wertheim, GE); measures were taken by immersing the probe in the grape juice immediately before and after the treatment. The temperature increase (ΔT) resulting from the PEF treatment was within 8 °C (ΔT 2.5, 5.7, and 7.8 °C for Pef1-m-a, Pef2-m-a, and Pef3-m-a, respectively).
To evaluate the effect of PEF on the total polyphenols content and color indexes of samples, aliquots of the juices (1 L each) were separated from the grape marcs immediately after the treatment by means of a manual press (6 bar pressure for 3 min). Both juices and marcs were weighted, and the concentration of polyphenolic compounds was normalized per gram of grape marcs obtained after grape pressing. This procedure enabled us to obtain a reliable comparison between different test trials, regardless of the different grape marc amounts pumped into the cell during the treatment. Prior to analysis, the samples were added with few drops of ethyl bromoacetate, an anti-fermentative compound.
In the “-m-b” series, untreated (Ctrl) and treated grape marcs were macerated in their musts under dynamic conditions for two hours, using a mechanical stirrer with a speed rate of 2.60 revolutions per second (rps), then sampled for analysis.
In the “-m-c” series, musts which were previously subjected to dynamic maceration were further kept in maceration under static conditions for twelve hours at ambient temperature (phase c). Then, the liquid was sampled (1-L) following the maceration of the PEF-treated residual grape marcs and the control, respectively. The series “m-c”, musts with coupled static + dynamic maceration of grape marcs, was further vinified to obtain the series “v” of experimental wines: musts and their pomaces were transferred into fermentation vats (10 L volume), and selected yeasts were inoculated (Saccharomices Selezione Italica, Enobiotech srl, Vicenza, IT). The fermentation of musts was performed under controlled temperature conditions (22 ± 1 °C) and completed within 7 days in all samples, without being affected by previous PEF treatments. Grape marcs were pressed (6 bar pressure for 3 min) and weighted. Lees were allowed to settle; then, wines were racked off, added with potassium metabisulphite (SO2 titer 50 mg/L), transferred into 500 mL glass bottles, and capped under nitrogen with crown caps. Independent bottles of each sample were used to monitor the evolution of quality parameters, polyphenols, and color indices up to 3 months after bottling. At bottling, an aliquot of samples (40 mL) was transferred into screw-cap vials for the accelerated aging test.
Figure 2 schematically represents the experimental protocol.
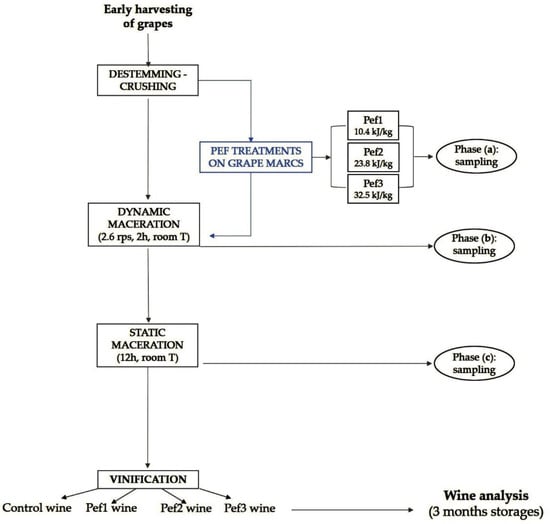
Figure 2.
Schematic representation of the experimental protocol adopted in this study.
2.5. Analytical Determinations
Selected parameters (temperature, conductivity, pH, total acidity, and soluble solids) were monitored in the PEF-treated juices immediately after the treatment and compared to control from untreated grapes (control sample). For all experiments, the temperature was monitored by a digital thermometer with a probe (Sous-Vide, TFA Dostmann, Wertheim, GE); the conductivity was measured by a Cond 7 Vio portable conductivity meter with cell 2301T (Xs Instruments, Modena, IT). Wines were monitored at bottling and during three-month storage for the following parameters: free and total sulfur dioxide content, total acidity, volatile acidity, and pH [20].
The spectrophotometric determinations were performed in both grape juices and wines by means of a Cary60 UV–vis (Agilent Technologies, Santa Clara, CA, USA). The total polyphenols content (TPC) was determined by measuring the 280 nm absorbance of diluted grape juices and wines, using gallic acid as a reference standard [21]. Iron-reactive polyphenols and tannins were measured in wines by means of the Adams-Harbertson colorimetric assay [22].
The chromatic characteristics of musts and wines were determined through direct measurement of the absorbance units (AU) at 420, 520, and 620 nm, which were normalized to 10 mm optical path and used to determine the color intensity (CI: 420 + 520 + 620 nm) and hue (H, 420/520 nm) indices and the relative percentage of yellow, red and blue color (%Yl, %Rd, %Bl) in both musts and wines, according to Glories [21].
The 580/520 nm was used to monitor the extent of co-pigmentation in wines (Copig) that generates a change and an increment in the color intensity due to π–π interactions from the stacking of a colorless molecule called the co-pigment on the planar flavylium ion or quinoidal forms of anthocyanins [23], the latter compounds showing a λmax at approximately 580 nm [24].
Accelerated aging tests were performed under isothermal conditions (T = 40 ± 1 °C) in wines obtained immediately after the end of fermentation. The procedure was previously reported for white wines [25] and was performed in this study with minor amendments to the original protocol, by measuring the evolution of CI and H indexes with a variable sampling frequency (2 to 20 days) over 32 days of incubation. The accelerated aging test was aimed at evaluating the stability of color and color precursors (polyphenols and tannins) in wines obtained from grapes under partial maturity conditions.
2.6. Statistical Analysis
Data storage, calculation, graphics, and multivariate analysis (principal component analysis, PCA) were carried out using XLSTAT version 2011.1.05 (Addinsoft, Anglesey, UK).
3. Results
3.1. Effect of PEF Treatment in Grape Juices/Musts
Table 2 reports the characteristic of juices obtained from treated (Pef-m-n) and untreated (Contr-m-n) grape pomaces immediately after the PEF treatment (a) and following maceration (b,c). The temperature of the treated juices was not significantly affected by the electrical discharges, reaching a peak value of 24.1 °C in the Pef3 sample, where the maximum specific energy value (32.5 kJ/kg) was obtained (ΔT = 7.5 °C compared to the control sample).
Table 2.
Physical-chemical properties of grape juices/musts following the PEF and maceration treatments (see Table 1 for sample description).
The conductivity of the juices underwent a slight increase because of PEF. The extraction of compounds from woody parts of grape would be undesirable due to the potential release of “green” polyphenols and ionic species, i.e., potassium, responsible for pH rising and wine instability. Nevertheless, the titratable acidity and pH levels were not affected by the treatment, as assessed by comparison with control musts.
The application of electric pulses did not affect the release of sugar in the juices, which averaged 17 ± 0.3 g/L on all experiments.
Increasing TPC values were observed in PEF-treated samples at different extents in relation to the intensity of the treatment. Measurements performed immediately after treatment (a) produced moderate increments in terms of polyphenol content compared to the control: Pef1-m-a + 22.9%; Pef2-m-a + 16.1%; Pef3-m-a + 20.4%.
Nevertheless, it is noteworthy that the TPC increased during the maceration processes (Figure 3). In particular, the TPC levels after the PEF treatment and following the dynamic (2.6 rps, 2 h) and static macerations (12 h) always improved compared to the control samples.
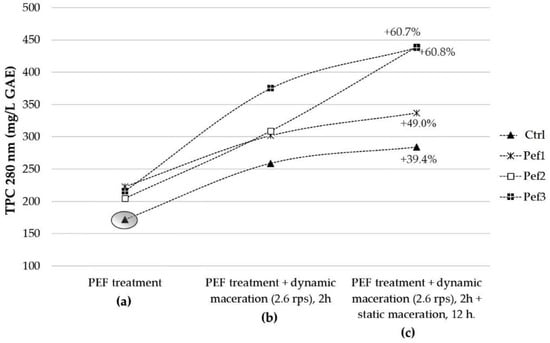
Figure 3.
The evolution of the TPC extraction along the (a–c) phases. The whole process had a 15-h total duration. The percentages represent the TPC increment in the juices in comparison to the control sample value as measured at the time zero (gray circle), representing the TPC in the juice after simple grape crushing.
The TPC value increased up to +39.4% in the control must after simple maceration (both dynamic and static processes). More noticeably, with respect to the initial TPC content in the untreated must (172 mg/L GAE), the overall effect of “Pef1 treatment + macerative processes” accounted for a TPC increment of +49.0%, followed by the maceration of musts from Pef2 (+60.8% TPC) and Pef3 (+60.7% TPC)-treated grapes.
Figure 3 also highlights the trend of the polyphenolic extraction along the experiment: in particular, the Pef1 followed a similar trend as the control sample, showing the main contribution to the polyphenolic extraction during the dynamic stirring and a further, minor contribution from the 12 h-static process. The TPC extraction in maceration following the Pef2 treatment showed a linear increase over time, even more pronounced during the static maceration. The Pef3 treatment speeded up the TPC extraction during the dynamic maceration step, with a subsequent slowdown and final TPC comparable to that obtained with the Pef2 treatment following the static maceration.
The low technological maturity of grapes was reflected in the relative distribution of color components (Table 2). Juices showed a prominent yellow component, more pronounced in the Ctrl-m-a following grape crushing (62.25%Ye), and slightly lowered in the PEF-treated juices (Pef1 61.7%Ye; Pef2 61.4%Ye; Pef3 58.6%Ye) in favor of increasing reddish hue (%Rd) and enhanced color intensities. The simple PEF treatment of grapes accounted for the increase in the bluish hue in juices compared to the control sample (Ctrl-m-a 11.2%Bl; Pef1-m-a 11. 7%Bl; Pef2-m-a 12.0%Bl; Pef3-m-a 13.2%Bl); the percentage of contribution of the blue tone to the total color increased with the intensity of the treatment (Table 2).
The values of H index accounting for the extent of the yellow-brownish component of musts were balanced in PEF-treated samples by the prominence of the blue/purple component (620 nm). Lately, in the dynamic (b) and static (c) macerations, the H-index showed similar values among Pefn-m samples, but were generally lower with respect to the Ctrl-m-b and Ctrl-m-c (Table 2).
The 580 nm absorbance, which accounted for the extent of co-pigmentation, showed a major increase immediately after the PEF treatment, also resulting in high values of the Copig index of PEF-treated samples. The Copig index was flattened, and the values resulted were similar to the control samples following macerations, due to a gradual increase of the 520 nm spectral component along maceration (Table 2).
Compared to the initial value (Ctrl-m-a sample, CI 1.25 a.u.), the simple maceration of grape marcs in the juice (Ctrl-m-c) provided a 39% increase in the color intensity; the maximum increase of the CI was then observed for the Pef2-m-c, with a 51% higher intensity, followed by Pef3-m-c (+48.8%) and Pef1-m-c (+46.8%), as inferred from color data in Table 2.
3.2. Impact of PEF Treatments of Grapes in Sangiovese Wines
Table 3 reports proximate analyses of wines obtained from untreated (Ctrl-v) and treated (Pefn-v) grape pomaces; values were determined to ten days from the end of fermentation (1) and after three months storage (3).
Table 3.
Analytical determinations in Sangiovese PEF wines and control wine at the end of fermentation and after three-month storage.
The parameters: pH, titratable acidity, and alcohol content were not affected by the application of PEF. After three months of storage, the titratable acidity values underwent a decrease in all samples, regardless of the application of the treatment; this was likely due to tartaric stabilization. The pH values remained almost unchanged during storage, showing that the extent of tartaric acid precipitation was balanced by the buffer capacity of wines.
Volatile acidity displayed high values in the experimental wines, probably because of the Botrytis cinerea activity in grapes at harvest. The Pef1-v-1 sample showed the highest value of the series (0.7 g/L), and after three months of storage, the volatile acidity values were slightly reduced in the Pef1-v-3 and Pef3-v-3 samples although still remarkably high.
Both free and total SO2 values were generally high in the samples Pef2-v and Pef3-v, both at the end of fermentation and after three months of storage, suggesting an additional protective action against oxidation following the increased TPC in treated wines.
The wines were further investigated for their polyphenolic content and color profile, as reported in Table 4. The TPC was generally higher in the PEF-treated wines, peaking in the Pef2-v samples; the trend was confirmed in three-month analyses. Pef2-v-2 and Pef2-v-3 showed a slight increase in the TPC compared to the first sampling (Pef2-v-1); this trend was tentatively explained with a gradual formation of polymeric structures (proanthocyanidins with increasing degree of polymerization; pigment polymers), characterized by high extinction coefficients ε at the wavelength of the analysis (280 nm). More likely, the evolution of polyphenolic polymeric fraction relates to the formation of pigment polymers and adducts; in this view, the PEF treatment can assist the stabilization of wine color in time (Table 4). It is worth to notice that the limited maturity of grapes produced light-colored, rose wines with reduced color intensity.
Table 4.
Polyphenolic content and color profile of experimental wines (see Table 1 for sample description).
In relation to the tannin fraction (proanthocyanidins) extracted during the maceration-fermentation, the Pef1-v-1 showed a 20.5% increase in their content, similarly to Sangiovese treated with the maximum electric field intensity Pef3-v-1 (18.5%). More remarkably, the Pef2-v-1 sample showed a 33.5% increase in total proanthocyanidins at the end of maceration-fermentation. The proanthocyanidin values remained unchanged up to three months of storage in bottles, regardless of the intensity of the treatment (Table 4).
A PCA model was built to summarize the evolution of polyphenols and color indices in untreated and PEF-treated wines during storage (Figure 4). The first two components (PC1 + PC2) accounted for the 90.9% of variability among samples, and the projection of the wines on the first principal component (explained variability: 76.67%) showed a separation mainly according to the polyphenol content (TPC-280 nm and TPC-Fe) and color hue. Thus, all control wines (Ctrl-v-1, -v-2, -v-3) were clearly grouped in the negative PC1, and they were described by the prominence of the yellow-brownish hue, thus confirming a limited extraction of anthocyanins in the maceration-fermentation and a poor evolution of the color fraction up to three months from bottling. Grouping of control samples also confirmed the general contribution of the PEF treatments in obtaining higher extraction yield of polyphenolic compounds; the Pef2-v-n series displayed the higher content in polyphenols and tannins, as confirmed by their grouping in the positive part of PC1.
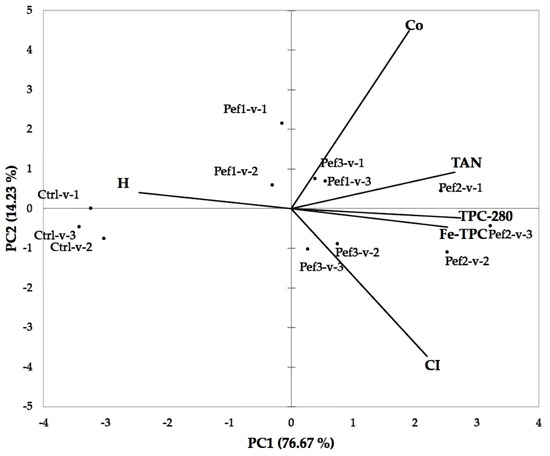
Figure 4.
Principal component analysis (loadings and scores) of the variables with PC1 and PC2 based on total (TPC-280) and iron-reactive (Fe-TPC) polyphenols, proanthocyanidins (TAN), and CI, H and Copig color indices for the experimental wines.
The Pef3 treatments contributed similarly to the Pef2-v-n series at increasing the CI, regardless of the lower polyphenolic content generally observed in the Pef3-v-n series (Table 4).
The co-pigmentation peaked in the Pef3-v-1 and Pef-1-v-3, showing the potential implication of the phenolic fraction in the formation of molecular adducts.
3.3. Accelerated Ageing Tests
The aging attitude of wines was investigated by inducing thermal stress (isothermal 40 ± 2 °C) for 32 days and monitoring with time the CI and H indexes. Figure 5 reports the evolution of the color intensity, showing that Ctrl-v-aged and Pef1-v-aged wines displayed similar CI values up to 12 days storage. In particular, the Ctrl-v-aged wine increased with a linear trend, while Pef1-v-aged wine showed a fast kinetic of color increase up to 5 days, then slowing down between 5–12 days. CI increasing in the Pef2-v-aged and Pef3-v-aged wines followed similar trends for the whole duration of the experiment, with systematically higher values compared to CI in Ctrl-v-aged wine. The Pef1-v-aged wine followed the same time course of Pef2 and Pef3 in long-terms storage (32 days).

Figure 5.
Time course of the color intensity (CI) in the experimental wines under accelerated aging conditions (T = 40 °C).
The evolution of color hue was a suitable tool to investigate the contribution of oxidative processes (i.e., detrimental browning effects, the evolution of color fraction through the formation of adducts/polymers) in wines aging. Figure 6 reports the time course of the color hue typically used to account for the browning extent in wines. Regardless of the different H values observed at the time zero (post-fermentation wines), the Ctrl-v-aged, Pef1-v-aged, and Pef3-v-aged wines displayed similar evolution of the 420/520 nm ratio, showing a major contribution of browning processes in the CI increase. More noticeably, the increase of H in the Pef2-v-aged wine was slowed down, approaching stable values in 12 days, then keeping the H index constant up to 32 days.
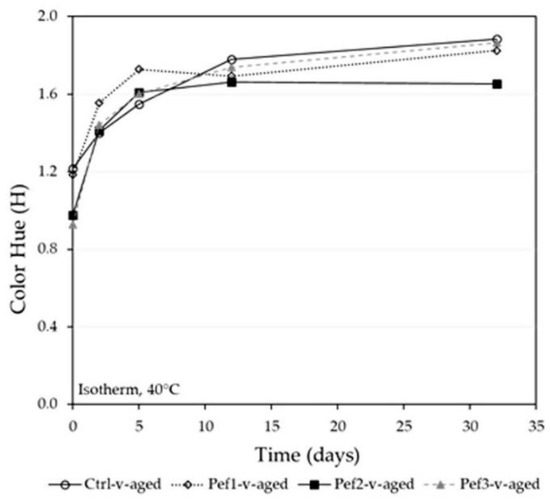
Figure 6.
Time course of the color intensity (H) in the experimental wines under accelerated aging conditions (T = 40 °C).
4. Discussion
Optimal grape maturity is generally recognized as the key condition to gain high-quality wines. Nevertheless, the increasing demand for solutions to face the impact of climate change in winemaking calls for the exploitation of innovative technological approaches. The case-study, raised from the need for early harvesting of Sangiovese grapes, which were partially infected by Botrytis cinerea due to adverse meteorological conditions. In this scenario, we exploited the unripe grapes for wine production by exploiting the PEF technology to enhance the extraction of bioactive compounds (polyphenols and pigments) in musts. In this experiment, the analytical values of polyphenolic compounds and the color indexes in juices/musts/wines reflected the peculiar biosynthesis of polyphenols and anthocyanidins in Sangiovese grapes compared to other varieties [26,27,28]. Nevertheless, the actual TPC level in musts and wines was highly affected by the occurrence and intensity of the PEF treatment, also resulting in improved color profile and stability in wines. According to results, two mechanisms were hypothesized: (i) increased mashing of solid parts of grapes by electric pulses, and contextual increase in the anthocyanins content in the musts/wines, as previously reported [29,30,31]; (ii) increased extraction of polyphenolic precursors (i.e., flavonoid compounds, and proanthocyanidins) which contributes to the color improvement and stability in young wines [32,33,34]. A possible impact of the PEF treatment on the buffer capacity and tartaric stability of wines can be postulated, most likely based on the release of ionic species (primarily, potassium) from the woody parts of grapes, i.e., seeds and residual stems [35].
Nevertheless, for the aim of this study, musts and wines acidity laid within acceptable limits for oenological applications; a spontaneous tartaric stabilization was observed up to 3 months from wine bottling, regardless of the application of PEF. The potential impact of extended mashing of solid parts of grape on the release of instability agents in wine was not extensively studied in this work; thus, there is a need of further studies to investigate the stability of musts obtained from PEF treatment of grapes at the different maturation stages [36].
The increasing extraction of polyphenols, which follows the application of electric pulses in grape tissues, might explain the higher free/total SO2 ratio observed in treated wines; the increased TPC values provided additional protection of musts/wines from oxidation, slowing down the sulfur dioxide consumption by reactive oxygen species [37].
A further explanation might be the inhibition of oxidase enzyme activity during the treatment of grapes by electric pulses, as previously reported for PEF experiments, limiting the consumption of SO2 during vinification [38]. Residual laccase activity after the PEF treatment, which is not even inhibited by sulfur dioxide, might account for the high volatile acidity obtained in the experimental wines [39]. Nevertheless, this hypothesis is controversial if considering the inhibitory effect of low-intensity electric current in laccase activity observed in previous studies [40].
When considering the field strengths applied in this experiment (0.9–3 kV/cm) and resulting PEF specific energies, the Pef2 treatment (23.8 kJ/kg) provided improved performances in terms of TPC, tannins and color extraction, color quality and stability, and inhibition of oxidative aging in wines; in contrast, the Pef1 treatment (10.4 kJ/kg) resulted in polyphenolic content and improved color stability comparable to control wines. The higher treatment intensity was applied in Pef3 (resulting in the 32.5 kJ/kg specific energy), obtaining lower tannin extraction and similar color characteristics if compared to Pef2. Results from the literature showed that both color intensity and tannin content were affected by the specific energy reported in the treated juices. In particular, Sack and Mueller adjusted the electric field to peak values between 18–30 kV/cm, obtaining specific energies up to 40 kJ/kg; the latter was considered as the peak value for maximizing tannin extraction [29]. The same authors reported that the lower specific energies (up to 20 kJ/kg) corresponded to incomplete disintegration of grape marcs, partially confirming the reduced advantage obtained by the Pef1 treatment [29].
Other authors explored electric field values of 0.8–5 kV/cm, obtaining higher specific energies, up to 42 and 53 kJ/kg, for phenolics extraction from Cabernet Franc grapes and confirming the potentiality of the PEF treatments in increasing the phenolics extraction of +51% and +62%, respectively [41]. Similar results were obtained in this study when considering the application of Pef2 (+60.8%) and Pef3 (+60.7%) treatments coupled to dynamic and static maceration in PEF-treated musts and compared to the control must, as reported in Figure 3. The vinification process produced TPC increases ranging from 22.7–37.1% in PEF wines with respect to the control wine, as can be inferred by values reported in Table 4.
A maximum peak electric field of 5 kV/cm, resulting in higher specific energy (48 kJ/kg), was further applied by El Darra et al. [30], which obtained a CI increase by 23% in freshly fermented Cabernet sauvignon wines.
In the present study, a maximum increase of 13.8% on the CI value was obtained in the Pef2-v-3 sample with respect to the Ctrl-v-3 control wine (Table 4). Contextually, the CI increase showed a major contribution from co-pigmentation effects, as observed by the empirical 580/520 nm index Copig (Table 4). In the absence of extensive investigation on the contribution of electric pulses to co-pigmentation, El Darra et al. [30] came to similar conclusions in their study on Cabernet Sauvignon grapes obtained by thermovinification [30].
The PEF treatment contributes to the extraction of valuable phenolic compounds, including precursors involved in the color stabilization processes, i.e., flavonoid compounds including flavan-3-ols and flavonols, tannins, hydroxycinnamic acids [16]. Such precursors might account for the improved color profile and stability observed in Pef3 with respect to Pef1 wines. A previous study on the effect of electric pulses on Merlot grape marcs has demonstrated that, when applying a PEF treatment, the transmission of bioactive compounds from hypodermis and through the grape skin was regulated by pore dimensions produced during electroporation and by dimension/charge of the passing-by molecules [42]. Namely, it has been shown that moderate-intensity, short-duration PEFs accelerated the flow kinetic of phenolic compounds through the membrane and that highly charged molecules have a slower diffusion rate than small molecules with low charges [42]. Based on previous findings and results obtained in the present study, we concluded that the extent of PEF intensity may modulate the composition of the polyphenolic fraction, favoring the extraction of proanthocyanidin from grapes or enhancing the content in monomeric–oligomeric structures, which contribute to the stabilization of wines during aging.
In the present study, the color stabilization following PEF treatments and the attitude to delay browning effects were observed for the Pef2-v-aged and Pef3-v-aged wines, when subjected to prolonged thermal stress, as a further confirmation of the ability of pre-macerative PEF treatments to boost the extraction of polyphenolic components, which contribute to chemical and color stabilization in young red wines.
5. Conclusions
This study shows the potential of PEF treatments in enhancing the extraction of polyphenols and color compounds from early harvested Sangiovese grapes. The main interest of PEFs on the treatment of early harvested Sangiovese grapes relies on enhancing the extraction of the polyphenolic fraction and maximizing the color quality in short-term treatments, also avoiding prolonged contact of musts with unripe woody tissues (i.e., grape seeds), and release of undesirable, astringent compounds.
Experiments were performed in pilot volumes of grapes/juices/musts (50 kg each), according to technological needs experienced by the winemaking company. It was aimed at providing a preliminary screening of the impact of different PEF intensities in the polyphenolic content and color of Sangiovese musts/wines. Results obtained under different conditions (field intensities, dynamic maceration, static maceration) were globally considered to enable future experiments focused on the more effective conditions to be applied and statistically validated in pilot systems.
The amount of polyphenols in the juices, musts, and freshly fermented wines was affected by the intensity of the PEF treatments, and a similar effect was observed for color intensity and profile in musts and wines. A hypothesis on the electric pulse effects on color stabilization mechanisms was formulated.
Moreover, both low energy consumption (maximum value W = 32.5 kJ/kg) and limited temperature fluctuation (ΔT up to 8 °C) in comparison to traditional thermovinifications (W up to 400 kJ/kg, ΔT up to 50 °C; values estimated in [27]) make PEFs an attractive alternative to assisting maceration in winemaking.
Preliminary results reported in the present study would need further trials relating to the technological potentialities of PEFs in relation to grape maturity, wine quality parameters (polyphenolic classes, aromatic compounds, overall wine stability), and the consumer’s acceptability of the final products.
Author Contributions
Conceptualization, A.R., A.V., G.P.P., and F.O.; methodology, A.R., A.V., G.P.P., and F.O.; validation, A.R., A.V., G.P.P., and F.O.; formal analysis, A.R. and B.A.B.; investigation, A.R. and F.O.; data curation, A.R., B.A.B., and G.P.P.; writing—original draft preparation, A.R. and G.P.P.; writing—review and editing, A.V. and G.P.P.; supervision, A.V. and G.P.P. All authors have read and agreed to the published version of the manuscript.
Funding
This research received no external funding.
Acknowledgments
Authors gratefully acknowledge Turricchia Vini Srl (Bologna, Italy) for having provided the grapes used in this experiment, Diemme Enologia S.p.A. (Lugo, IT) for having provided the PEF cell and the pilot-scale plant facilities, and Alintel Srl (Bologna, IT) for having sized and provided the power supplier. The authors acknowledge Alberto Stassi for assembling the pilot plant and his contribution to the experimental procedure.
Conflicts of Interest
The authors declare no conflict of interest.
References
- Sacchi, K.L.; Bisson, L.F.; Adams, D.O. A review of the effect of winemaking techniques on phenolic extraction in red wines. Am. J. Enol. Vitic. 2005, 56, 197–206. [Google Scholar]
- Santos-Buelga, C.; De Freitas, V. Influence of phenolics on wine organoleptic properties. In Wine Chemistry and Biochemistry; Springer: New York, NY, USA, 2009; pp. 529–570. [Google Scholar]
- Webb, L.B.; Whetton, P.H.; Bhend, J.; Darbyshire, R.; Briggs, P.R.; Barlow, E.W.R. Earlier wine-grape ripening driven by climatic warming and drying and management practices. Nat. Clim. Chang. 2012, 2, 259–264. [Google Scholar] [CrossRef]
- Teslić, N.; Patrignani, F.; Ghidotti, M.; Parpinello, G.P.; Ricci, A.; Tofalo, R.; Lanciotti, R.; Versari, A. Utilization of ‘early green harvest’and non-Saccharomyces cerevisiae yeasts as a combined approach to face climate change in winemaking. Eur. Food Res. Technol. 2018, 244, 1301–1311. [Google Scholar] [CrossRef]
- Gambuti, A.; Rinaldi, A.; Lisanti, M.T.; Pessina, R.; Moio, L. Partial dealcoholisation of red wines by membrane contactor technique: Influence on colour, phenolic compounds and saliva precipitation index. Eur. Food Res. Technol. 2011, 233, 647–655. [Google Scholar] [CrossRef]
- Del Llaudy, M.C.; Canals, R.; Canals, J.M.; Zamora, F. Influence of ripening stage and maceration length on the contribution of grape skins, seeds and stems to phenolic composition and astringency in wine-simulated macerations. Eur. Food Res. Technol. 2008, 226, 337–344. [Google Scholar] [CrossRef]
- Carew, A.L.; Sparrow, A.M.; Curtin, C.D.; Close, D.C.; Dambergs, R.G. Microwave maceration of Pinot Noir grape must: Sanitation and extraction effects and wine phenolics outcomes. Food Bioprocess Technol. 2014, 7, 954–963. [Google Scholar] [CrossRef]
- Lukić, I.; Budić-Leto, I.; Bubola, M.; Damijanić, K.; Staver, M. Pre-fermentative cold maceration, saignée, and various thermal treatments as options for modulating volatile aroma and phenol profiles of red wine. Food Chem. 2017, 224, 251–261. [Google Scholar] [CrossRef]
- Parenti, A.; Spugnoli, P.; Calamai, L.; Ferrari, S.; Gori, C. Effects of cold maceration on red wine quality from Tuscan Sangiovese grape. Eur. Food Res. Technol. 2004, 218, 360–366. [Google Scholar] [CrossRef]
- Bautista-Ortín, A.B.; Jiménez-Martínez, M.D.; Jurado, R.; Iniesta, J.A.; Terrades, S.; Andrés, A.; Gómez-Plaza, E. Application of high-power ultrasounds during red wine vinification. Int. J. Food Sci. Technol. 2017, 52, 1314–1323. [Google Scholar] [CrossRef]
- Gerbaux, V.; Vincent, B.; Bertrand, A. Influence of maceration temperature and enzymes on the content of volatile phenols in Pinot noir wines. Am. J. Enol. Vitic. 2002, 53, 131–137. [Google Scholar]
- Carrera, C.; Ruiz-Rodríguez, A.; Palma, M.; Barroso, C.G. Ultrasound assisted extraction of phenolic compounds from grapes. Anal. Chim. Acta 2012, 732, 100–104. [Google Scholar] [CrossRef]
- Landbo, A.K.; Meyer, A.S. Effects of different enzymatic maceration treatments on enhancement of anthocyanins and other phenolics in black currant juice. Innov. Food Sci. Emerg. Technol. 2004, 5, 503–513. [Google Scholar] [CrossRef]
- Toepfl, S.; Mathys, A.; Heinz, V.; Knorr, D. Potential of high hydrostatic pressure and pulsed electric fields for energy efficient and environmentally friendly food processing. Food Rev. Int. 2006, 22, 405–423. [Google Scholar] [CrossRef]
- Tylewicz, U.; Tappi, S.; Mannozzi, C.; Romani, S.; Dellarosa, N.; Laghi, L.; Ragni, L.; Rocculi, P.; Dalla Rosa, M. Effect of pulsed electric field (PEF) pre-treatment coupled with osmotic dehydration on physico-chemical characteristics of organic strawberries. J. Food Eng. 2017, 213, 2–9. [Google Scholar] [CrossRef]
- Ricci, A.; Parpinello, G.P.; Versari. Recent advances and applications of pulsed electric fields (PEF) to improve polyphenol extraction and color release during red winemaking. Beverages 2018, 4, 1–12. [Google Scholar]
- Teslić, N.; Vujadinović, M.; Ruml, M.; Antolini, G.; Vuković, A.; Parpinello, G.P.; Ricci, A.; Versari, A. Climatic shifts in high quality wine production areas, Emilia-Romagna, Italy, 1961–2015. Clim. Res. 2017, 73, 195–206. [Google Scholar] [CrossRef]
- Teslić, N.; Zinzani, G.; Parpinello, G.P.; Versari, A. Climate change trends, grape production, and potential alcohol concentration in wine from the “Romagna Sangiovese” appellation area (Italy). Theor. Appl. Climatol. 2018, 131, 793–803. [Google Scholar] [CrossRef]
- Wang, L. Energy Efficiency and Management in Food Processing Facilities, 1st ed.; CRC Press: Boca Raton, FL, USA, 2008; p. 318. [Google Scholar]
- International Organisation of Vine and Wine (OIV). Compendium of International Methods of Analysis—Edition; OIV: Paris, France, 2016. [Google Scholar]
- Glories, Y. La couleur des vins rouges. Lre partie: Les équilibres des anthocyanes et des tanins. J. Int. Sci. Vigne Vin 1984, 18, 195–217. [Google Scholar] [CrossRef]
- Harbertson, J.F.; Kennedy, J.A.; Adams, D.O. Tannin in skins and seeds of Cabernet Sauvignon, Syrah, and Pinot noir berries during ripening. Am. J. Enol. Vitic. 2002, 53, 54–59. [Google Scholar]
- Boulton, R. The copigmentation of anthocyanins and its role in the color of red wine: A critical review. Am. J. Enol. Vitic. 2001, 52, 67–87. [Google Scholar]
- Asenstorfer, R.E.; Iland, P.G.; Tate, M.E.; Jones, G.P. Charge equilibria and pKa of malvidin-3-glucoside by electrophoresis. Anal. Biochem. 2003, 318, 291–299. [Google Scholar] [CrossRef]
- Ricci, A.; Parpinello, G.P.; Versari, A. Modelling the evolution of oxidative browning during storage of white wines: Effects of packaging and closures. Int. J. Food Sci. Technol. 2017, 52, 472–479. [Google Scholar] [CrossRef]
- Ramazzotti, S.; Filippetti, I.; Intrieri, C. Expression of genes associated with anthocyanin synthesis in red-purplish, pink, pinkish-green and green grape berries from mutated ‘Sangiovese’ biotypes: A case study. Vitis 2008, 47, 147–151. [Google Scholar]
- Bobeica, N.; Poni, S.; Hilbert, G.; Renaud, C.; Gomès, E.; Delrot, S.; Dai, Z. Differential responses of sugar, organic acids and anthocyanins to source-sink modulation in Cabernet Sauvignon and Sangiovese grapevines. Front. Plant Sci. 2015, 6, 1–14. [Google Scholar] [CrossRef] [PubMed]
- Valenti, L.; Ghiglieno, I.; Mattivi, F. Effect of leaf removal on grapes of Cabernet sauvignon and Sangiovese cultivated in different Italian environments. J. Food Sci. Eng. 2012, 2, 719–726. [Google Scholar]
- Sack, M.; Mueller, G. Scaled design of PEF treatment reactors for electroporation-assisted extraction processes. Innov. Food Sci. Emerg. Technol. 2016, 37, 400–406. [Google Scholar] [CrossRef]
- El Darra, N.; Turk, M.F.; Ducasse, M.A.; Grimi, N.; Maroun, R.G.; Louka, N.; Vorobiev, E. Changes in polyphenol profiles and color composition of freshly fermented model wine due to pulsed electric field, enzymes and thermovinification pretreatments. Food Chem. 2016, 194, 944–950. [Google Scholar] [CrossRef]
- Puértolas, E.; López, N.; Condón, S.; Álvarez, I.; Raso, J. Potential applications of PEF to improve red wine quality. Trends Food Sci. Technol. 2010, 21, 247–255. [Google Scholar] [CrossRef]
- de Freitas, V.A.P.; Fernandes, A.; Oliveira, J.; Teixeira, N.; Mateus, N. A review of the current knowledge of red wine colour. OENO One 2017, 51, 1604. [Google Scholar] [CrossRef]
- Escribano-Bailon, T.M.; Santos-Buelga, C. Anthocyanin copigmentation-evaluation, mechanisms and implications for the colour of red wines. Curr. Org. Chem. 2012, 16, 715–723. [Google Scholar] [CrossRef]
- Cheynier, V.; Dueñas-Paton, M.; Salas, E.; Maury, C.; Souquet, J.M.; Sarni-Manchado, P.; Fulcrand, H. Structure and properties of wine pigments and tannins. Am. J. Enol. Vitic. 2006, 57, 298–305. [Google Scholar]
- Pascual, O.; González-Royo, E.; Gil, M.; Gómez-Alonso, S.; García-Romero, E.; Canals, J.M.; Hermosín-Gutíerrez, I.; Zamora, F. Influence of grape seeds and stems on wine composition and astringency. J. Agric. Food Chem. 2016, 64, 6555–6566. [Google Scholar] [CrossRef]
- Mpelasoka, B.S.; Schachtman, D.P.; Treeby, M.T.; Thomas, M.R. A review of potassium nutrition in grapevines with special emphasis on berry accumulation. Aust. J. Grape Wine Res. 2003, 9, 154–168. [Google Scholar] [CrossRef]
- Jeremic, J.; Vongluanngam, I.; Ricci, A.; Parpinello, G.P.; Versari, A. The oxygen consumption kinetics of commercial oenological tannins in model wine solution and Chianti red wine. Molecules 2020, 25, 1215. [Google Scholar] [CrossRef]
- Luo, W.; Zhang, R.B.; Wang, L.M.; Chen, J.; Guan, Z.C. Conformation changes of polyphenol oxidase and lipoxygenase induced by PEF treatment. J. Appl. Electrochem. 2010, 40, 295–301. [Google Scholar] [CrossRef]
- Cuadrado, M.U.; Pérez-Juan, P.M.; de Castro, M.D.L.; Gómez-Nieto, M.A. A fully automated method for in real time determination of laccase activity in wines. Anal. Chim. Acta 2005, 553, 99–104. [Google Scholar] [CrossRef]
- De Leonardis, A.; Lustrato, G.; Macciola, V.; Ranalli, G. Application of chemical and physical agents in model systems to controlling phenoloxidase enzymes. Eur. Food Res. Technol. 2010, 231, 603–610. [Google Scholar] [CrossRef]
- El Darra, N.; Grimi, N.; Maroun, R.G.; Louka, N.; Vorobiev, E. Pulsed electric field, ultrasound, and thermal pretreatments for better phenolic extraction during red fermentation. Eur. Food Res. Technol. 2013, 236, 47–56. [Google Scholar] [CrossRef]
- Delsart, C.; Ghidossi, R.; Poupot, C.; Cholet, C.; Grimi, N.; Vorobiev, E.; Milisic, V.; Peuchot, M.M. Enhanced extraction of phenolic compounds from Merlot grapes by pulsed electric field treatment. Am. J. Enol. Vitic. 2012, 63, 205–211. [Google Scholar] [CrossRef]


© 2020 by the authors. Licensee MDPI, Basel, Switzerland. This article is an open access article distributed under the terms and conditions of the Creative Commons Attribution (CC BY) license (http://creativecommons.org/licenses/by/4.0/).