Article

Coffee Drinking and Emotions: Are There Key Sensory Drivers for Emotions? †

1
Independent Restauranteur, 250/3 Sukhumvit 55/8, Bangkok 10110, Thailand
2
The Wolf Group, 10860 Kenwood Road, Cincinnati, OH 45242, USA
3
Center for Sensory Analysis and Consumer Behavior, Kansas State University, Manhattan, KS 66506, USA
4
Department of Food Science & Technology, University of Georgia, Griffin, GA 30223, USA
*
Author to whom correspondence should be addressed.
Data for this manuscript was collected at Center for Sensory Analysis and Consumer Behavior, Kansas State University, Manhattan, KS 66506, USA.
Beverages 2019, 5(2), 27; https://doi.org/10.3390/beverages5020027
Submission received: 18 December 2018 / Revised: 10 February 2019 / Accepted: 1 March 2019 / Published: 1 April 2019
(This article belongs to the Special Issue Coffee and its Consumption: Benefits and Risks)

Abstract

:
In the past couple of decades the coffee market has exploded, and to remain competitive, it is important to identify the key drivers for consumer acceptance of coffee. This study expanded on the previous emotion study on a population of coffee drinkers in Manhattan, Kansas, USA and focused on identifying the sensory drivers of emotional responses elicited during the coffee drinking experience (CDE). A trained coffee panel performed a descriptive analysis of six coffee samples and identified the key sensory attributes that discriminated each coffee. Utilizing Partial Least Square Regression (PLSR), the descriptive data were then mapped with the emotion data to identify sensory drivers for eliciting the emotional responses. The sensory characteristics of dark roast coffee (roast–aroma and flavor, burnt–aroma and flavor, bitter, and body) might elicit positive-high energy feelings for this population of coffee users. Tobacco (flavor) and cocoa (aroma) may also be responsible for positive emotions (content, good, and pleasant). Citrus and acidity seemed to be negative sensory drivers as they induced the feeling of off-balance. Sensory descriptive data could be useful to describe emotion profiles elicited by coffee drinking, which could help the coffee industry create coffee products for different segments of coffee drinkers.

1. Introduction

Human senses are powerful elicitors of emotions and the interactions between the two are rarely debated [1,2,3]. A number of studies have attempted to define and categorize human emotion, but it is only recently that emotions have been linked to acceptance of food and beverage. Nowadays, there is more awareness that the emotional experiences consumers receive from a product via sensory perception determine acceptability and consumption [4,5]. Therefore, assessment of the emotional responses elicited by the sensorial experience during product consumption is also vital. Several researchers have developed emotion scales to measure the affective feelings evoked by product consumption (EsSense Profile™) [6] or by olfactory stimulations from everyday odors (Geneva Emotion and Odor Scale) [1].
The emotions elicited by the coffee drinking experience were identified in our previous work [7], where they determined a list of 44 emotions suitable for defining the ‘Coffee Drinking Experience (CDE)’ and provided the emotion profiles for each segment of coffee drinkers. The consumers in the study were clustered in six consumer segments. To have a complete understanding of consumers’ perceptions, it is important to understand the sensory characteristics that elicit those emotions experienced during coffee consumption.
Coffee is well known for its complex sensory characteristics and is often consumed for the sensory experience it provides, in addition to the physiological stimulation of the caffeine [8,9,10,11]. Coffee is one of the few food products that utilizes specialized experts (cuppers) to ensure that the sensory properties are up to standard. These experts are not trained sensory assessors but have a lot of experience in determining the quality of coffee for commercial purposes [12]. Trained sensory panels are used extensively for understanding the sensory characteristics of food products including coffee. Bhumiratana et al. [13] conducted a descriptive analysis study on aroma evolution in coffee beans when they are subjected to roasting to different levels of roast. Due to its high complexity, the descriptive sensory panel may need training specifically for coffee, in addition to the usual intensive training program on the sensory characteristics of food and beverage. Many studies support that the amount of training and regular re-training correlate with panelist perception of the sensory attributes and increases the quantification accuracy of attribute intensities [14,15,16,17]. Recently, a “living” lexicon for descriptive analysis of brewed coffee was developed by Chambers IV et al. [18] that can be used by sensory researchers for descriptive analysis of coffee.
The link between emotion profiles for a food product and its descriptive sensory profile to understand drivers of positive and negative emotions during consumption has been explored to a limited extent by sensory researchers. Interestingly, the two studies the authors found are on dark chocolates but neither used the classic descriptive approach in their respective study [4,19]. Thomson et al. [4] utilized best–worst scaling to gather sensory information on nine dark chocolates from consumers. They also asked the consumers to identify five emotion descriptors from a pre-conceptualized list that come to their mind for each chocolate. The conceptual biplot between the sensory data and the emotions revealed that the sensory differences in products could drive, in part, conceptual differences due to the emotional response. In another study, Jager et al. [19] reported the link between temporal dominance of sensation (TDS; analytical data) and temporal dominance of emotions (TDE; affective data) using unflavored and flavored dark chocolates. The unflavored dark chocolates (70% and 85% cocoa content) characterized by bitter, dry, and cocoa flavor were linked to aggressive, bored, calm, and guilty emotions, while the fruit-flavored dark chocolates (orange and blueberry) that were characterized by crunchy, fruit, and sweet elicited interested, happy, and loving emotions. The fruit-flavored chocolates were liked more by the consumers as was evident through their emotional response as well. The main objective of our study was to identify sensory drivers of emotional response to the experience of coffee drinking. A trained coffee panel performed descriptive analysis on the coffee samples that were used to elicit emotions in coffee drinkers. The sensory data was then utilized to determine the sensory drivers for emotional responses in each segment (cluster) of consumers as reported in Bhumiratana et al. [7].

2. Materials and Methods

2.1. Descriptive Panel

The descriptive coffee panel from the Wolf group (Cincinnati, OH, USA) was utilized to evaluate the coffee samples. The panel consisted of six highly-trained members who had completed 120 h of general training and had a minimum of 1200 h of sensory testing of food and beverages. The coffee panelists also completed an additional 120 h of training on various coffee stimuli and key attributes (coffee, robusta, roasted, burnt, earthy, rioy, acidity, bitter, and body). Performance of the panel is evaluated every 3 months in the form of a blind reference sample or samples. This coffee panel has been evaluating coffee products regularly for over 2 years before doing this study.

2.2. Coffee Samples

The six single-serve coffee samples (K-Cup® Keurig, Inc.; Reading, MA, USA) were evaluated by the descriptive sensory panel. These single-serve coffee samples represented the range of roast levels from light to dark. Green Mountain Breakfast Blend represented the light roast. Green Mountain Nantucket Blend represented the blend of medium roasted African and Indonesian beans mixed with some French roast. Green Mountain Sumatra Reserved represented dark roasted organic Sumatra coffee. Tully’s Kona represented the blend including the famous Hawaiian coffee from the Kona Typica varietal, and was classified as medium roast. Tully’s Italian Roast represented a blend of dark roast. Lastly, Newman’s Own Organic represented a blend of medium and dark roast organic coffee beans. All coffee samples were stored at room temperature (20 °C) until testing and were used in the study within six weeks of their delivery.

2.3. Descriptive Sensory Analysis

2.3.1. Sample Preparation and Serving

Keurig® Special Edition B60 Brewing System (Keurig®, Inc.; Reading, MA, USA) was used to brew the single-serve K-Cup® coffee samples. The machine was set up and cleaned following the instructions in the user manual. A K-Cup was placed in the K-Cup holder and 157.5 mL of coffee was brewed into a styrofoam cup (Dart J-cup, Dart Container Corp.; Mason, OH, USA). The coffee cups were labeled with 3-digit random numbers prior to serving. After each brewing cycle was completed, the K-Cup was removed and discarded immediately. Each coffee cup was covered with either a saucer (Econo Rim, Syracuse China; Lyncourt, NY, USA) or a plastic lid (Dart Container Corp.; Mason, OH, USA) and was then served immediately to the panelists monadically in random order.

2.3.2. Sample Evaluation

A 180 min orientation session was completed to familiarize the descriptive panel with the samples. During orientation, the panel identified and defined aroma, flavor, and texture attributes present in each sample (Table 1). Necessary references were determined to anchor and calibrate the intensity measurement on a 0 to 15-point scale with 0.5 increments (0.0 = none; 15.0 = extremely high intensity).
Outlined in the following paragraph is the structured tasting protocol: Once the coffee was served, panelists opened the lid and the temperature of the coffee was taken with a digital thermometer (Model T220/38A Latte Thermometer, Comark; Hertfordshire, UK). When the temperature reached 65.5 °C, the lid was replaced, keeping one end slightly opened. The panelists took a sniff to identify aroma descriptors belonging to that particular coffee. Panelists then slurped the sample and gently manipulated it in the mouth for 10–20 s to evaluate flavor and body/mouthfeel attributes. A small amount of sample was swallowed to discern bitterness on the back of the tongue. Afterward samples were expectorated. A 10 min break was taken between each sample, during which buttered bread and distilled water were used as palate cleansers. Buttered bread was prepared by spreading Land O’Lakes Whipped Butter (Whipped Butter Sweet Cream, Salted, 45% less fat, Land O’Lakes, Inc.; Arden Hills, MN, USA) on a ¾ cm slice of European Batard bread (Kroger; Cincinnati, OH, USA).
During testing, panelists evaluated four samples per 180 min panel session. Samples were served one at a time and tasted individually by each panelist. A group discussion was then initiated by a panel leader to determine attributes present, their strengths, and to identify which references were needed. A new cup of the same sample was then served, along with references. The panel then individually evaluated the sample on ballots. The ratings were collected and written on the board by the panel leader. This was to identify any problem areas and whether other references should be reviewed. The panelists then determined and recorded their final score for the first replication of the sample. The next sample was served after a 10 min break and was evaluated following the same procedure. Two replications were carried out for the entire descriptive study.

2.4. Emotion Data

The emotion data for the coffee samples were collected from 94 coffee drinkers (consumers) as reported in Bhumiratana et al. [7]. The consumers were between the ages of 18–70 years and there were 63 female and 31 male participants. In brief, the emotion profile data for each of the six coffees for the 44 terms in CDE (Appendix A) were used. Intensity of emotion elicited by the coffee drinking experience were measured before and during consumption using a 5-point numerical scale (1 = not at all; 2 = slightly; 3 = moderately; 4 = very much; 5 = extremely). The emotion ratings prior to the coffee evaluation were subtracted from the emotion ratings during the evaluation before analyzing the data. Hierarchical cluster analysis (HCA) using Ward’s method was carried out on the overall liking data of the six coffee samples. The emotion profiles for each coffee were then separated for the six consumer clusters (Appendix B) and were used in this study. Appendix B also shows the mean liking scores for the coffee samples for each cluster.

2.5. Statistical Analyses

Randomized complete block design was used for the descriptive evaluation of the six coffee samples. A two-way Analysis of Variance (ANOVA) using the GLIMMIX procedure (SAS® system version 9.2; SAS institute; Cary, NC, USA) at a 5% level of significance was performed on the data set to determine attributes significant in identifying differences among products. Coffee sample was the fixed effect and panelist was set as a random effect. Post-hoc mean separation was carried out by using Fisher’s Least Significant Difference. Principal component analysis (XLSTAT Sensory 19.01; Addinsoft, NY, USA) with covariance matrix was performed on the sensory descriptors to understand the sensory profile of the coffee samples.
To investigate the relationship between the sensory attributes and the emotional responses to the drinking experience, partial least squares repression (XLSTAT Sensory 19.01) was conducted. Sensory drivers associated with the emotional experiences were identified among the 94 coffee users and in each consumer cluster.

3. Results and Discussion

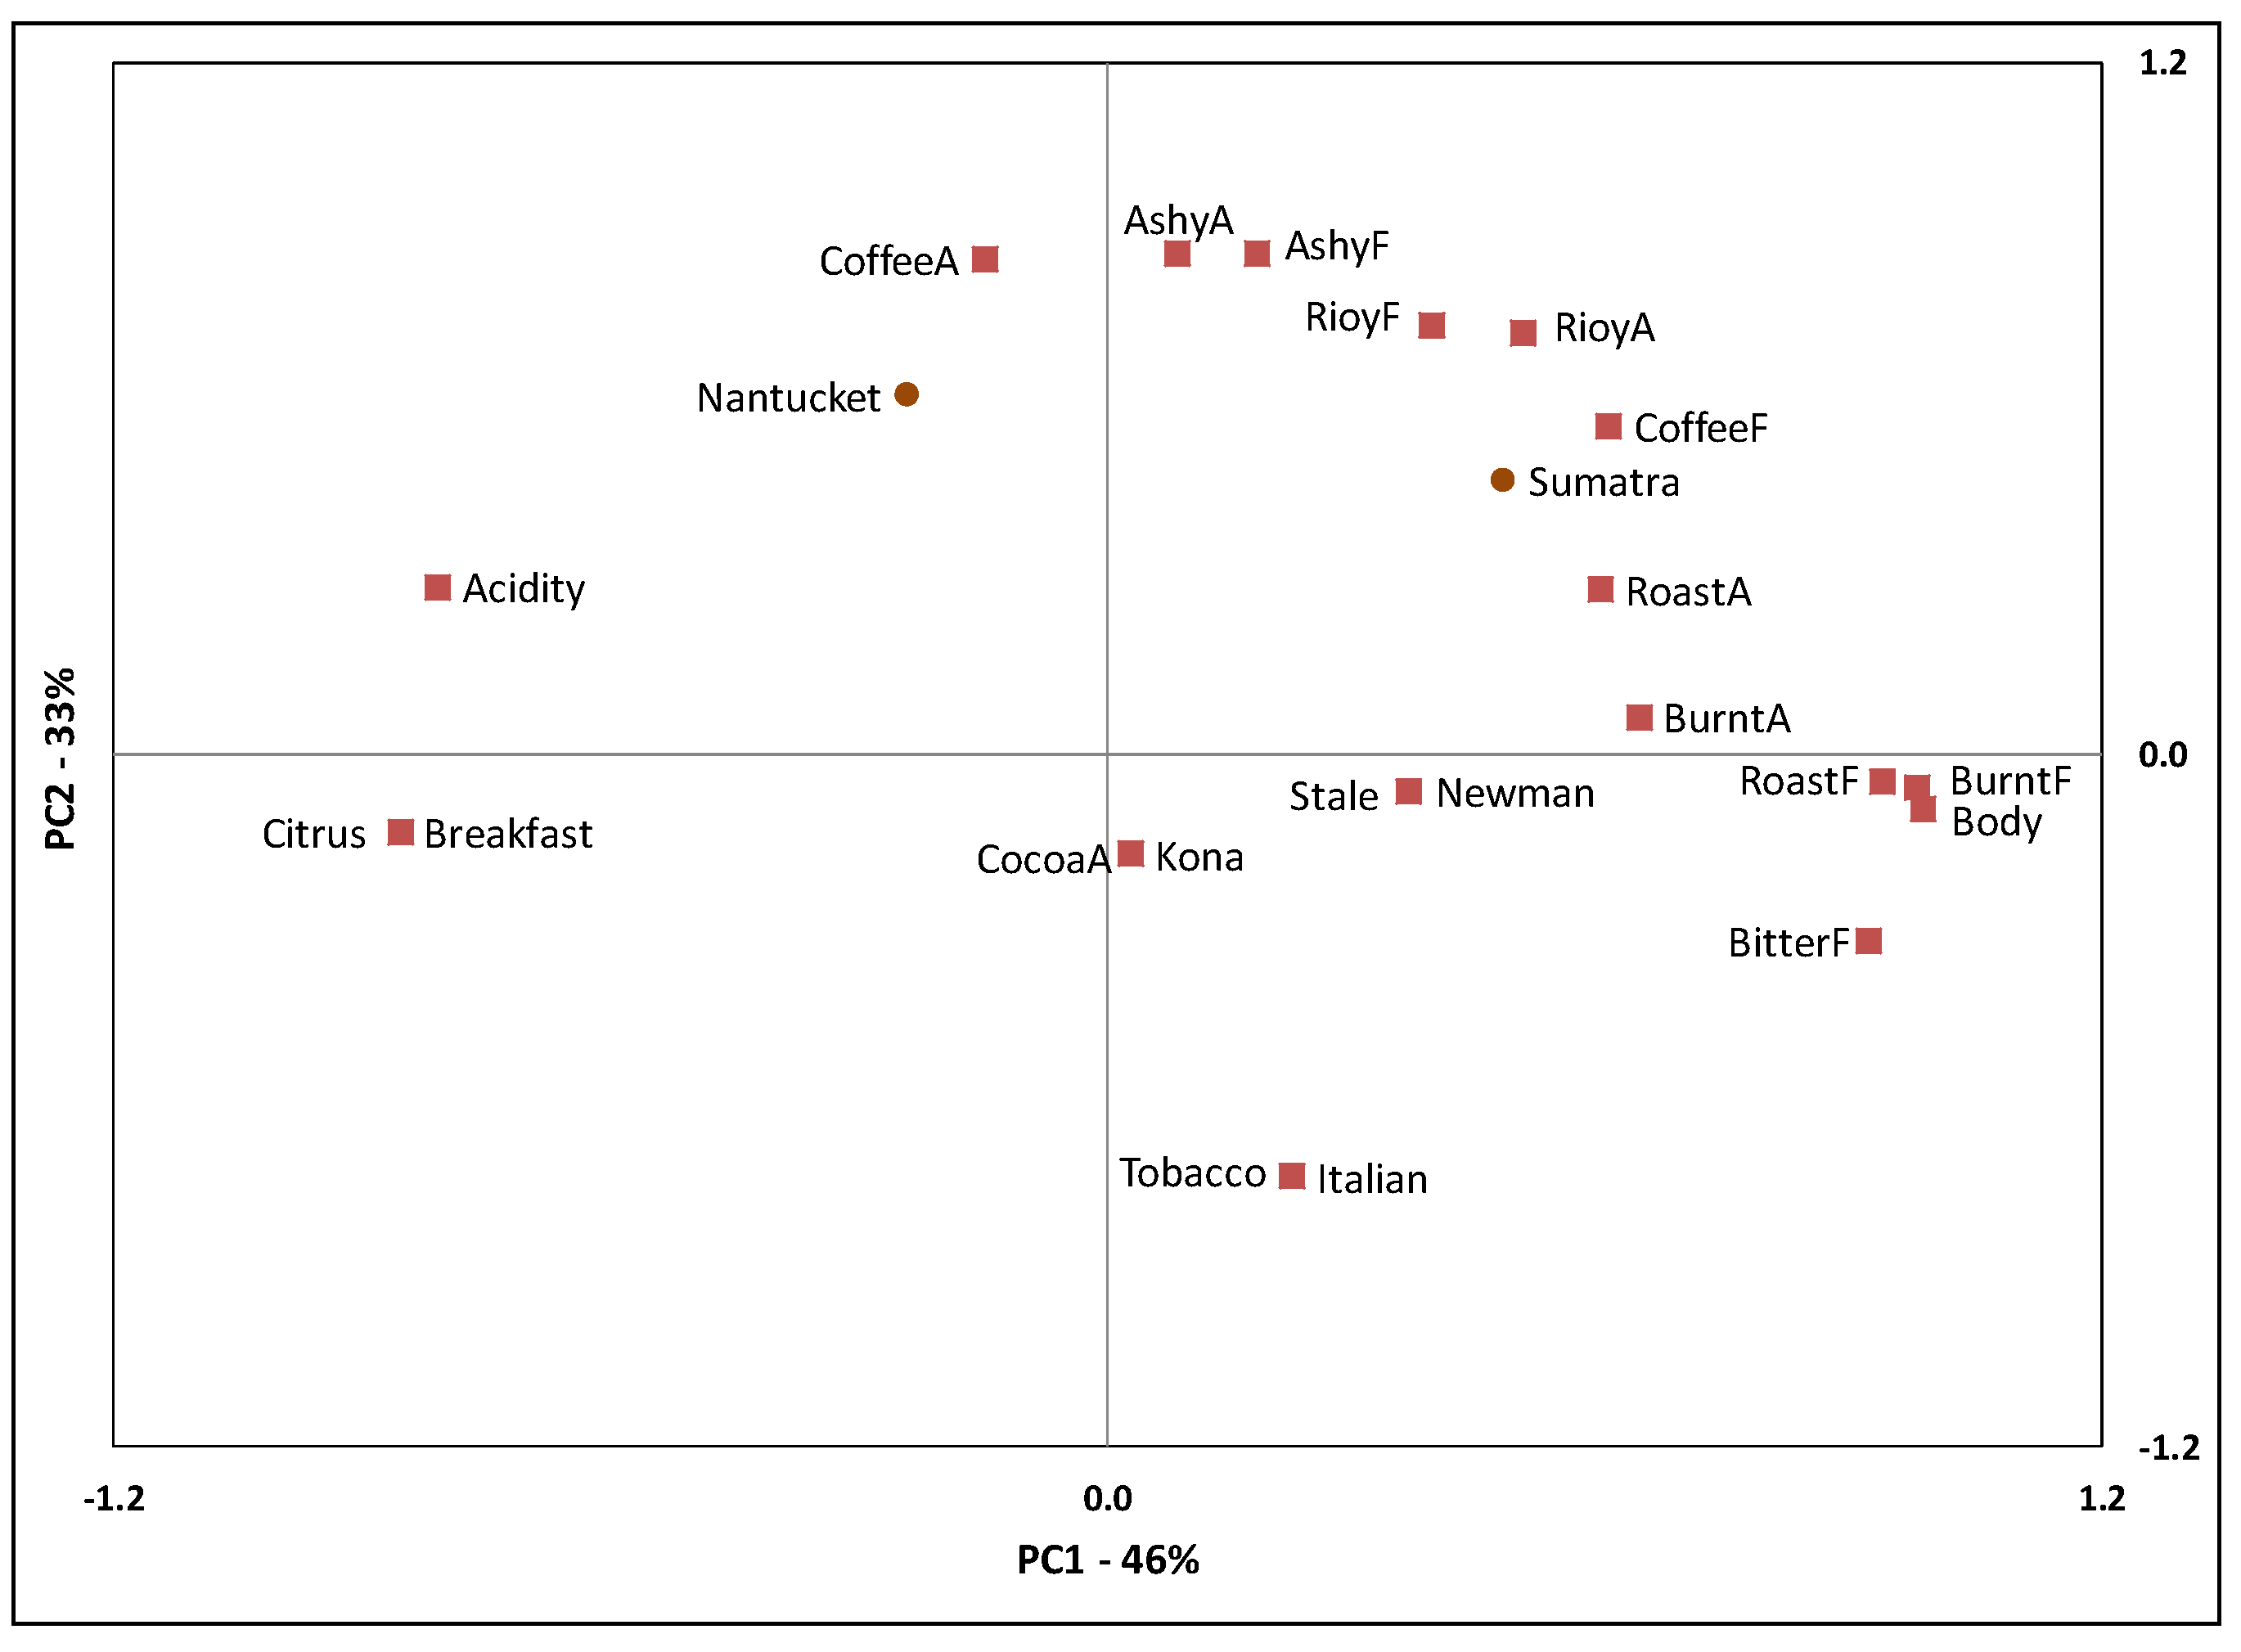
3.1. Descriptive Sensory Data

The ANOVA followed by mean separation indicated significant differences among the six coffee samples (p-value < 0.05) as shown in Table 2. The coffee descriptive panel differentiated sensory elements that were distinctive to each coffee sample. Ashy was identified in Nantucket and Sumatra and was perceived to be more intense in Nantucket (a medium roast). Rioy was detected at the same intensity level in Nantucket, Newman, and Sumatra, but was not present in the other samples. Tobacco appeared in the Italian sample, stale underlined Newman, and cocoa aroma was unique to Kona.
Principal component analysis (PCA) was performed to visualize the product placements on the sensory space based on the sensory attributes. Figure 1 illustrates sensory profiles of the coffees created by the coffee panel in the PCA biplot.
PC1 explained 46% of the data variation and seemed to reflect characteristics generated by roasting. Acidity and citrus anchored the left side of PC1 and described Breakfast. Burnt, roast, bitter flavors and body anchored the right side of PC1 and seemed to characterize Newman and Sumatra. Acidity, bitter, burnt (flavor and aroma), roast flavor, coffee flavor (except for Italian) and body were influenced by degree of roasting. Acidity was more intense in the lighter roasts, while bitter, burnt (flavor and aroma), roast, and coffee flavors, and body increased with degree of roasting. The impact of degree of roasting on aroma and flavor in coffee has been extensively studied [11,13,20,21,22] and is similar to what was found in this research. However, degree of roasting was not the only factor affecting the sensory characteristics of coffee. PC2 explained 33% of the data set and provided additional information on sensory elements for Nantucket, Kona, and Italian. Coffee aroma and roast aroma did not seem to be dependent on roast level. The intensities of these aroma attributes for Nantucket (medium roast) were higher than Newman (medium-dark roast). The sensory profiles indicated some sensory attributes might be independent of degree of roasting, which confirmed that other factors might be influencing the sensory characteristics of coffee. The origins of coffee, including growing regions and variety of bean, evidently have a noticeable impact on the sensory fingerprint of each coffee; this is supported by numerous studies [11,13,23,24,25,26].
The sensory data from the descriptive panel was then utilized in the next step to identify the sensory drivers responsible for the emotional responses elicited by the coffee drinking experience.

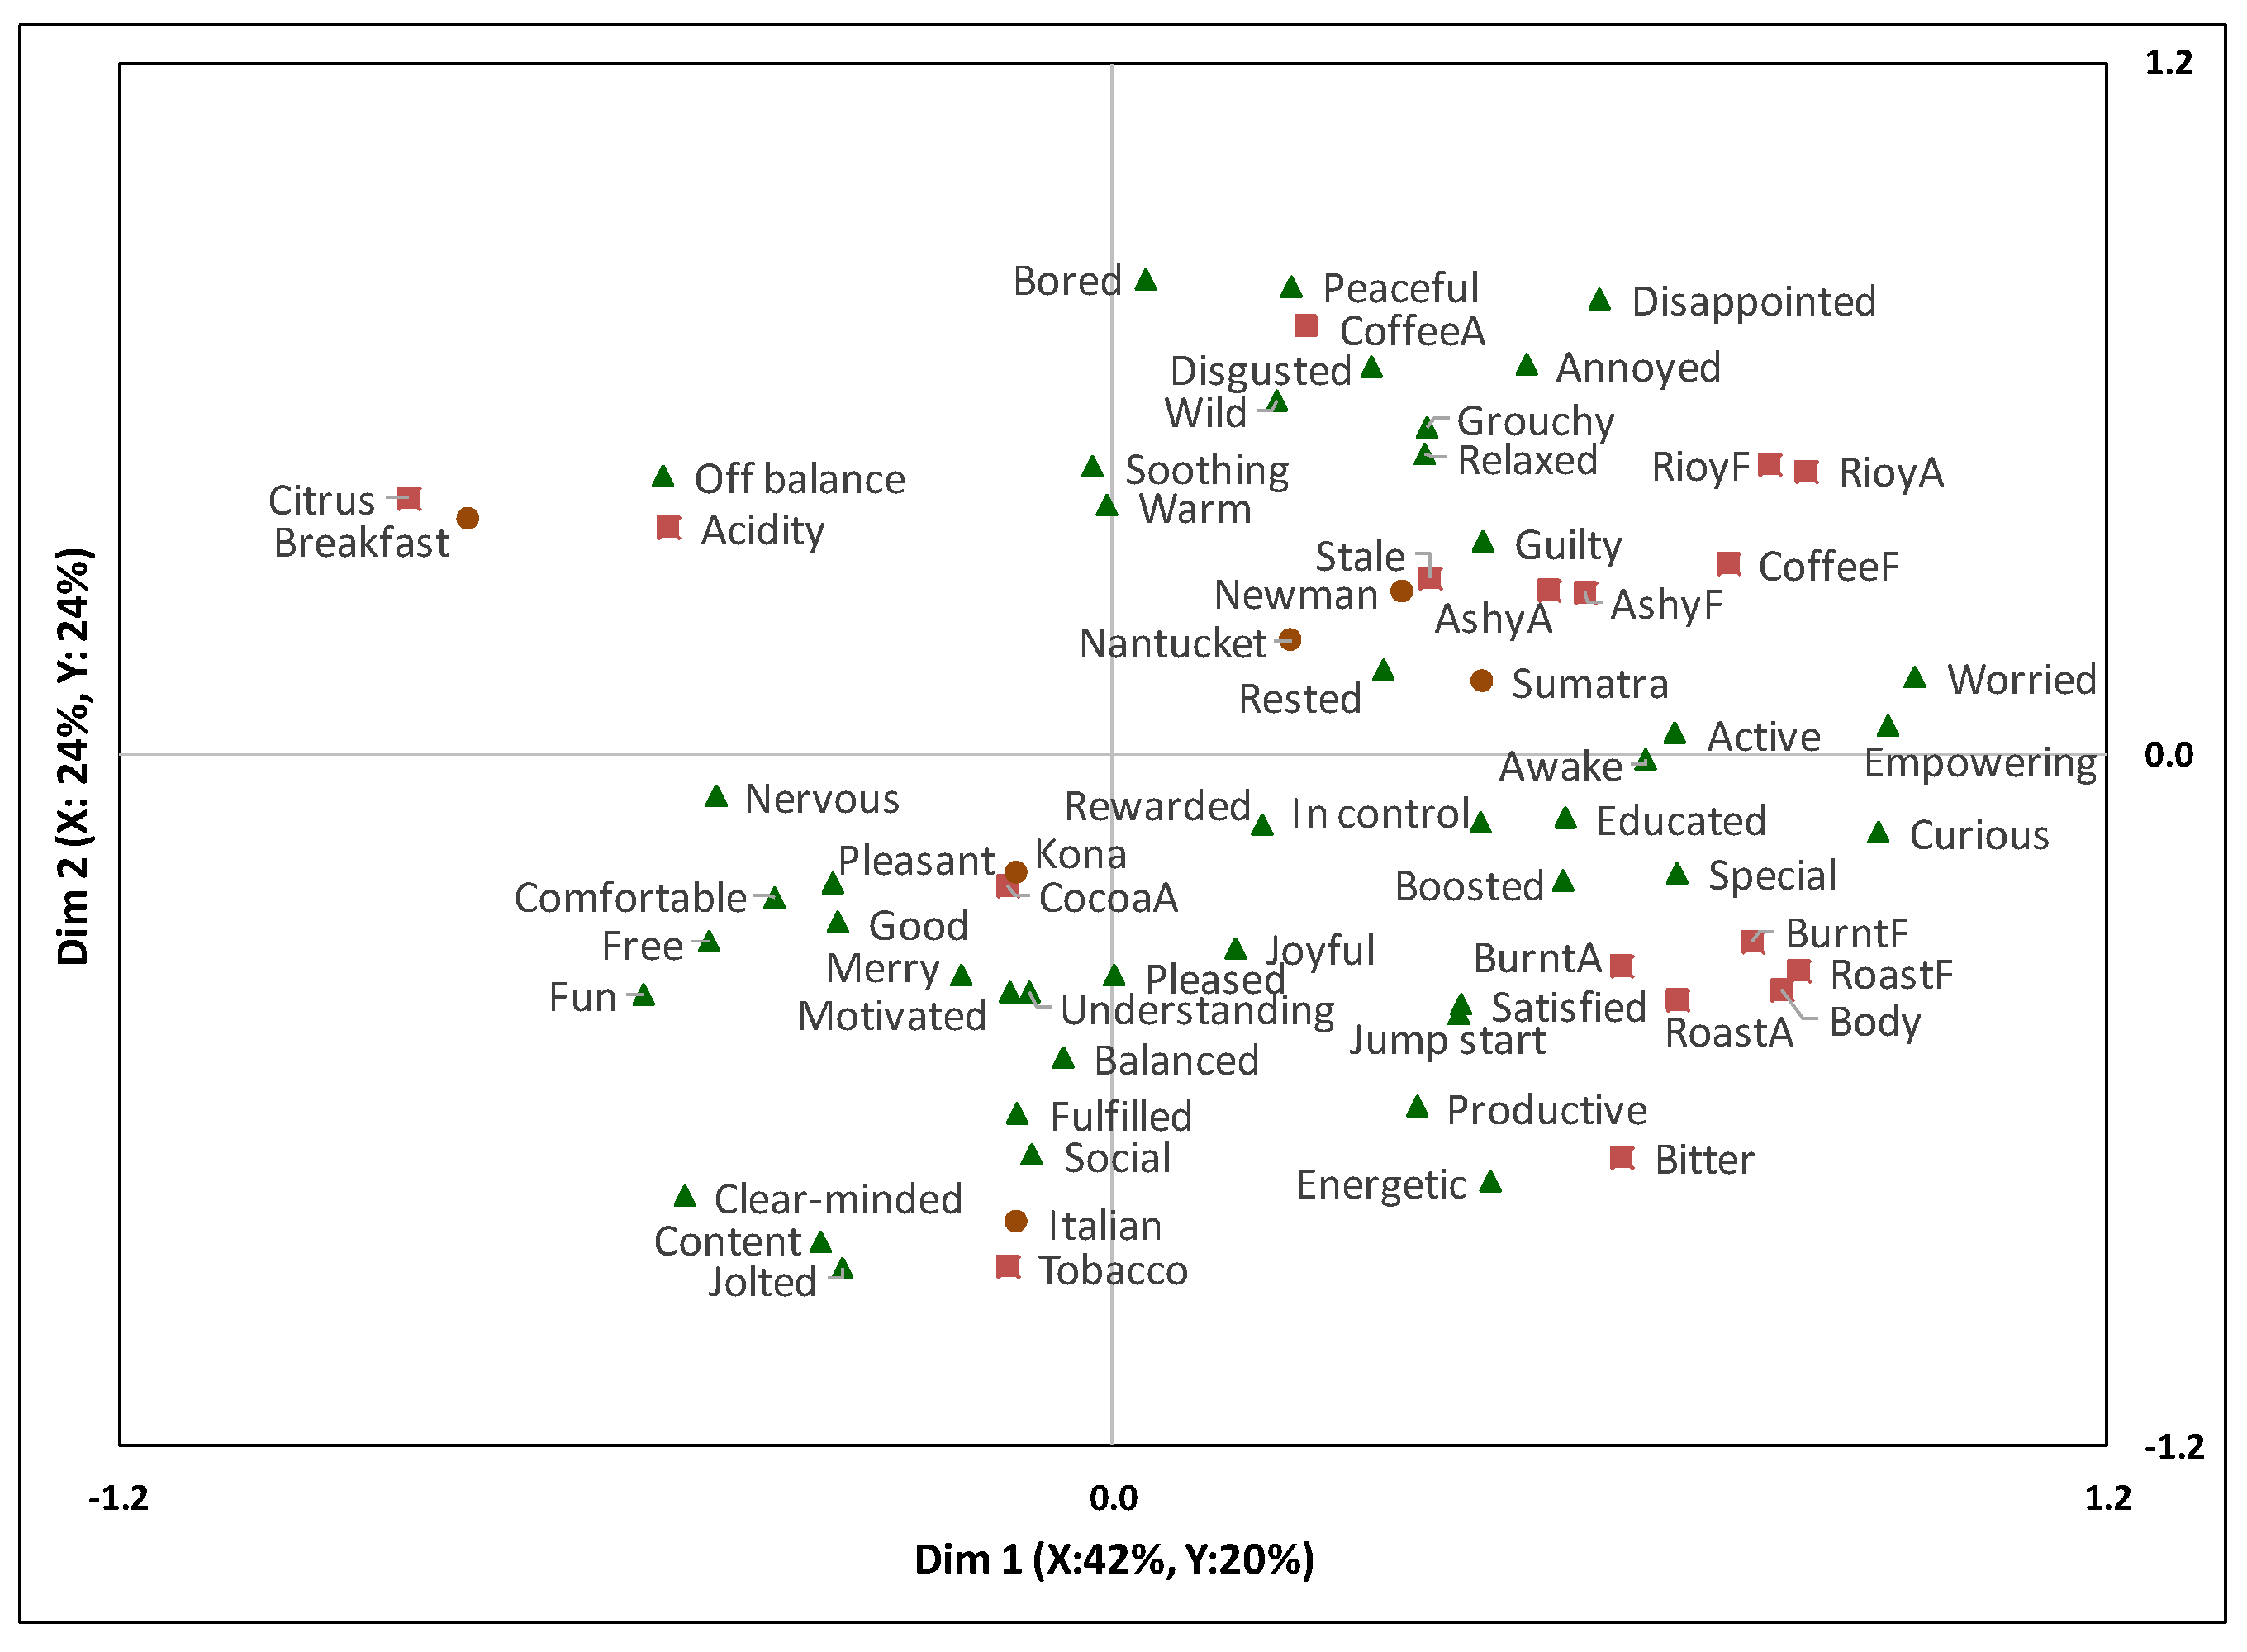
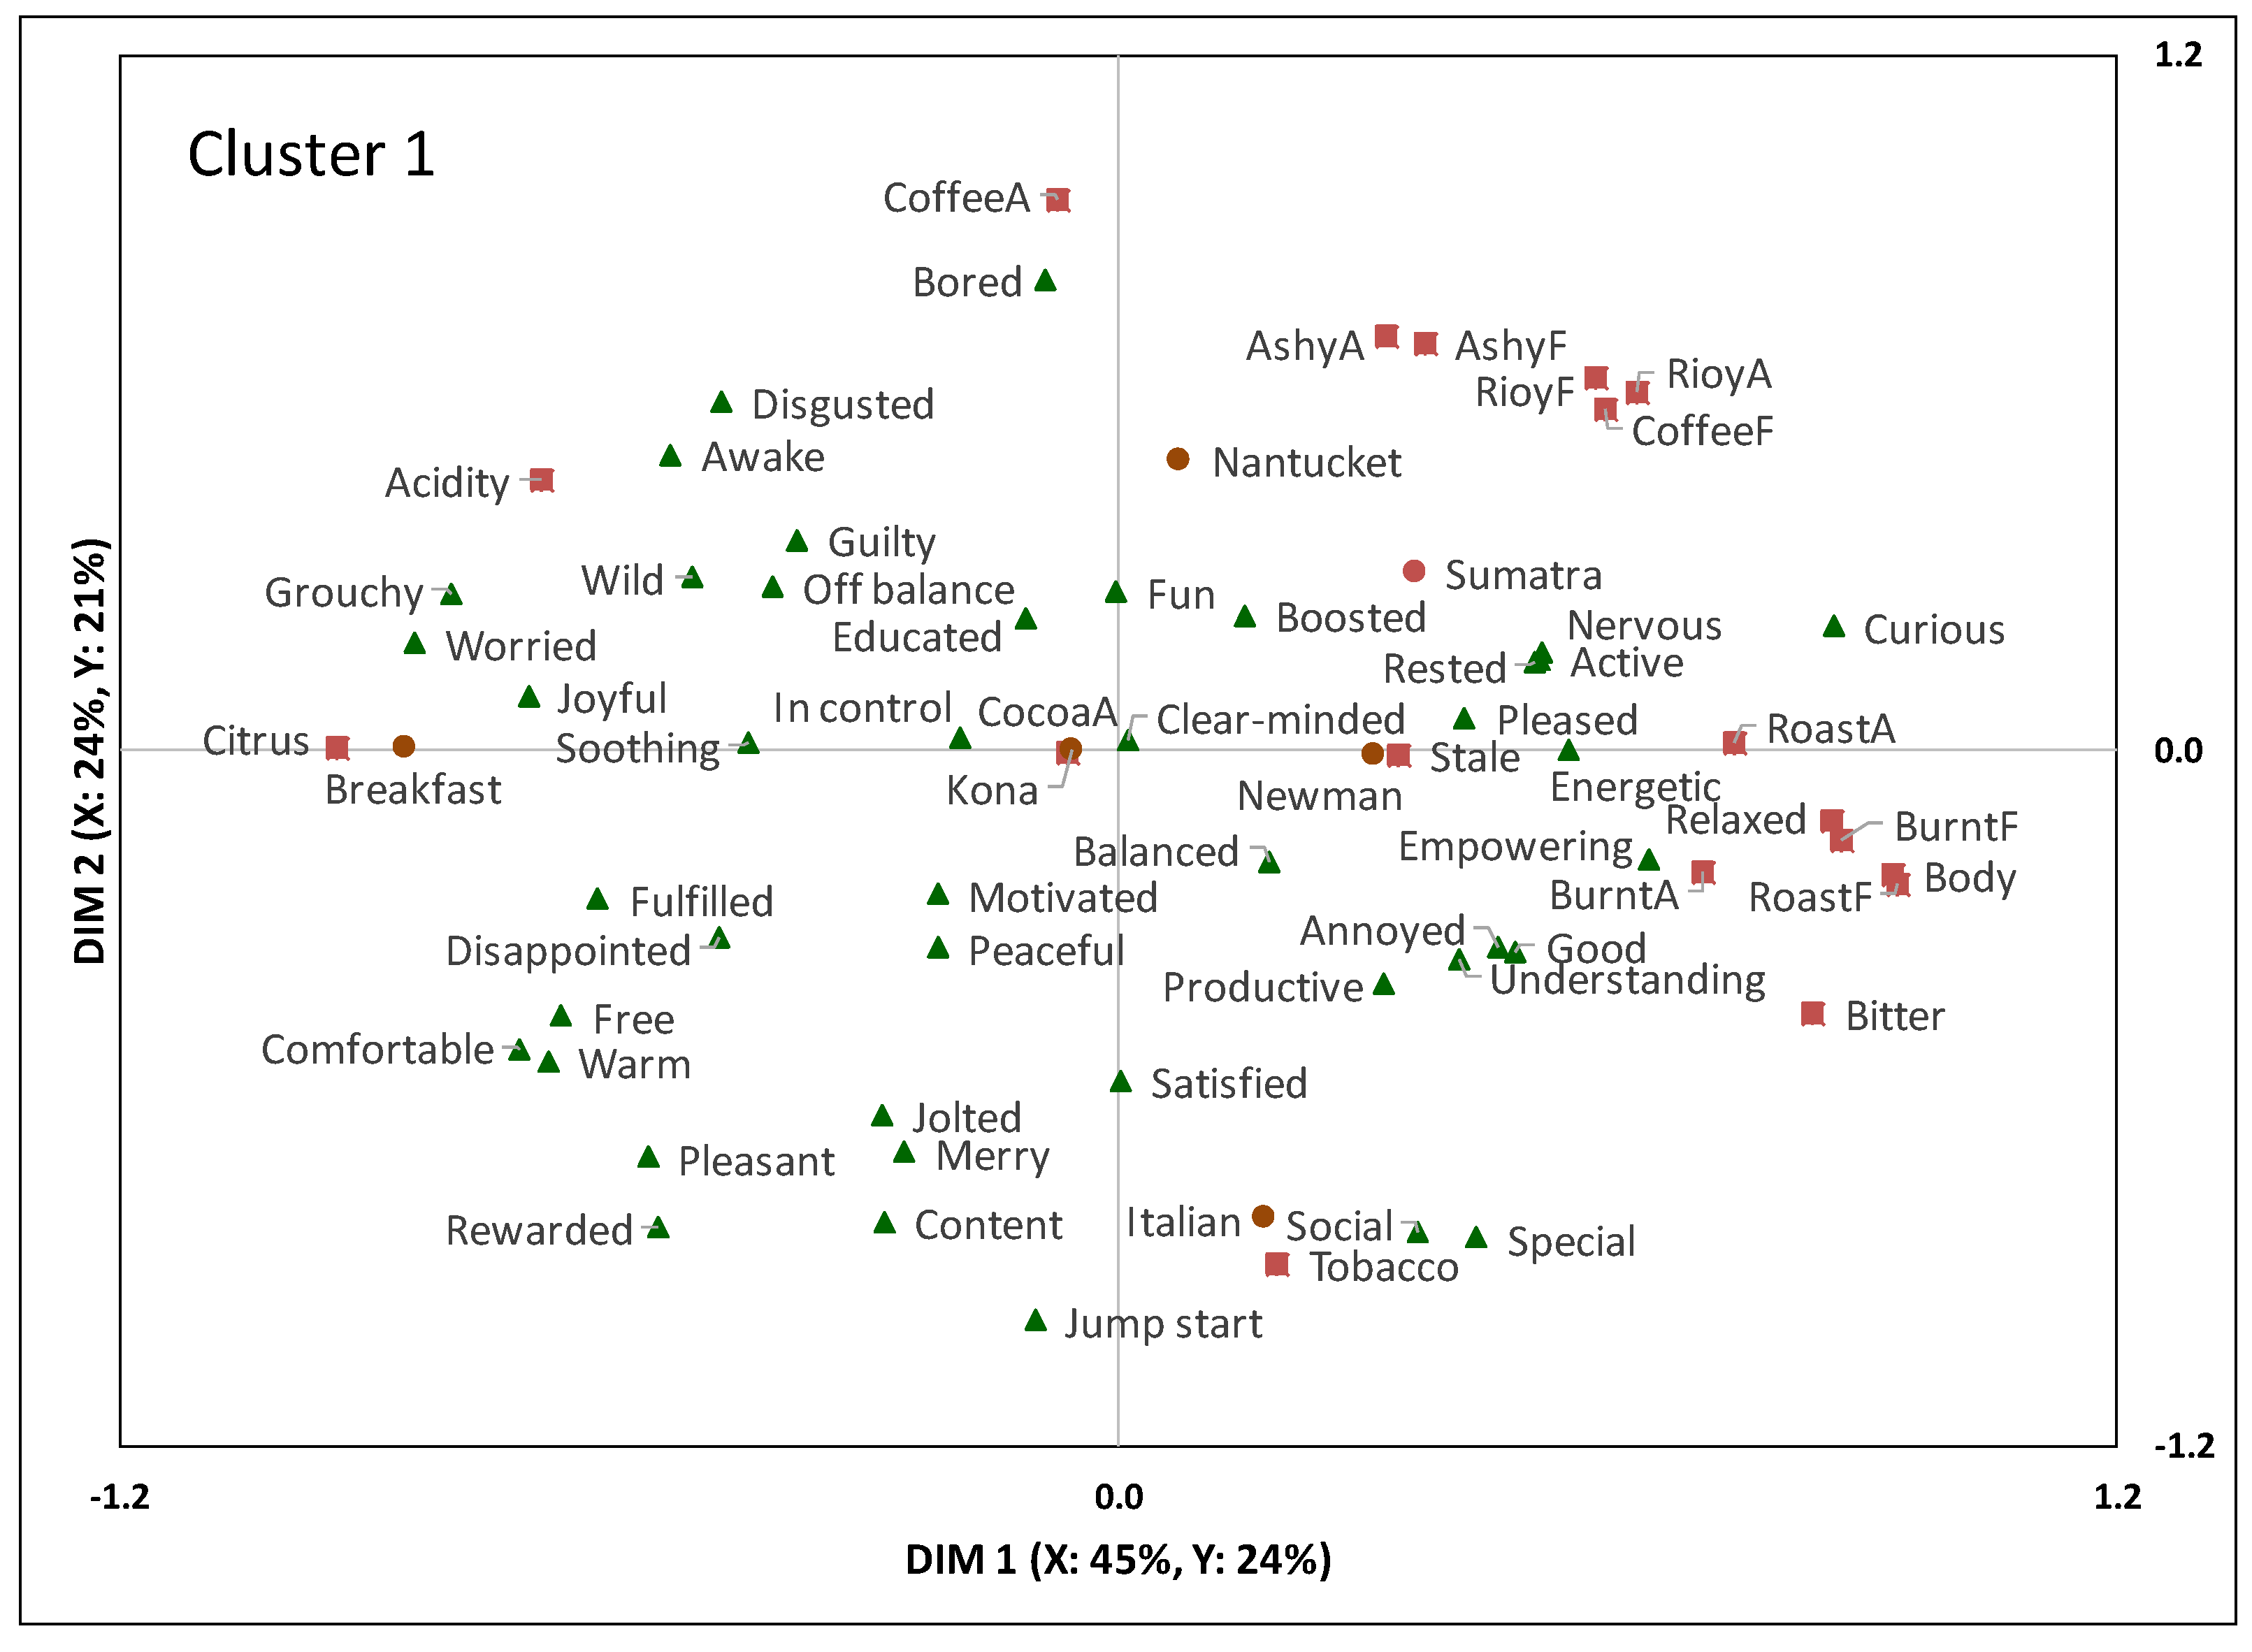
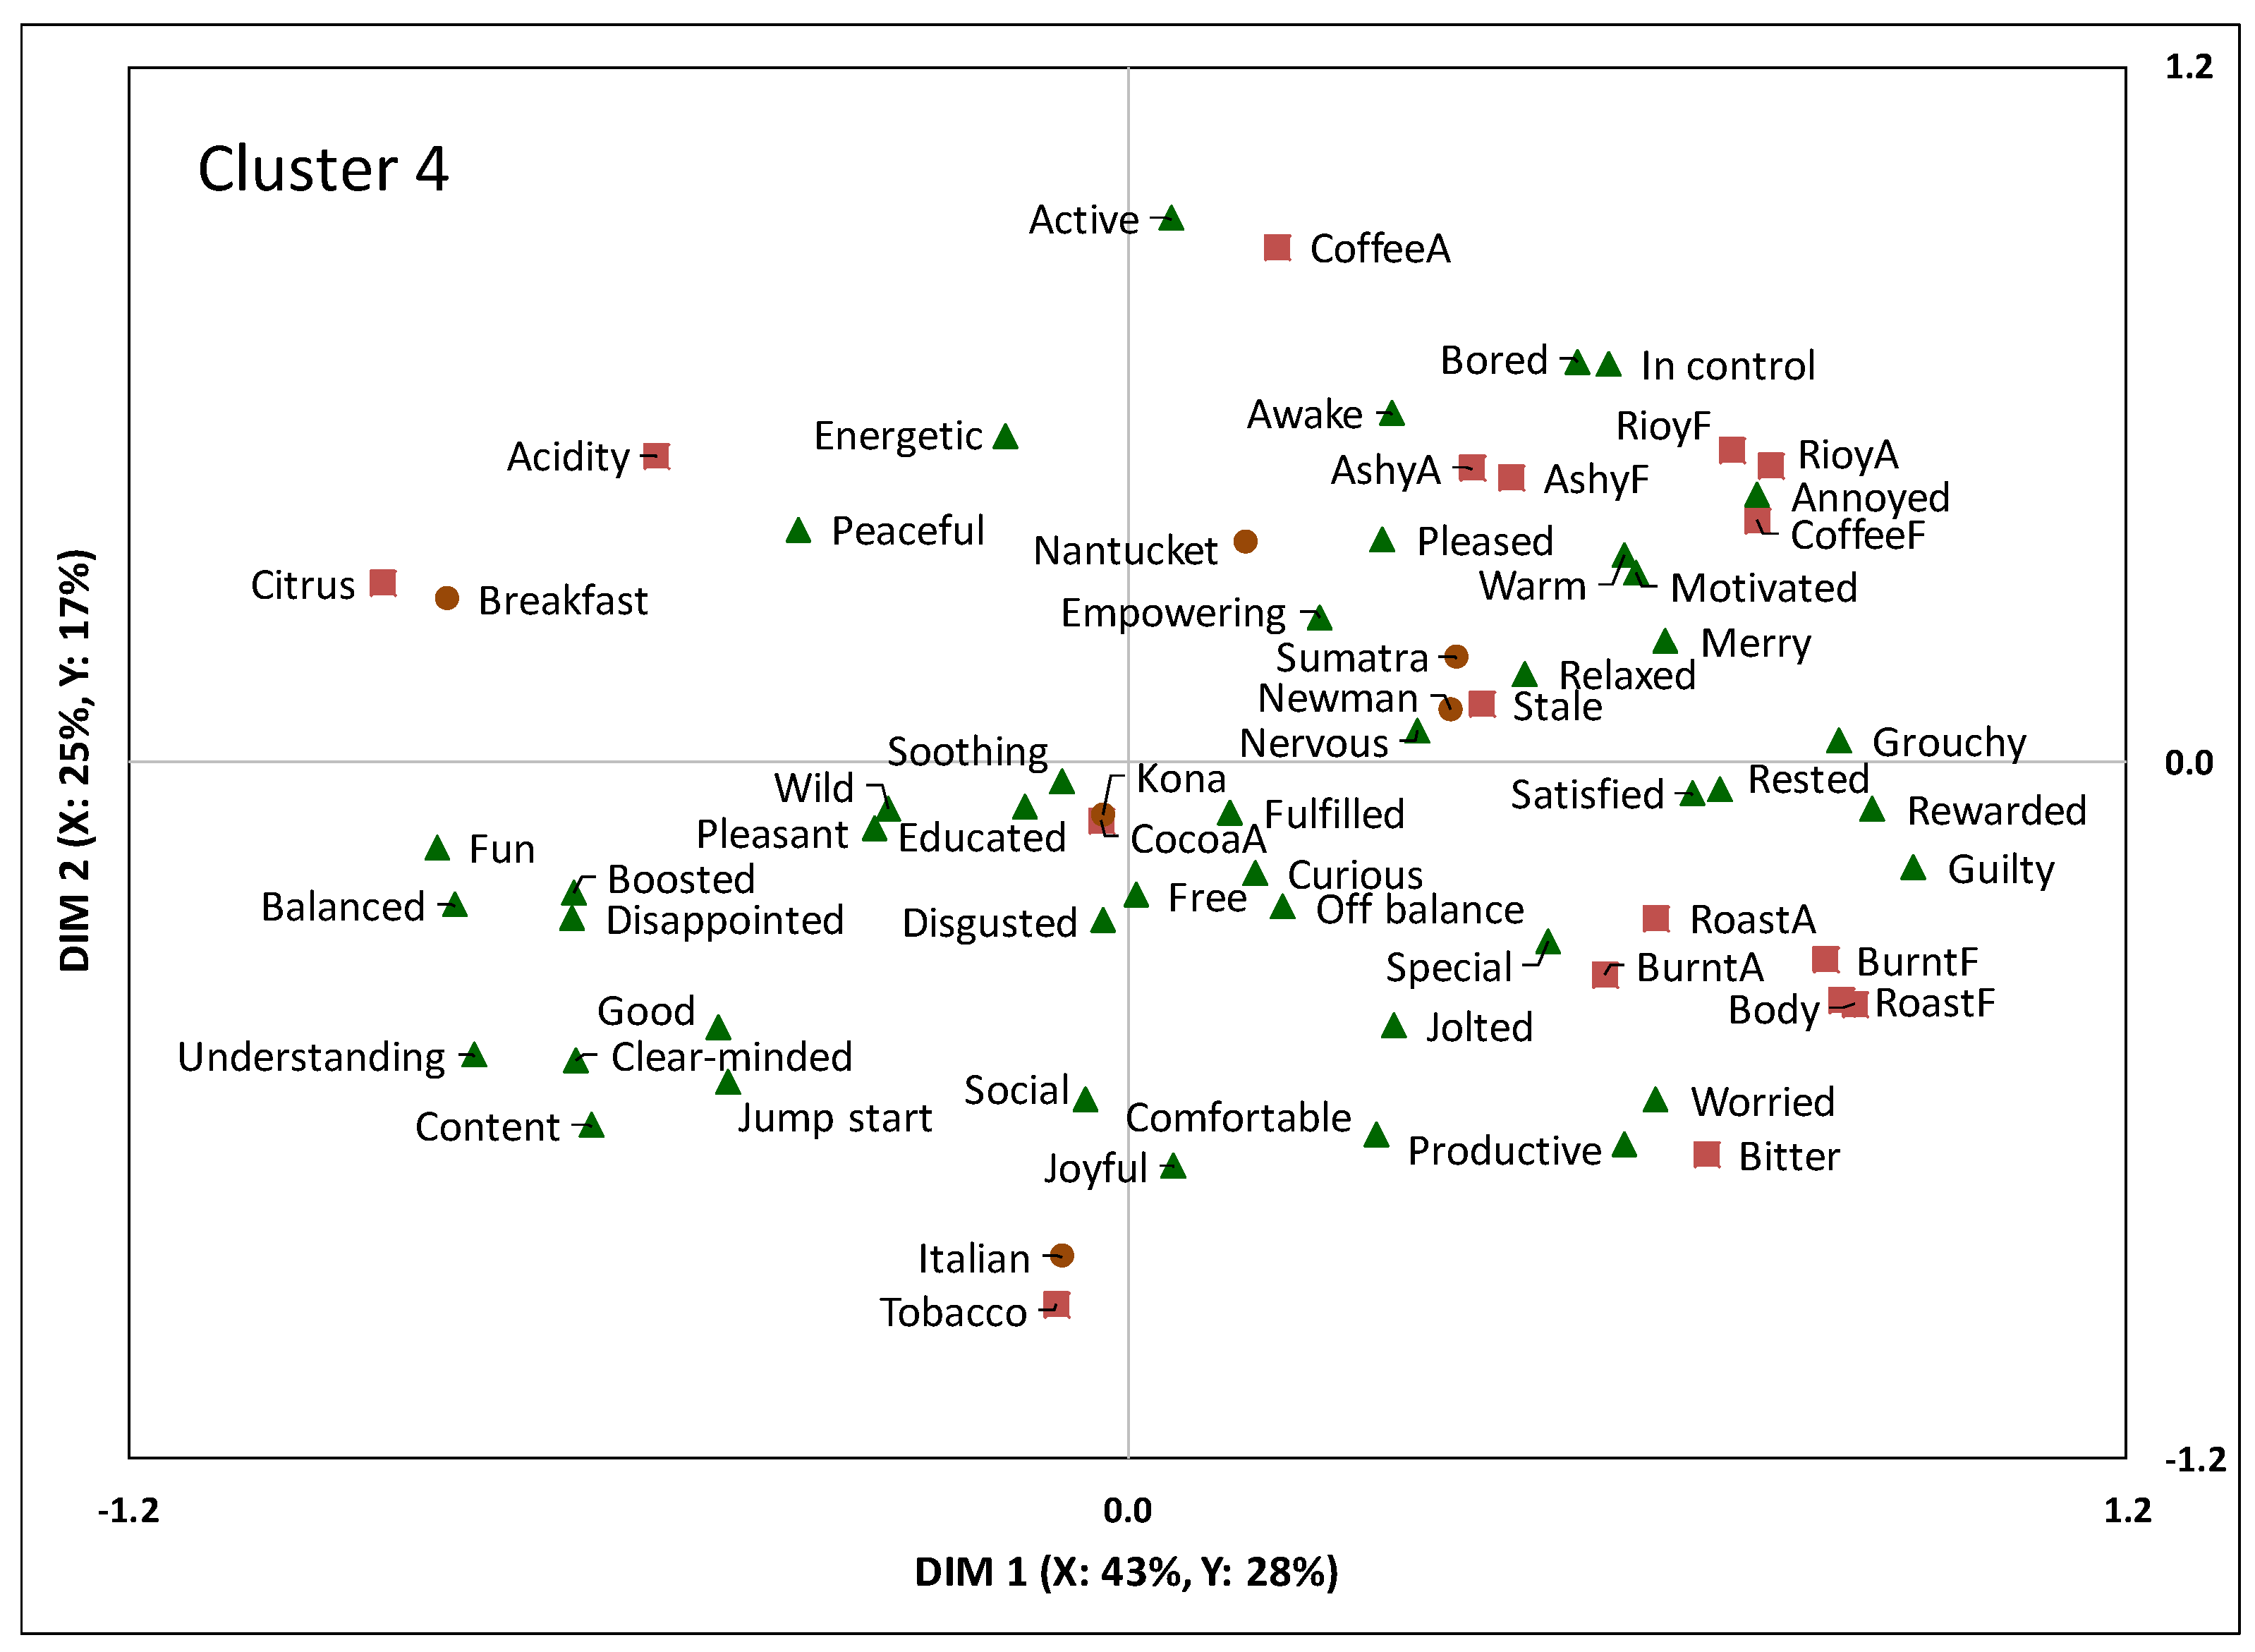
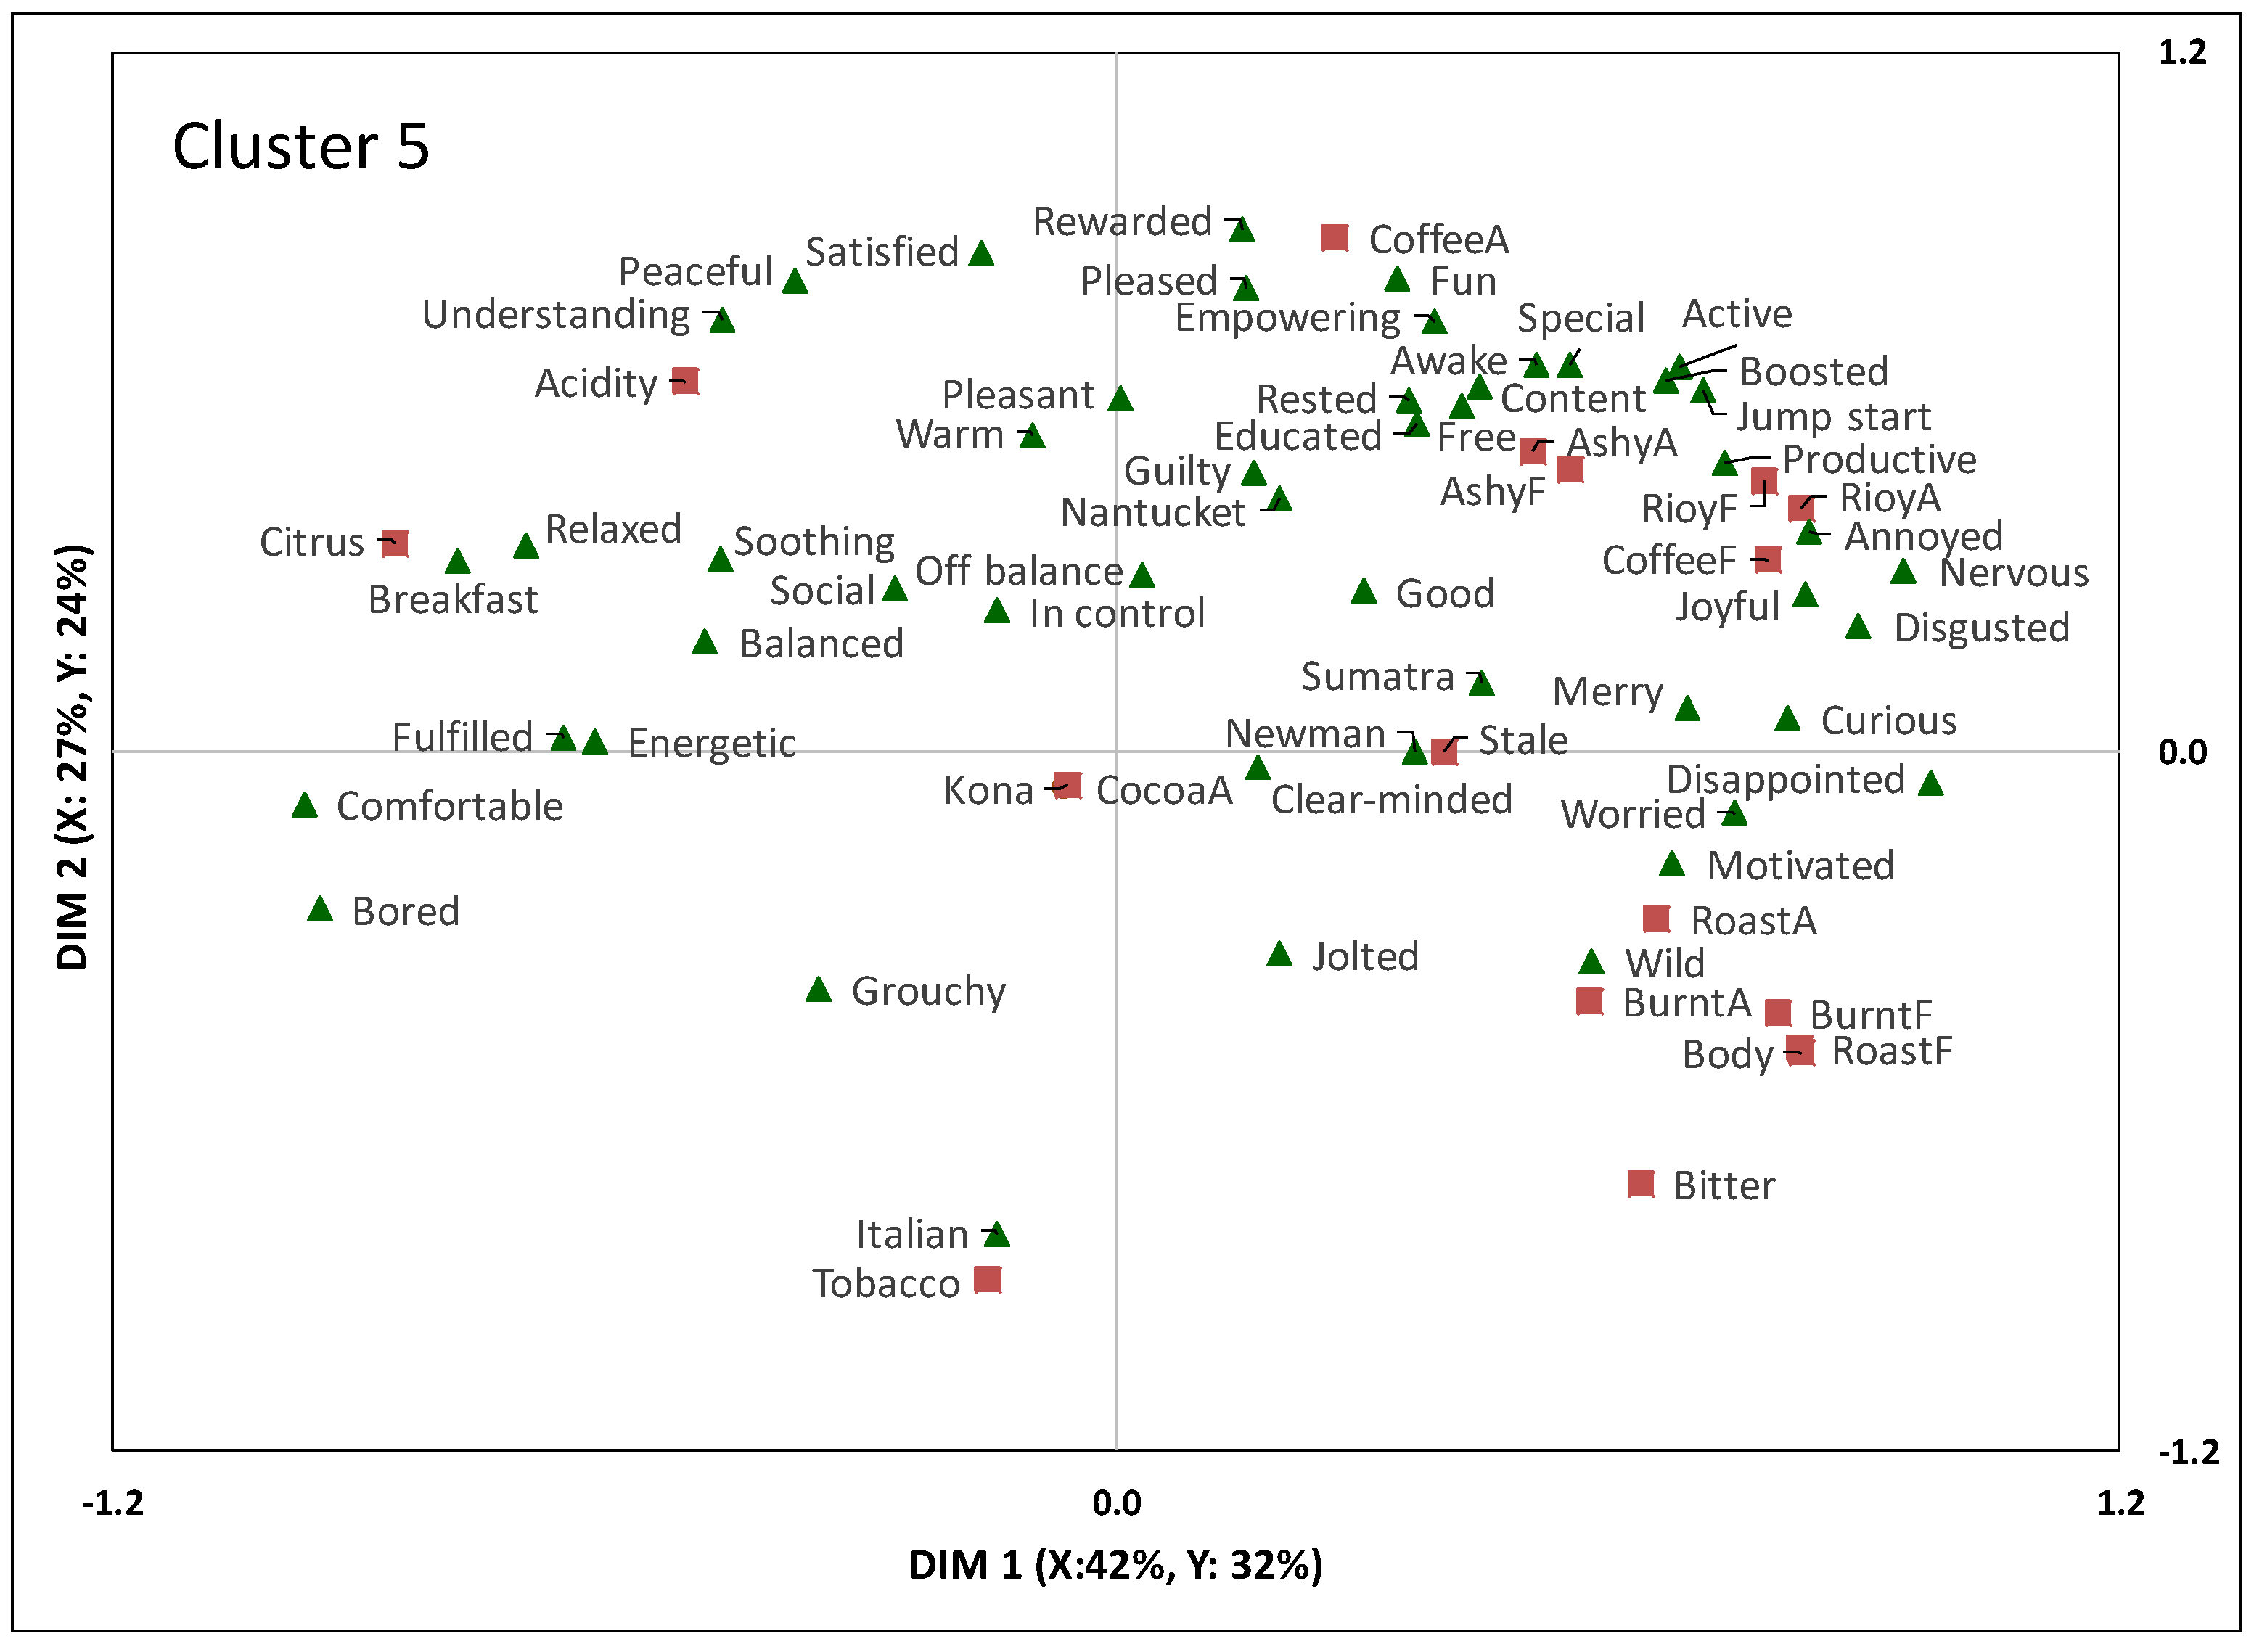
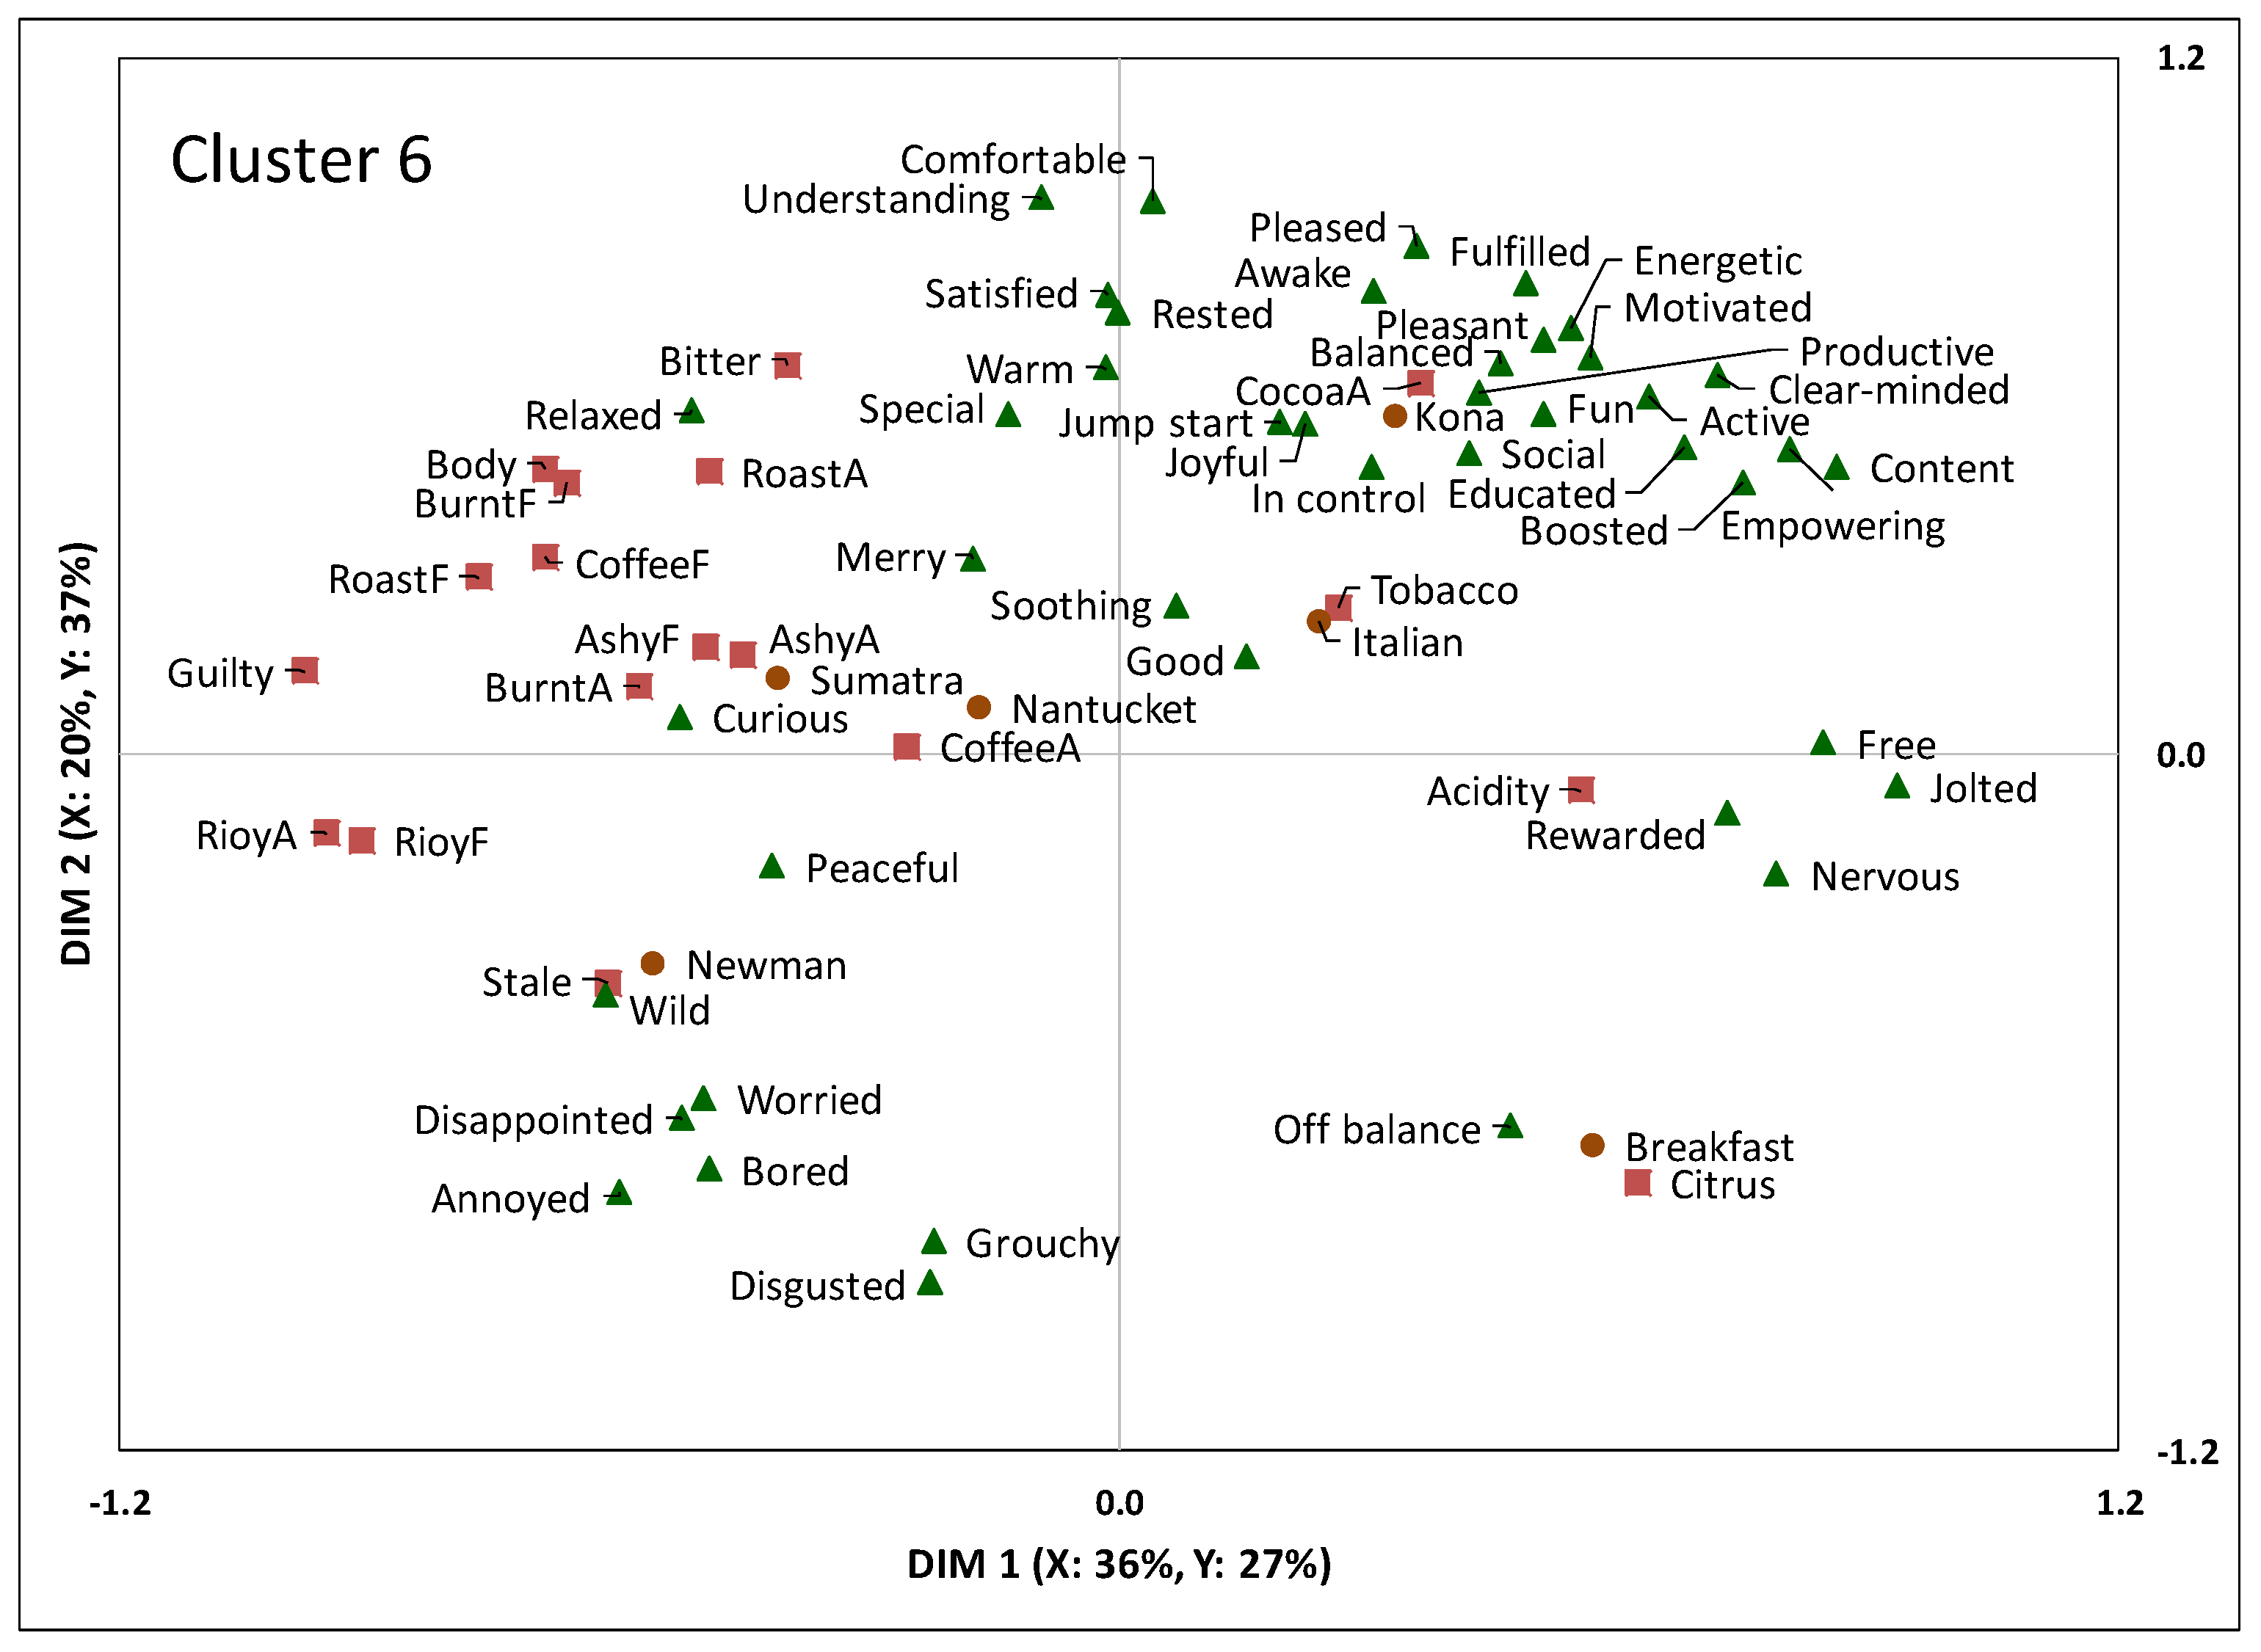
3.2. Identifying Sensory Drivers for the Emotional Experience

The sensory descriptive data was studied with emotion responses for the same set of coffee samples created by 94 coffee drinkers in the study done previously by Bhumiratana et al. [7]. Partial Least Square Regression (PLSR) was used to identify sensory drivers of the emotion responses (Figure 2). Coffee aroma, surprisingly, elicited a range of negative emotions (bored, disgusted, annoyed, and disappointed) even though it is well known that ‘coffee aroma’ elicites positive feelings, including alertness of the mental state, and is the driver of coffee consumption [11,27]. This may be because the definition of coffee aroma used by the coffee panel and consumers could be different, a common problem in the field of consumer research when integrating sensory and consumer data together. Coffee aroma, by the definition listed in Table 1, was the aroma of pure Arabica beans, which consumers may not be familiar with and might have led to a negative perception [5].
Positive emotions seemed to be driven by cocoa aroma, bitter, tobacco, roast, burnt, and body. Cocoa aroma may elevate good and pleasant emotions, which was consistent with previous studies. King and Meiselman [6] found that among the five food categories evaluated, chocolate was reported to have the highest ratings for 15 of the positive emotions (out of 24 positive emotions on a list of 39 terms). Macht and Mueller [28] reported consumption of chocolate could immediately reduce negative mood state, although the effect was temporary. It is also common knowledge that chocolate and its resemblance usually induces positive feelings in the general population. Tobacco flavor evoked the feelings of jolted and content. Coffee users may initially be surprised (i.e., jolted) by the unfamiliar tobacco attribute that was not commonly found in all coffee (only one coffee sample in this study exhibited this sensory attribute). However, they were accepting of the experience (i.e., content), which indicates that having a tobacco attribute in coffee could potentially enhance the drinking experience for general coffee users. Bitter aroused energetic and productive feelings. Roast and burnt (flavor and aroma), and body texture made consumers feel jump start, satisfied, boosted, and special. On the contrary, citrus, hay-like, and acidity appeared to elicit a feeling of off-balance. Like tobacco, consumers may not be familiar with experiencing these sensory characteristics in coffee and were caught off-guard by them. Unlike tobacco, they may not find these attributes appropriate for coffee, hence the off-balance emotion. Because emotions are context specific [29], it seems that citrus and acidity attributes may not fit well with the concept of coffee, which caused negative feelings to develop.
It seems the characteristics of dark roast coffee (roasted, burnt, bitter, and body) elicited positive-high energy feelings. This is likely because there were more participants who preferred darker roasts since coffee preference was not one of the criteria during recruitment. This finding identified tobacco, roasted, burnt, bitter, and body as the sensory drivers for this population of 94 coffee users. Since consumers have varying preferences and are affected differently by sensory stimuli, the 94 coffee users were examined more closely in our previous study [7] through clustering the consumers in six segments. The entire set of 94 coffee drinkers was clustered into six groups based on their acceptability scores for the coffee samples and emotion profiles were generated for each set of consumers. We conducted PLSR analysis on each consumer cluster to determine whether relationships can be drawn between the sensory characteristics and emotions elicited by the perceived attributes for each consumer cluster.
For coffee drinkers in Cluster 1 (n = 20), who liked all the coffees [7], the tobacco attribute seemed to elicit social, jump start, and special feelings, while the characteristics of dark roasts (high intensity of roast, burnt, and body/mouthfeel) appeared to make them feel empowering and relaxed (Figure 3). Acidity was associated with awake and disgusted and may be a negative attribute for this group. Cluster 2 (n = 17; Figure 4) consisted of consumers who dislike Breakfast (classified as light roast) [7]. The PLSR map indicated that attributes citrus and acidity elicited negative emotions (e.g., disappointed, disgusted, annoyed), and dark roast characteristics (roast, burnt, bitter, and body) were driving positive emotions (e.g., satisfied, energetic, rewarded, boosted, in control, empowering). This group of coffee drinkers seem to relate the coffee aroma to a grouchy emotion and the tobacco attribute to clear-minded, wild, and good feelings.
Cluster 3 (n = 24) was identified to like Nantucket and Breakfast but dislike Sumatra [7]. The PLSR bi-plot (Figure 5) illustrated that hay-like, citrus, and acidity brought out positive emotions (e.g., merry, pleasant, understanding, relaxed, rewarded) for this group of coffee drinkers. Empowering and boosted emotions seemed to be induced by coffee flavor, ashy, and rioy, while tobacco elicited feelings of off-balance, jolted, and social. Negative emotions (disappointed and disgusted) were driven by roast, burnt, and body characteristics. Coffee drinkers grouped into Cluster 4 (n = 13) were those that did not prefer any of the six coffees [7]. Nantucket was liked the most by this group, and that might be the reason that peaceful, energetic, pleased, and awake are somewhat encircling this sample in Figure 6. Since they did not have any firm preferences, the coffees may have elicited mixed emotions for this group (Figure 6), which are not easily discernible.
Cluster 5 (n = 10) was composed of coffee drinkers who gave a high liking rating for Breakfast and disliked the dark roasts (Newman, Italian, and Sumatra) [7]. Citrus and acidity were shown to explain positive emotions (e.g., relaxed, soothing, understanding, peaceful), and coffee aroma explained fun, rewarded, and pleased (Figure 7). On the other hand, coffee flavor and rioy appeared to describe negative emotions, including nervous, disgusted, and annoyed. Coffee drinkers in Cluster 6 (n = 10) were classified as preferring Kona coffee [7]. The PLSR bi-plot (Figure 8) reflects that this group of consumers were attracted to the cocoa aroma as most positive emotions (i.e., balanced, productive, fulfilled, awake, motivated, and energetic). Tobacco also described good and soothing emotions, while acidity seemed to generate mixed emotions of rewarded, free, jolted, and nervous.
This study presented the useful interaction of sensory and emotion data. Using the emotion profiles generated by the 44 emotions on the coffee drinking experience lexicon, we were able to identify some sensory drivers for specific emotions elicited by coffee drinking.

4. Conclusions

The PLSR maps indicated that sensory descriptive data might be used to describe emotions profiles elicited by coffee drinking. The PLSR maps were used to identify which attributes had an impact on positive or negative emotional responses from various groups of coffee drinkers. In general, coffee aroma, citrus, and acidity elicited negative feelings while cocoa aroma, tobacco, bitter, roast, burnt, and body generated positive emotions. As consumers have differing likes and dislikes, this study also examined each consumer cluster based on their preferences and identified sensory drivers for the emotions experienced by each cluster. These insights generated by the interaction of sensory and emotion data are valuable to both marketers and product developers by explaining acceptability data and change in consumption or purchase behavior.

Author Contributions

N.B. conceptualized and designed the study with the help of K.A. and E.C.I.; N.B. ran the descriptive analysis under the guidance of M.W.; The data analysis and manuscript preparation were done by N.B. with the help of K.A. and E.C.I.

Funding

This research received no external funding.

Conflicts of Interest

The authors declare no conflict of interest.

Appendix A

The emotion lexicon for Coffee Drinking Experience (CDE) [7].
ActiveDisgustedJoltedRelaxed
AnnoyedEducatedJoyfulRested
AwakeEmpoweringJumpstartRewarded
BalancedEnergeticMerrySatisfied
BoostedFreeMotivatedSocial
BoredFulfillingNervousSoothing
Clear-mindedFunOff-balanceSpecial
ComfortableGoodPeacefulUnderstanding
ContentGrouchyPleasantWarm
CuriousGuiltyPleasedWild
DisappointedIn-controlProductiveWorried

Appendix B

Mean liking scores on a 9-point Hedonic scale for each consumer cluster and coffee sample [7].
ClusterBreakfastItalianKonaNantucketNewmanSumatra
C1 (n = 20)7.76.97.37.77.57.2
C2 (n = 17)4.46.96.76.17.26.5
C3 (n = 24)7.06.05.87.55.33.7
C4 (n = 13)4.63.55.76.05.55.4
C5 (n = 10)7.13.33.54.12.22.1
C6 (n = 10)5.96.47.03.65.16.1

References

  1. Chrea, C.; Grandjean, D.; Delplanque, S.; Cayeux, I.; Le Calve, B.; Aymard, L.; Velazco, M.I.; Sander, D.; Scherer, K. Mapping the semantic space for the subjective experience of emotional responses to odors. Chem. Senses 2009, 34, 49–62. [Google Scholar] [CrossRef] [PubMed]
  2. Porcherot, C.; Delplanque, S.; Raviot-Derrien, S.; Le Calve, B.; Chrea, C.; Gaudreau, N.; Cayeux, I. How do you feel when you smell this? Optimization of a verbal measurement of odor-elicited emotions. Food Qual. Prefer. 2010, 21, 938–947. [Google Scholar] [CrossRef]
  3. Thomson, D.M.H. Sensory Cues for Emotional Responses to Foods & Drinks. International Union of Food Science and Technology (IUFoST), 2006. Available online: http://dx.doi.org/10.1051/IUFoST:20061091 (accessed on 1 December 2018).[Green Version]
  4. Thomson, D.M.H.; Crocker, C.; Marketo, C.G. Linking sensory characteristics to emotions: An example using dark chocolate. Food Qual. Prefer. 2010, 21, 1117–1125. [Google Scholar] [CrossRef]
  5. Gibson, E.L. Emotional influences on food choice: Sensory, physiological and psychological pathways. Physiol. Behav. 2006, 89, 53–61. [Google Scholar] [CrossRef] [PubMed]
  6. King, S.C.; Meiselman, H.L. Development of a method to measure consumer emotions associated with foods. Food Qual. Prefer. 2009, 21, 168–177. [Google Scholar] [CrossRef]
  7. Bhumiratana, N.; Adhikari, K.; Chambers, E., IV. The development of an emotion lexicon for the coffee drinking experience. Food Res. Int. 2014, 61, 83–92. [Google Scholar] [CrossRef] [Green Version]
  8. Illy, E. The complexity of coffee. Sci. Am. 2002, 286, 86–91. [Google Scholar] [CrossRef]
  9. Grosch, W. Flavour of coffee: A review. Nahrung 1998, 42, 344–350. [Google Scholar] [CrossRef]
  10. Czerny, M.; Mayer, F.; Grosch, W. Sensory study on the character impact odorants of roasted Arabica coffee. J. Agric. Food Chem. 1999, 47, 695–699. [Google Scholar] [CrossRef]
  11. Illy, A.; Viani, R. Espresso Coffee: The Science of Quality, 2nd ed.; Elsevier Academic Press: London, UK, 2005. [Google Scholar]
  12. Di Donfrancesco, B.; Gutierrez Guzman, N.; Chambers, E., IV. Comparison of results from cupping and descriptive sensory analysis of Colombian brewed coffee. J. Sens. Stud. 2014, 29, 301–311. [Google Scholar] [CrossRef]
  13. Bhumiratana, N.; Adhikari, K.; Chambers, E., IV. Green coffee beans to brewed coffee: Evolution of coffee aroma. LWT-Food Sci. Technol. 2011, 44, 2185–2192. [Google Scholar] [CrossRef]
  14. Chambers, D.H.; Allison, A.; Chambers, E., IV. Training effects on performance of descriptive panelists. J. Sens. Stud. 2004, 19, 486–499. [Google Scholar] [CrossRef]
  15. Chambers, E., IV; Smith, E.A. Effects of testing experience on performance of trained sensory panelists. J. Sens. Stud. 1993, 8, 155–166. [Google Scholar]
  16. Wolters, C.J.; Allchurch, E.M. Effect of training procedure on the performance of descriptive panels. Food Qual. Prefer. 1994, 5, 203–214. [Google Scholar] [CrossRef]
  17. Bitnes, J.; Ueland, O.; Moller, P.; Martens, M. Reliability of sensory assessors: Issues of retention and learning. J. Sens. Stud. 2008, 23, 852–870. [Google Scholar] [CrossRef]
  18. Chambers, E., IV; Sanchez, K.; Phan, U.T.X.; Miller, R.; Civille, G.V.; Di Donfrancesco, B. Development of a “living” lexicon for descriptive sensory analysis of brewed coffee. J. Sens. Stud. 2016, 31, 465–480. [Google Scholar] [CrossRef] [Green Version]
  19. Jager, G.; Schlich, P.; Tijjsen, I.; Yao, J.; Visalli, M.; de Graaf, C.; Steiger, M. Temporal dominance of emotions: Measuring dynamics of food-related emotions during consumption. Food Qual. Prefer. 2014, 37, 87–99. [Google Scholar] [CrossRef]
  20. Schenker, S.; Heinemann, C.; Huber, M.; Pompizzi, R.; Perren, R.; Escher, F. Impact of roasting conditions on the formation of aroma compounds in coffee beans. J. Food Sci. 2002, 67, 60–66. [Google Scholar] [CrossRef]
  21. Yeretzian, C.; Jordan, A.; Badoud, R.; Lindinger, W. From the green bean to the cup of coffee: Investigating coffee roasting by on-line monitoring of volatiles. Eur. Food Res. Technol. 2002, 214, 92–104. [Google Scholar] [CrossRef]
  22. Baggenstoss, J.; Poisson, L.; Kaegi, R.; Perren, R.; Escher, F. Coffee roasting and aroma formation: Application of different time and temperature conditions. J. Agric. Food Chem. 2008, 56, 5836–5846. [Google Scholar] [CrossRef]
  23. Mayer, F.; Czerny, M.; Grosch, W. Influence of provenance and roast degree on the composition of potent odorants in Arabica coffees. Eur. Food Res. Technol. 1999, 209, 242–250. [Google Scholar] [CrossRef]
  24. Decazy, F.; Avelino, J.; Guyot, B.; Perriot, J.J.; Pineda, C.; Cilas, C. Quality of different Honduran coffees in relation to several environments. J. Food Sci. 2003, 68, 2356–2361. [Google Scholar] [CrossRef]
  25. Nebesny, E.; Budryn, G. Evaluation of sensory attributes of coffee brews from robusta coffee roasted under different conditions. Eur. Food Res. Technol. 2006, 224, 159–165. [Google Scholar] [CrossRef]
  26. Ross, C.F.; Pecka, K.; Weller, K. Effect of storage conditions on the sensory quality of ground Arabica coffee. J. Food Qual. 2006, 29, 596–606. [Google Scholar] [CrossRef]
  27. Seo, H.S.; Hirano, M.; Shibato, M.; Rakwal, R.; Hwang, I.K.; Masuo, Y. Effect of coffee bean aroma on the rat brain stressed by sleep deprivation: A selected transcript and 2D get-based proteome analysis. J. Agric. Food Chem. 2008, 56, 4665–4673. [Google Scholar] [CrossRef] [PubMed]
  28. Macht, M.; Mueller, J. Immediate effects of chocolate on experimentally induced mood states. Appetite 2007, 49, 667–674. [Google Scholar] [CrossRef] [PubMed]
  29. Richins, M.L. Measuring emotions in the consumption experience. J. Cons. Res. 1997, 24, 127–146. [Google Scholar] [CrossRef]
Figure 1. Principal component analysis (PCA) biplot of the sensory profiles of the six coffees generated by the coffee panel.
Beverages 05 00027 g001
Figure 2. Partial least square regression analysis of descriptive sensory and CDE emotion lexicon of the six coffee samples for 94 consumers.
Beverages 05 00027 g002
Figure 3. Partial least square regression analysis of descriptive sensory and CDE emotion lexicon of the six coffee samples for consumer Cluster 1.
Beverages 05 00027 g003
Figure 4. Partial least square regression analysis of descriptive sensory and CDE emotion lexicon of the six coffee samples for consumer Cluster 2.
Beverages 05 00027 g004
Figure 5. Partial least square regression analysis of descriptive sensory and CDE emotion lexicon of the six coffee samples for consumer Cluster 3.
Beverages 05 00027 g005
Figure 6. Partial least square regression analysis of descriptive sensory and CDE emotion lexicon of the six coffee samples for consumer Cluster 4.
Beverages 05 00027 g006
Figure 7. Partial least square regression analysis of descriptive sensory and CDE emotion lexicon of the six coffee samples for consumer Cluster 5.
Beverages 05 00027 g007
Figure 8. Partial least square regression analysis of descriptive sensory and CDE emotion lexicon of the six coffee samples for consumer Cluster 6.
Beverages 05 00027 g008
Table 1. The list of aroma, flavor, and texture descriptors identified by the coffee panel.
Attributes.Definitions
CoffeeAmount or strength of Arabica coffee aroma or flavor
RoastDegree to which the coffee is roasted; ranges from green/no roast–low–medium–dark–very dark
BurntAromatics associated with blacked/acrid carbohydrates (e.g., burnt toast, espresso coffee)
RioyAromatic associated with iodine in water; is described as chlorine-like, brassy, metallic, and chemical
AshyBark-like lingering aromatics associated with a cold campfire
AcidityA sour, sharp, puckering sensation in the mouth caused by acids
TobaccoCharacteristic reminiscent of tobacco’s odor and taste, but should not be used for burnt tobacco
StaleNot fresh, flat, bodied down or reduced; old
CitrusAromatics associated with citrus fruits (e.g., lemon)
CocoaBrown, sweet, dusty often biter aromatics associated with cocoa beans and powered cocoa
BitterThe amount of bitter basic taste; (e.g., caffeine solutions)
Body (Mouthfeel)Viscosity of the coffee; heaviness on the tongue: thin to thick
Table 2. The mean scores of the descriptive analysis of the coffee samples.
DescriptorsAbbreviation for FiguresBreakfastItalianKonaNantucketNewmanSumatra
Aroma
CoffeeCoffeeA7.79 ab5.42 c8.33 a8.58 a7.50 ab8.58 a
RoastRoastA6.92 b8.50 a7.42 b8.50 a7.58 b8.58 a
BurntBurntA0.67 c4.50 a0.17 c2.92 b2.83 b4.33 a
RioyRioyA0.00 b0.00 b0.00 b1.33 a1.58 a1.58 a
AshyAshyA0.00 b0.00 b0.00 b2.75 a0.00 b1.92 a
CocoaCocoaA0.00 b0.00 b2.33 a0.00 b0.00 b0.00 b
Flavor
CoffeeCoffeeF8.25 c8.00 c11.75 a10.33 b11.75 a12.50 a
RoastRoastF7.08 c10.17 a8.54 b8.92 b10.50 a10.08 a
BurntBurntF1.58 d6.67 b6.75 b3.75 c8.33 a8.50 a
RioyRioyF0.00 b0.00 b0.00 b2.04 a2.00 a1.58 a
AshyAshyF0.00 b0.00 b0.00 b2.92 a0.00 b2.83 a
CitrusCitrus4.42 a0.00 b0.00 b0.00 b0.00 b0.00 b
TobaccoTobacco0.00 b8.08 a0.00 b0.00 b0.00 b0.00 b
StaleStale0.00 b0.00 b0.00 b0.00 b4.42 a0.00 b
AcidityAcidity5.92 a4.83 c5.83 ab5.92 a4.92 c4.92 c
BitterBitter3.08 d9.50 a8.13 b5.42 c8.00 b8.42 b
Texture
BodyBody6.38 d8.67 ab8.33 b7.63 c9.13 a8.83 ab
a,b,c Row means with common superscrits are not significantly different at p > 0.05.

