Article

Influence of Chemical and Physical Variables on 87Sr/86Sr Isotope Ratios Determination for Geographical Traceability Studies in the Oenological Food Chain

1
Department of Geological and Chemical Science, University of Modena and Reggio Emilia, via Campi 103, 41125 Modena, Italy
2
ChemStamp s.r.l., Spin off University of Modena and Reggio Emilia, via Campi 103, 41125 Modena, Italy
*
Author to whom correspondence should be addressed.
Beverages 2018, 4(3), 55; https://doi.org/10.3390/beverages4030055
Submission received: 18 June 2018 / Revised: 20 July 2018 / Accepted: 24 July 2018 / Published: 1 August 2018
(This article belongs to the Special Issue Wine Traceability )

Abstract

:
This study summarizes the results obtained from a systematic and long-term project aimed at the development of tools to assess the provenance of food in the oenological sector. 87Sr/86Sr isotope ratios were measured on a representative set of soils, branches, and wines sampled from the Chianti Classico wine production area. In particular, owing to the high spatial resolution of the 87Sr/86Sr ratio in the topsoil, the effect of two mill techniques for soil pretreatment was investigated to verify the influence of the particle dimension on the measured isotopic ratios. Samples with particle sizes ranging from 250 to less than 50 µm were investigated, and the extraction was performed by means of the DIN 19730 procedure. For each sample, the Sr isotope ratio was determined as well. The obtained results showed that the 87Sr/86Sr ratio is not influenced by soil particle size and may represent an effective tool as a geographic provenance indicator for the investigated product.

1. Introduction

Among the different criteria adopted to promote and protect food quality, the European Union (EU) has introduced, with the use of quality schemes, the link between territory and food [1]. In this context, the protected designation of origin (PDO) represents the highest award that can be attributed to an aliment, and it implies that the entire food chain is within a delimited territory [2]. Although there are many paper certifications for each food chain process that state for authenticity and quality arising from a particular geographical origin, none of these is based on objective criteria. In recent years, several attempts to develop tracking and tracing models for food processes have been made [3,4,5].
When dealing with traceability models, it is of utmost importance to determine the identity of the geographical indicator that is used to monitor the food chain from the field to the final product. For geographical traceability issues, one of the indicators that can be used is the primary or direct type, such as metal content or isotope ratios of bio-elements (13C/12C, D/H, 18O/16O, 15N/14N, and 34S/32S) or radiogenic heavy elements (87Sr/86Sr, 145Nd/143Nd, and 207Pb/206Pb). One element, whose isotopic pattern shows promising perspective in different areas, with particular and peculiar applications in food traceability, is strontium [5,6,7,8,9,10,11,12,13,14,15].
As a geographic food tracer, the most important feature of Sr is that this element is assimilated by the plant roots, and it has been shown that the isotopic ratio fingerprint, from the soil to the final product, remains almost unaltered (i.e., the isotopes do not undergo appreciable mass-dependent fractionation processes [16,17]). For a statistical approach to the geographical origin of food, a large dataset of precise and accurate values is needed in order to evaluate the indicator variability range of both the food and the soils and to build robust classification models [18].
If, on the one hand, it is a quite simple task to collect isotopic ratios data for the food matrix, on the other hand, the interpretation of the data from the soil is complex [19,20,21]. In fact, depending on the geology of the territory, the 87Sr/86Sr ratio could vary considerably as a function of many variables difficult to evaluate a priori [22,23]. Probably, the discrepancy between the bioavailable fraction and the total amount of strontium in a soil could represent the limiting factor for the construction of reliable geographical traceability models for food.
The possibility of discriminating between samples’ origins for geographical traceability purposes often lies at the 4th or 5th decimal places of this isotopic ratio. Therefore, accuracy of the measured values represents a quality parameter of utmost importance to ascertain the goodness of the experimental results. In the case of isotopic ratio determinations, it must be stressed that precision and accuracy depend upon several factors. In the case of inductively coupled plasma mass spectrometry (ICP/MS), the determination of the data precision is mainly influenced by the instrumental setup and the measuring conditions [24] primarily related to the sample introduction system and aerosol formation, while accuracy is more dependent on non-spectroscopic and spectroscopic interferences [9,25,26]. In the case of 87Sr/86Sr determination, the isobaric interference of charged ions and mass bias phenomena, due to the different mass transmissions of the multiple ion beams produced in the plasma source, have to be considered and corrected as well [24].
In particular, the isobaric interferences are due to the presence of doubly-charged ions (168Yb2+, 168Eu2+, 172Yb2+, 174Yb2+, etc.), charged polyatomic adducts (42Ca42Ca+, 44Ca40Ar+, 46Ca40Ar+, 44Ca44Ca+, etc.), and other isotopes with the same m/z ratio, such as 87Rb+ and 86Kr+, which must be removed by chemical procedure for 87Rb or mathematically corrected in the cases of 86Kr and 87Rb [27].
The solid phase extraction (SPE) procedure adopted for the Rb/Sr separation is characterized by an analytical recovery close to 100%, but the eluted Sr solution could contain some Rb traces at the ng kg−1–µg kg−1 level. While this is not a problem for thermal ionization mass spectrometry (TIMS) determinations [11], some major concerns arise for ICP-based determinations. Rb has two natural isotopes, 85Rb with a relative abundance of 72.17% and 87Rb, a radioactive nuclide with a half decay time of 4.88 × 10¹⁰ years to 87Sr, with a relative abundance of 27.83%. In addition, the isobaric interference of 87Rb on 87Sr cannot be instrumentally resolved, because it would need a resolving power close to 300,000: a resolution value still unavailable in commercial ICP/MS spectrometers. For these reasons, the SPE process must be strictly controlled to maximize the recovery, and the residual Rb, if present, must be corrected for. However, the mathematical correction for Rb, in addition to the one for 86Kr, may give results whose uncertainty is dependent on the initial concentration of the isobaric interfering, and when the ratio between the Sr and Rb concentrations is below 1000, the method could be unsuitable [27,28].
The residual 87Rb is evaluated by measuring the signal for mass 85 (85Rb) with the aim to improve the accuracy of the 87Sr/86Sr ratio; furthermore, the 87Rb/85Rb ratio is used for the mathematical Rb correction. For both mathematical procedures, the 86Kr and 87Rb corrections, the isotope ratios are also corrected for mass bias discrimination by the exponential law, assuming that the Kr and Rb mass discrimination factors are the same as that of Sr [19,27].
In order to investigate the performance of the mathematical procedures to correct for Rb interference, several Sr reference solutions at different concentrations were spiked with defined amounts of Rb, and the solutions were measured, without any chemical Rb separation, for the 87Sr/86Sr ratio.
In addition to the above-cited factors that may influence the accuracy of the instrumental measurements of the Sr isotopic ratio, the representativeness and the homogeneity of the sample have to be taken into consideration. In fact, the particle size plays a key role when dealing with soil and bioavailability. Therefore, a grinding procedure is often necessary to increase the surface-to-volume ratio. Moreover, the milling pretreatment may introduce some artifacts, that can alter chemical analysis results, if other parts of the soil sample, such as stones and rocks, are processed as well.
Taking into account the above considerations, the choice of the most appropriate milling equipment is of utmost importance to obtain reliable results.
In particular, to process soil samples, centrifugal and planetary ball mills are both suggested to reduce the sample size. However, because these techniques are based on different physical principles, the final sample properties may be influenced. Unlike the centrifugal mill, whose working principle is mainly based on an impact-shearing effect, the grinding process by planetary mill can be easily improved by adjusting the setup parameters to leave almost unaltered the hardest stony particles present in the soil samples.
Owing to these problems and in addition to the difficulties arising in the evaluation of the bioavailable fraction in the soil, as suggested by other researchers [29,30] and as reported in previous works [18], it should be a promising alternative to move from the “passive” soil collecting activity to an “active” one, where plants do directly the sampling [30,31,32].
In fact, plant roots have direct access to the bioavailable element reservoir in the soil, extending the sampling uptake to the neighboring area of the growing vine/plants. As a consequence, the 87Sr/86Sr data are the result of the influence of several processes, such as weathering reactions and contamination produced by fertilizers [33], pesticides, aerosol uptake, and so on.
The use of the plants as sampling devices allows the following: (i) a direct access to the bioavailable element fraction; (ii) the ability to make integration over a larger soil volume of element uptake; and (iii) the capacity to realize a simpler integration over time/seasons procedure.
In this paper, both aspects related to the influence of the soil size distribution on the isotopic data and the effectiveness of the Rb mathematical correction have been tackled. Furthermore, a preliminary study was carried out in order to verify whether the Sr isotopic ratio coming from vine branches can be a more distinctive geographical traceability tool for the Chianti Classico wine production areas, as other studies on the provenance have shown [10,18,22].

2. Materials and Methods

2.1. Reagents and Materials

Ultrapure 65% HNO3 was obtained from analytical grade HNO3 (Carlo Erba, Milan, Italy) by means of a SAVILLEX DST 1000 sub-boiling system (Savillex Corp., Eden Prairie, MN, USA).
High-purity water (ASTM TYPE I) was obtained by a Milli-Q Element system (Millipore, Milan, Italy).
Suprapure 1 M NH4NO3 and 30% analytical grade H2O2 were from Merk Millipore, Milan, Italy.
SrCO3, NIST SRM 987 (NIST, Gaithersburg, MD, USA), with a generally accepted Sr isotopic value of 0.71026 ± 0.00002 (u = 2sd) [34] was used for the bracketing procedure, evaluation of the data precision, and preparation of the spiked Sr/Rb solutions. RbNO3, trace metal basis 99.95% purity from Merck, was used to prepare the Sr/Rb spiked solutions.
ICP-multielement solution, IV-ICP-MS-71A, used for the determination of the Sr and Rb concentration, was from Inorganic Ventures, Christiansburg, VA, USA.
The Eichrom SR-B100-S (50–100 µm) Sr resin, used for Sr/Rb separation, was purchased from Eichrom Europe Laboratories, France. Preparation of the resin and the separation procedure were described in a previous work [19].
All Perfluoroalkoxy (PFA) bottles, tubes, and vessels, used for solution and sample preparation and storage, were firstly washed with heated 10% HNO3 and then rinsed with high-purity water.
Standard solution and sample preparation was carried out by weight with a Mettler AE200 analytical balance (Mettler Toledo S.p.A, Milan, Italy) with ±0.0001 g sensitivity.
All standards and samples were processed under a horizontal laminar flow hood, equipped with a HEPA filter, to prevent contamination phenomena.

2.2. Instrumentation

The soil and vine branch grinding procedure was performed by means of a Fritch, Pulverisette 14 model centrifugal mill (ECO Scientifica, Milan, Italy), equipped with a pure titan 12 ribs rotor and a 500 µm trapezoidal perforation sieve ring with a Teflon-coated collecting pan. The rotor speed was set at 16,000 rpm for both the sample matrices.
The soil samples were also grinded using a PM100 planetary mill (Retsch, FKV, Bergamo, Italy), equipped with a single 250 mL agata jar with two milling balls. Table S1 (in the Supplementary Materials) reports the milling parameters. The soil samples were processed twice, but only a sample fraction with a grain size greater than 250 µm was treated in the second run.
An automated vibratory sieve shaker, model AS200, supplied by Retsch (FKV, Bergamo, Italy) was used for size partition. The sieving stack was composed by seven solid stainless-steel sieve frames—315 µm, 250 µm, 180 µm, 125 µm, 90 µm, 60 µm, and 50 µm—and a collecting pan for the <50 µm sample size. The sample size fractionation was obtained by a throwing motion with angular momentum, and the setup parameters were as follow: amplitude = 70% with a total processing time of 5 min. All the samples were processed in dry sieving mode.
A commercial microwave oven for laboratory use, MarsX model (CEM Corp., Bergamo, Italy), equipped with Teflon® XP1500plus-type closed vessels, was used to digest the vine branch samples. The instrument was equipped with active probes on a reference vessel for temperature control, RTP-300 Plus, and pressure control, ESP-1500 Plus, during mineralization.
The Sr concentration in all the sample solutions was determined using an inductively coupled plasma interfaced to a quadrupolar mass analyzer, ICP/qMS, (XSeries II model, ThermoFisher Scientific, Bremen, Germany). The instrumental parameters and experimental setup conditions are reported in Tables S2–S4 (in the Supplementary Materials) for the microwave closed vessels technique (MW) and ICP/qMS instruments, respectively.
The strontium isotope ratio data (87Sr/86Sr) were acquired using a double-focusing multi-collector inductively coupled plasma mass spectrometer (MC-ICP/MS) (Neptune, ThermoFisher Scientific, Bremen, Germany). This spectrometer consisted of double-focusing, electrostatic, and magnetic sectors arranged in a forward Nier–Johnson geometry, and a Faraday cup multi-collector detector. The data acquisition was performed in low-resolution mode. The instrumental parameters are reported in a previous study [19]. The ion lens setting was daily tuned for maximum sensitivity and optimal flat-topped peak-shaped signal.

3. Experimental

3.1. Soil Sampling

Soil samples were collected in two different areas, labeled site A and site B, located in the Chianti Classico wine production zone of Tuscany (Italy). Table S5 (in the Supplementary Materials) reports the global positioning system, GPS, coordinates for both the sampling sites in the degree, minute, seconds (DMS) scale. The soil holes were dug by a single gauge auger set for hardly disturbed samples at a maximum sampling depth of 70 cm, roughly. The obtained cores were divided in two aliquots, up (UP) and down (DW), 30 cm length each, discarding the upper 10 cm length. The collected soils were properly preprocessed. In particular, the soil cores were broken up, and stones and plant debris were removed. The samples were air-dried for one week, successively stored in polystyrene bottles, and kept at room temperature. The number of samples is proportional to the extension of the investigated vineyards. A large-scale sampling procedure was applied for this study, and a soil/vine branch sample was taken each 5000 m2.
In addition, to investigate the milling procedure effects, four soil samples (M1, M2, M3, and M4) from district of Modena were collected following the same operative procedure and used to test the influence of the soil particle size on the 87Sr/86Sr isotopic ratio.

3.2. Vine Branch Sampling

During the soil sampling, vine branches were also collected from sites A and B. In particular, samples, 10–20 cm long, were cut from plants growing near the soil sampling point. The number of sampled vine branches was equivalent to the soil samples. The samples were dried in an oven for 24 h at 105 °C, and then, they were cut to 1 cm length, stored in polystyrene bottles, and kept at room temperature.

3.3. Wine Sampling

Grapes harvested from sites A and B were processed separately by the producer and from the respective grape juices after malolactic fermentation had taken place. Two different batches of wine, namely wine_A and wine_B, were obtained.

4. Sample Processing

4.1. Soil

Different aliquots of the same air-dried soil were grounded by means of centrifugal and/or planetary mill. Successively, only M1–M4 soil powders were processed for particle size distribution.
The determination of the bioavailable Sr fraction in the soil was achieved by extraction with 1 M NH4NO3 solution, DIN 19730 [35]. The obtained eluate was filtered through a 0.2-µm pore-sized cellulose acetate membrane into a 30 mL PFA bottle. Before the Sr/Rb separation, the total Sr concentration was measured, and the sample was diluted to a final concentration close to 200 µg kg−1 with 8 M HNO3, to work within the optimal instrumental conditions in terms of accuracy and precision of the isotopic measurements [19].

4.2. Vine Branches and Wines

The mineralization of vine branches was performed by the microwave closed vessels technique (MW) on a maximum sample size of 0.3 g, accurately weighted into the MW reaction vessels and then supplemented with 6 mL 65% HNO3, 1 mL 30% H2O2, and 3 mL H2O [36]. Washing cycles, with 6 mL 65% HNO3 and 4 mL H2O, were always performed between each sample mineralization cycle by using the same heating program. At the end of the sample mineralization procedure, colorless or pale yellow solutions were always obtained. Also, for these samples, the total Sr concentration was determined before the Sr/Rb separation in order to determine the optimal dilution factor.
The digestion of the wine samples was carried out by a simplified, validated protocol consisting of a low-temperature mineralization procedure [16]. Briefly, a sample aliquot of 5 mL of wine was added to 5 mL of 65% HNO3, and the mixture was left to react for 12 h in PFA bottles at room temperature and atmospheric pressure. Before the Rb/Sr SPE separation, the mineralized solution was then measured for the total Sr content in order to dilute sample to a final 200 µg kg−1 Sr concentration.

4.3. Strontium/Rubidium Spiking Solutions

A set of 20 solutions with different concentrations of Sr and Rb were prepared to test the influence of the isobaric 87Rb specie on the accuracy of the 87Sr/86Sr ratio determination. In particular, four solutions of SrCO3, NIST 987, at 50, 100, 200, and 400 µg kg−1 Sr were spiked with increasing amounts of RbNO3 from 0 to 200 µg kg−1 Rb final concentration. The measurements were performed directly on the solutions without the Rb/Sr separation in triplicate and randomized in three days to avoid systematic deviations.

4.4. Strontium Isotopic Ratio Determination on Real Samples

Before starting any measurement procedure, all the samples were processed to separate interfering species such as rubidium. The Sr/Rb separation procedure was optimized by means of an experimental design approach and fully described in previous works [16,37]. Briefly, it consisted of the following steps: (i) 1–2 mL of resin was loaded into the SPE column; (ii) the resin was washed with high-purity water and activated with 8 M HNO3; (iii) an appropriate sample volume was loaded and the interferences eluted with 8 M HNO3; and finally, (v) the recovery of Sr was accomplished by using high-purity water.
A [blank/sample/blank/standard/blank] bracketing sequence was always adopted for Sr isotope ratio measurements in order to check and correct for any instrumental drift. The average of the measured intensities of bracketing-blanks (4% HNO3) was subtracted from the measured intensities of the respective standards (NIST SRM 987) or samples.
The strontium isotope ratios of the standards and samples were calculated according to the mathematical procedures, as explained in a previous work [19], considering an internal correction for the mass-dependent fractionation process effects induced by the plasma source by using as a normalizing factor the 88Sr/86Sr ratio equal to 8.3752 (according to the IUPAC technical report on the isotopic composition of the elements [38]).
Furthermore, Kr and Rb mathematical corrections were also accomplished by considering 86Kr/83Kr and 87Rb/85Rb ratios of 1.50566 and 0.38567, respectively.
All the isotopic values obtained for the NIST SRM 987 standard solution during each measuring session were used to evaluate the instrumental precision.

4.5. Statistical Analysis

The data comparison was performed using a Student t-test method and, in the case of more than two independent groups, by one-way analysis of variance (ANOVA). An alpha level of confidence of 0.05 was used for all statistical tests.
All statistical analyses were performed by using the “data analysis” macro of Microsoft® Excel®.

5. Results and Discussion

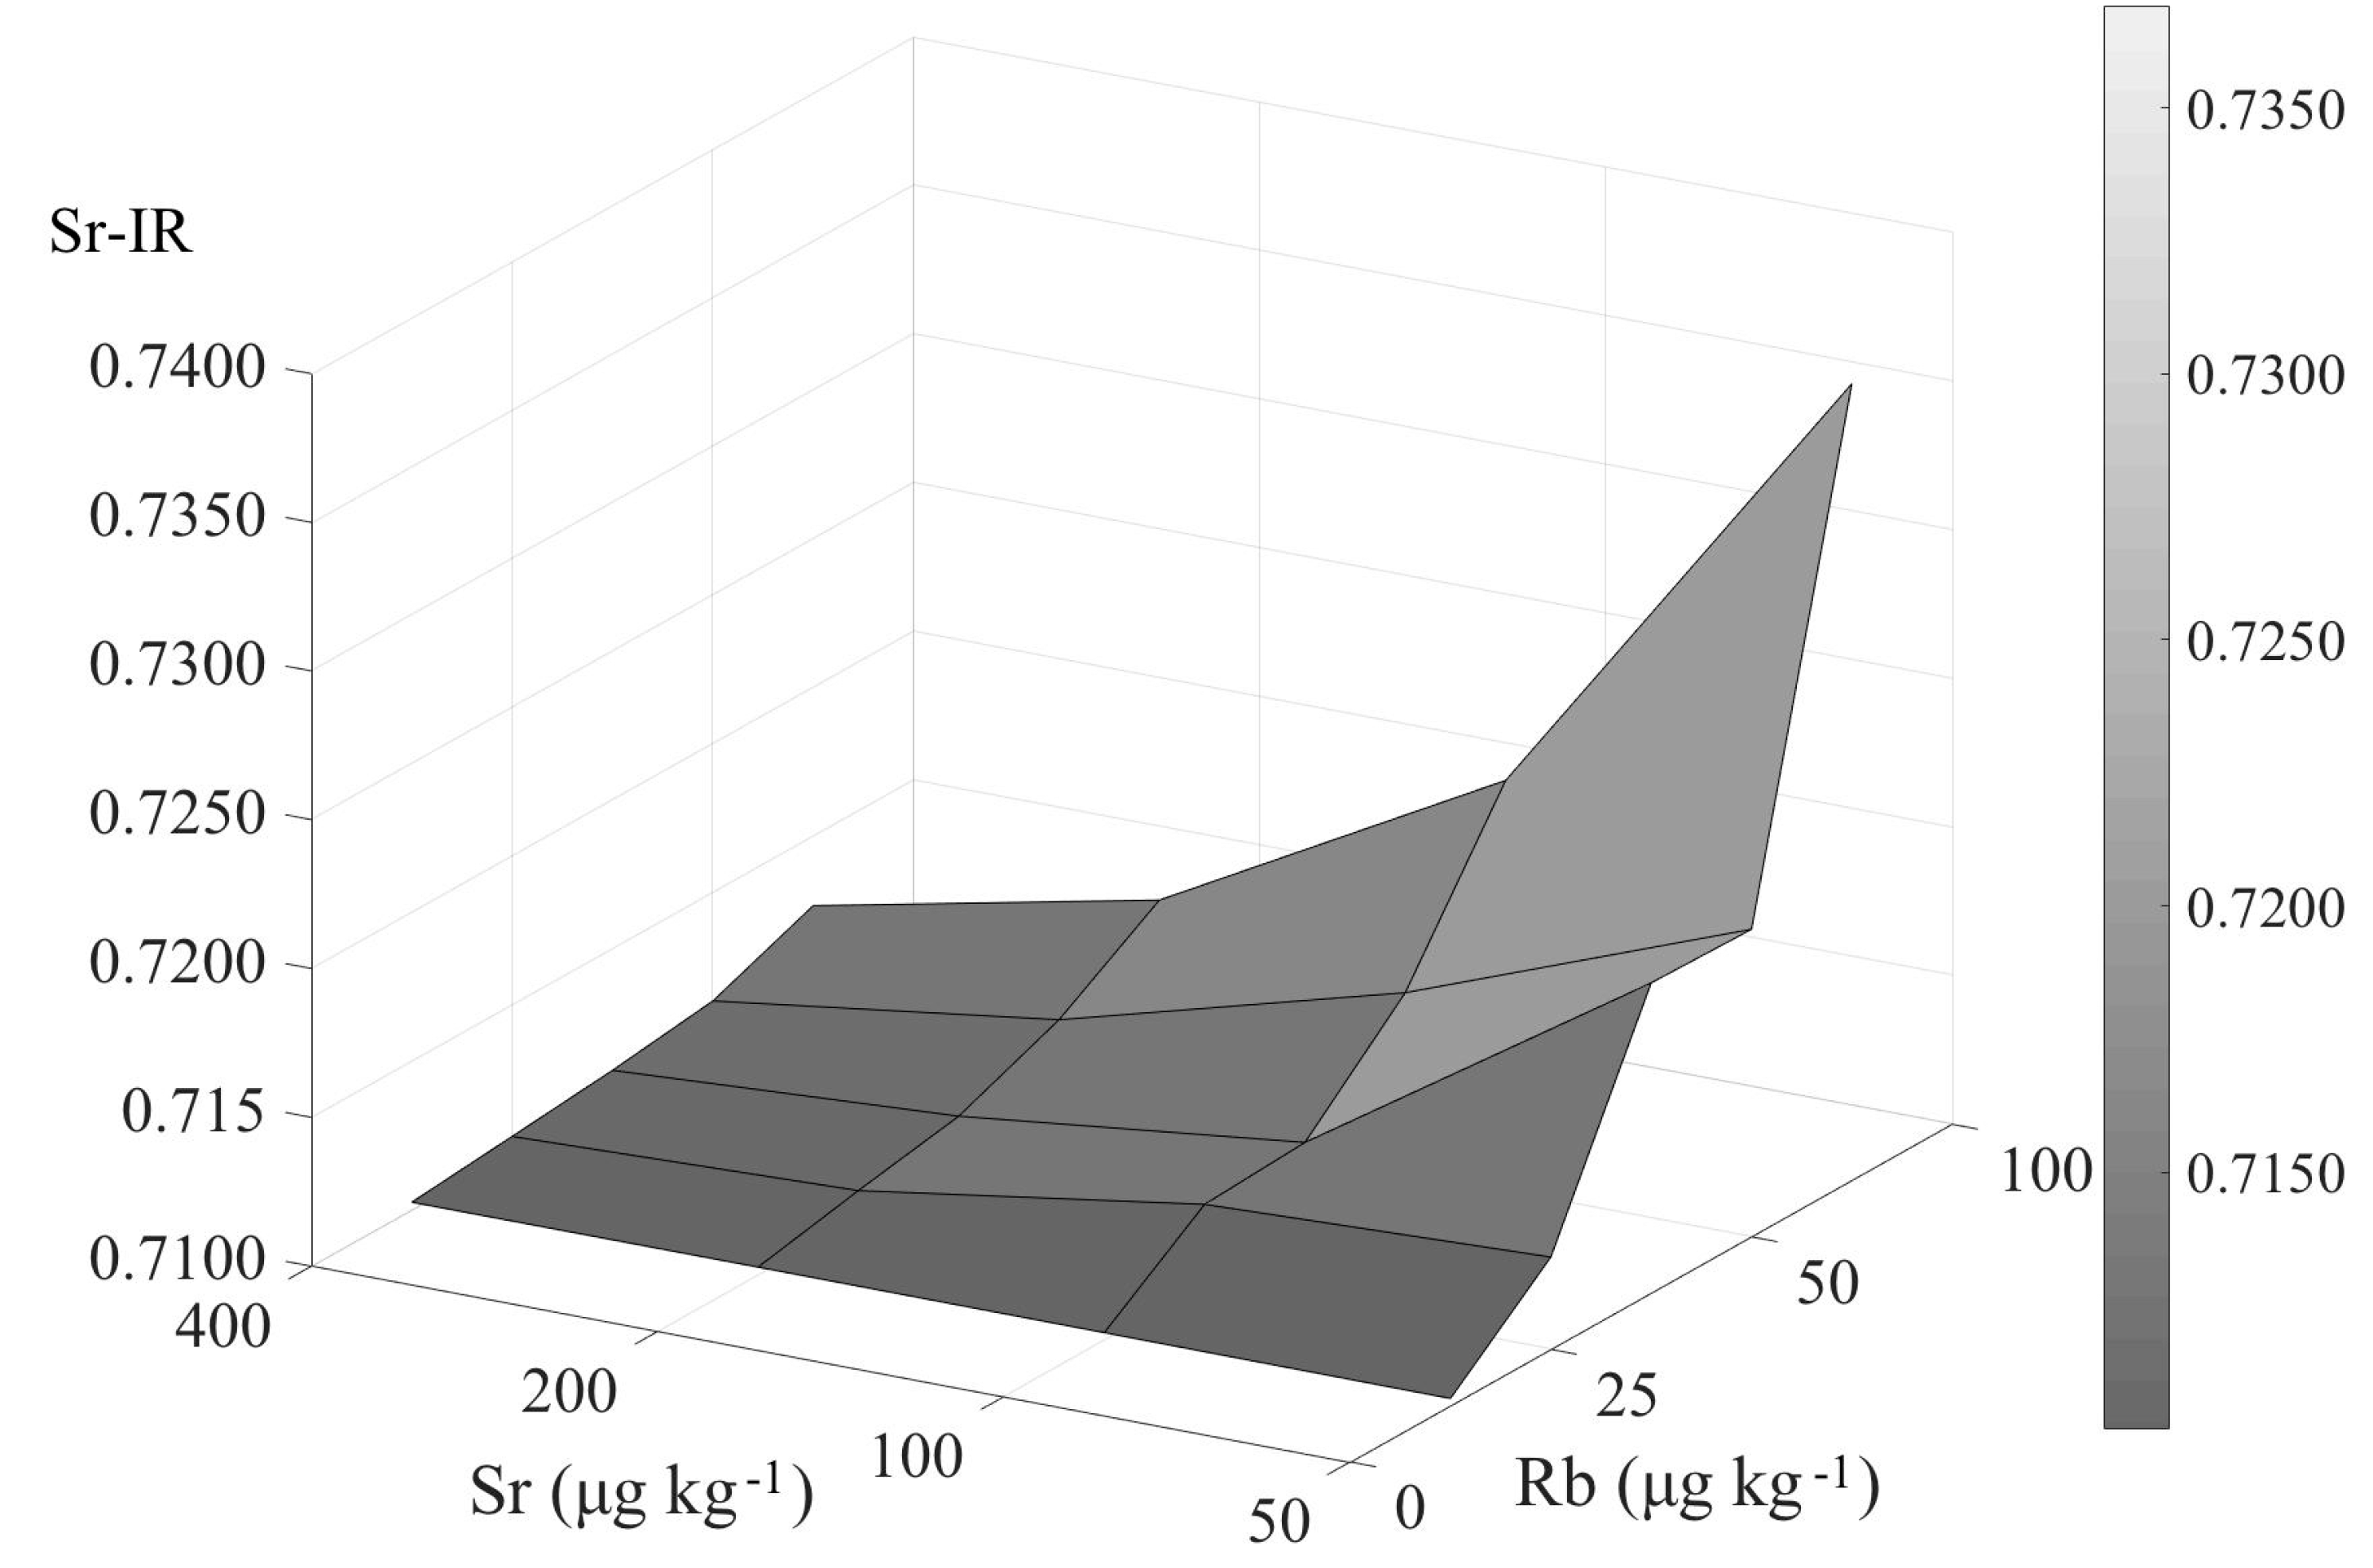
5.1. Influence of the Residual Rb on the Accuracy of the 87Sr/86Sr Ratio

Figure 1 reports the trend of the experimental data measured on the spiked solutions for the Sr ratio as a function of both the Sr and Rb concentrations. In particular, considering the NIST 987 Sr ratio value, 0.71026 ± 0.00002 (uncertainty (u) is expressed as twice the standard deviation (2sd) equivalent to the 28 ppm deviation calculated by Equation (1)).
ppm = ( Δ NIST 987 r a t i o ) 10 6
where Δ represents the difference between the measured and true Sr isotopic ratios. It is important to note that the trend of the data starts diverging as the Rb concentration increases. In fact, the mathematical correction of the isobaric interference on the m/z = 87 results almost still effective with a 25 µg kg−1 of Rb but only when Sr concentration is greater than 200 µg kg−1.
However, as long as the Sr concentration decreases from 400 to 50 µg kg−1, the deviation of the Sr isotopic ratio from the expected value spans from 450 ppm to 4000 ppm. This means that the influence of the interference should become “negligible” or comprised inside the uncertainty of the NIST 987 standard when its concentration is approximately less than 5 µg kg−1 and the 87Sr/86Sr ratio is measured with an Sr concentration greater than 200 µg kg−1 [9].
Based on all these results, the measured isotope ratios were determined on SPE separated solutions at a final Sr concentration optimized for each sample at 200 µg kg−1. The Rb content was measured for all the separated solutions and was always found to be less than 0.5 µg kg−1.

5.2. Influence of the Milling Process

In order to test the potentialities of the milling process for the soil preparation, two different instruments were used. Table 1 reports the particle size distribution, expressed as percentage weight to weight, of the grinded soil samples obtained with a centrifugal mill, samples M1 and M2, and single jar planetary equipment, samples M3 and M4, respectively.
A detailed evaluation of the reported data immediately shows that both the milling techniques can produce a processed soil with a particle size distribution of less than 250 µm, and in particular, more than 80% of the sample is characterized by particles with diameters equal to or less than 125 µm. In addition, taking into account the values obtained from similar experiments—namely M1 versus M2 and M3 versus M4—both techniques show a good reproducibility.
Therefore, if on the one hand, the two milling techniques can operate on air-dried soil samples, more or less in the same way, then it is of utmost relevance to understand how similar, from a chemical point of view, are the grounded soils.
As a consequence, to investigate if the mill type may affect the Sr isotope ratio and then to give an answer to the latter question, the 87Sr/86Sr isotopic ratio, determined on the bioavailable Sr portion, was measured on each granulometric fraction, from 250 to <50 µm (collecting pan), relatively to four different soil samples processed with the planetary mill. Table 2 summarizes the isotopic ratio (IR) data.
Considering each granulometric fraction, it is possible to highlight that the IR data are not influenced by a particle size effect, because the isotopic values are close to each other. In fact, the range of variability of the IR values of each sample lies within the uncertainties evaluated for the control sample (i.e., ±0.00002).
As far as the milling technique is concerned, Table 2 also reports the Sr isotopic values obtained on the same soil samples processed with the centrifugal mill (whole sample data).
The calculated difference between the mean isotopic ratios and the whole sample data for the M1–M4 samples returns values that are of the same order of magnitude of the uncertainties of the data. This experimental evidence represents an important result when dealing with soil analysis, in particular 87Sr/86Sr ratio measurements, because this matrix may be considered a quite inhomogeneous system to be described by a punctual sampling procedure.
Concerning the determination of the 87Sr/86Sr ratio, the two mill types resulted in being equivalent. However, as the energy imparted to the sample is lower with the planetary grinding system and prevents spraying of materials, such as stones, bowls, and so on, this mill type was chosen as the pretreatment technique for the soils of the Chianti Classico area.

5.3. 87Sr/86Sr Ratio as Geographical Indicator in the Chianti Classico Production Area

With the aim to develop a preliminary geographical traceability model for wine, the isotopic 87Sr/86Sr values were determined on the soil, vine branch, and wine sampled from the Chianti Classico wine production zone. The results are reported in Table 3.
In particular, the soils were sampled from two distinct vineyards, A and B, and owing to the lithological pedological complexity of the investigated area, each soil core was split in an UP and DW parts.
The data do not point out any statistical difference between the respective UP and DW isotopic values for both A and B production sites. At the same time, the intra-site variability (within site A or B) is approximately one order of magnitude higher with respect to the inter-site variability (between sites A and B), confirming the possibility of considering the two production zones almost equal with respect to the 87Sr/86Sr indicator. In fact, by comparing the soil mean values for the 87Sr/86Sr ratio calculated for the A and B sites, these resulted in being statistically equivalent, p(|t| ≥ 0.32 = 0.75), making it possible to average all of the experimental IRs data relative to the whole investigated Chianti Classico wine production area.
Considering now the IRs determined on the vine branches, it is possible to highlight the following: (a) the isotopic ratio value measured on the vine branches is generally lower with respect to the respective soil datum, and (b) the comparison of the data measured on the samples from sites A and B confirms the similarities of the two production zones, because the A and B mean values are not statistically different, as confirmed by the results of the Student t-test, p(|t| ≥ 0.13 = 0.89).
Grapes from each vineyard were separately processed, and the Sr isotope ratios, determined on the fermented juice sample, were equal to 0.70943 and 0.70941 for wine_A and wine_B, respectively. Uncertainty values, expressed as twice the standard deviation, u = 2SD, were equal to ±0.00002 [20].
Now, taking into account the overall mean value calculated for each investigated matrix—IRsoil = 0.70965, IRbranches = 0.70936, and IRwine = 0.70942—it is possible to highlight that, although in some cases data are close to each other, the IR value decreases from soil to branches, while it was almost equal for vine branches and wine. In fact, the absolute differences of soil to branches (diff.s-b = 0.00029) is higher than that of branches to wine (diff.b-w = 0.00006), confirming that, in the latter case, there was an increase in the “representativeness” of the considered matrix and the discriminating capabilities of the isotopic indicator as well.
The same conclusions can be stressed by ANOVA analysis applied to the data of Table 3, namely the 87Sr/86Sr ratio of soils, vine branches, and wines.
The statistical analysis was performed on the values coming from site A and from site B considered as a whole on the basis of the evidence previously obtained from the Student t-test. Also, in this case, the ANOVA results reported in Table 4 confirm the absence of statistically significant differences between the means of the three groups.
This experimental evidence unequivocally confirms that it is possible to trace in an objective manner the geographical origin of food commodities following a “from farm to fork” approach. In particular, in absence of phenomena that may alter the soil–plant–product isotopic transfer mechanism, the vine branches return an isotopic ratio of strontium closer to that of the finished product, wine, because their sampling capacity and geographical representatively is far greater than that of any “operator” that makes holes. In addition, the vine branch sampling approach overcomes the great problem of the choice of the soil leaching test mimicking the evaluation of the bioavailable fraction and/or the seasonal dependence of the plant’s uptake. Considering all these aspects, the main practical advantage of this approach is certainly represented by the increased discriminating capabilities of the isotopic indicator evaluated in the vine branch samples due to the reduced variability of the “within field data” attainable for non-homogeneous matrices such as soil.

6. Conclusions

The present investigation represents an important point in the development of a test method for determining the 87Sr/86Sr ratio in soil samples, in particular concerning the independence of the final data from the granulometric distribution of the sample. Regarding the effects produced by the two different grinding systems, despite the good correlation obtained between the granulometric distributions and the isotopic values with respect to the different tested samples, the use of a planetary system is preferable to a centrifugal one, because the lesser energy of impact on the soil sample prevents spraying of those materials, such as stones, bowls, and so forth, which do not directly participate in the plant element uptake processes. As far as the Rb interference is concerned, the reported data show that with only the mathematical correction, the calculated Sr isotope ratios are not sufficiently accurate, and therefore, the Rb/Sr separation process is mandatory.
The Sr isotopic values obtained for the Chianti Classico food chain support and confirm the idea that the values of the 87Sr/86Sr isotopic ratio in vine branches are very close to those in wine and therefore could be used for geographical traceability purposes in the oenological food chain.

Supplementary Materials

The following are available online at https://www.mdpi.com/2306-5710/4/3/55/s1, Table S1: Set-up parameters used for the PM100 planetary mill, Table S2: Microwave digestion program used for the mineralization of vine branches samples, Table S3: Microwave operating condition used for the washing cycle of XP-1500 Plus vessels, Table S4: ICP/qMS instrumental setting parameters, and Table S5: GPS coordinates for sampling sites A and B, respectively.

Author Contributions

Conceptualization, A.M. and C.D.; Methodology, S.S. and L.L.; Software, C.D.; Validation, S.S., L.L., and L.T.; Formal Analysis, C.D.; Investigation, S.S. and L.L.; Resources, L.T.; Data Curation, C.D. and L.L.; Original Draft Preparation, C.D. and A.M.; Review and Editing of Manuscript, C.D. and A.M.; Visualization, C.D. and S.S.; Supervision, A.M.; and Project Administration, A.M.

Funding

This research received no external funding.

Acknowledgments

The authors are grateful to the Centro Interdipartimentale Grandi Strumenti, University of Modena and Reggio Emilia, for their collaboration in working out the isotope ratio measurements with the Neptune instrument. A special thanks to Daniela Manzini and Maria Cecilia Rossi for their valuable contribution during the instrument setup and the helpful discussion on the measured data.

Conflicts of Interest

The authors declare no conflict of interest.

References

  1. EU Agricultural Product Quality Policy. Available online: https://ec.europa.eu/agriculture/quality_en (accessed on 25 July 2018).
  2. Regulation (EU) 1151/2012 of the European Parliament and of the Council of 21 November 2012 on Quality Schemes for Agricultural Products and Foodstuffs; L 343/1; Official Journal of the European Union: Brussels, Belgium, 14 December 2012.
  3. Danezis, G.P.; Tsagkaris, A.S.; Camin, F.; Brusic, V.; Georgiou, C.A. Food authentication: Techniques, trends & emerging approaches. Trends Anal. Chem. 2016, 85, 123–132. [Google Scholar] [Green Version]
  4. Baroni, M.V.; Podio, N.S.; Badini, R.G.; Inga, M.; Ostera, H.A.; Cagnoni, M.; Gallegos, E.; Gautier, E.; Peral-García, P.; Hoogewerff, J.; et al. How Much Do Soil and Water Contribute to the Composition of Meat? A Case Study: Meat from Three Areas of Argentina. J. Agric. Food Chem. 2011, 59, 11117–11128. [Google Scholar] [CrossRef] [PubMed]
  5. Voerkelius, S.; Lorenz, G.D.; Rummel, S.; Quétel, C.R.; Heiss, G.; Baxter, M.; Brach-Papa, C.; Deters-Itzelsberger, P.; Hoelzl, S.; Hoogewerff, J.; et al. Strontium isotopic signatures of natural mineral waters, the reference to a simple geological map and its potential for authentication of food. Food Chem. 2010, 118, 933–940. [Google Scholar] [CrossRef]
  6. Horn, P.; Schaaf, P.; Holbach, B.; Holzl, S.; Eschnauer, H. 87Sr/86Sr from rock and soil into vine and wine. Z. Lebensm. Unters. Forsch. 1993, 196, 407–409. [Google Scholar] [CrossRef]
  7. White, W.M. Geochemistry; Wiley-Blackwell: Hoboken, NJ, USA, 2013; ISBN 978-0-470-65667-9. [Google Scholar]
  8. Marchetti, A.; Durante, C.; Bertacchini, L. Heavy isotopes: A powerful tool to support geographical traceability of food. In Food Authentication, Management, Analysis and Regulation; Georgiou, C.A., Danezis, G.P., Eds.; Wiley Blackwell: Hoboken, NJ, USA, 2017; ISBN 9781118810255. [Google Scholar]
  9. Fortunato, G.; Mumic, K.; Wunderli, S.; Pillonel, L.; Bosset, J.; Gremaud, G. Application of strontium isotope abundance ratios measured by MC-ICP-MS for food authentication. J. Anal. At. Spectrom. 2004, 19, 227–234. [Google Scholar] [CrossRef]
  10. Aoyama, K.; Nakano, T.; Shin, K.C.; Izawa, A.; Morita, S. Variation of strontium stable isotope ratios and origins of strontium in Japanese vegetables and comparison with Chinese vegetables. Food Chem. 2017, 237, 1186–1195. [Google Scholar] [CrossRef] [PubMed]
  11. Marchionni, S.; Buccianti, A.; Bollati, A.; Braschi, E.; Cifelli, F.; Molin, P.; Parotto, M.; Mattei, M.; Tommasini, S.; Conticelli, S. Conservation of 87Sr/86Sr isotopic ratios during the winemaking processes of ‘Red’ wines to validate their use as geographic tracer. Food Chem. 2016, 190, 777–785. [Google Scholar] [CrossRef] [PubMed]
  12. Trincherini, P.R.; Baffi, C.; Barbero, P.; Pizzoglio, E.; Spalla, S. Precise determination of strontium isotope ratios by TIMS to authenticate tomato geographical origin. Food Chem. 2014, 145, 349–355. [Google Scholar] [CrossRef] [PubMed]
  13. Walker, R.J.; Carlson, R.W.; Shirey, S.B.; Boyd, F.R. Os, Sr, Nd, and Pb isotope systematics of southern African peridotite xenoliths: Implications for the chemical evolution of the subcontinental mantle. Geochim. Cosmochim. Acta 1989, 53, 1583–1595. [Google Scholar] [CrossRef]
  14. Price, T.D.; Burton, J.H.; Bentley, R.A. The characterization of biologically available strontium isotope ratios for the study of prehistoric migration. Archaeometry 2002, 44, 117–135. [Google Scholar] [CrossRef]
  15. Willmes, M.; Bataille, C.P.; James, H.F.; Moffat, I.; McMorrow, L.; Kinsley, L.; Armstrong, R.A.; Eggins, S.; Grün, R. Mapping of bioavailable strontium isotope ratios in France for archaeological provenance studies. Appl. Geochem. 2018, 90, 75–86. [Google Scholar] [CrossRef]
  16. Durante, C.; Baschieri, C.; Bertacchini, L.; Bertelli, D.; Cocchi, M.; Marchetti, A.; Manzini, D.; Papotti, G.; Sighinolfi, S. An analytical approach to Sr isotope ratio determination in Lambrusco wines for geographical traceability purposes. Food Chem. 2015, 173, 557–563. [Google Scholar] [CrossRef] [PubMed]
  17. Sillen, A.; Hall, G.; Richardson, S.; Armstrong, R. 87Sr/86Sr ratios in modern and fossil food-webs of the Sterkfontein Valley: Implications for early hominid habitat preference. Geochim. Cosmochim. Acta 1998, 62, 2463–2473. [Google Scholar] [CrossRef]
  18. Durante, C.; Bertacchini, L.; Cocchi, M.; Manzini, D.; Marchetti, A.; Rossi, M.C.; Sighinolfi, S.; Tassi, L. Development of 87Sr/86Sr maps as targeted strategy to support wine quality. Food Chem. 2018, 255, 139–146. [Google Scholar] [CrossRef] [PubMed]
  19. Durante, C.; Baschieri, C.; Bertacchini, L.; Cocchi, M.; Sighinolfi, S.; Silvestri, M.; Marchetti, A. Geographical traceability based on 87Sr/86Sr indicator: A first approach for PDO Lambrusco wines from Modena. Food Chem. 2013, 141, 2779–2787. [Google Scholar] [CrossRef] [PubMed]
  20. Durante, C.; Bertacchini, L.; Bontempo, L.; Camin, F.; Manzini, D.; Lambertini, P.; Marchetti, A.; Paolini, M. From soil to grape and wine: Variation of light and heavy elements isotope ratios. Food Chem. 2016, 210, 648–659. [Google Scholar] [CrossRef] [PubMed]
  21. Marchionni, S.; Braschi, E.; Tommasini, S.; Bollati, A.; Cifelli, F.; Mulinacci, N.; Mattei, M.; Conticelli, S. High-precision 87Sr/86Sr analyses in wines and their use as a geological fingerprint for tracing geographic provenance. J. Agric. Food Chem. 2013, 61, 6822–6831. [Google Scholar] [CrossRef] [PubMed]
  22. Braschi, E.; Marchionni, S.; Priori, S.; Casalini, M.; Tommasini, S.; Natarelli, L.; Buccianti, A.; Bucelli, P.; Costantini, E.A.C.; Conticelli, S. Tracing the 87Sr/86Sr from rocks and soils to vine and wine: An experimental study on geologic and pedologic characterisation of vineyards using radiogenic isotope of heavy elements. Sci. Total Environ. 2018, 628, 1317–1327. [Google Scholar] [CrossRef]
  23. Tessier, A.; Campbell, P.G.C.; Bisson, M. Sequential extraction procedure for the speciation of particulate trace metals. Anal. Chem. 1979, 51, 844–851. [Google Scholar] [CrossRef]
  24. Albarède, F.; Telouk, P.; Blichert-Toft, J.; Boyet, M.; Agranier, A.; Nelson, B. Precise and accurate isotopic measurements using multiple-collector ICPMS. Geochim. Cosmochim. Acta 2004, 68, 2725–2744. [Google Scholar] [CrossRef]
  25. Wieser, M.E.; Schwieters, J.B. The development of multiple collector mass spectrometry for isotope ratio measurements. Int. J. Mass Spectrom. 2005, 242, 97–115. [Google Scholar] [CrossRef]
  26. Ingle, C.P.; Sharp, B.L.; Horstwood, M.S.A.; Parrish, R.R.; Lewis, D.J. Instrument response functions, mass bias and matrix effects in isotope ratio measurements and semi-quantitative analysis by single and multi-collector ICP-MS. J. Anal. At. Spectrom. 2003, 18, 219–229. [Google Scholar] [CrossRef]
  27. Nowell, G.M.; Pearson, D.G.; Ottley, C.J.; Schwieters, J.; Dowall, D. Long term performance characteristics of a plasma ionization multi collector mass spectrometer (PIMMS): The Thermo Finnigan Neptune. In Plasma Source Mass Spectrometry, Application and Emerging Technologies; Holland, J.G., Tanner, S.D., Eds.; Royal Society of Chemistry: London, UK, 2003; pp. 307–320. [Google Scholar]
  28. Ehrlich, S.; Gavrieli, I.; Dor, L.B.; Halicz, L. Direct high-precision measurements of the 87Sr/86Sr isotope ratio in natural water, carbonates and related materials by multiple collector inductively coupled plasma mass spectrometry (MC-ICP-MS). J. Anal. At. Spectrom. 2001, 16, 1389–1392. [Google Scholar] [CrossRef]
  29. Kim, R.J.; Yoon, J.K.; Kim, T.S.; Yang, J.E.; Owen, G.; Kim, K.R. Bioavailability of heavy metals in soils: definitions and practical implementation—A critical review. Environ. Geochem. Health 2015, 37, 1041–1061. [Google Scholar] [CrossRef] [PubMed]
  30. Blum, J.D.; Taliaferro, E.H.; Weisse, M.T.; Holmes, R.T. Changes in Sr/Ca, Ba/Ca and 87Sr/86Sr ratios between trophic levels in two forest ecosystems in the northeastern U.S.A. Biogeochemistry 2000, 49, 87–101. [Google Scholar] [CrossRef]
  31. Aberg, G. The use of natural strontium isotopes as tracers in environmental studies. Water Air Soil Pollut. 1995, 79, 309–322. [Google Scholar] [CrossRef]
  32. Aberg, G.; Fosse, G.; Stray, H. Man, nutrition and mobility: A comparison of teeth and bone from the Medieval era and the present from Pb and Sr isotopes. Sci. Total Environ. 1998, 224, 109–119. [Google Scholar] [CrossRef]
  33. Bohlkea, J.K.; Horan, M. Strontium isotope geochemistry of ground waters and streams affected by agriculture, Locust Grove, MD. Appl. Geochem. 2000, 15, 599–609. [Google Scholar] [CrossRef]
  34. Stein, M.; Starinsky, A.; Katz, A.; Goldstein, S.L.; Machlus, M.; Schramm, A. Strontium isotopic, chemical and sedimentological evidence for the evolution of lake Lisan and the Dead sea. Geochim. Cosmochim. Acta 1997, 61, 3975–3992. [Google Scholar] [CrossRef]
  35. ISO. Soil Quality—Extraction of Trace Elements from Soil Using Ammonium Nitrate Solution; DIN ISO 19730 (2009-07); ISO: Geneva, Switzerland, 2009. [Google Scholar]
  36. Cocchi, M.; Durante, C.; Marchetti, A.; Li Vigni, M.; Baschieri, C.; Bertacchini, L.; Sighinolfi, S.; Tassi, L.; Totaro, S. Optimization of microwave assisted digestion procedure by means of chemometric tools. In Microwaves: Theoretical Aspects and Practical Applications in Chemistry; Marchetti, A., Ed.; Transworld Research Network: Trivandrum, Kerala, India, 2011; pp. 203–223. ISBN 978-81-7895-508-7. [Google Scholar]
  37. Baschieri, C. Food Traceability: A Multivariate Approach to Procedures Optimization and Models Development. Ph.D. Thesis, University of Modena and Reggio Emilia, Modena, Italy, 2012. [Google Scholar]
  38. Berglund, M.; Wieser, M.E. Isotopic compositions of the elements 2009 (IUPAC Technical Report). Pure Appl. Chem. 2011, 83, 397–410. [Google Scholar] [CrossRef] [Green Version]
Figure 1. Values of 87Sr/86Sr determined on solutions varying both the Rb and Sr concentrations.
Beverages 04 00055 g001
Table 1. Comparison between the distribution size of soils milled by the centrifugal mill equipped with a 12 ribs rotor and 500 µm trapezoidal sieve ring, M1 and M2 samples, and the planetary mill equipped with a single agate jar, M3 and M4 samples.
Sample Size µmSample M1
%, w/w
Sample M2
%, w/w
Sample M3
%, w/w
Sample M4
%, w/w
3150.10---------
2503.004.005.90---
1806.9013.0012.2014.40
12516.1017.1013.6021.50
9026.8028.0019.4014.20
6332.1029.2025.8026.00
509.907.3012.4011.30
Collecting pan5.101.4010.7012.50
Table 2. Values of the 87Sr/86Sr isotope ratio determined on the soils processed by the planetary mill at different particle sizes.
Sample Size µm(87Sr/86Sr)_M1(87Sr/86Sr)_M2(87Sr/86Sr)_M3(87Sr/86Sr)_M4
2500.7100880.7097780.7091790.711348
1800.7100810.7097690.7091490.711369
1250.7101030.7098040.7091830.711377
900.7101050.7097910.7091830.711382
630.7100900.7097840.7091940.711380
500.7100920.7097820.7091920.711375
Collecting pan0.7101090.7097630.7091990.711366
Mean0.710100.709780.709180.71137
SD0.000010.000010.000020.00001
Whole sample 10.710070.709780.709200.71136
Mean-Whole sample|0.000030.000000.000020.00001
1 Value obtained on the soil samples processed by centrifugal mill equipment.
Table 3. Values of the 87Sr/86Sr ratio measured for soils, vine branches, and wines sampled from a producer in the Chianti Classico wine area.
SiteHole87Sr/86Sr
Soil 1
87Sr/86Sr
Branch 2
87Sr/86Sr
Wine 3
A1up0.710020.709630.70943
1dw0.70994
2up0.709180.70914
2dw0.70922
Mean ± SD 0.70959 ± 0.000450.70939 ± 0.00035
B3up0.709000.709050.70941
3dw0.70900
4up0.709450.70924
4dw0.70954
5up0.709780.70977
5dw0.71006
6up0.709770.70941
6dw0.71034
7up0.709920.70929
7dw0.70986
Mean ± SD 0.70967 ± 0.000430.70935 ± 0.00027
1 Uncertainty value associated with the 87Sr/86Sr ratio data evaluated on the processed soil control sample u = ±0.00002 [20]. 2 Uncertainty value associated with the 87Sr/86Sr ratio data evaluated on the processed branch control sample u = ±0.00002 [20]. 3 Uncertainty value associated with the 87Sr/86Sr ratio data evaluated on the processed wine control sample u = ±0.00002 [20].
Table 4. Results of the one-way ANOVA for statistically significant differences in the soils, vine branches, and wine data reported in Table 3.
Source of VariationSum of SquaresDegree of FreedomFF crit (α = 0.05)
Between groups4.17004 × 10−721.5303.492
Within groups2.72386 × 10−620

