Article

The Grape Health Index: Validation of a Chemometric Model for Quantifying the Wine Grape Infection Status


by
Stephan Sommer
1,*,
Steven Craig Ebersole
2 and
Sonet Van Zyl
2
1
Grape and Wine Institute, University of Missouri-Columbia, 240 Agricultural Engineering, Columbia, MO 65211, USA
2
Viticulture and Enology Research Center, California State University, 2360 E. Barstow Ave, Fresno, CA 93740, USA
*
Author to whom correspondence should be addressed.
Beverages 2025, 11(6), 156; https://doi.org/10.3390/beverages11060156
Submission received: 6 September 2025 / Revised: 10 October 2025 / Accepted: 28 October 2025 / Published: 3 November 2025
(This article belongs to the Section Wine, Spirits and Oenological Products)

Abstract

Accurately evaluating and quantifying microbial spoilage on wine grapes is a major challenge, especially in machine-harvested fruit that is no longer intact as a cluster when it arrives at the winery and cannot be visually inspected. The goal of the study was, using an infrared spectroscopy-based analytical system, to establish a unitless quantitative number that would reflect complex microbial spoilage and could be applied for all types of grapes with only one calibration model. Grapes (cultivars Riesling, Chenin Blanc, Chardonnay, Zinfandel and Petite Sirah) were hand-harvested in two consecutive vintages and separated in the vineyard into visually healthy clusters and infected grapes. Grapes were blended with increasing infection levels between 0 and 20% and models were created using known spoilage indicators. The resulting formula can be used to calculate a weighted index that reflects the microbial infection status of the grape material. Using a common spectroscopy instrument that is already present in larger wineries, the Grape Health Index allows for a quantitative quality assessment within two minutes at the test stand before the grape material is accepted. When visual inspection is not an option, this can help to make data-based quality and blending decisions at a very early stage.

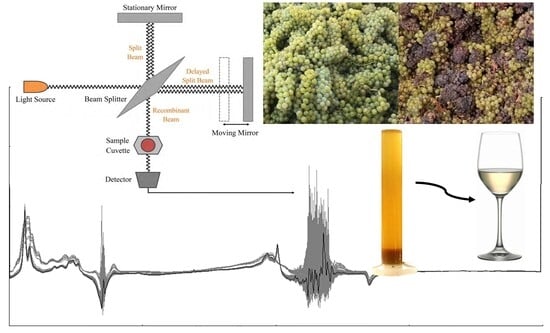
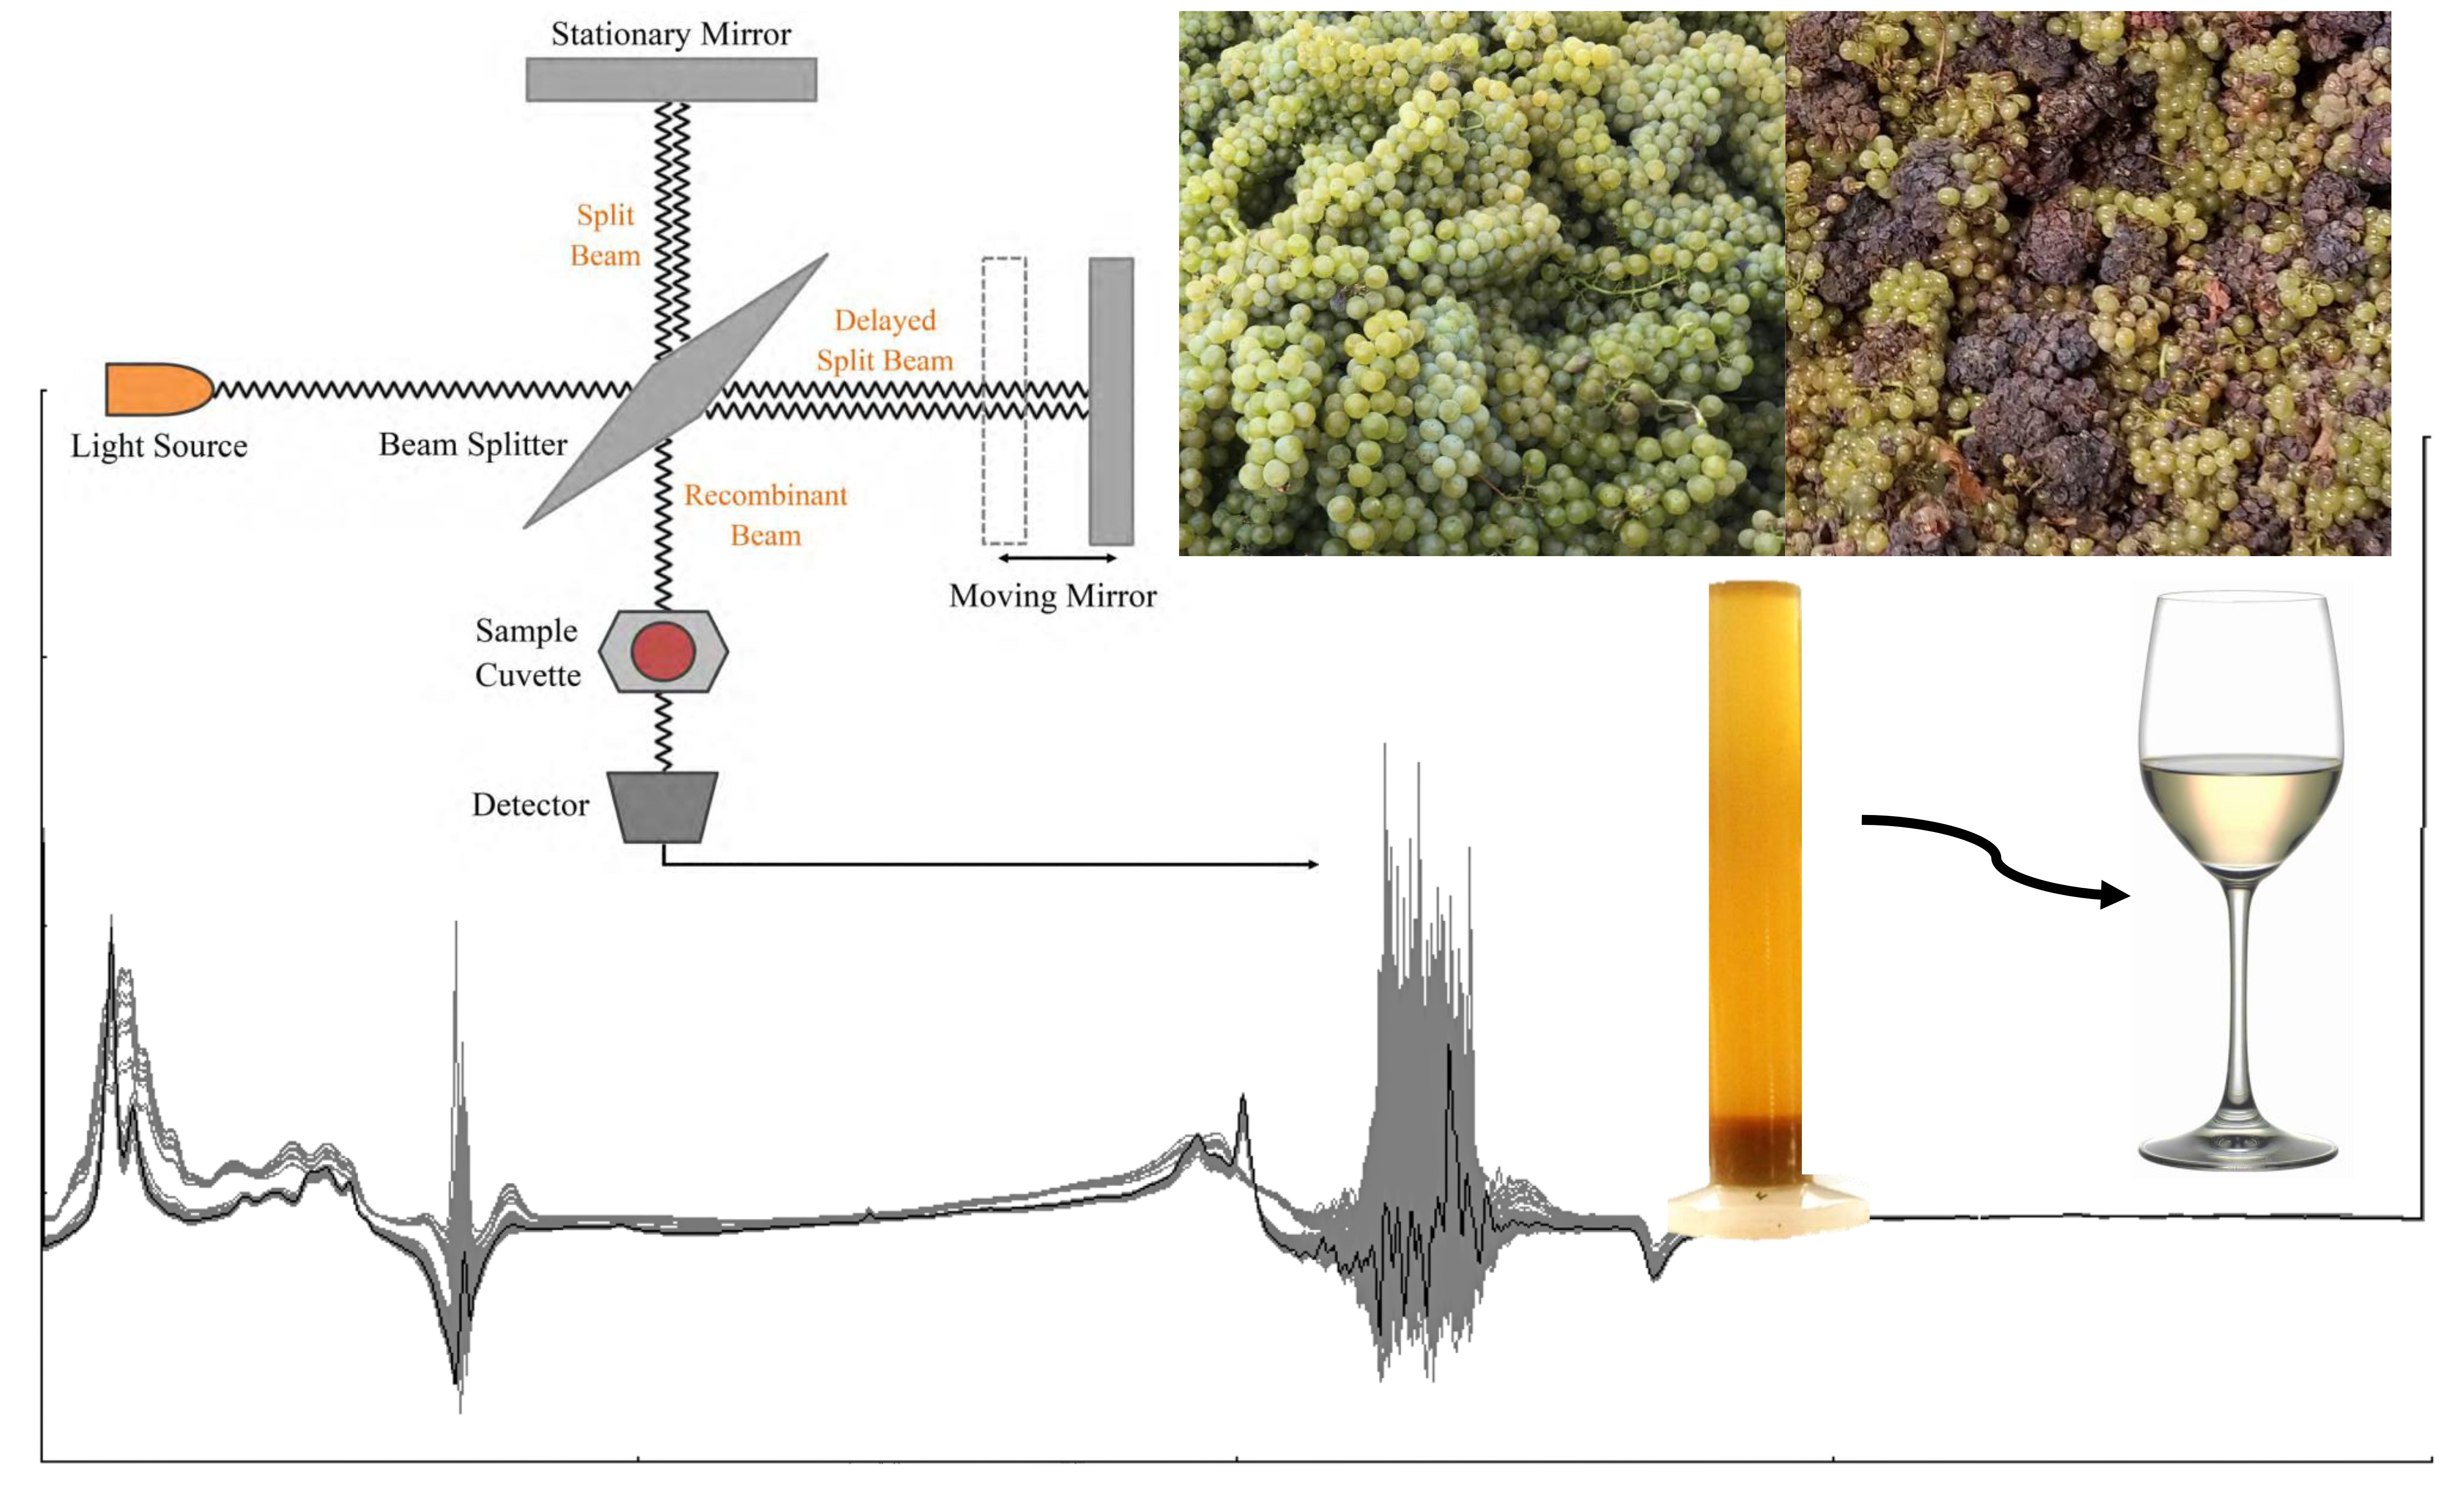
Graphical Abstract

1. Introduction

Wine grapes are an important economic factor for many countries across the world and decreasing yield as well as lower grape quality due to microbial infections can severely impact the operational and economic outcome for wineries. Spoilage can be caused by a wide variety of microorganisms that often grow in complex communities, benefiting from metabolites that are produced and excreted from other microbes [1]. Botrytis cinerea is a fungus known to produce gluconic acid and glycerol by metabolizing glucose [2]. The effects of B. cinerea on grape berries are comparatively mild, causing a slight breakdown of tissue underneath the surface of the skin [1]. Aspergillus niger, Rhizopus stolonifera, and Penicillium italicum, on the other hand, can decompose the berry skin, allowing other microorganisms access to carbohydrate sources inside the berry, and facilitate the production of gluconic acid from glucose [1,2].
Native yeasts involved in that process include Saccharomyces spp., Pichia spp., Hanseniaspora spp., and Metschnikowia spp. These yeasts are known to ferment glucose and fructose to ethanol [1]. One species of acetic acid bacteria, Gluconobacter oxydans, is responsible for the production of gluconic acid and acetic acid from glucose and the oxidation of ethanol to acetic acid [1]. Through this interaction, yeasts and bacteria benefit from fungal infections and make the metabolic profile more complex. Lactic acid bacteria can also enter the grape berry through micro fissures in the skin. Heterofermentative lactic acid bacteria strains convert glucose to lactic acid, ethanol, and acetic acid. Homofermentative strains metabolize glucose molecules to produce D-lactic acid [1].
In addition to single mold species, mold complexes are known to impact yield, berry composition [3] and organoleptic properties of finished wine [4], compelling the wine industry to identify, measure, and mitigate their impact. For instance, a mold complex known as sour rot has been increasingly observed in vineyards [3] and is detrimental to grape health. Sour rot is the result of the coinfection of various fungi and wild yeast, which convert grape sugars to ethanol, and bacteria that oxidizes ethanol to acetic acid, a process which is facilitated by Drosophila sp. fruit flies [5]. The microorganisms responsible for sour rot gain access to berries by means of a phenomenon, known as berry splitting which is caused by biotic and abiotic factors. Punctures and microscopic fissures observed from berry splitting are the result of insects, birds, mildews, high degrees of swelling of the fruit, the pressure of surrounding grapes on each other, and mechanical injuries [1].
Grapes showing visual symptoms of sour rot and concentrations of volatile acidity (VA) of at least 0.83 g/L are considered infected with the disease [6]. Infected clusters are often not harvested due to the risk of unacceptable levels of volatile acidity [7]. In addition to ethanol, acetic acid, and ethyl acetate, undesirable changes in berry composition can include elevated metabolic production of acetaldehyde, glucuronic acid, and gluconic acid [8,9]. Gluconic acid is also a common marker of microbial infection and is suspected to negatively impact the sensory characteristics of wine [4]. It can be produced by both fungi and acetic acid bacteria, such as A. niger, B. cinerea and G. oxydans. A. niger has been found to produce higher quantities of gluconic acid compared to B. cinerea [10], as well as Penicillium species [2].
Methods for estimating the amount of microbial spoilage in harvested grapes strongly depend on the method of collection. While visual inspection works for hand-harvested material but is more complicated with machine-harvested fruit that does not leave the clusters intact. Advanced technology like hyperspectral imaging has been used to detect infections in the vineyard [11]; however, the results are not representative since only topical spoilage can be recorded and mold inside the clusters is not considered. Immunological approaches [12] showed promising results but failed to produce reliable data on machine-harvested grapes. Other techniques are only targeting single organisms like Botrytis and are not detecting multiple infections and mold complexes [13,14,15,16]. In order to analyze infection rates after harvest in a liquid matrix, several analytical techniques were developed to analyze specific fungal metabolites like ergosterol [17], gluconic acid [18,19] or glycerol [20]. While being accurate and reliable, these techniques do not predict complex microbial communities and do not allow the evaluation of a multi-organism infection. Spectroscopic techniques can overcome these limitations and have gained acceptance in the wine industry for different applications [21].
In spectroscopy, chemical compounds are exposed to various wavelengths of light. Due to variations in molecular structure, compounds can be identified by correlating the wavelengths of light which they absorb to their known absorption patterns on the electromagnetic spectrum. The concentration of a compound can be determined by correlating the degree of its absorption of specific wavelengths to known concentrations [22]. Fourier-transform mid-infrared spectroscopy (FT-MIR) is a viable method for simultaneous multicomponent analysis of many enological analytes, including alcohol, organic acids, volatile acidity, reducing sugars [23,24], glycerol [25], anthocyanins [26,27] and polysaccharides [28]. The specific advantages of this technology over other techniques are the speed of analysis, the lack of reagent requirements and the ability to capture multiple groups of chemical compounds simultaneously which can then be translated into complex microbial signatures.
The objective of this study was to measure the byproducts of complex microbial infections in field-conditioned grapes using FT-MIR spectroscopy and build a prediction model that would result in a unitless number called the Grape Health Index.

2. Materials and Methods

2.1. Sample Selection and Processing

Grapes (cultivars Riesling, Chenin Blanc, Chardonnay, Zinfandel and Petite Sirah) were identified based on microbial infection in a commercial vineyard in the Lodi region of California in two consecutive vintages (2019 and 2020), hand-harvested and separated in the vineyard into visually healthy clusters and infected grapes. The selection of microbially impacted grapes was performed by trained industry professionals based on visually identifiable infections. Infected grapes were harvested in separate bins and partially infected clusters were divided to keep the separation as clean as possible. Each selection was transported to the research winery, crushed and destemmed separately and blended with increasing concentrations of microbial spoilage (control with no visible infection, 5%, 10%, 15% and 20% infected grapes). White grapes were pressed and blended based on juice volume, while red grapes were blended by weight and fermented in contact with the skins. All experiments were performed in duplicates. Samples were taken for juice analysis prior to fermentation and after the winemaking process was finished. All wines were treated according to industry best practices (yeast: VIA-DRY PDM, Lallemand Inc., Montreal, QC, Canada; bacteria for malolactic fermentation for red wines: LalVin VP41, Lallemand Inc., Montreal, QC, Canada) including stabilization with sulfur dioxide, filtration and bottling. Replicates were averaged for FT-MIR modeling.

2.2. FT-MIR Spectroscopy and Data Analysis

A FT2 FOSS WineScan™ SO2 (FOSS A/S, Hillerød, Denmark) with a pyroelectric DTGS detector and a Michelson interferometer was used to analyze all samples. The Partial Least Square (PLS) regression was run on XLSTAT (Addinsoft; Paris, France). The number of components (latent vectors), in each model were automatically selected by the software to minimize the error of prediction (RMSE). Components are linear combinations of the p variables of the matrix X that maximize the covariance between Xw and y [29]. Components are ranges on the electromagnetic spectrum determined by varying degrees of collinearity. The 15 factors tested during model development were unmodified, except for the fructose to glucose ratio (F/G ratio), which was a calculated attribute to control for the effects of evaporative loss on grape berries due to heat. The pre-calibrated and pre-validated prediction models of the FOSS WineScan™ were used as provided. A total of 48 samples were analyzed, and 15 analytes (Brix, total acidity (TA), tartaric acid, malic acid, pH, yeast assimilable nitrogen (YAN), α-amino nitrogen, ammonia, volatile acidity (VA), ethanol, density, gluconic acid, fructose, glucose and lactic acid) were calculated in each sample. Multivariate regression was determined to be superior to univariate because of its ability to analyze all explanatory variables at once. No samples were excluded from the model, even if removing samples would increase the overall accuracy of the model, to reflect the true variability of field conditioned grapes.
Explanatory variables were rank ordered based on current knowledge of their degree of interaction with microorganisms as shown in Table 1.

3. Results and Discussion

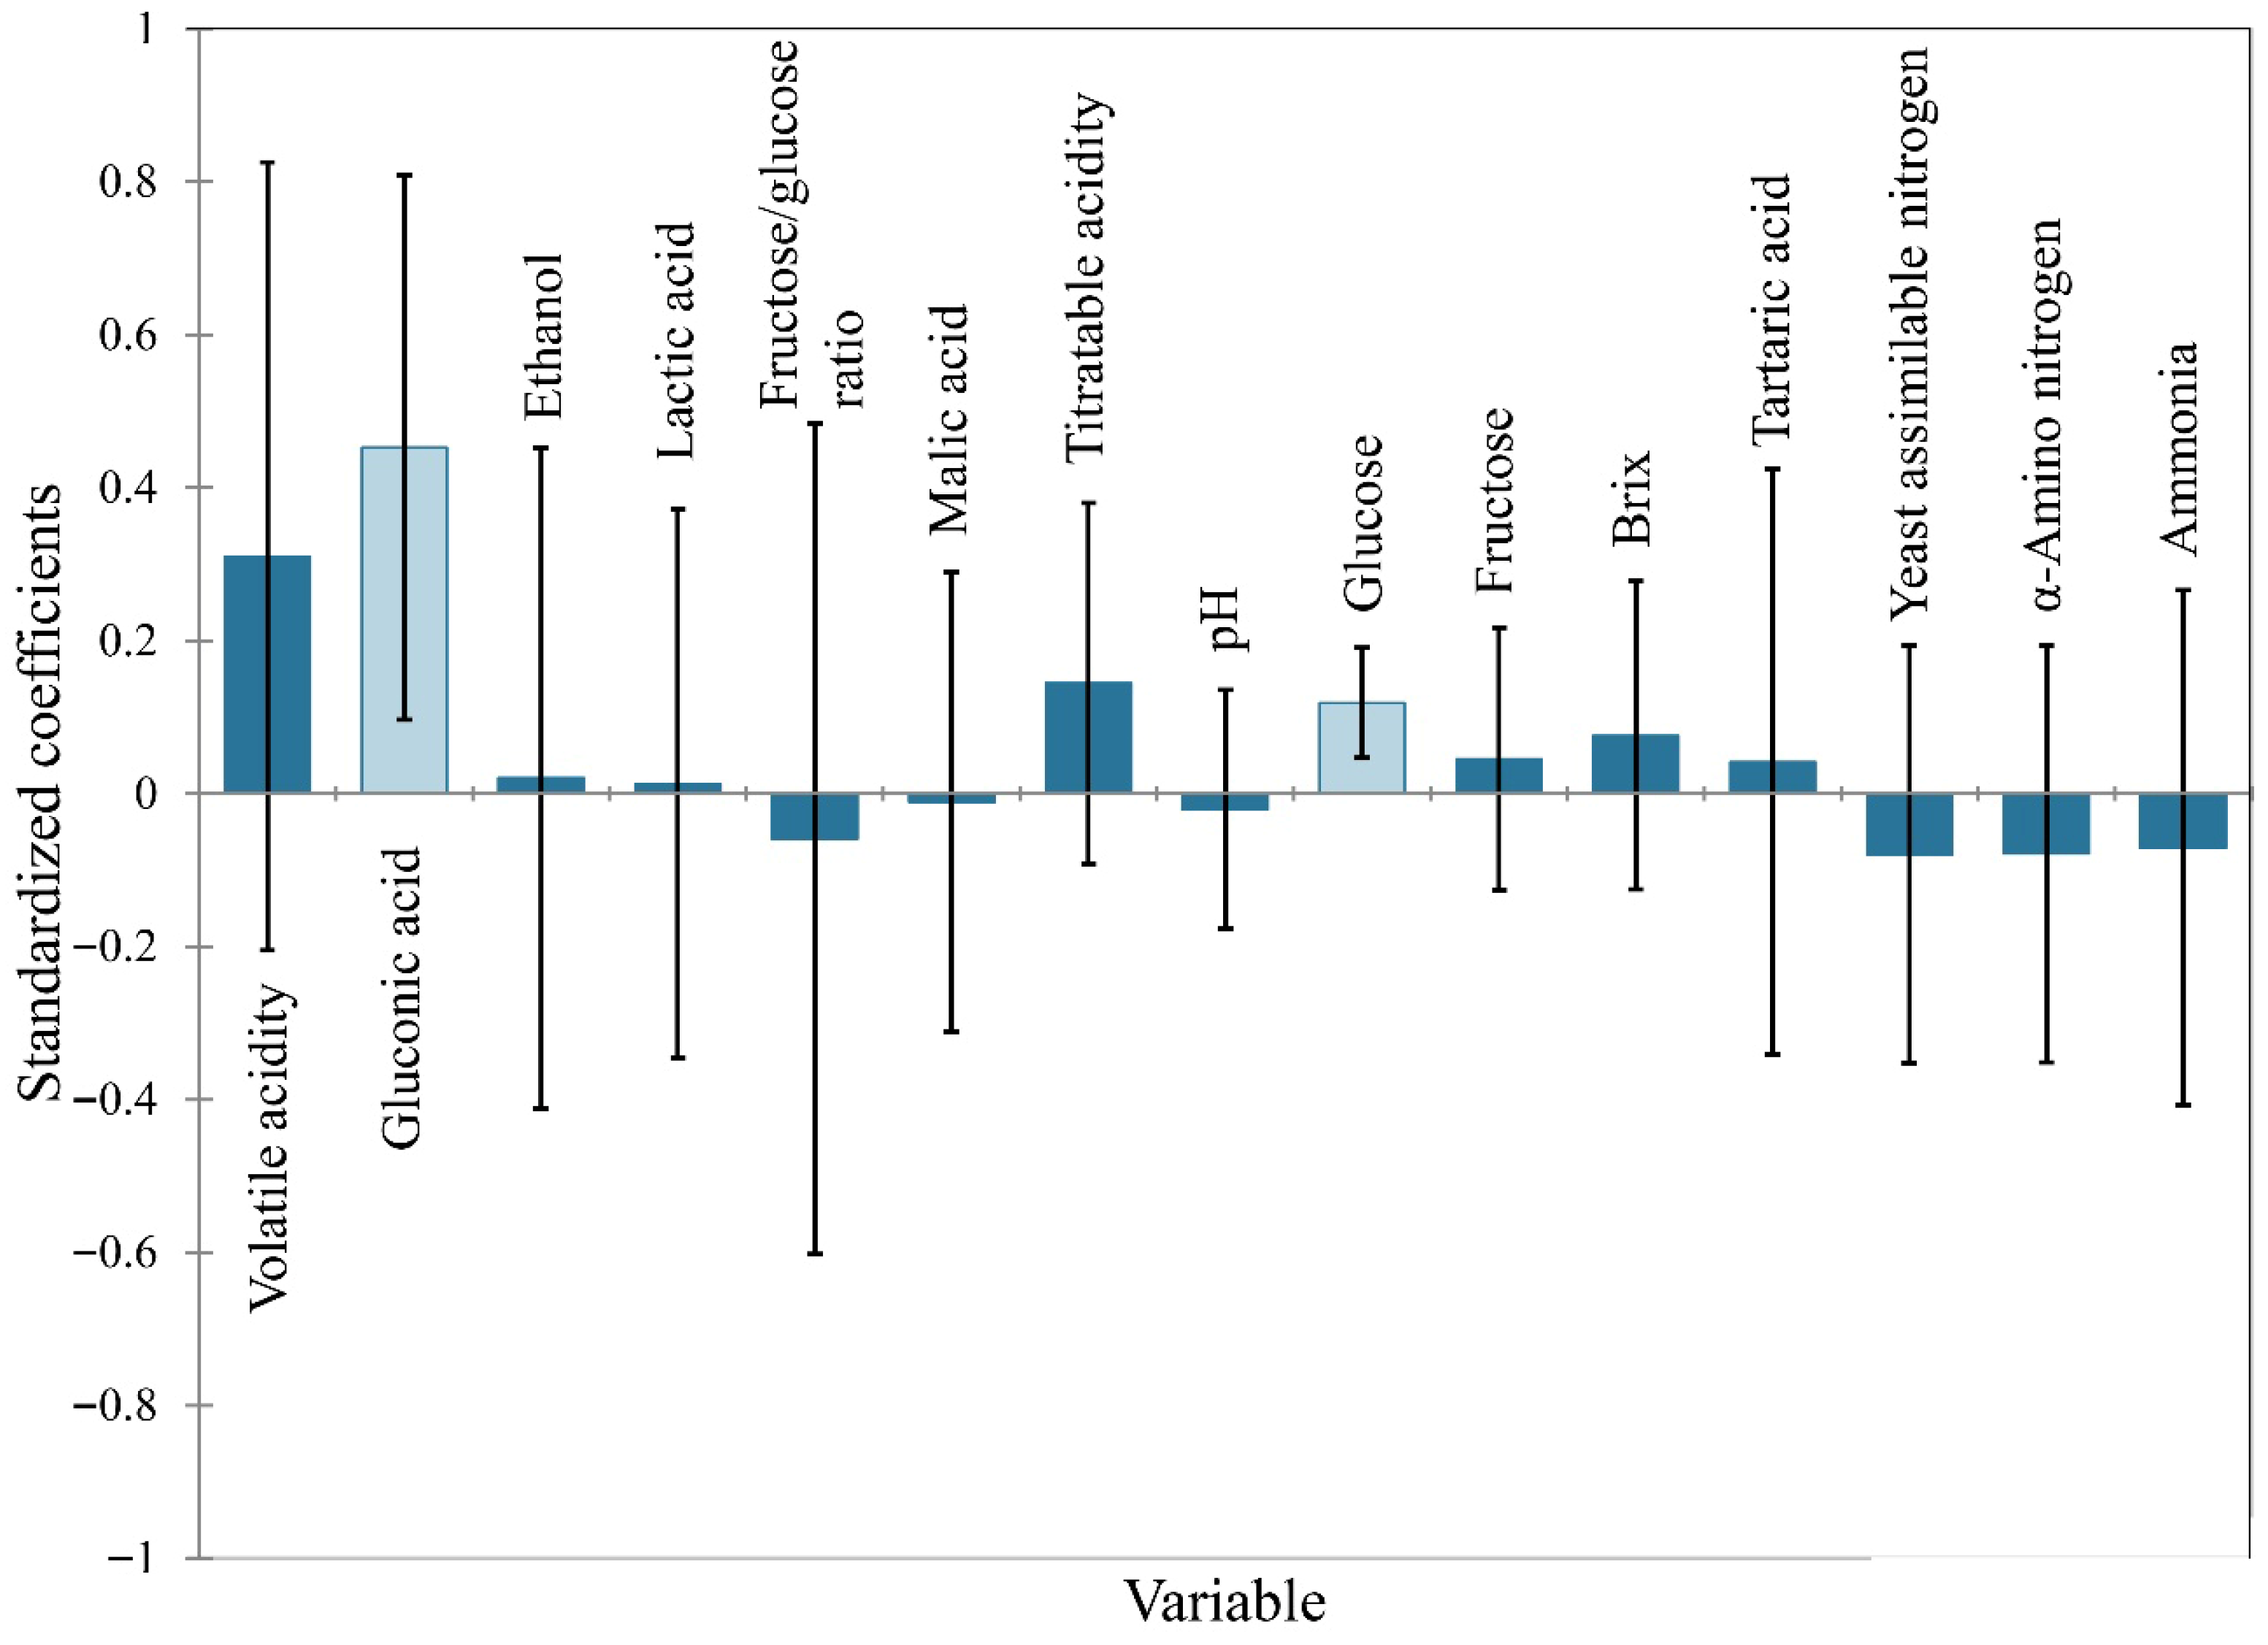
A model was run with all 15 explanatory variables to understand their correlation with microbial spoilage (Figure 1). In this case, microbial spoilage is considered the response variable. Metabolites with highly positive and negative coefficients are thought to be important for increasing and decreasing the response variable. It is important to note that coefficients only show correlation trends not a causal relationship in a biological context [36]. Thus, model construction should include higher level statistics and contextual information.
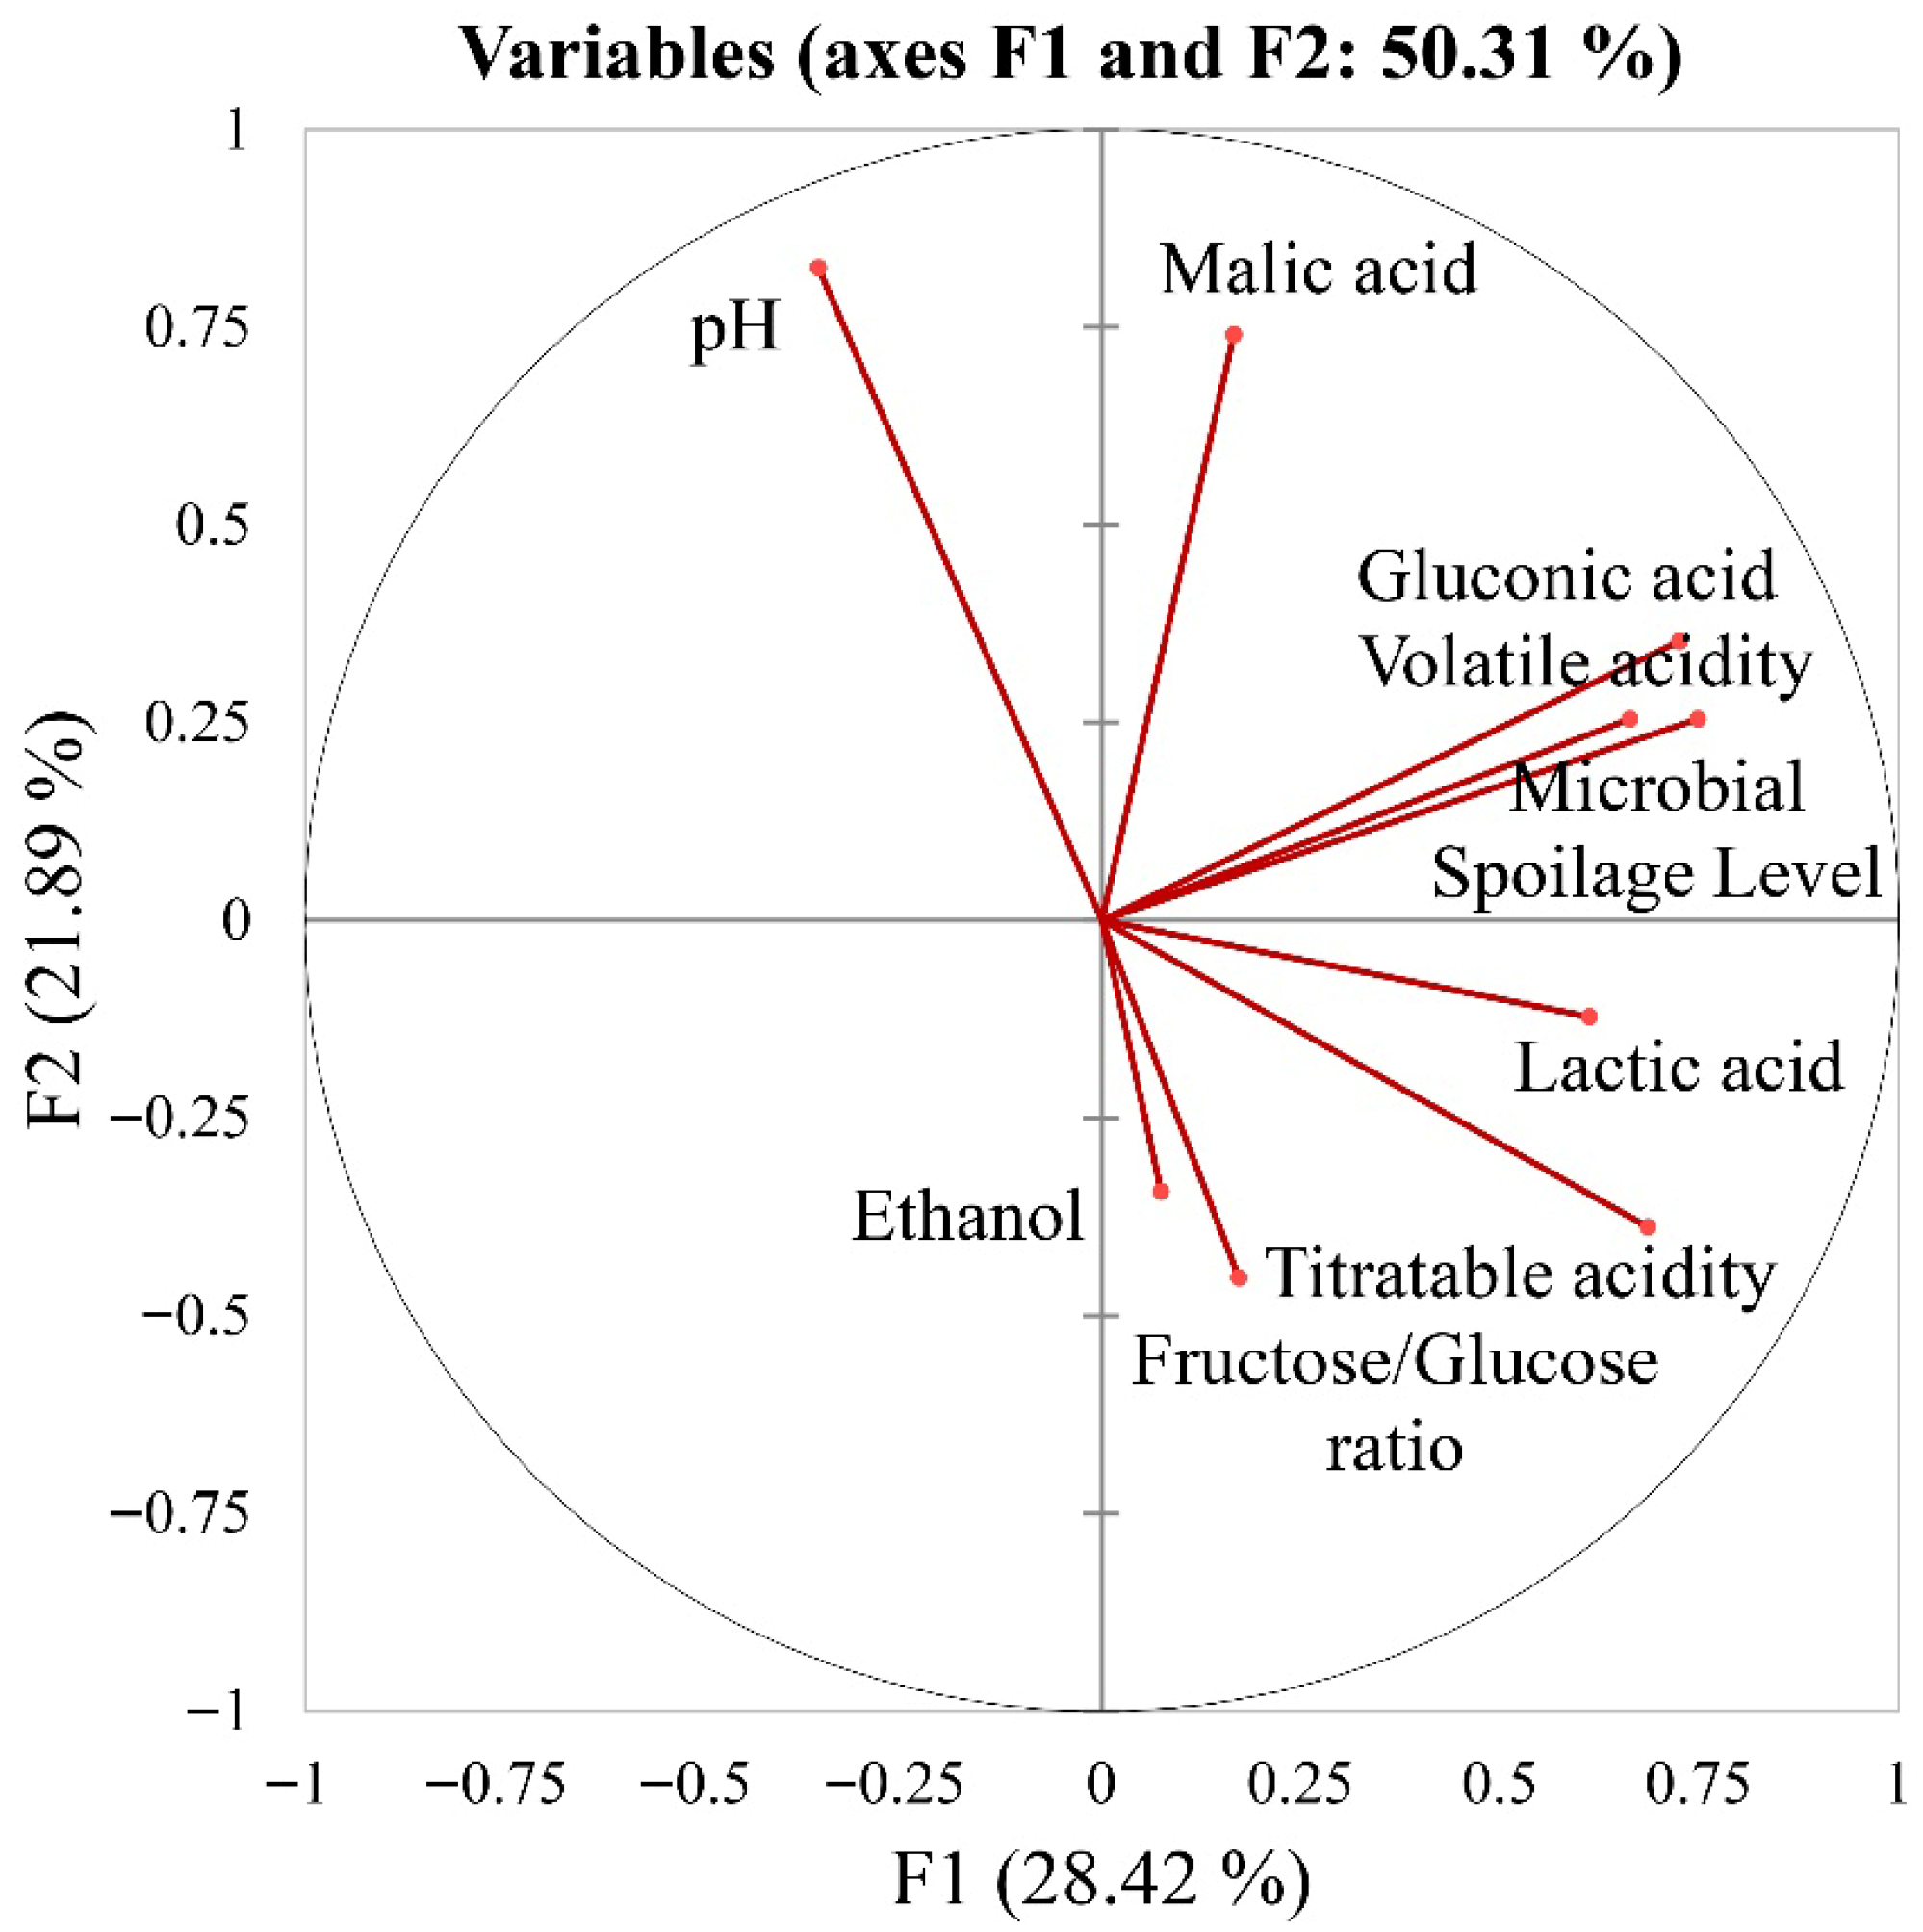
The explanatory variables with the highest coefficients were volatile acidity and gluconic acid, which aligns with the previous literature cited. This means that the majority of the prediction from the model will be based on gluconic acid and VA. Another illustration of the strength of the relationship of gluconic acid and VA with microbial spoilage can be seen in the Principal Component Analysis (PCA) graph in Figure 2. Gluconic acid, VA, and microbial spoilage are grouped together, implying a strong positive correlation. While gluconic acid is mainly associated with fungal infections [31] that often represent the starting point of grape rot by perforating the berry skin, VA is formed by a large number of microorganisms [30]. Molds, native yeasts, as well as lactic and acetic acid bacteria form volatile acids like acetic acid as part of their sugar metabolism, meaning that VA represents a rather complex portfolio of microbial infections.
As expected, ethanol was positively correlated with microbial spoilage. Surprisingly, lactic acid was not strongly correlated with microbial spoilage. This could be due to the interference of other organic acids, as noted previously, and the presence of large standard error bars relative to their absolute value as a coefficient. Another explanation could be that yeast actively metabolizes D-lactic acid in grapes which could cause the lactic acid concentration to decline in some circumstances. The F/G ratio was thought to increase with increasing degrees of microbial spoilage, but in the samples used to build this model a negative correlation was found. This can be seen in the multiple regression in Figure 1 where the error bars for the F/G ratio were large and extended well into the positive coefficient territory despite having a negative standardized coefficient. This indicates that in some samples there were positive correlations between the F/G ratio and microbial spoilage. This could be due to the preference of wild yeast in vineyards for fructose over glucose, the precision of the WineScan™ calibration models for fructose and glucose, or anomalies in the samples used to develop the model. However, the F/G ratio is perpendicular to microbial spoilage in Figure 2 which indicates no correlation. This discrepancy is due to how multiple regression models the relationship between a response variable and several explanatory variables, whereas PCA identifies relationships within a set of variables. So, the F/G ratio can show no relationship with microbial spoilage when compared within a set of variables but simultaneously have a negative correlation when the response variable, microbial spoilage, is compared directly to the F/G ratio.
Eleven multivariate models were constructed to predict microbial spoilage in grape samples (Table 2). The first model included the five explanatory variables which were determined to be most relevant based on the previous literature. Subsequent models included an additional explanatory variable based on the order of importance in Table 1.
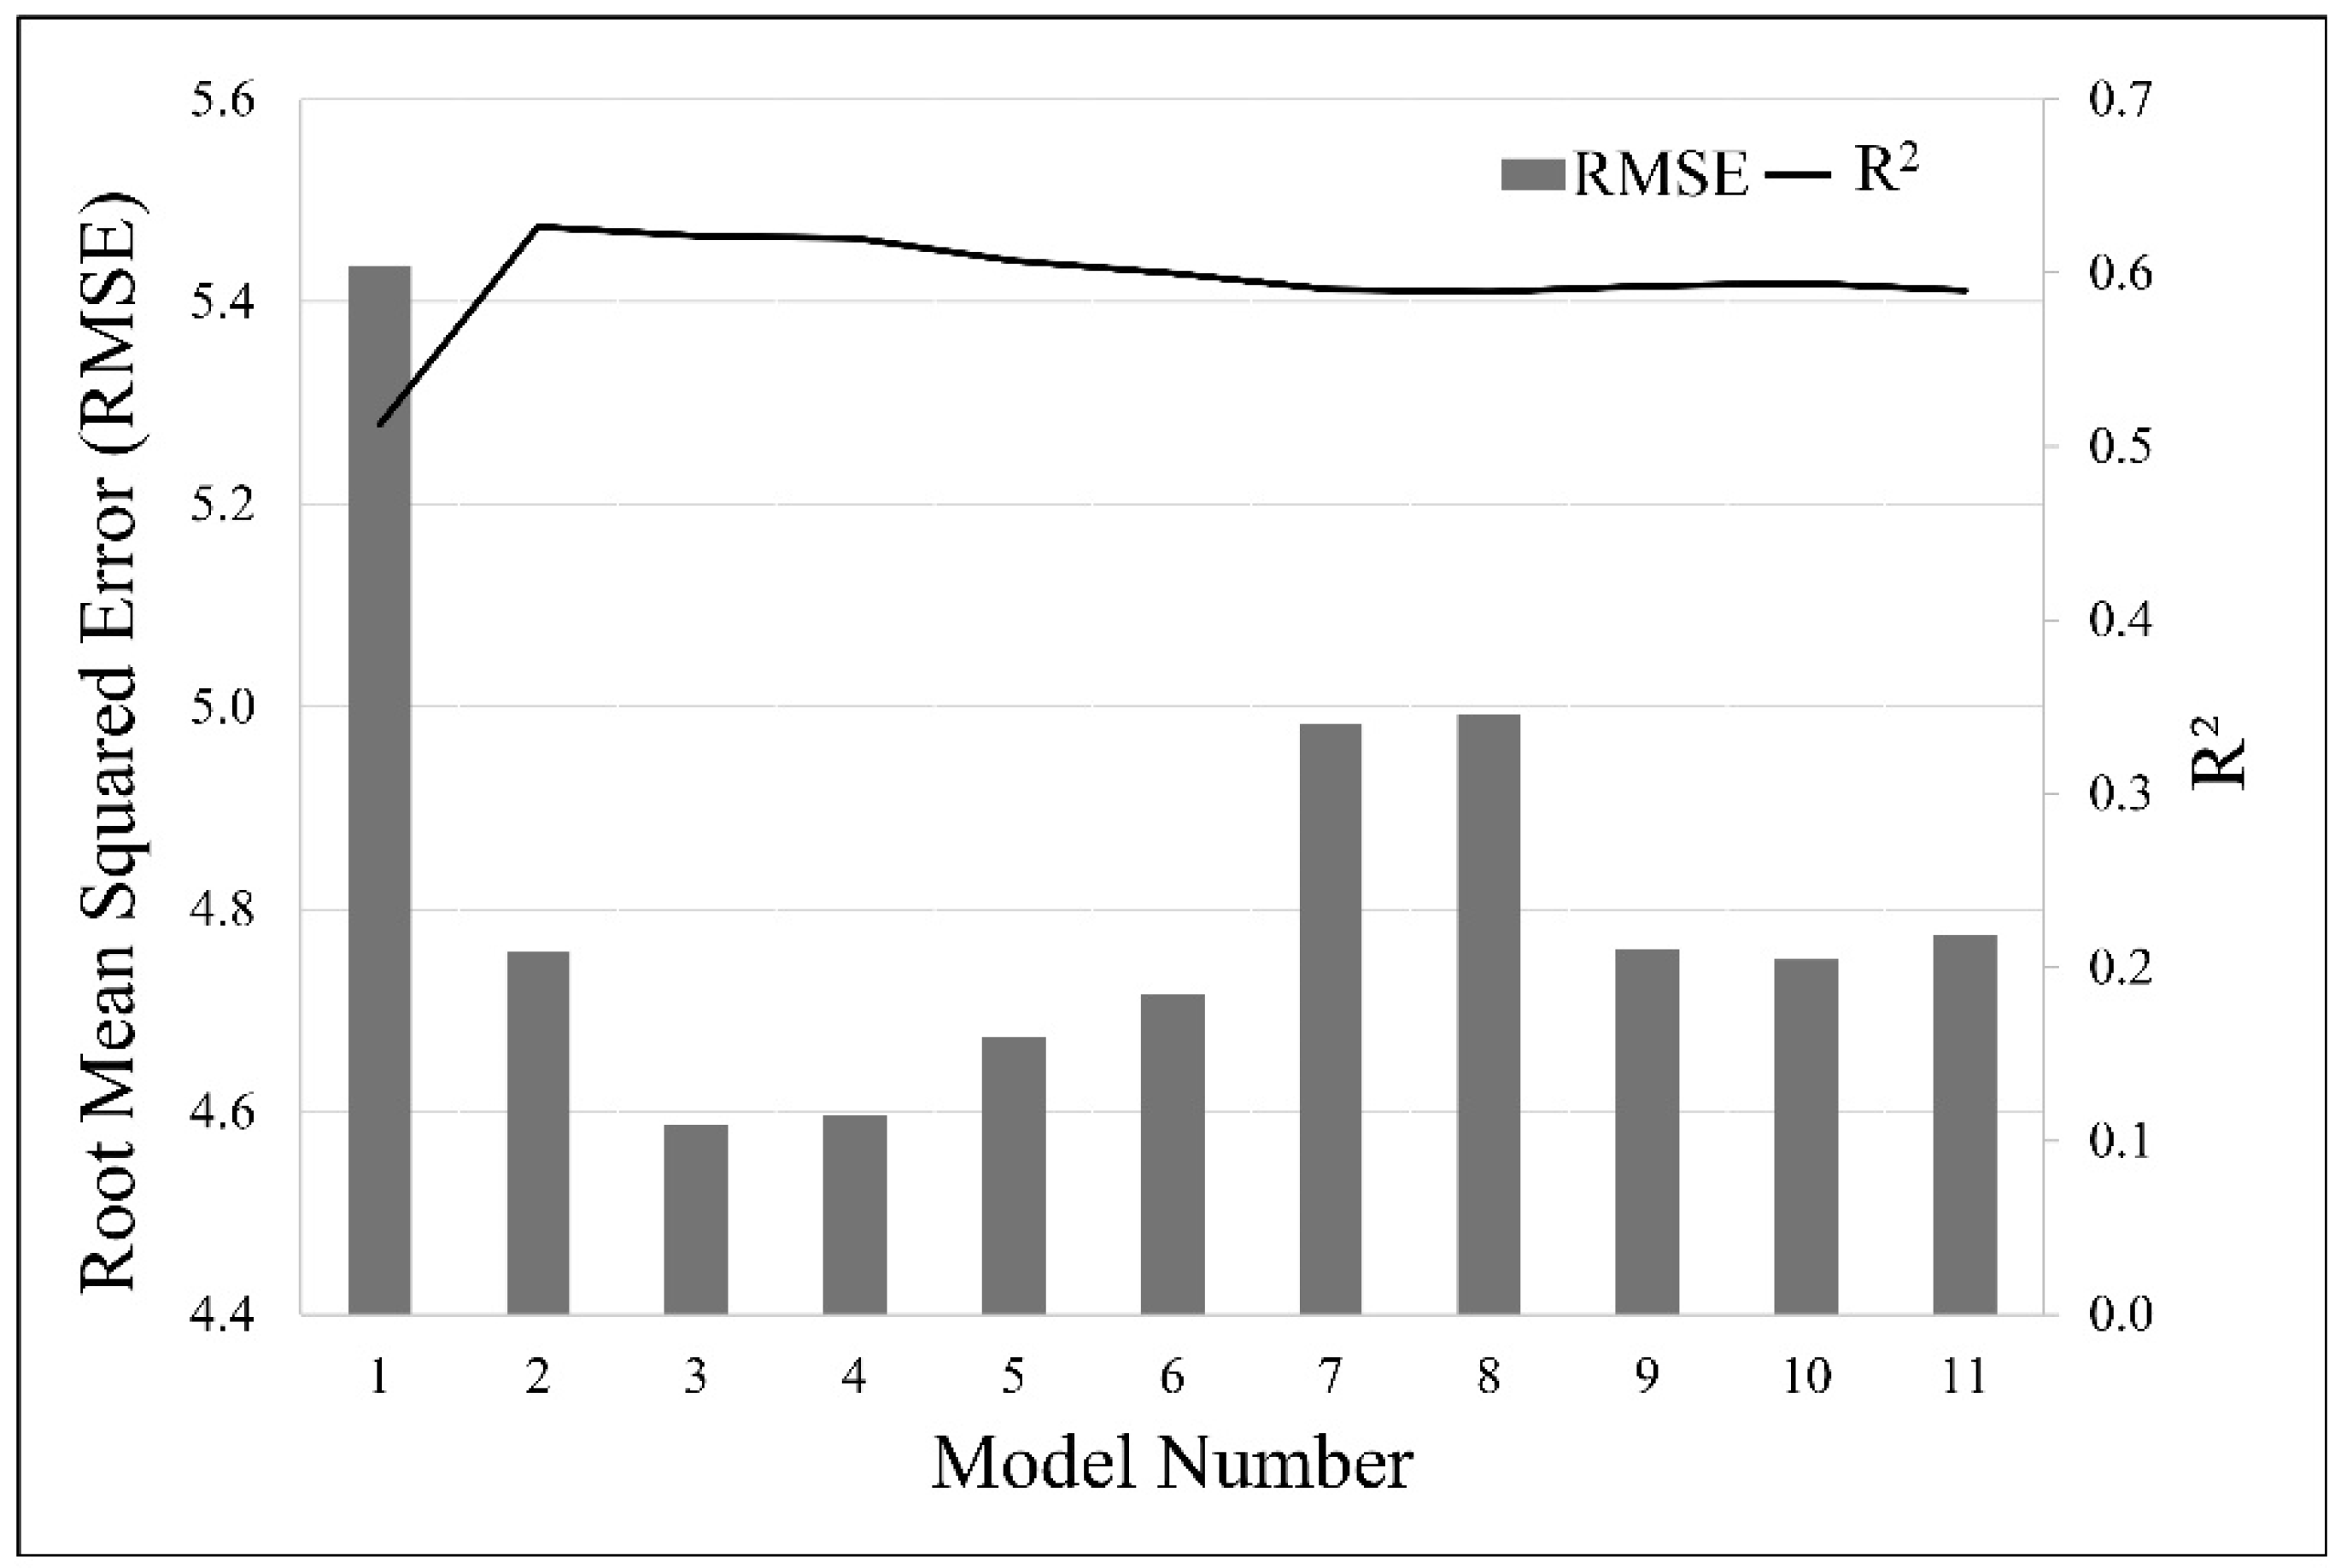
The parameters for selecting a model include choosing a model that minimizes the RMSE and includes explanatory variables that are known to be correlated with microbial spoilage. The models with the lowest RMSE were models 3 and 4 (Figure 3). The difference between models 3 and 4 was the addition of pH as a parameter to model 4. Due to previous research suggesting a relationship between pH and microbial spoilage, model 4 was selected as the best model to use despite its slightly higher RMSE. Model 5 was considered as a candidate, but its RMSE was substantially higher than model 4. Furthermore, the new explanatory variable in model 5, often increases due to physical dehydration rather than microbial spoilage, which could lead to false positive correlations.
To evaluate the predictive ability of the calibration model, the residual predictive deviation (RPD) was used. An RPD value is the ratio of the standard deviation (SD) of the validation samples to the RMSE (RPD = SD/RMSE). A higher RPD value increases the ability of the calibration model to make accurate predictions. An RPD value greater than three (range 3.1 to 4.9) is considered suitable for analytical purposes, an RPD value greater than 5 (range 5 to 6.4) is good for quality control. However, a more qualitative interpretation of the RPD can be used, where an RPD value lower than 1.5 is considered insufficient for most applications while calibration models with values greater than 2 are considered excellent, and could be used for screening [37].
In this study, model 4 has an RPD value of 1.04 (4.800/4.596), which would likely be too low for screening purposes. However, an important point to consider is the difference between screening for a singular chemical versus the chemical markers of a biological system like microbial spoilage, the latter being far more complex. This may give latitude for an RPD value below 1.5 to be deemed sufficient for screening purposes.
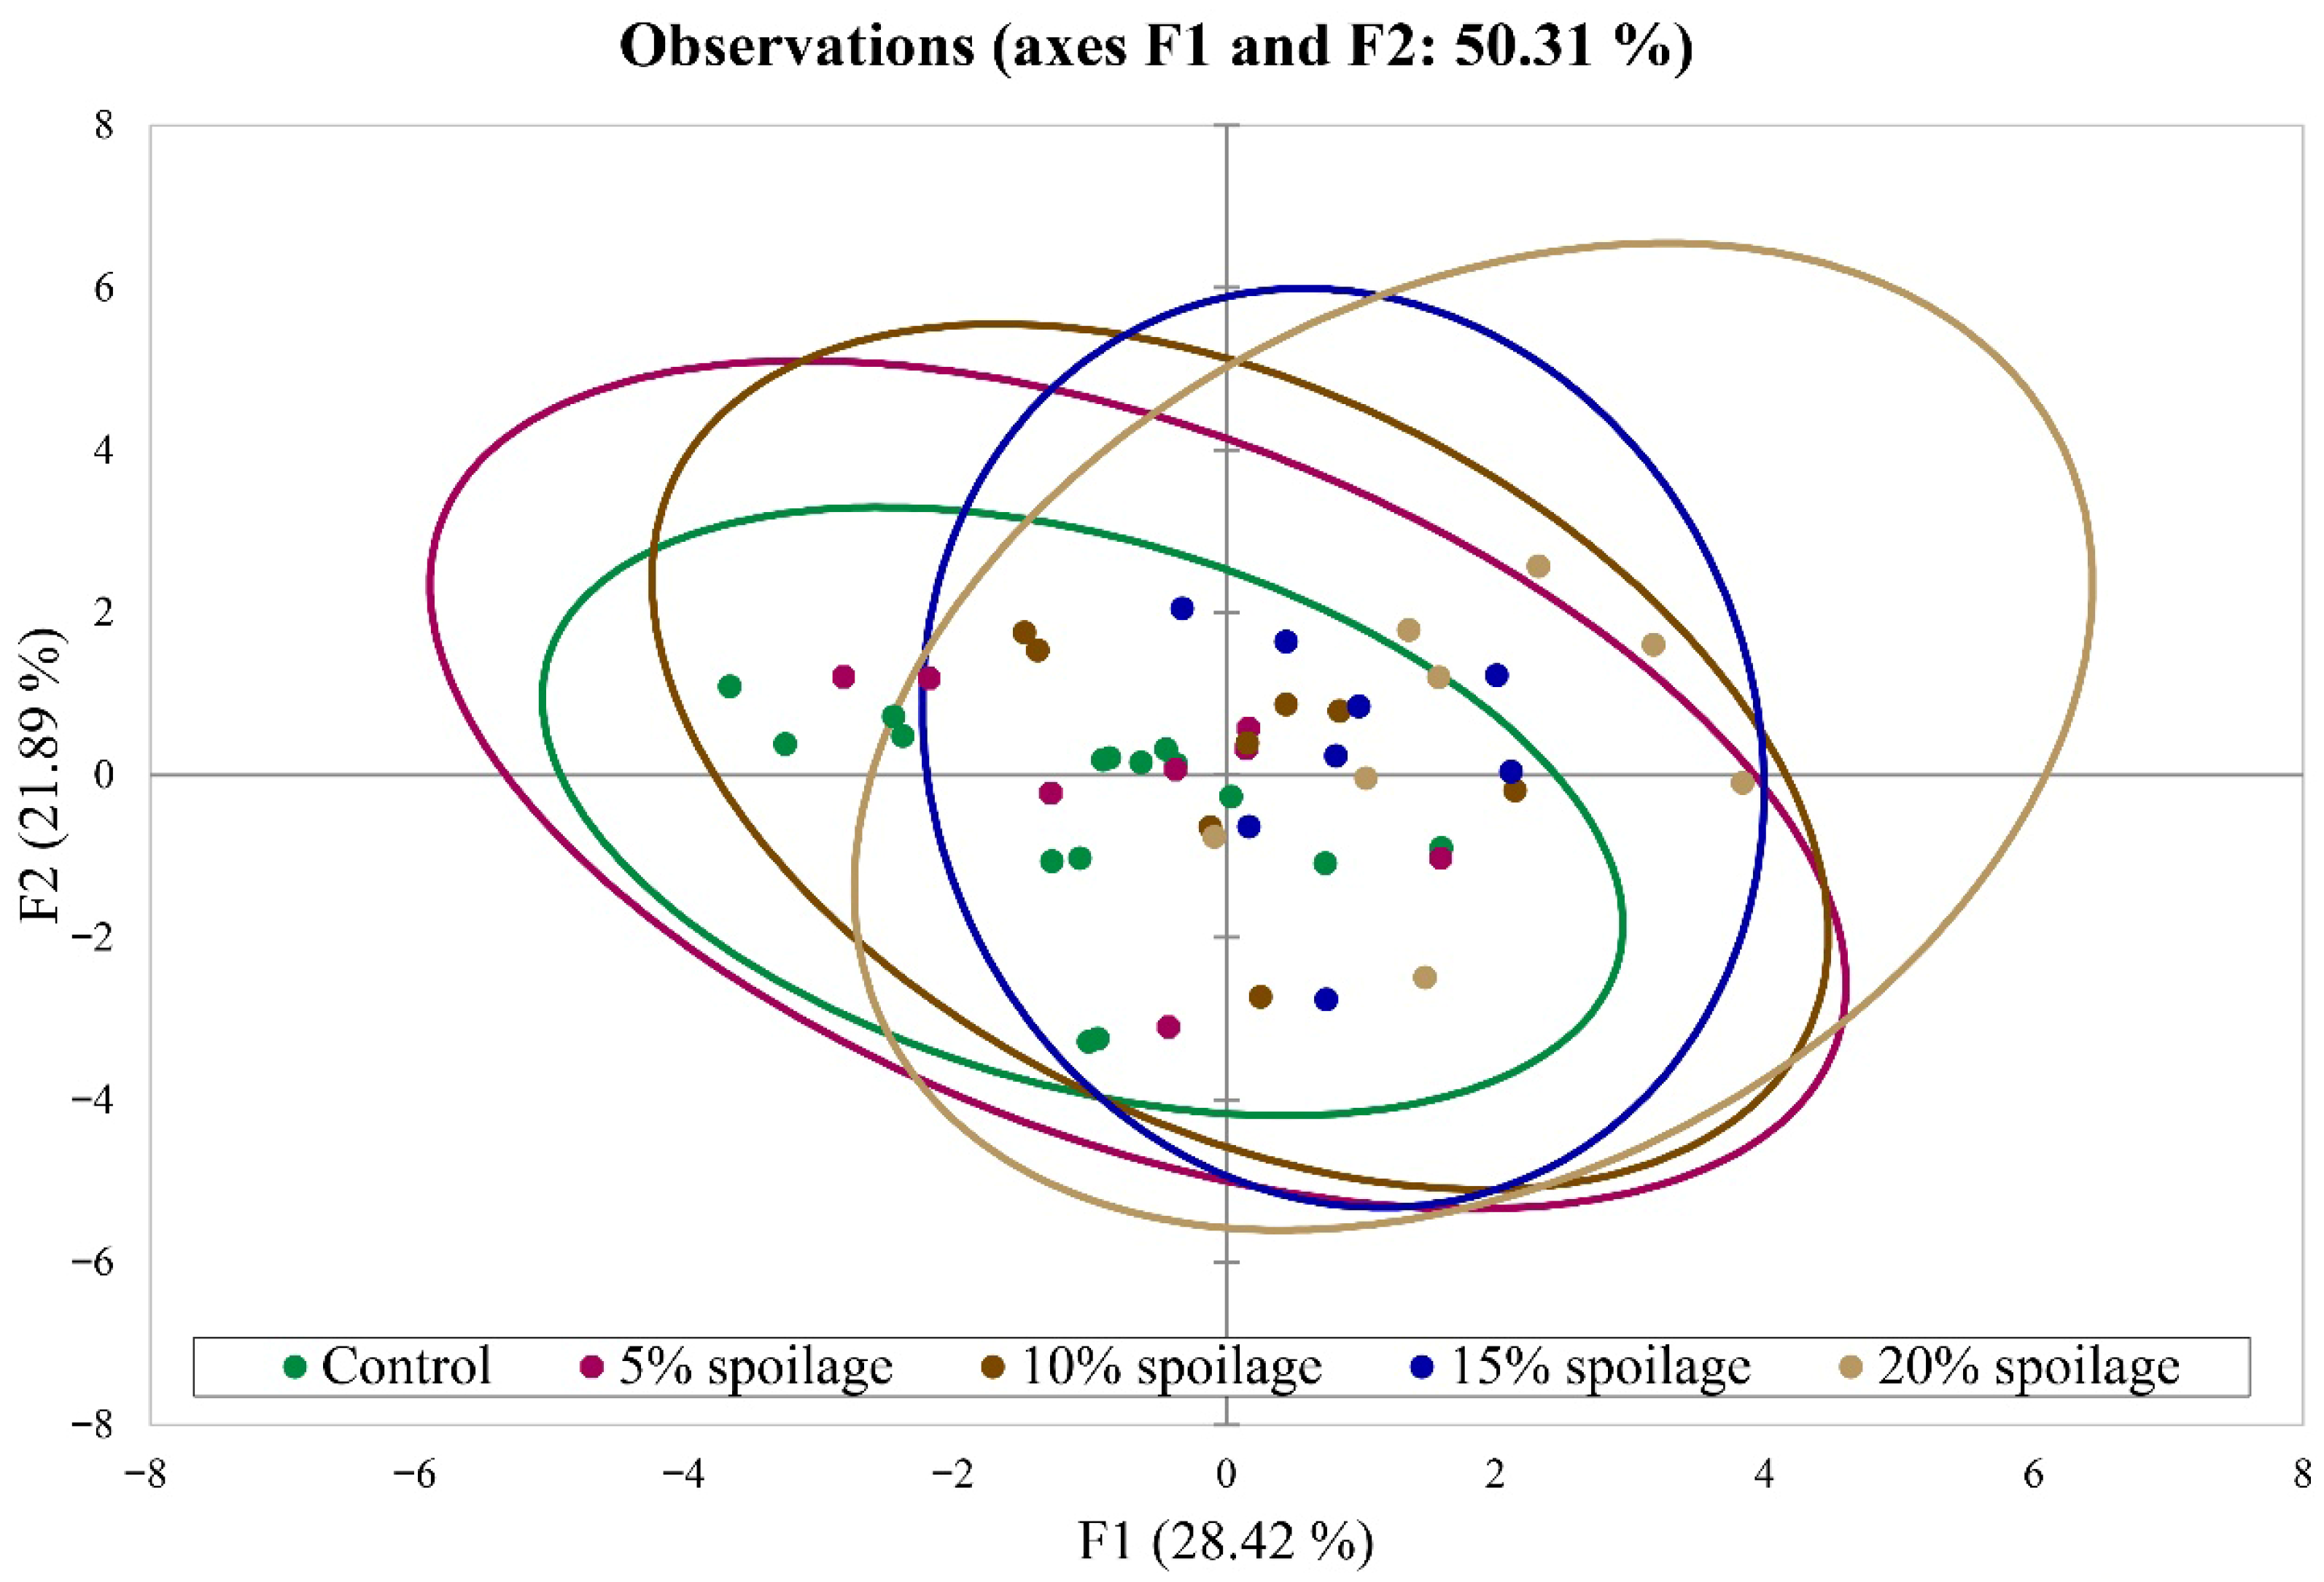
It also needs to be considered that, as far as microbial activity on grapes is concerned, there can never be a true zero. The FT-MIR instrument will always produce a positive number for gluconic acid and VA, two of the most important factors in the model. This can be explained for three reasons. First, the grapes picked from healthy grape material for the control group will inevitably have several infected grapes which will result in a positive value for gluconic acid or VA. Second, FT-MIR spectroscopy can confuse the spectra of other chemical compounds, such as L-malic acid, with that of gluconic acid or other organic acids. Theoretically, for example, the control groups of the experiment should not show any trace of gluconic acid or acetic acid if tested enzymatically. But some control groups show significant amounts of those compounds which decreases the overall predictive ability of the model. This can be seen in Figure 4 where the green ring representing the control group overlaps with the rest of the rings from the treatment groups. However, overall, a trend is observed where observations move to the upper right-hand side of the chart. This shows that the explanatory variables are useful indicators of microbial spoilage and that the technology is sensitive enough to measure such change. Third, FT-MIR spectroscopy has been observed to be insensitive to concentrations below 0.2 mg/g (equivalent to g/L), which is the lower range of gluconic acid and VA.
The equation of model 4 is:
(0.192416 × [Titratable Acidity]) − (4.298393 × [L-malic acid]) − (3.167886 × [pH]) +
(45.170431 × [Volatile Acidity]) − (0.979311 × [Ethanol]) + (14.319461 × [Gluconic
acid]) − (61.837344 × ([Fructose + Glucose])) − (7.472263 × [Lactic acid]).
To achieve the goal of providing an easy-to-use GHI score on the FOSS WineScan™, the intercept was adjusted by subtracting the value from 100 as follows:
(100) − (0.192416 × [Titratable Acidity]) − (4.298393 × [L-malic acid]) −
(3.167886 × [pH]) + (45.170431 × [Volatile Acidity]) − (0.979311 × [Ethanol]) +
(14.319461 × [Gluconic acid]) − (61.837344 × ([Fructose + Glucose])) −
(7.472263 × [Lactic acid]).
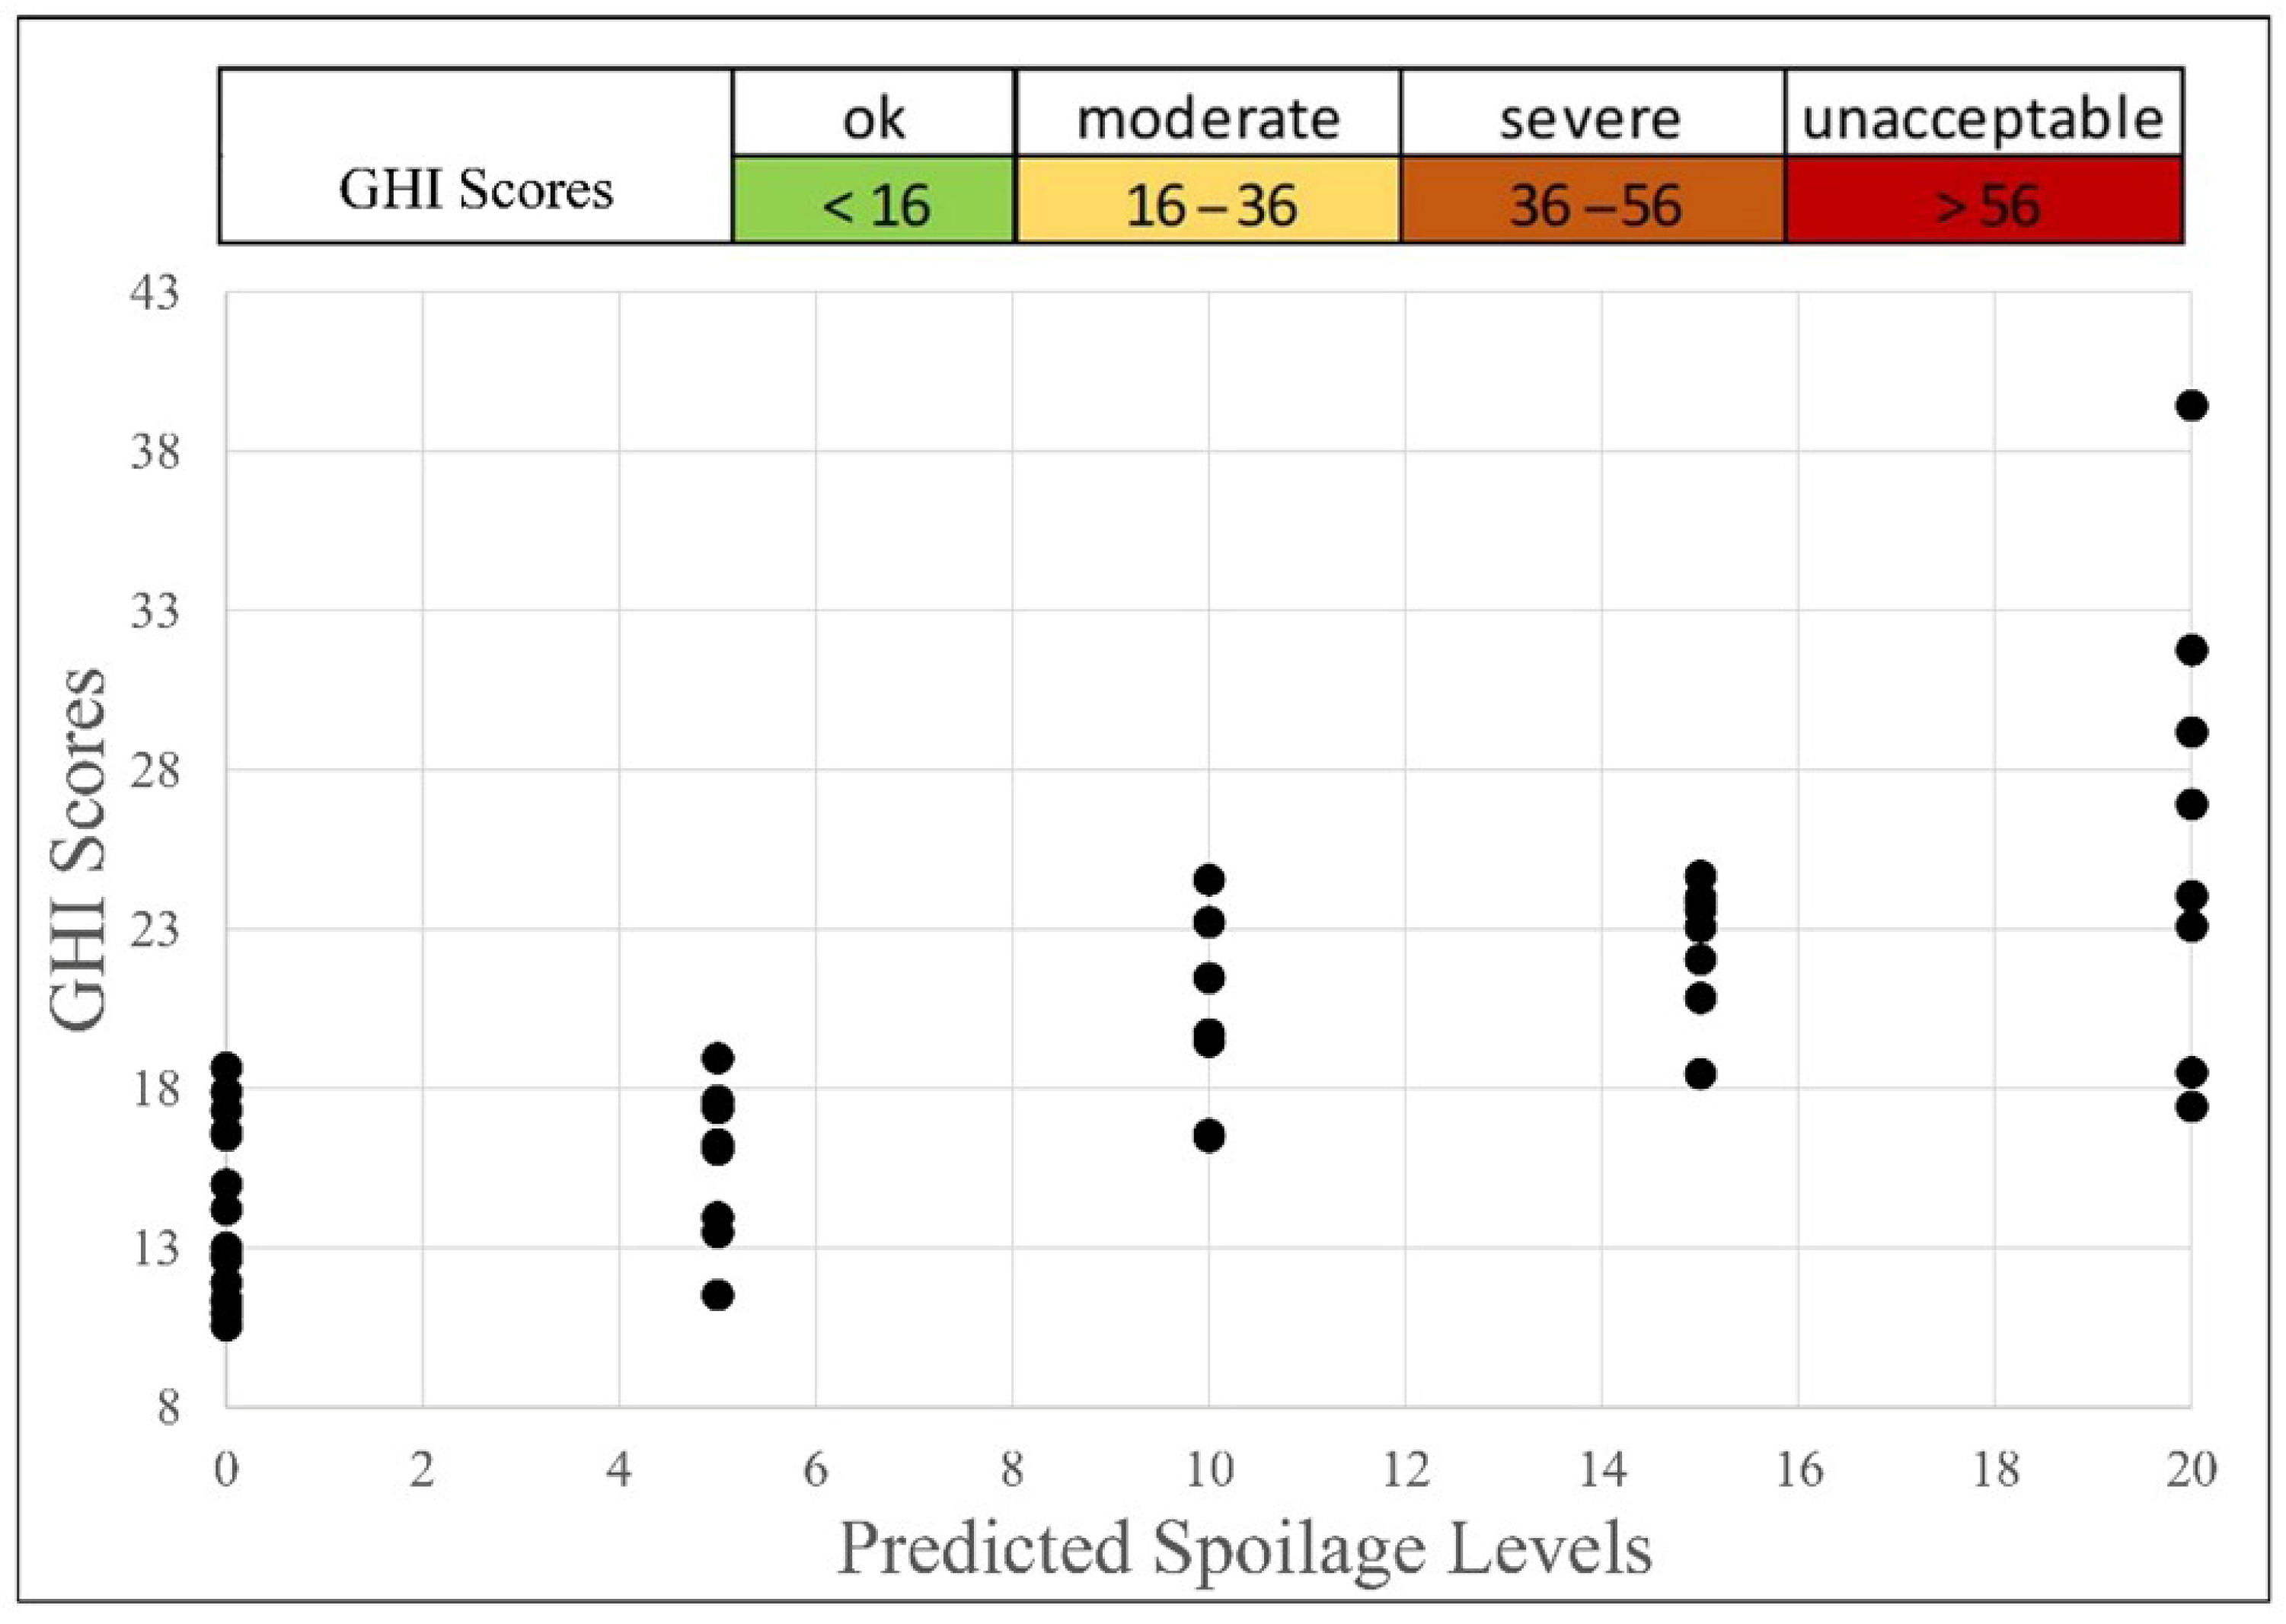
This increases the scores to fall within the range of the thresholds of the proposed GHI scores (Figure 5). The formula can be added as a user input on the WineScan™ interface so that any user can generate GHI Scores as part of the juice analysis.
The purpose of the GHI Score is to change the model output units from percent microbial spoilage to a grape health score, making the output easier to understand for users (Figure 5). The main problem with presenting results as a percentage is that the model will always register a value above zero due to technological factors, like the overlapping spectra of L-malic acid and other organic acids, or because certain explanatory variables, like titratable acidity, will exist in the sample regardless of the grape health status. Values above zero, in percentage terms, imply that the grapes are compromised which generates a false positive result for microbial infection. Converting percentages to GHI Scores allows values above zero to be considered healthy up to a certain threshold. Figure 4 shows the distribution of GHI Scores at each microbial spoilage level. According to the GHI Scores from the samples used to build the model, 14 scores did not show signs of spoilage, 33 scores showed moderate spoilage, and one sample was severely spoiled.

4. Conclusions

The Grape Health Index enables users of a common spectroscopy instrument that is present in many larger wineries (FOSS WineScan™) at a test stand to quickly determine whether a grape sample is infected with and, if so, indicate the level of spoilage. The sample processing time is under one minute, which allows winemakers to make quick decisions. Since the GHI Score was developed based on pre-validated attributes of a FOSS WineScan™ system, it can only be used on that platform. However, it can be used on all generations of instruments without modification because it is interpretating output parameters instead of spectral data. The predicting factors which explained most of the variability in microbial spoilage included VA and gluconic acid which means higher levels of those compounds in grape samples will drive GHI Scores higher. While FT-MIR technology has limitations when it comes to the low-level detection of compounds, it is still the method of choice for fast and inexpensive quality control in food and beverage systems. Regarding performance on the best performing model, an RMSE value of 4.596 indicates directional accuracy for determining microbial spoilage levels based on the samples used to build the model. Further work should focus on the validation of the model with new samples. If the RMSE of the new samples are close to the model RMSE, it can be determined that the model will perform as expected in the future. Other work could be carried out to qualitatively validate the model by making visual evaluations of grapes in vineyards and comparing those to their GHI scores. However, this qualitative approach observes only the surface of the grapes and comes at the expense of understanding what chemical and microbiological changes were made below the surface.

Author Contributions

Conceptualization, S.S. and S.V.Z.; methodology, S.S.; validation, S.S. and S.C.E.; formal analysis, S.C.E.; data curation, S.C.E.; writing—original draft preparation, S.S.; writing—review and editing, S.S.; visualization, S.S. and S.C.E.; supervision, S.V.Z.; project administration, S.V.Z.; funding acquisition, S.V.Z. All authors have read and agreed to the published version of the manuscript.

Funding

Funding for this project was provided by the Agriculture Research Institute (project number 20-02-120) and the California Winegrape Inspection Advisory Board (project numbers VAN-21 and VAN-22). In-kind support through grape donations was graciously provided by Gallo (formerly E. & J. Gallo Winery, Modesto, CA, USA).

Institutional Review Board Statement

Not applicable.

Informed Consent Statement

Not applicable.

Data Availability Statement

The raw data supporting the conclusions of this article will be made available by the authors on request.

Acknowledgments

We would like to thank Qun Sun and Emily Wilkins from Fresno State for their support during the project and finishing the thesis. A big thank you also to all the students who worked in the labs, namely Marnelle Salie, Jenna Koetsier, Salvador Pineda, Jeremiah Loyd, and Garrett Morales.

Conflicts of Interest

The authors declare no conflicts of interest.

References

  1. Hall, M.E.; Loeb, G.M.; Cadle-Davidson, L.; Evans, K.J.; Wilcox, W.F. Grape sour rot: A four-way interaction involving the host, yeast, acetic acid bacteria, and insects. Phytopathology 2018, 108, 1429–1442. [Google Scholar] [CrossRef]
  2. Lorenzini, M.; Azzolini, M.; Tosi, E.; Zapparoli, G. Postharvest grape infection of Botrytis cinerea and its interactions with other moulds under withering conditions to produce noble-rotten grapes. J. Appl. Microbiol. 2013, 114, 762–770. [Google Scholar] [CrossRef]
  3. Barata, A.; Pais, A.; Malfeito-Ferreira, M.; Loureiro, V. Influence of sour rotten grapes on the chemical composition and quality of grape must and wine. Eur. Food Res. Technol. 2011, 233, 183–194. [Google Scholar] [CrossRef]
  4. Mccloskey, L.P. Gluconic acid in California wines. Am. J. Enol. Vitic. 1974, 25, 198–201. [Google Scholar] [CrossRef]
  5. Ebbenga, D.N.; Burkness, E.C.; Clark, M.D.; Hutchison, W. Risk of spotted-wing Drosophila injury and associated increases in acetic acid in Minnesota winegrapes. Am. J. Enol. Vitic. 2021, 72, 106–112. [Google Scholar] [CrossRef]
  6. Kassemeyer, H.; Gaduroy, D.; Hill, G.; Wilcox, W. Part I. Diseases caused by biotic factors: Diseases caused by fungi and oomicetes. In Compendium of Grape Diseases, Disorders, and Pests; APS Press: St. Paul, MN, USA, 2015; pp. 17–146. [Google Scholar]
  7. Kupina, S. Simultaneous quantitation of glycerol, acetic acid and ethanol in grape juice by high performance liquid chromatography. Am. J. Enol. Vitic. 1984, 35, 59–62. [Google Scholar] [CrossRef]
  8. Marchetti, R.; Guerzoni, M.; Gentile, M. Studies on the etiology of a new disease of grape bunches: Sour rot. Vitis 1984, 23, 55–65. [Google Scholar]
  9. Zoecklein, B.; Williams, J.; Duncan, S. Effect of sour rot on the composition of white riesling (Vitis vinifera L.) grapes. Small Fruits Rev. 2000, 1, 63–77. [Google Scholar] [CrossRef]
  10. Hendrickson, D.A.; Lerno, L.A.; Hjelmeland, A.K.; Ebeler, S.E.; Heymann, H.; Hopfer, H.; Block, K.L.; Brenneman, C.A.; Oberholster, A. Impact of mechanical harvesting and optical berry sorting on grape and wine composition. Am. J. Enol. Vitic. 2016, 67, 385–397. [Google Scholar] [CrossRef]
  11. Singh, P.; Pandey, P.C.; Petropoulos, G.P.; Pavlides, A.; Srivastava, P.K.; Koutsias, N.; Deng, K.A.K.; Bao, Y. Hyperspectral remote sensing in precision agriculture: Present status, challenges, and future trends. In Hyperspectral Remote Sensing; Elsevier: Amsterdam, The Netherlands, 2020; pp. 121–146. [Google Scholar]
  12. Marois, J.; Kenyon, L.; Lamison, C.; Smith, J. A rapid immunoassay method for quantifying mold in harvested wine grapes. Am. J. Enol. Vitic. 1994, 45, 300–304. [Google Scholar] [CrossRef]
  13. Dewey, F.; Ebeler, S.; Adams, D.; Noble, A.; Meyer, U. Quantification of Botrytis in grape juice determined by a monoclonal antibody-based immunoassay. Am. J. Enol. Vitic. 2000, 51, 276–282. [Google Scholar] [CrossRef]
  14. Tomlinson, J.; Dickinson, M.; Boonham, N. Detection of Botrytis cinerea by loop-mediated isothermal amplification. Lett. Appl. Microbiol. 2010, 51, 650–657. [Google Scholar] [CrossRef] [PubMed]
  15. Palumbo, J.; O’Keeffe, T.; Fidelibus, M. Characterization of Aspergillus section Nigri species populations in vineyard soil using droplet digital PCR. Lett. Appl. Microbiol. 2016, 63, 458–465. [Google Scholar] [CrossRef]
  16. Alzohairy, S.; Gillett, J.; Saito, S.; Naegele, R.; Xiao, C.-L.; Miles, T. Fungicide resistance profiles of Botrytis cinerea isolates from Michigan vineyards and development of a TaqMan assay for detection of fenhexamid resistance. Plant Dis. 2021, 105, 285–294. [Google Scholar] [CrossRef]
  17. Porep, J.U.; Walter, R.; Kortekamp, A.; Carle, R. Ergosterol as an objective indicator for grape rot and fungal biomass in grapes. Food Control 2014, 37, 77–84. [Google Scholar] [CrossRef]
  18. Ramachandran, S.; Fontanille, P.; Pandey, A.; Larroche, C. Gluconic acid: Properties, applications and microbial production. Food Technol. Biotechnol. 2006, 44, 185–195. [Google Scholar]
  19. Versari, A.; Parpinello, G.P.; Mattioli, A.U.; Galassi, S. Determination of grape quality at harvest using Fourier-transform mid-infrared spectroscopy and multivariate analysis. Am. J. Enol. Vitic. 2008, 59, 317–322. [Google Scholar] [CrossRef]
  20. Ravji, R.; Rodriguez, S.; Thornton, R. Glycerol production by four common grape molds. Am. J. Enol. Vitic. 1988, 39, 77–82. [Google Scholar] [CrossRef]
  21. Dini, I.; Di Lorenzo, R.; Senatore, A.; Coppola, D.; Laneri, S. Comparison between Mid-Infrared (ATR-FTIR) spectroscopy and official analysis methods for determination of the concentrations of alcohol, SO2, and total acids in wine. Separations 2021, 8, 191. [Google Scholar] [CrossRef]
  22. Moreira, J.L.s.; Santos, L. Spectroscopic interferences in Fourier transform infrared wine analysis. Anal. Chim. Acta 2004, 513, 263–268. [Google Scholar] [CrossRef]
  23. Schindler, R.; Watkins, M.; Vonach, R.; Lendl, B.; Kellner, R.; Sara, R. Automated multivariate calibration in sequential injection-Fourier transform infrared spectroscopy for sugar analysis. Anal. Chem. 1998, 70, 226–231. [Google Scholar] [CrossRef]
  24. Kupina, S.A.; Shrikhande, A.J. Evaluation of a Fourier transform infrared instrument for rapid quality-control wine analyses. Am. J. Enol. Vitic. 2003, 54, 131–134. [Google Scholar] [CrossRef]
  25. Nieuwoudt, H.H.; Prior, B.A.; Pretorius, I.S.; Manley, M.; Bauer, F.F. Principal component analysis applied to Fourier transform infrared spectroscopy for the design of calibration sets for glycerol prediction models in wine and for the detection and classification of outlier samples. J. Agric. Food Chem. 2004, 52, 3726–3735. [Google Scholar] [CrossRef]
  26. Versari, A.; Boulton, R.; Parpinello, G.P. Effect of spectral pre-processing methods on the evaluation of the color components of red wines using Fourier-transform infrared spectrometry. Ital. J. Food Sci./Riv. Ital. Di Sci. Degli Aliment. 2006, 18, 423–431. [Google Scholar]
  27. Soriano, A.; Pérez-Juan, P.; Vicario, A.; González, J.; Pérez-Coello, M. Determination of anthocyanins in red wine using a newly developed method based on Fourier transform infrared spectroscopy. Food Chem. 2007, 104, 1295–1303. [Google Scholar] [CrossRef]
  28. Boulet, J.; Williams, P.; Doco, T. A Fourier transform infrared spectroscopy study of wine polysaccharides. Carbohydr. Polym. 2007, 69, 79–85. [Google Scholar] [CrossRef]
  29. Nengsih, T.A.; Bertrand, F.; Maumy-Bertrand, M.; Meyer, N. Determining the number of components in PLS regression on incomplete data set. Stat. Appl. Genet. Mol. Biol. 2019, 18, 20180059. [Google Scholar] [CrossRef]
  30. Bartowsky, E.J. Bacterial spoilage of wine and approaches to minimize it. Lett. Appl. Microbiol. 2009, 48, 149–156. [Google Scholar] [CrossRef] [PubMed]
  31. Hausinger, K.; Lipps, M.; Raddatz, H.; Rosch, A.; Scholten, G.; Schrenk, D. Automated optical grape-sorting of rotten grapes: Effects of rot infections on gluconic acid concentrations and glycerol/gluconic acid ratios in must and wine. J. Wine Res. 2015, 26, 18–28. [Google Scholar] [CrossRef]
  32. Mendes Ferreira, A.; Mendes-Faia, A. The role of yeasts and lactic acid bacteria on the metabolism of organic acids during winemaking. Foods 2020, 9, 1231. [Google Scholar] [CrossRef]
  33. Tronchoni, J.; Gamero, A.; Arroyo-López, F.N.; Barrio, E.; Querol, A. Differences in the glucose and fructose consumption profiles in diverse Saccharomyces wine species and their hybrids during grape juice fermentation. Int. J. Food Microbiol. 2009, 134, 237–243. [Google Scholar] [CrossRef]
  34. Drysdale, G.; Fleet, G. Acetic acid bacteria in winemaking: A review. Am. J. Enol. Vitic. 1988, 39, 143–154. [Google Scholar] [CrossRef]
  35. Bell, S.J.; Henschke, P.A. Implications of nitrogen nutrition for grapes, fermentation and wine. Aust. J. Grape Wine Res. 2005, 11, 242–295. [Google Scholar] [CrossRef]
  36. Nitta, K.; Laviña, W.A.; Pontrelli, S.; Liao, J.C.; Putri, S.P.; Fukusaki, E. Orthogonal partial least squares/projections to latent structures regression-based metabolomics approach for identification of gene targets for improvement of 1-butanol production in Escherichia coli. J. Biosci. Bioeng. 2017, 124, 498–505. [Google Scholar] [CrossRef] [PubMed]
  37. Chang, C.-W.; Laird, D.A.; Mausbach, M.J.; Hurburgh, C.R. Near-infrared reflectance spectroscopy–principal components regression analyses of soil properties. Soil Sci. Soc. Am. J. 2001, 65, 480–490. [Google Scholar] [CrossRef]
Figure 1. Standardized coefficients of the response variable Microbial Spoilage Level (95% confidence interval).
Beverages 11 00156 g001
Figure 2. Principal Component Analysis (PCA) chart of microbial spoilage level and 8 explanatory variables. Vector position indicates positive or negative correlations. The first two principal components (F1 and F2) explain 50.31% of the variability in the dataset.
Beverages 11 00156 g002
Figure 3. Root Mean Squared Error of each prediction model and the correlation coefficient plotted against each model number.
Beverages 11 00156 g003
Figure 4. Principal Component Analysis (PCA) plot of model 4 observations and overlapping microbial spoilage level rings. Ellipses represent the 95% confidence interval of their respective dataset. The first two principal components (F1 and F2) explain 50.31% of the variability in the dataset.
Beverages 11 00156 g004
Figure 5. Grape Health Index (GHI) scores plotted against predicted spoilage levels (n = 48). The added color-coded category chart represents the proposed interpretation of the GHI scores.
Beverages 11 00156 g005
Table 1. Explanatory Variable Ranking in descending order of importance as described in the literature. The interaction effect with microorganisms refers to the level in grapes.
Explanatory VariableMicrobially InfluencedMechanismReference
Volatile acidityyesMetabolite[30]
Gluconic acidyesMetabolite[31]
EthanolyesMetabolite[1]
Lactic acidyesMetabolite[32]
Fructose/Glucose ratioyesGlucose preference[33]
Malic acidyesSubstrate[32]
Titratable acidityyesBacterial metabolism[9]
pHyesBacterial metabolism[9]
GlucoseyesSubstrate[34]
FructoseyesSubstrate[34]
BrixyesSubstrate[34]
Tartaric acidno [32]
Yeast assimilable nitrogenyesSubstrate[35]
α-amino nitrogenyesSubstrate[35]
AmmoniayesSubstrate[35]
Table 2. Statistics for grape microbial spoilage predicted by FT-MIR spectroscopy (n = 48).
ModelR2SDRMSEExplanatory Variables
10.5125.7015.436VA, GA, EtOH, LA, F/G
20.6264.9914.759VA, GA, EtOH, LA, F/G, L-MA
30.6214.7924.588VA, GA, EtOH, LA, F/G, L-MA, TA
40.6204.8004.596VA, GA, EtOH, LA, F/G, L-MA, TA, pH
50.6074.8824.674VA, GA, EtOH, LA, F/G, L-MA, TA, pH, Gl
60.6004.9264.717VA, GA, EtOH, LA, F/G, L-MA, TA, pH, Gl, Fr
70.5905.2264.983VA, GA, EtOH, LA, F/G, L-MA, TA, pH, Gl, Fr, Brix
80.5895.2354.992VA, GA, EtOH, LA, F/G, L-MA, TA, pH, Gl, Fr, Brix, TTA
90.5924.9714.760VA, GA, EtOH, LA, F/G, L-MA, TA, pH, Gl, Fr, Brix, TTA, YAN
100.5944.9624.750VA, GA, EtOH, LA, F/G, L-MA, TA, pH, Gl, Fr, Brix, TTA, YAN, AA
110.5904.9874.774VA, GA, EtOH, LA, F/G, L-MA, TA, pH, Gl, Fr, Brix, TTA, YAN, AA, Am
VA: volatile acidity; GA: gluconic acid; EtOH: ethanol; LA: lactic acid, F/G: fructose/glucose ratio; L-MA: L-malic acid; TA: titratable acidity; Gl: glucose; Fr: fructose; TTA: tartaric acid; YAN: yeast assimilable nitrogen; AA: α-amino nitrogen; Am: ammonia; SD: standard deviation; RMSE: Root Mean Squared Error.
Disclaimer/Publisher’s Note: The statements, opinions and data contained in all publications are solely those of the individual author(s) and contributor(s) and not of MDPI and/or the editor(s). MDPI and/or the editor(s) disclaim responsibility for any injury to people or property resulting from any ideas, methods, instructions or products referred to in the content.