Article

Long-Term Hydrological Regime Monitoring of a Mediterranean Agro-Ecological Wetland Using Landsat Imagery: Correlation with the Water Renewal Rate of a Shallow Lake

1
Campus Paterna, Cavanilles Institute of Biodiversity & Evolutionary Biology (ICBiBE), University of Valencia, 46980 Paterna, Spain
2
Department of Microbiology and Ecology, Campus Burjassot, University of Valencia, 46100 Burjassot, Spain
*
Author to whom correspondence should be addressed.
Hydrology 2021, 8(4), 172; https://doi.org/10.3390/hydrology8040172
Submission received: 20 October 2021 / Revised: 10 November 2021 / Accepted: 16 November 2021 / Published: 20 November 2021
(This article belongs to the Special Issue The Application of Remote Sensing in Hydrology)

Abstract

:
The Natural Park of Albufera (Valencia, Spain) is one of the Spanish Mediterranean wetlands where rice is cultivated intensively. The hydrology of the Albufera Lake, located in the center, combines natural contributions with complex human management. The aim of our study was to develop a new methodology to accurately detect the volume of flood water in complex natural environments which experience significant seasonal changes due to climate and agriculture. The study included 132 Landsat images, covering a 15-year period. The algorithm was adjusted using the NDWI index and simultaneous measurements of water levels in the rice fields. The NDVI index was applied to monitor the cultivated area during the summer. Lake inflows and residence times were also evaluated to quantify how the hydrodynamic of the lake is conditioned by the agricultural management. The algorithm developed is confirmed as a useful ecological tool to monitor the flood cycle of the wetland, being able to detect even the lowest water levels. The flood dynamics are consistent over the fifteen years, being in line with the rice cultivation cycle. Water renewal in Albufera lake is altered with respect to that expected according to the rainfall recorded in the study area, so an improvement in the water management of the hydrological basin is required to optimize the runoff during the rainiest months.

1. Introduction

Wetlands are ecologically and economically important aquatic ecosystems where the terrestrial and marine waters intermix [1,2]. They provide to humanity indispensable ecosystem services such as fresh water reserve, nutrient cycling and retention, sediment entrapment, erosion reduction, flood control, groundwater recharge and discharge, and permanent sequestration of carbon, being vital in the global carbon balance. [3,4,5,6]. In addition, the wet to dry transition along their different aquatic environments support a very diverse biological community [7,8]. However, despite their importance, in the last decades has been observed an important degradation of coastal wetlands around the world due to the overexploitation of their resources and the anthropogenic land use/cover conversion of wetland areas for agricultural, industrial and urban purposes [9,10,11,12]. Under this scenario, the Mediterranean basin, recognized as an important biodiversity hotspot, is highly vulnerable [13]. During the last years humans have caused significant and wide-ranging environmental impacts in the basin, being responsible for the increase in land cover change and land-use intensity in coastal wetlands, focused mainly on agricultural activity [14]. In addition, the climate change could act as a critical factor due to the increase in mean temperature and the decrease and fluctuation in seasonal precipitation observed in the area, which could accelerate the degradation and consequent loss of these aquatic ecosystems in the coming years [13,15,16].
Hydrological regimes are one of the main factors that define the structure and functions of a wetland, playing a vital role in controlling its physical, chemical and biological characteristics [17,18]. In recent decades it has been observed that the spatio-temporal variations in floodplains have been driven by agricultural requirements instead of natural seasonal flood cycles, affecting ecosystem functioning [19,20,21]. According to Chen et al. [22], the dynamics of the flood surface, its frequency, duration, and depth determine the distribution and vigour of the wetland vegetation. In addition, many studies have confirmed the influence of water-level fluctuations on biomass and biodiversity of vegetation communities [23,24,25].
Long-term routine monitoring of flood plains dynamics may be challenging due to the limited monitoring points, the complexity of the different types of wetland cover and the significant seasonal changes of its hydrological conditions [26]. Remotely sensed data has been an important advance in providing a continuous spatial representation of the Earth’s surface, providing the information needed to assess changes in wetland covers [27]. Satellite images from higher spatial resolution sensors have also been applied to study the extent and dynamics of inundation at various scales with satisfactory results [28]. Among these satellites, Sentinel-2 from Copernicus mission of The European Space Agency (ESA), operational since June 2015, combines high spatial (10–60 m) with a high temporal resolution (5 days) and for this reason it is being widely used in recent years to assess current hydrological and ecological conditions of lakes and wetland systems [29,30]. However, Sentinel-2 imagery does not provide data for long-term monitoring studies (longer than seven years). In this regard, Landsat MSS/TM/ETM+/OLI data represent the longest-running terrestrial satellite records [31]. These multispectral sensors provide high-resolution images (30 m) since 1982, with a temporal resolution of 16 days [32]. As a result, Landsat imagery has been used in recent years to monitor flood cycles over considerable time periods (30–40 years), through the development of automatic classification algorithms and the generation of flood surface maps [21,31,33,34,35,36,37].
The analysis of the volume of water in wetlands during the monitoring of their hydroperiods is another difficult factor to address. In the case of regularly shaped wetlands, simplified volume-area-depth methods have been successfully applied to investigate water storage [38,39]. Land characterisation and digitisation of the perimeter of the water bodies was carried out using aerial imagery, but required a detailed topographic survey to generate a three-dimensional DEM to determine the volume of water in the wetland [39]. In the last decade aerial photographs have been replaced by satellite imagery due to the limited archive available for a study area. Several studies have been reported in recent years, in which different methodologies have been used for the volumetric study of water storage in wetlands. One of the reported procedures has been the combination of SAR imagery, which provides continuous surface data without cloud interference [40], with elevation data provided by altimetric radars such us ENVISAT RA-2 GDR, PALSAR-2, Jason-3 and Sentinel-3, among others [34,41,42,43]. These studies were able to estimate variations in the volumetric storage of wetlands of different hydrological characteristics. However, they could not be applied to long-term time trend studies, and required a high information load (topographic data, field measurements, high resolution images, etc.).
Another hydrological factor that is highly sensitive to changes in wetland water management is the residence time (or renewal time) of the wetland’s aquatic systems, mainly lagoons. The residence time (RT) is defined as the time it takes to completely replace the total volume of water in a domain of interest [44]. This water residence time quantifies how the lake hydrodynamic is conditioned by its tributaries and effluents, its morphology and climate [45], and can be an important indicator of water quality as it can be related to the rate of nutrient loading and living biomass [46]. In this regard, shallow lakes can react more quickly to the changes in water column stability than deeper lakes, with alterations in variables such as temperature, salinity, dissolved nutrient concentration, and phytoplankton and zooplankton dynamics [47,48,49].
The water renewal time (or water renewal rate) is the inverse of the residence time. In the case of coastal lakes, its estimation was previously based on two commonly used methods: the measurement of the ratio between the total volume of the lake and the exchanges between the lake and the ocean [50]; and the difference in salinity between the lake and the ocean [51], although the latter was used less frequently. At present, its theoretical value is calculated as the ratio between the volume of the lake and the long-term time average discharge of water passing through it [52]. Isotope data can be used to evaluate in a refined way the real value of water renewal time in different aquatic environments, although it is not a recommended technique due to its high cost and complex logistics [53,54,55]. Numerical models have been developed and applied to study the exchange of water from lagoons with the open sea or other hydrological systems, such as dense irrigation networks in humid regions [56]. As an example, numerous works have applied 3-D hydrodynamic models (e.g., [57,58]), which make it possible to characterize the age and residence time of selected water parcels within a lake, following their destination from entry to exit through a Lagrangian approach [52]. However, a multiannual 3D simulation requires a huge amount of data, which is rarely totally available. Alternatively, RT can be determined by simplified water balances, whenever it is possible to measure lake inflows or outflows.
The Natural Park of Albufera is an important coastal wetland located in the east of Spain, which combines its ecological functions with an important agricultural activity, especially linked to the rice cultivation. Therefore, multiple considerations have to be integrated for a sustainable management of this coastal wetland. This requires, among other issues, an understanding of the hydrological processes taking place in this system and the important influence of agricultural activities on them. The flooding dynamics of this wetland have scarcely been studied. Alonso et al. [59] studied the winter flooding of this Mediterranean wetland between 2000 and 2003 using medium resolution spatial sensors. The most recent study, carried out by Cavallo et al. [60], involved the development and validation of a method to assess winter flooding of the wetland using Landsat-8 and Sentinel-2 imagery to avoid cloud cover limitations. Their new approach allowed the automatic classification of the wetland cover, creating unique winter flooding duration maps for the last eight years. On the other hand, water residence times of its shallow lake (Albufera Lake) have also been scarcely studied. Soria et al. [61] analysed the influence of running waters over the limnological characteristics of the lagoon. Romo et al. [62] evaluated the relationship between residence times and dynamics of cyanobacteria populations. More recently, Sòria-Perpinyà et al. [63] studied the processes of rapid flushing and clear-water phases (CWPs) in the lake using remote sensing. Finally, Soria et al. [64] have carried out the most comprehensive study to date about the residence times of the Albufera Lake, covering the period between 1988 and 2018, and evaluating different procedures. However, to our knowledge, no long-term monitoring studies of the flooding hydroperiods have been carried out in the Natural Park of Albufera. Moreover, the more recent studies have excluded the rice cultivation cycle from this kind of analysis of this wetland as well as its effects on lake’s water renewal processes.
The main aim of our study was to develop a new accessible and user-friendly tool for monitoring wetland inundation dynamics in terms of surface and water volume using Landsat satellite imagery, and apply it successfully to an agro-ecological coastal wetland, the Natural Park of Albufera. For this purpose, the following secondary objectives were established: (1) To calibrate and validate a mathematical adjustment developed from Landsat images and simultaneous field measurements, which allows detecting flooded areas and approximating the volume of water in rice fields. (2) To apply the proposed algorithm to a long time series of Landsat images of the Natural Park of Albufera covering the period 2006–2020, assessing both seasonal and annual variations in flooding dynamics; (3) To determine the residence time values of the Albufera Lake during 2006–2017 using inflows measurement data; and (4) To analyse the influence of rice cultivation on the wetland hydrological management in relation to the flood cycles and water renewal of the lake. The results of this study can contribute to the development of new, simpler, and more accessible methodologies for the long-term hydrological monitoring of large complex natural areas, where the measurement of the actual water volume is extremely difficult due to seasonal variations and the dynamic connection between aquatic systems. In addition, it provides valuable information about the hydrology of this coastal wetland during the last fifteen years, and can serve as support to develop more specific and respectful management plans for this Natural Park by considering the water requirements for rice cultivation and the recovery of the ecological status of the lake.

2. Materials and Methods
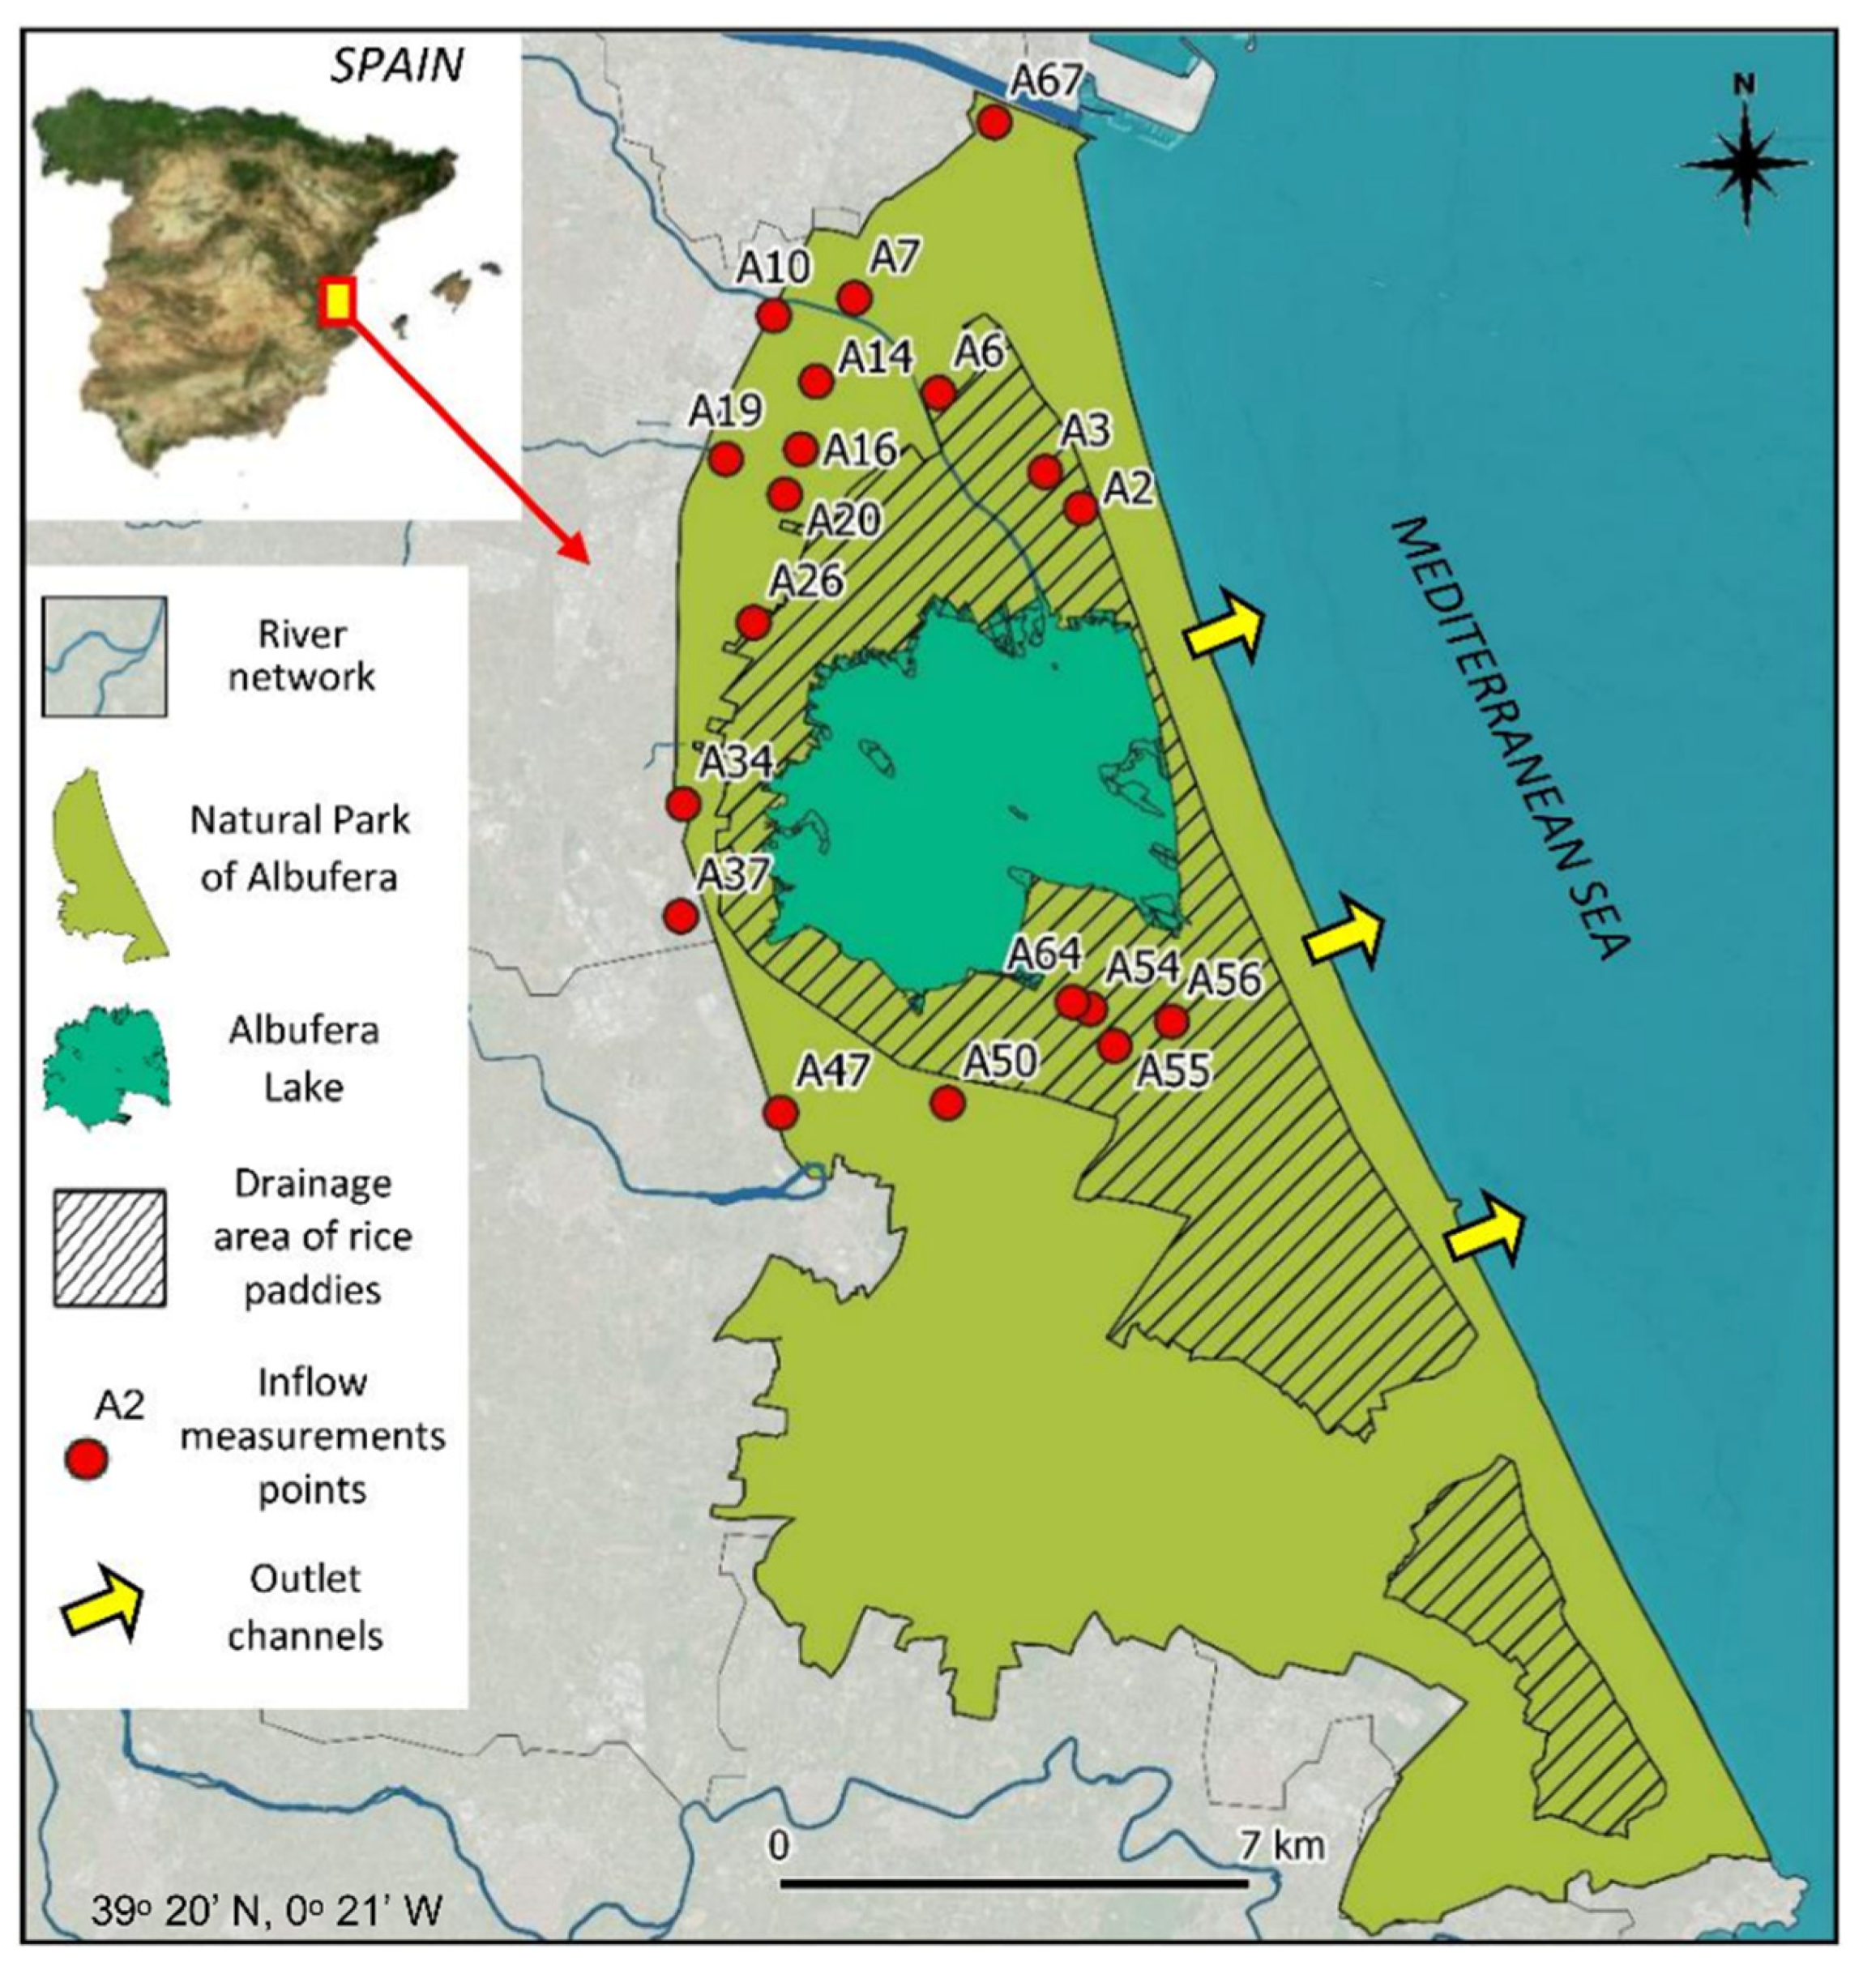
This section first introduces the study case: The Natural Park of Albufera. Then, the methodology followed for the analysis of the satellite images is described, including the data source, the development and validation of the mathematical adjustment and the subsequent estimation of the values of flooded area, cultivated area and volume of water in the rice fields. Subsequently, the procedure followed to obtain the inflows to the lake and the residence times is described. The source of the precipitation data used in the study is also presented. Finally, the different statistical analyses applied are described.

2.1. Study Area

The Natural Park of Albufera (39°20′ N, 0°21′ W) (Figure 1), located in the Mediterranean coast of Valencia (Spain), is an important coastal wetland protected by the Ramsar Convention and the European Habitat List NATURA 2000 [65]. This Natural Park is part of the Júcar river basin (917 km2) and covers a surface area of 210 km2, of which approximately 73% is dedicated to rice cultivation, being a wetland highly linked to agriculture [66]. The remaining 27% is destined to the extensive network of irrigation channels, coniferous forest (Dehesa del Saler), small discontinuous urban areas and mainly to the Albufera Lake. The lake is located in the center of this Natural Park and is recognized as the largest Spanish coastal lake, with an area of 23.1 km2 and a volume of 23 hm3 [66]. It is a shallow (mean depth of 1.0 m) and oligohaline (salinity 1–2%) lagoon with a water renewal rate of about 8.4 times per year [64]. Its hydrology combines natural events associated with the climate (seasonal rainfall) with a complex human management due to the agricultural needs derived from rice cultivation and fishing activities [67]. This shallow lake has been eutrophic since the 1970s due to the wastewater discharges from surrounding urban and industrial centers, and nitrogen-rich effluents from agriculture. This eutrophication rapidly resulted in a turbid state dominated by phytoplankton that lasts until today. More detailed about the ecology and the past main limnological features of the lagoon have been documented by Vicente and Miracle [68] and Romo et al. [69].
The study area supports a dense network of artificial canals to supply the irrigation of rice fields, except for those closest to the lagoon, which directly use the old bottom of the lake to cultivate in closed plots called “Tancats”, similar to polders [64,66]. In addition to the natural contributions from five watercourses, the water that flows through these irrigation channels enters into the lake through 64 inlets, connecting this water body with the paddies [64]. The lake water is regulated by sluices gates situated on its three outlet channels that flow into the Mediterranean Sea [70]. These channels control the water level of the lake in favor of rice cultivation, considering the high tides and the level of the lake in relation to the sea. The rice fields operate as a temporary wetland with a hydrological cycle of minimal summer flooding during the rice growth and emptying in September for harvesting [59]. During this time, the sluice gates maintain a mean water flow and a mean water level [71]. From October to the beginning of January the fields are flooded again (maximum level) to provide shelter for wintering water birds and hunting activities. In February, the water drains back into the lake, which favours higher renewal rates [69]. Finally, in May the rice paddies are flooded again for cultivation.

2.2. Remote Sensing Images: Dataset, Processing and Determination of Flooded Area and Water Volume

Landsat 5 TM and Landsat 8 OLI/TIRS images were downloaded from the European Space Agency & United States Geological Survey Landsat archives (https://earthexplorer.usgs.gov; accessed on 22 November 2020), covering the period between 2006 and 2020. Level-1 Landsat images (from row 33 and path 198 and 199) with less than 40% cloud cover were selected for download. Finally, dataset comprised 216 images, of which only a total of 132 cloud-free images could finally be analyzed (Figure S1; Supplementary Material B). ENVI software version 5.03 (L3Harris Technologies, Broomfield, CO, USA) was used for image processing. In this regard, firstly QUAC tool was used to apply an atmospheric correction. Then, the study was delimited to the area comprised by the Natural Park and surrounding rice fields using the ROI (region of interest) tool, also excluding the Albufera lake from the scene for the following procedures.
In order to determine the volume of water present in the rice fields in each image during the winter flooding, a mathematical adjustment based on the normalized difference water index (NDWI) was obtained. This multispectral index is defined as:
NDWI = ρ g r e e n ρ N I R ρ g r e e n + ρ N I R
where ρgreen and ρNIR are the reflectance of the green band and near-infrared band 1, respectively.
First, Landsat images corresponding to the dates 23 January 2015, 9 February 2015 and 25 February 2015 were downloaded and, once processed as explained above, the NDWI index was obtained using the SPEAR—LOC Water tool. Pixel values lower than −0.3 were not considered since they were related to wet soil areas. Simultaneously, water level measurements were taken in the rice fields at 47 spaced points in order to perform a regression between band reflectance and field data (Table S1, Supplementary Material B). Validation was performed using 12 field water level measurements taken on two different dates that coincided with two Landsat images within a time window of two days (12 January and 28 January 2017). Once validated, the equation obtained through linear regression was applied to the selected Landsat images for the study period, in order to estimate inundation area and water volume in the rice fields during the winter flooding periods (October to February) and the short flooding periods prior to rice growth (April to May) (Figure S2).
In order to monitor the complete flooding cycles, the scenes corresponding to the rice cultivation period were processed differently. The area cultivated during July, August and September was determined using the normalized difference vegetation index (NDVI) (Figure S2), for which the equation is as follows:
NDVI = ρ N I R ρ r e d ρ N I R + ρ r e d
where ρred is the reflectance of the red band.
For this period (July–September) the average water level was calculated from field measurements taken at 19 points during the 2017 rice cultivation. The selected points are close to the locations described in Table S2 (Supplementary Material B). Then, from the values of cultivated area and the average water level, the total volume of water in the rice fields under vegetation during the cultivation season was obtained. During the image analysis with NDWI and NDVI the mixed pixels were treated with the acquired value.

2.3. Flow Measurements and Determination of Water Residence Times of the Lake

Nineteen main canals were selected (Figure 1; Table S2, Supplementary Material B), and during 2010, 2011, 2016 and 2017 the flow into the lake was measured in situ whenever possible, since these data were also required by other studies carried out in this wetland. The frequency of measurements was one flow measurement per month (per canal), except in the drainage months (January–March) when two measurements were taken per month. The measurement points were selected taking into account sections without irregularities in those irrigation ditches that provide major inputs to the lake. The dimensions of the canals vary between 1.7 and 14.5 m wide and the water depth between 0.2 and 1.2 m (Table S2, Supplementary Material B). The measurements were made following one of the methodologies conducted by Soria et al. [64] and detailed by Fisher [72], according to the equation:
Q = S × V    
where S is the section in m2, V the speed in m s−1 and Q the resulting flow in m3 s−1
In short, once accessible locations were selected in straight sections of the canals, a subsurface float was used to time its displacement in the water flow for a specified distance for a total of three repetitions per canal. Then, the speed reached by the object and the dimension of the cross section were used to calculate the flow rate Qm, applying the correction coefficient proposed by Soria et al. [64], following the Fisher´s formula [72]:
Q m = S × v s × K
where S is the cross section of the canal in m2, vs the speed of the subsurface float in m s−1, K the empirical constant calculated for each canal, and Qm the resulting flow in m3 s−1.
In addition, the drainage from the lagoon to the Mediterranean Sea through the three outlet channels was measured for the years 2006, 2007, and 2008, using the methodology describe above.
The residence times of the lagoon were determined for the years 2006, 2007, 2008, 2010, 2011, 2016, and 2017 according to the inputs or outputs calculated and the average volume of the lagoon, estimated at 23 hm3 [66], following the Equation (5). This equation expresses the residence time (RT) of days when working with small periods. The renewal rate of the lagoon (in times per years) has also been calculated by the Equation (6).
R T = V m / Q
  R T = A / V m
where Vm is the average volume of the lagoon, Q is the inflow or outflow measured in m3 s−1 and A is the total inflow or outflow volume during one year in hm3.
During the hydrological balance, losses due to evaporation or the precipitation over the lagoon have not been taken into account, as explained Soria et al. [64]. The annual balance would be negative, as rainfall inputs are lower than evaporation (due to the high temperatures during summer), although it would only decrease the 2% of the total inflows to the lake. Groundwater runoff contributes to surface runoff by emerging through natural springs called “ullals” or discharging into the affluents of the Jucar or Turia rivers [73]. Finally, this runoff is distributed over 13 discharge points into the lake [73], which have been considered during the flow measurements.

2.4. Meteorological Data

Annual rainfall data in the Albufera basin for the study period has been collected together with daily rainfall data, using the rain gauge closest to the lagoon from Tancat de la Pipa station [74], ubicated in the shore of the lake.

2.5. Statistical Analyses

The variables tested were the flooded area and volume of water in the rice fields, as well as residence times of the Albufera lake. Assumptions of normality of the data were checked prior to statistical analyses, and non-parametric test were used when variables were not normally distributed (Shapiro-Wilk test, p < 0.05). Univariate statistical analyses were used to obtain descriptive statistics. Kruskal-Wallis and Mann-Whitney post hoc test were used to examine significant differences between variables and clustering factors. Mann-Kendall test was applied to assess possible time trends. In addition, Spearman´s rank-order correlation coefficient was used to obtain the correlation between study variables. Analyses were performed using PAST (3.22) software [75].

3. Results

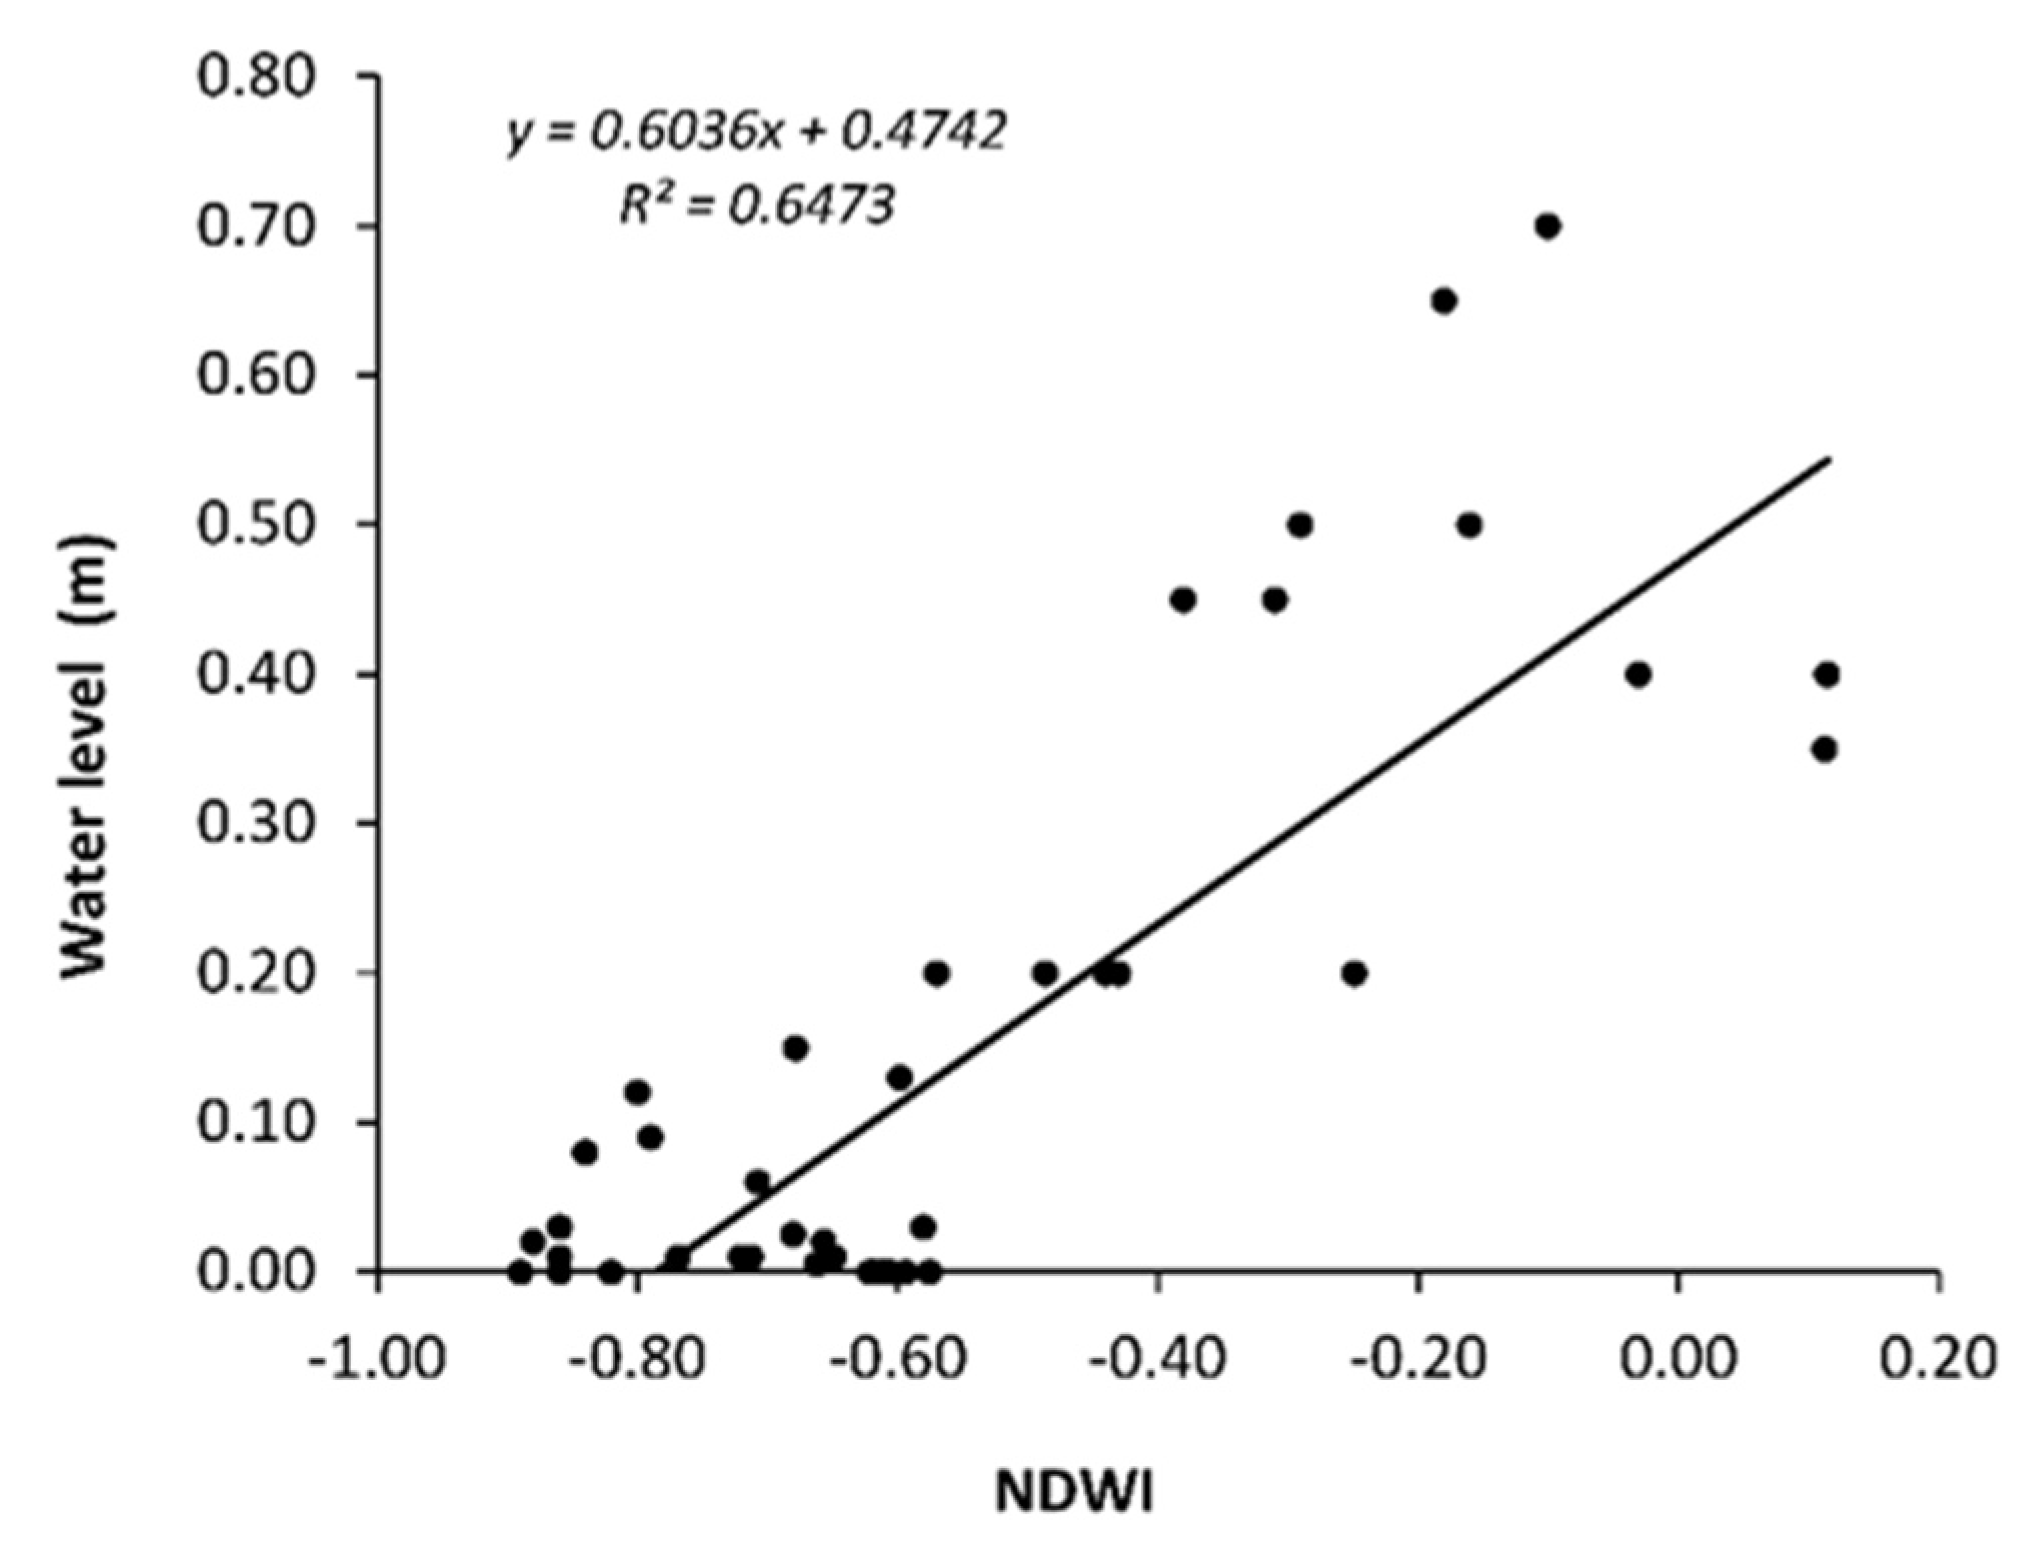
3.1. Mathematical Adjustment: Calibration and Validation

The mathematical adjustment was performed by a linear regression to relate the field data to the pixel values derived from the NDWI index. The equation obtained is shown in Figure 2, and its calibration resulted in a correlation coefficient, R Pearson, of 0.81 from 47 measurements, with a degree of significance less than 0.001.
To validate this equation, the linear regression method was used to compare the 12 field measurements and the valued estimated by the algorithm for two Landsat images. We obtained a R2 of 0.98 with a RMSE of 0.03 m (Table S3).

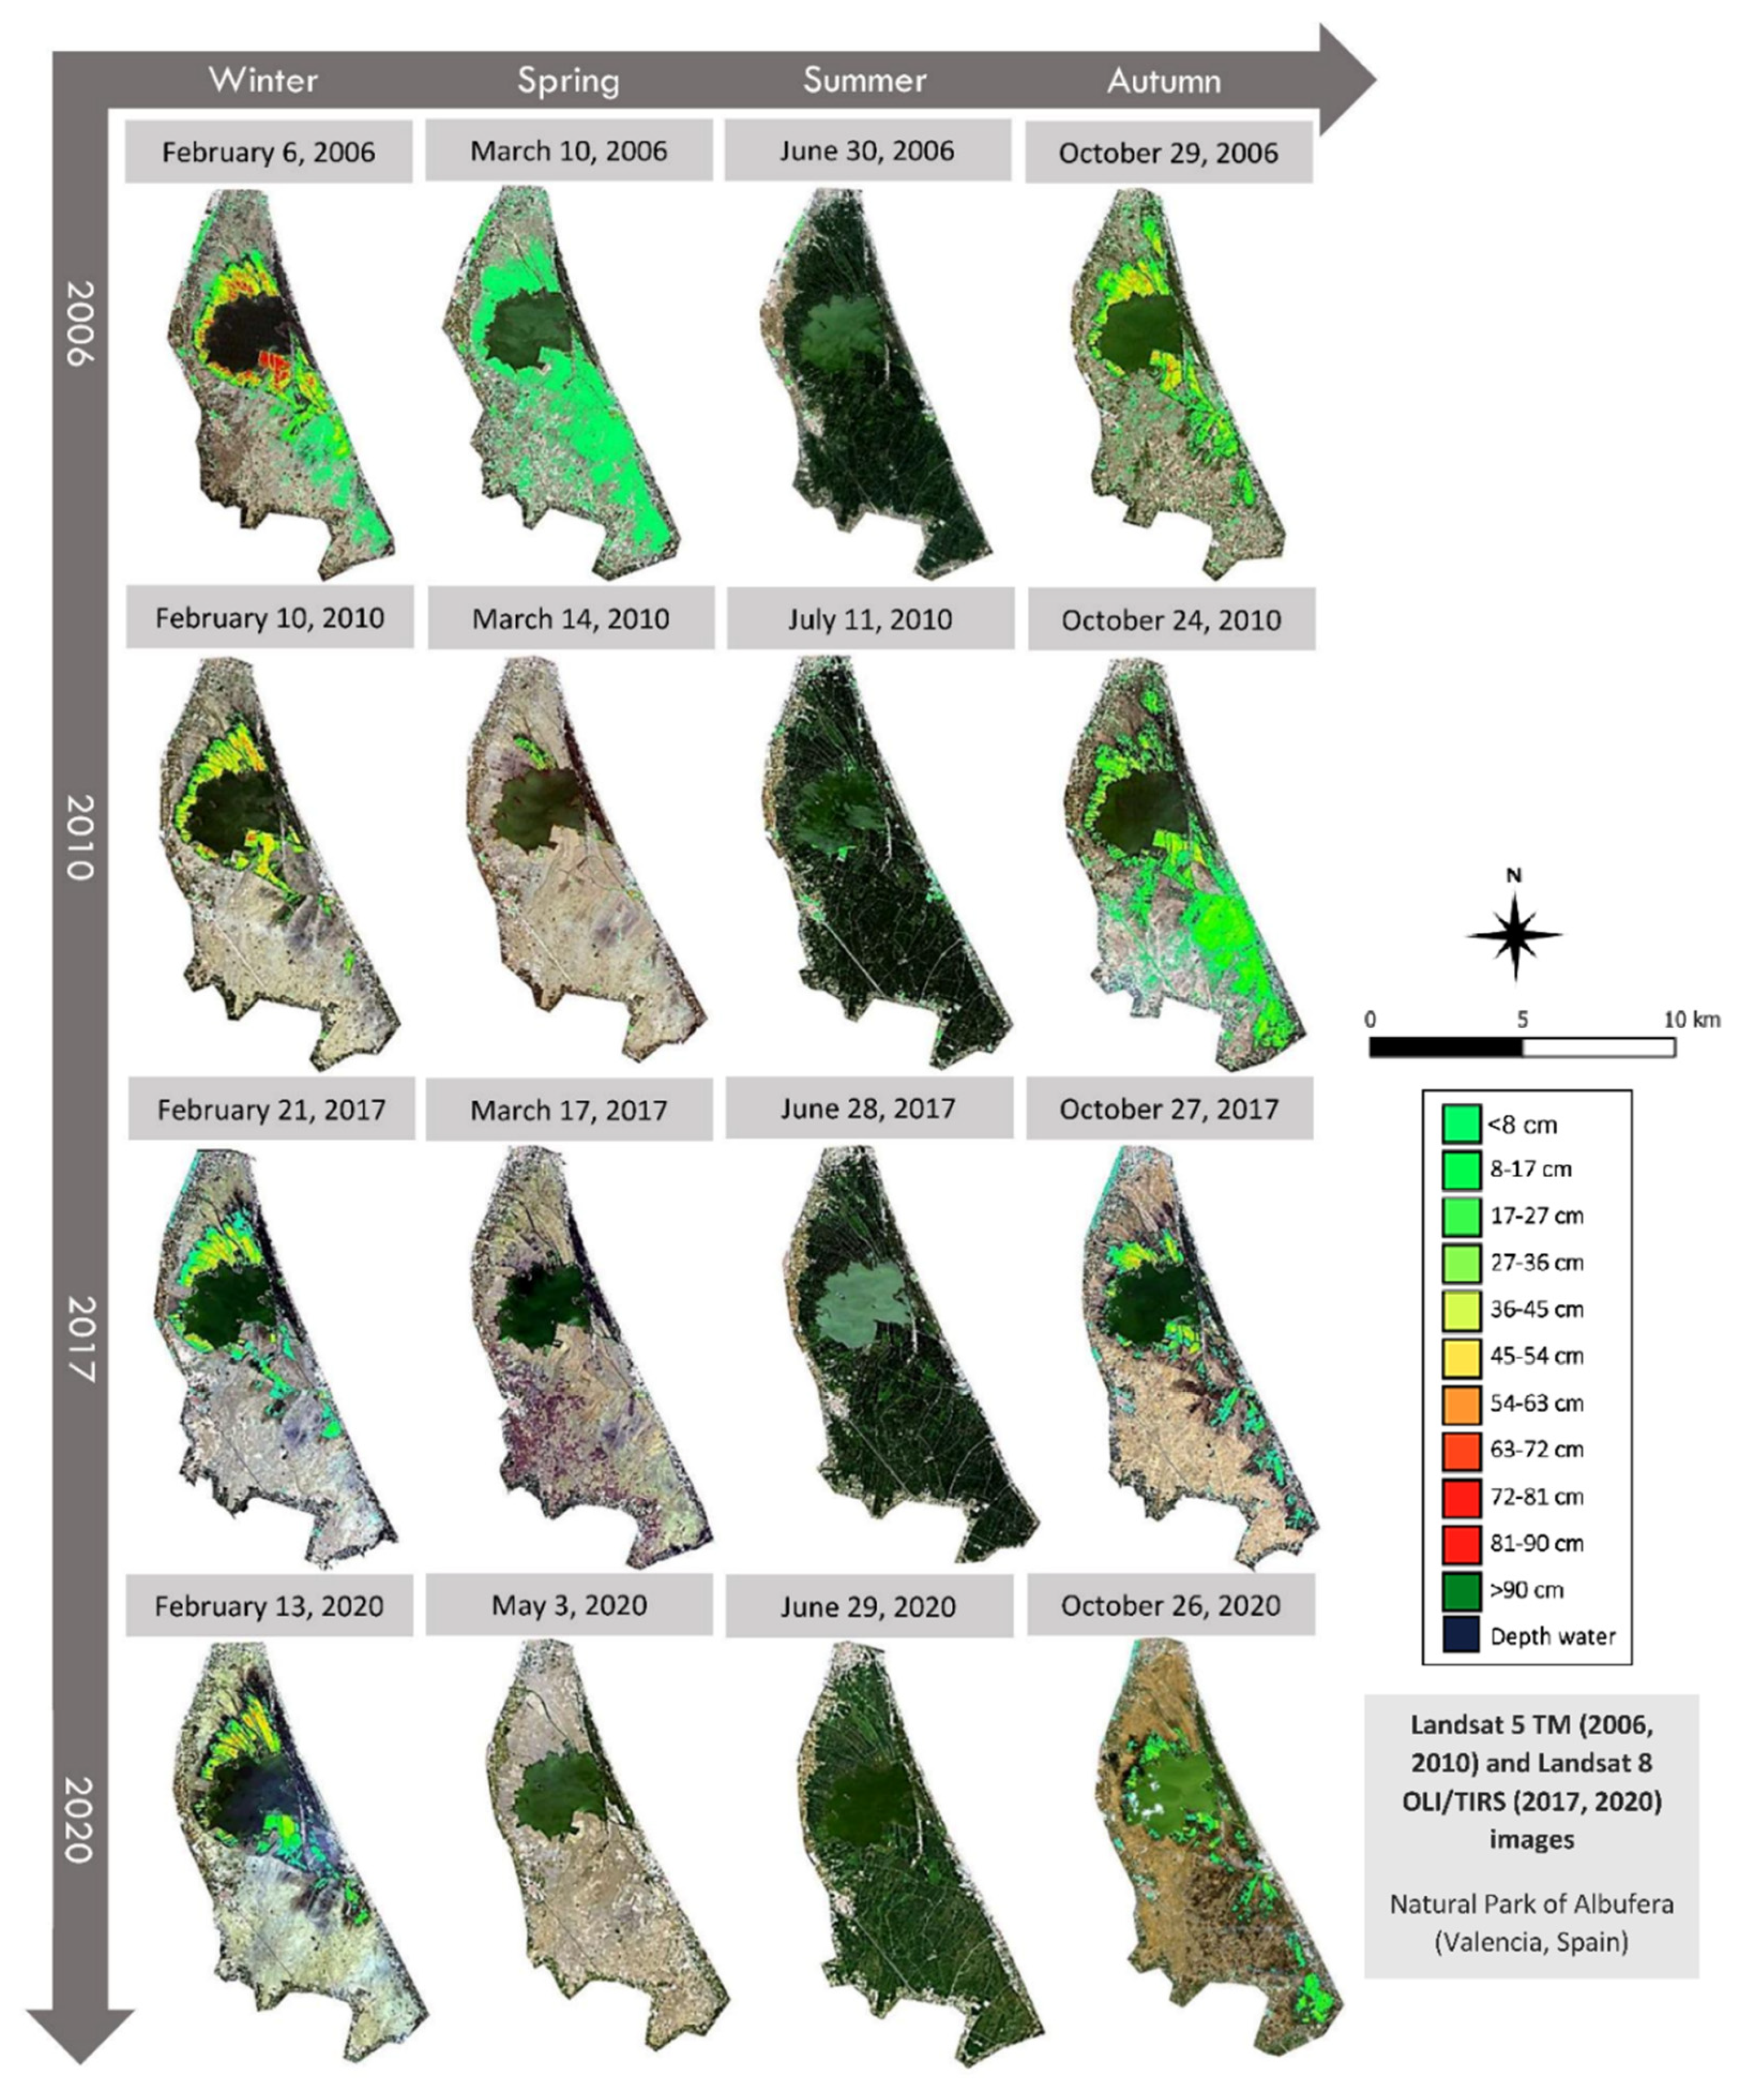
3.2. Visual Assessment of Wetland Flood Cycles

The derived water levels were first evaluated qualitatively through visual comparison with Landsat images. Although we conducted an intensive inspection of the flooding hydroperiods of the wetland for 15 years, four years were selected to display an example of annual changes (Figure 3). Four acquisition dates (approximately) were displayed, as represented by the four columns, showing substantial seasonal differences in the extent of inundation and water level in the rice fields. For the year 2020, no images for March–April could be processed due to the high percentage of cloud cover in the scene.
The algorithm obtained has allowed to discriminate between the different water levels, also detecting the water-saturated soils. In general, during the winter flooding water levels above 0.45 m are reached in those rice fields closest to the lagoon, while in the south-east part of the wetland they do not exceed 0.36 m. Compared to the years 2010, 2017 and 2020, in March 2006 pixels with low water level (water sheet) can be observed in the winter drainage area. Another annual difference can be observed in October, when the wetland exhibited more flooded area in the years 2006–2010 than in 2017–2020, as the resultant images contained a larger number of inundated pixels. In addition, the complete Landsat imagery long-time series for the study period 2006–2020 together with the flooded (or cultivated) area and the extrapolated water volume are shown in the Supplementary Material A. This qualitative assessment revealed that the mathematical adjustment developed using Landsat images can generate visually water level maps for multiple years with varying extents of inundation, making it possible to monitor the wetland flooding dynamics with considerable sensitivity.

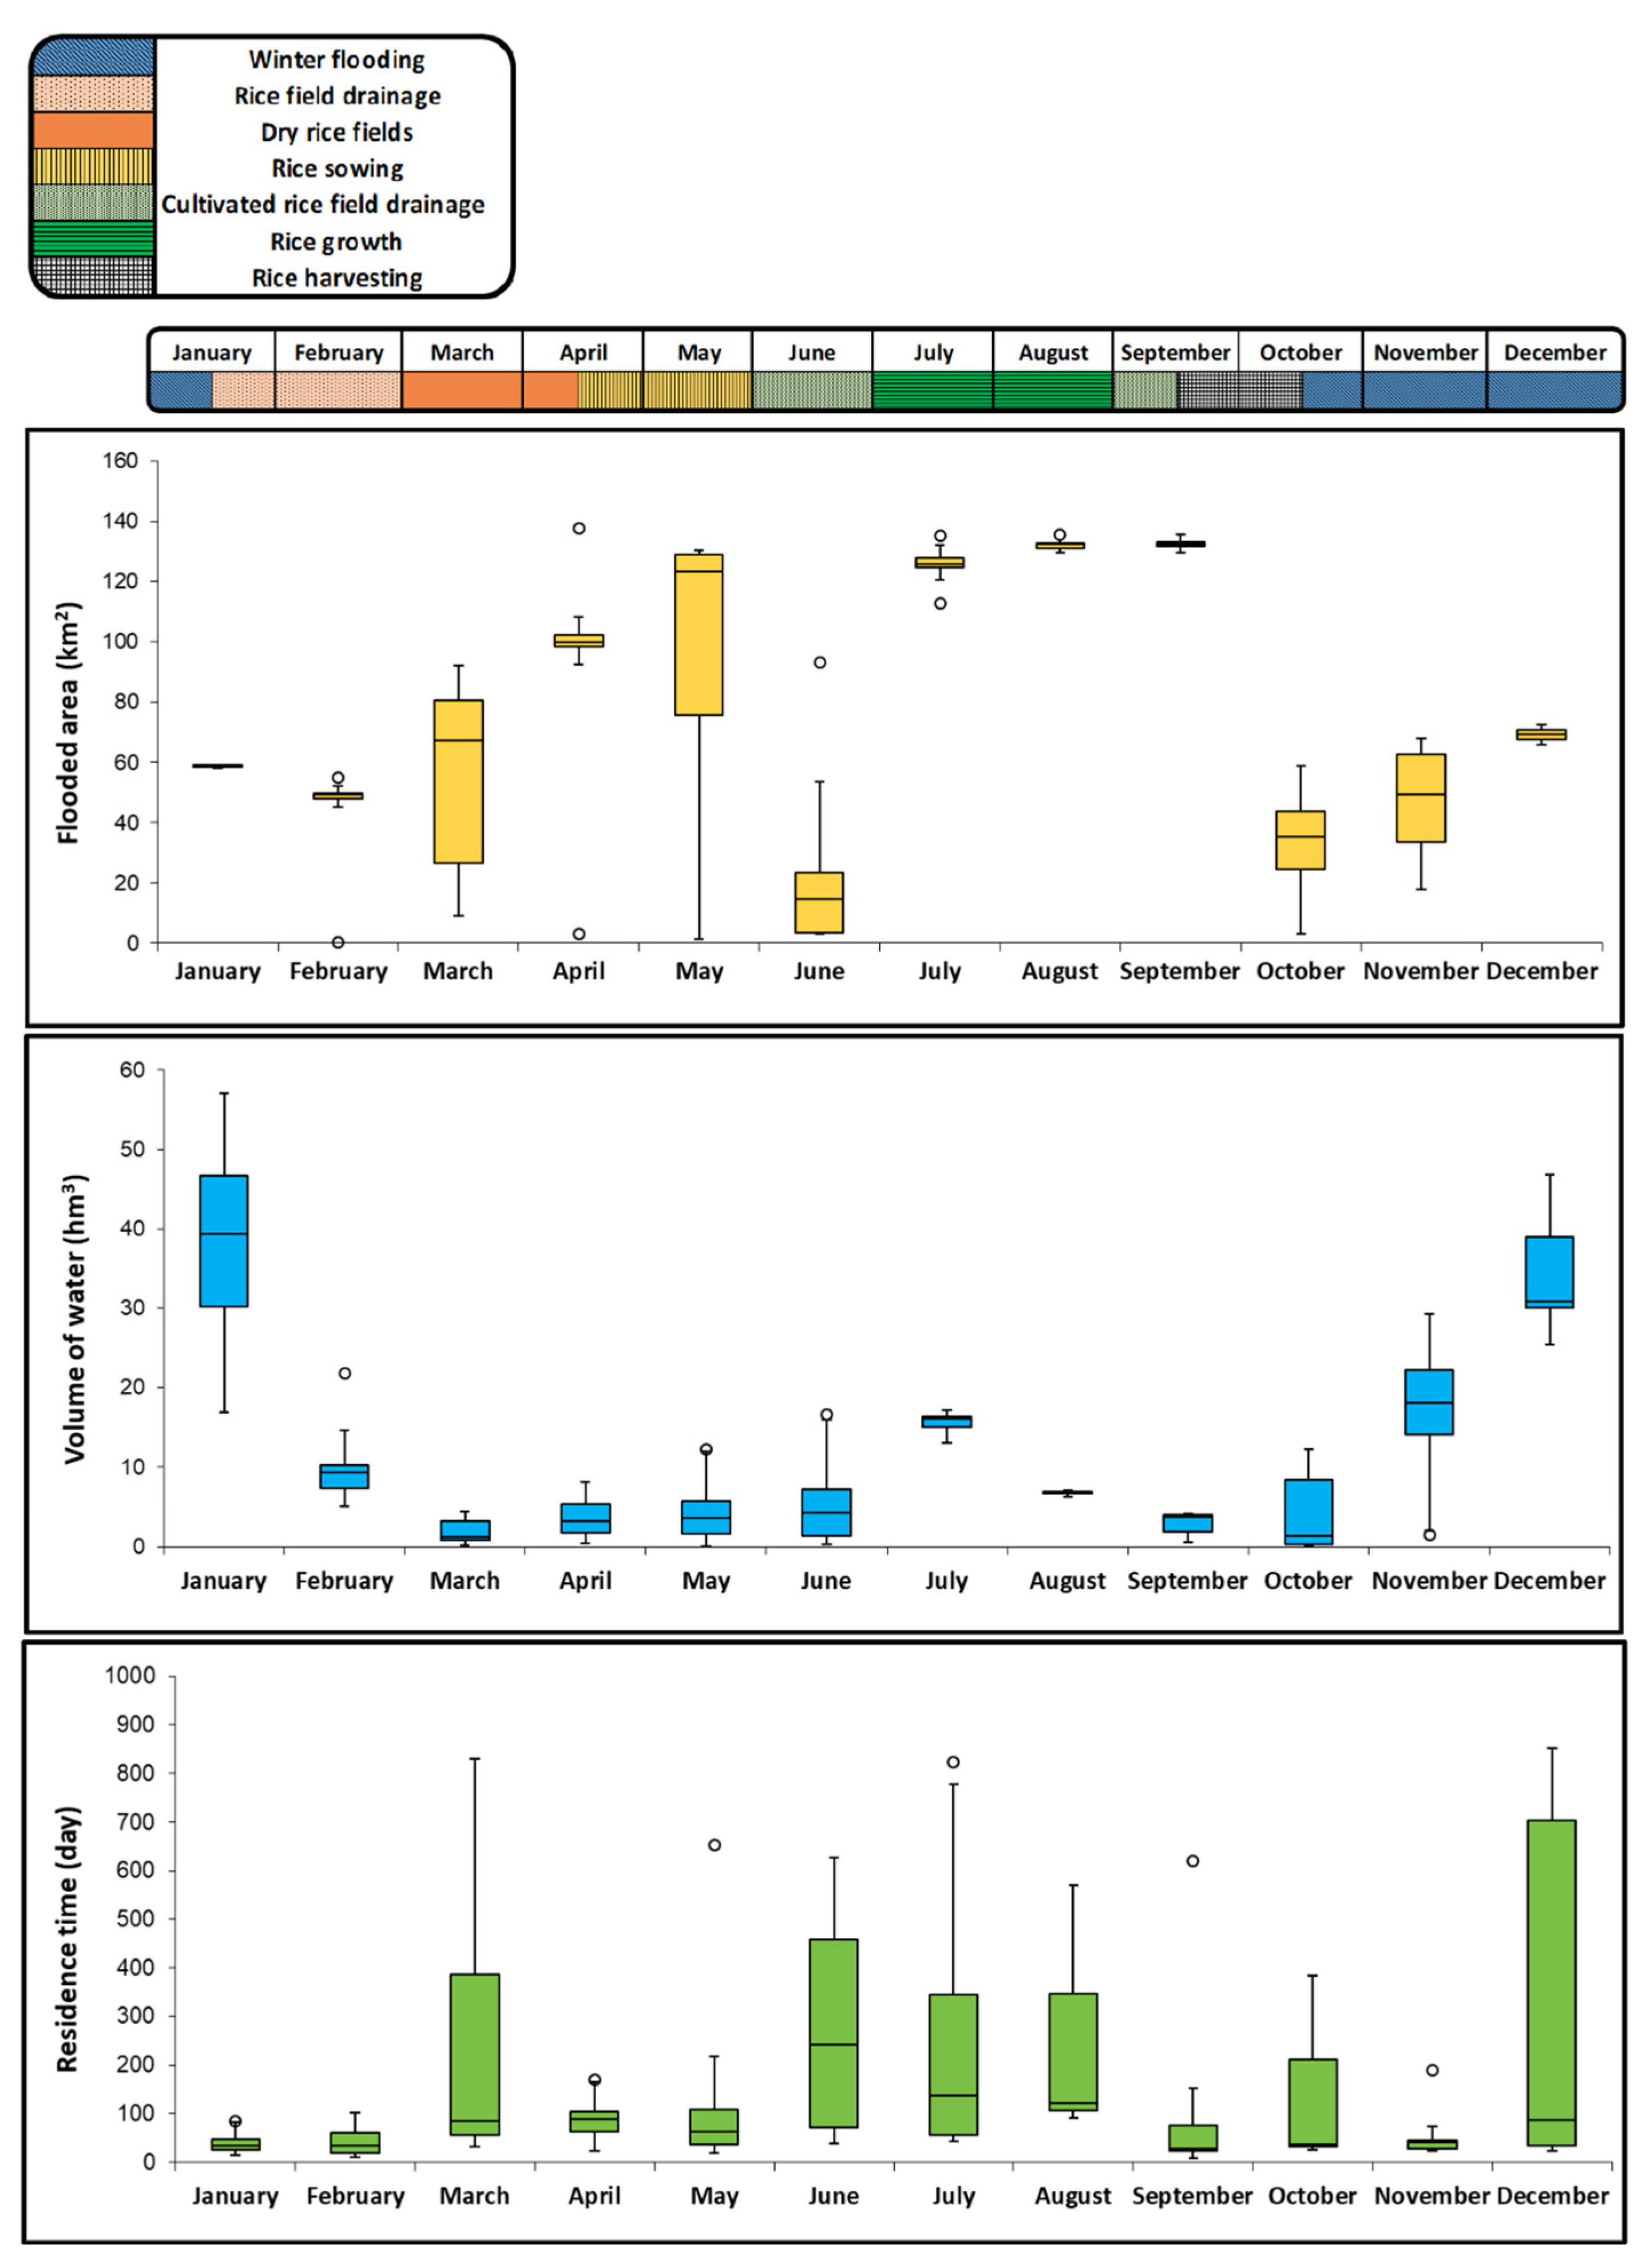
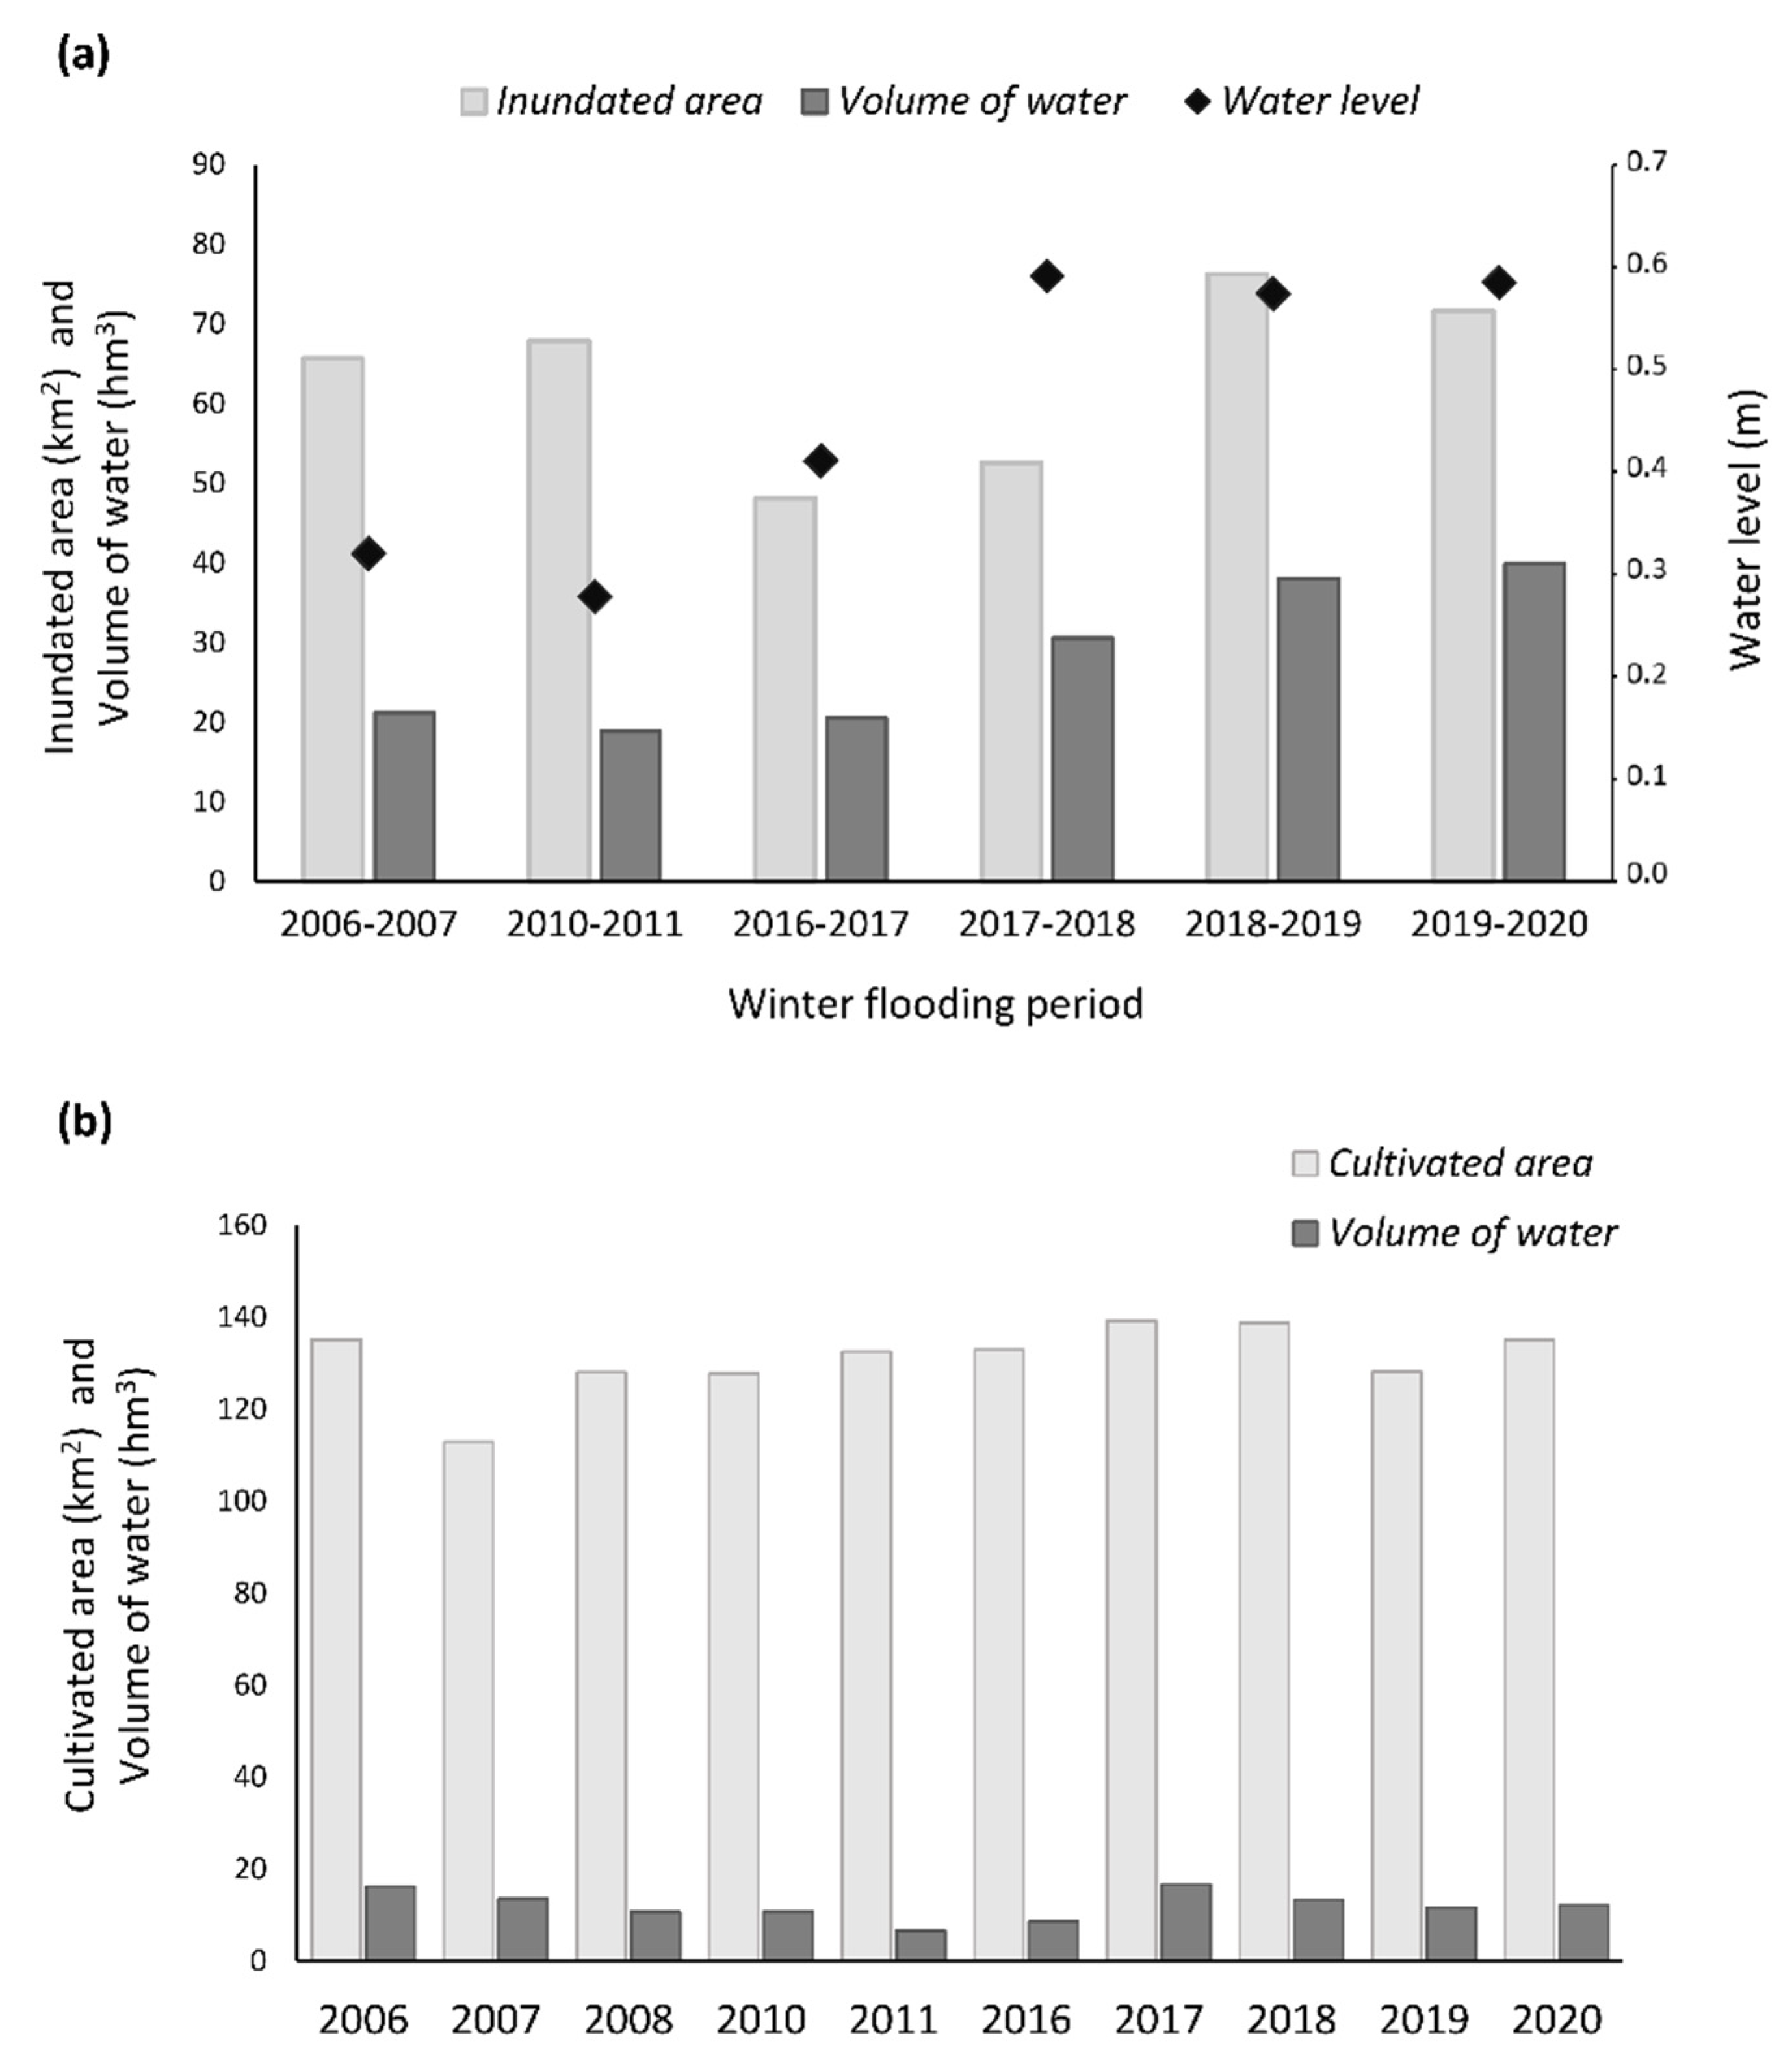
3.3. Quantitative Seasonal and Annual Analysis of Flood Dynamics in Rice Fields
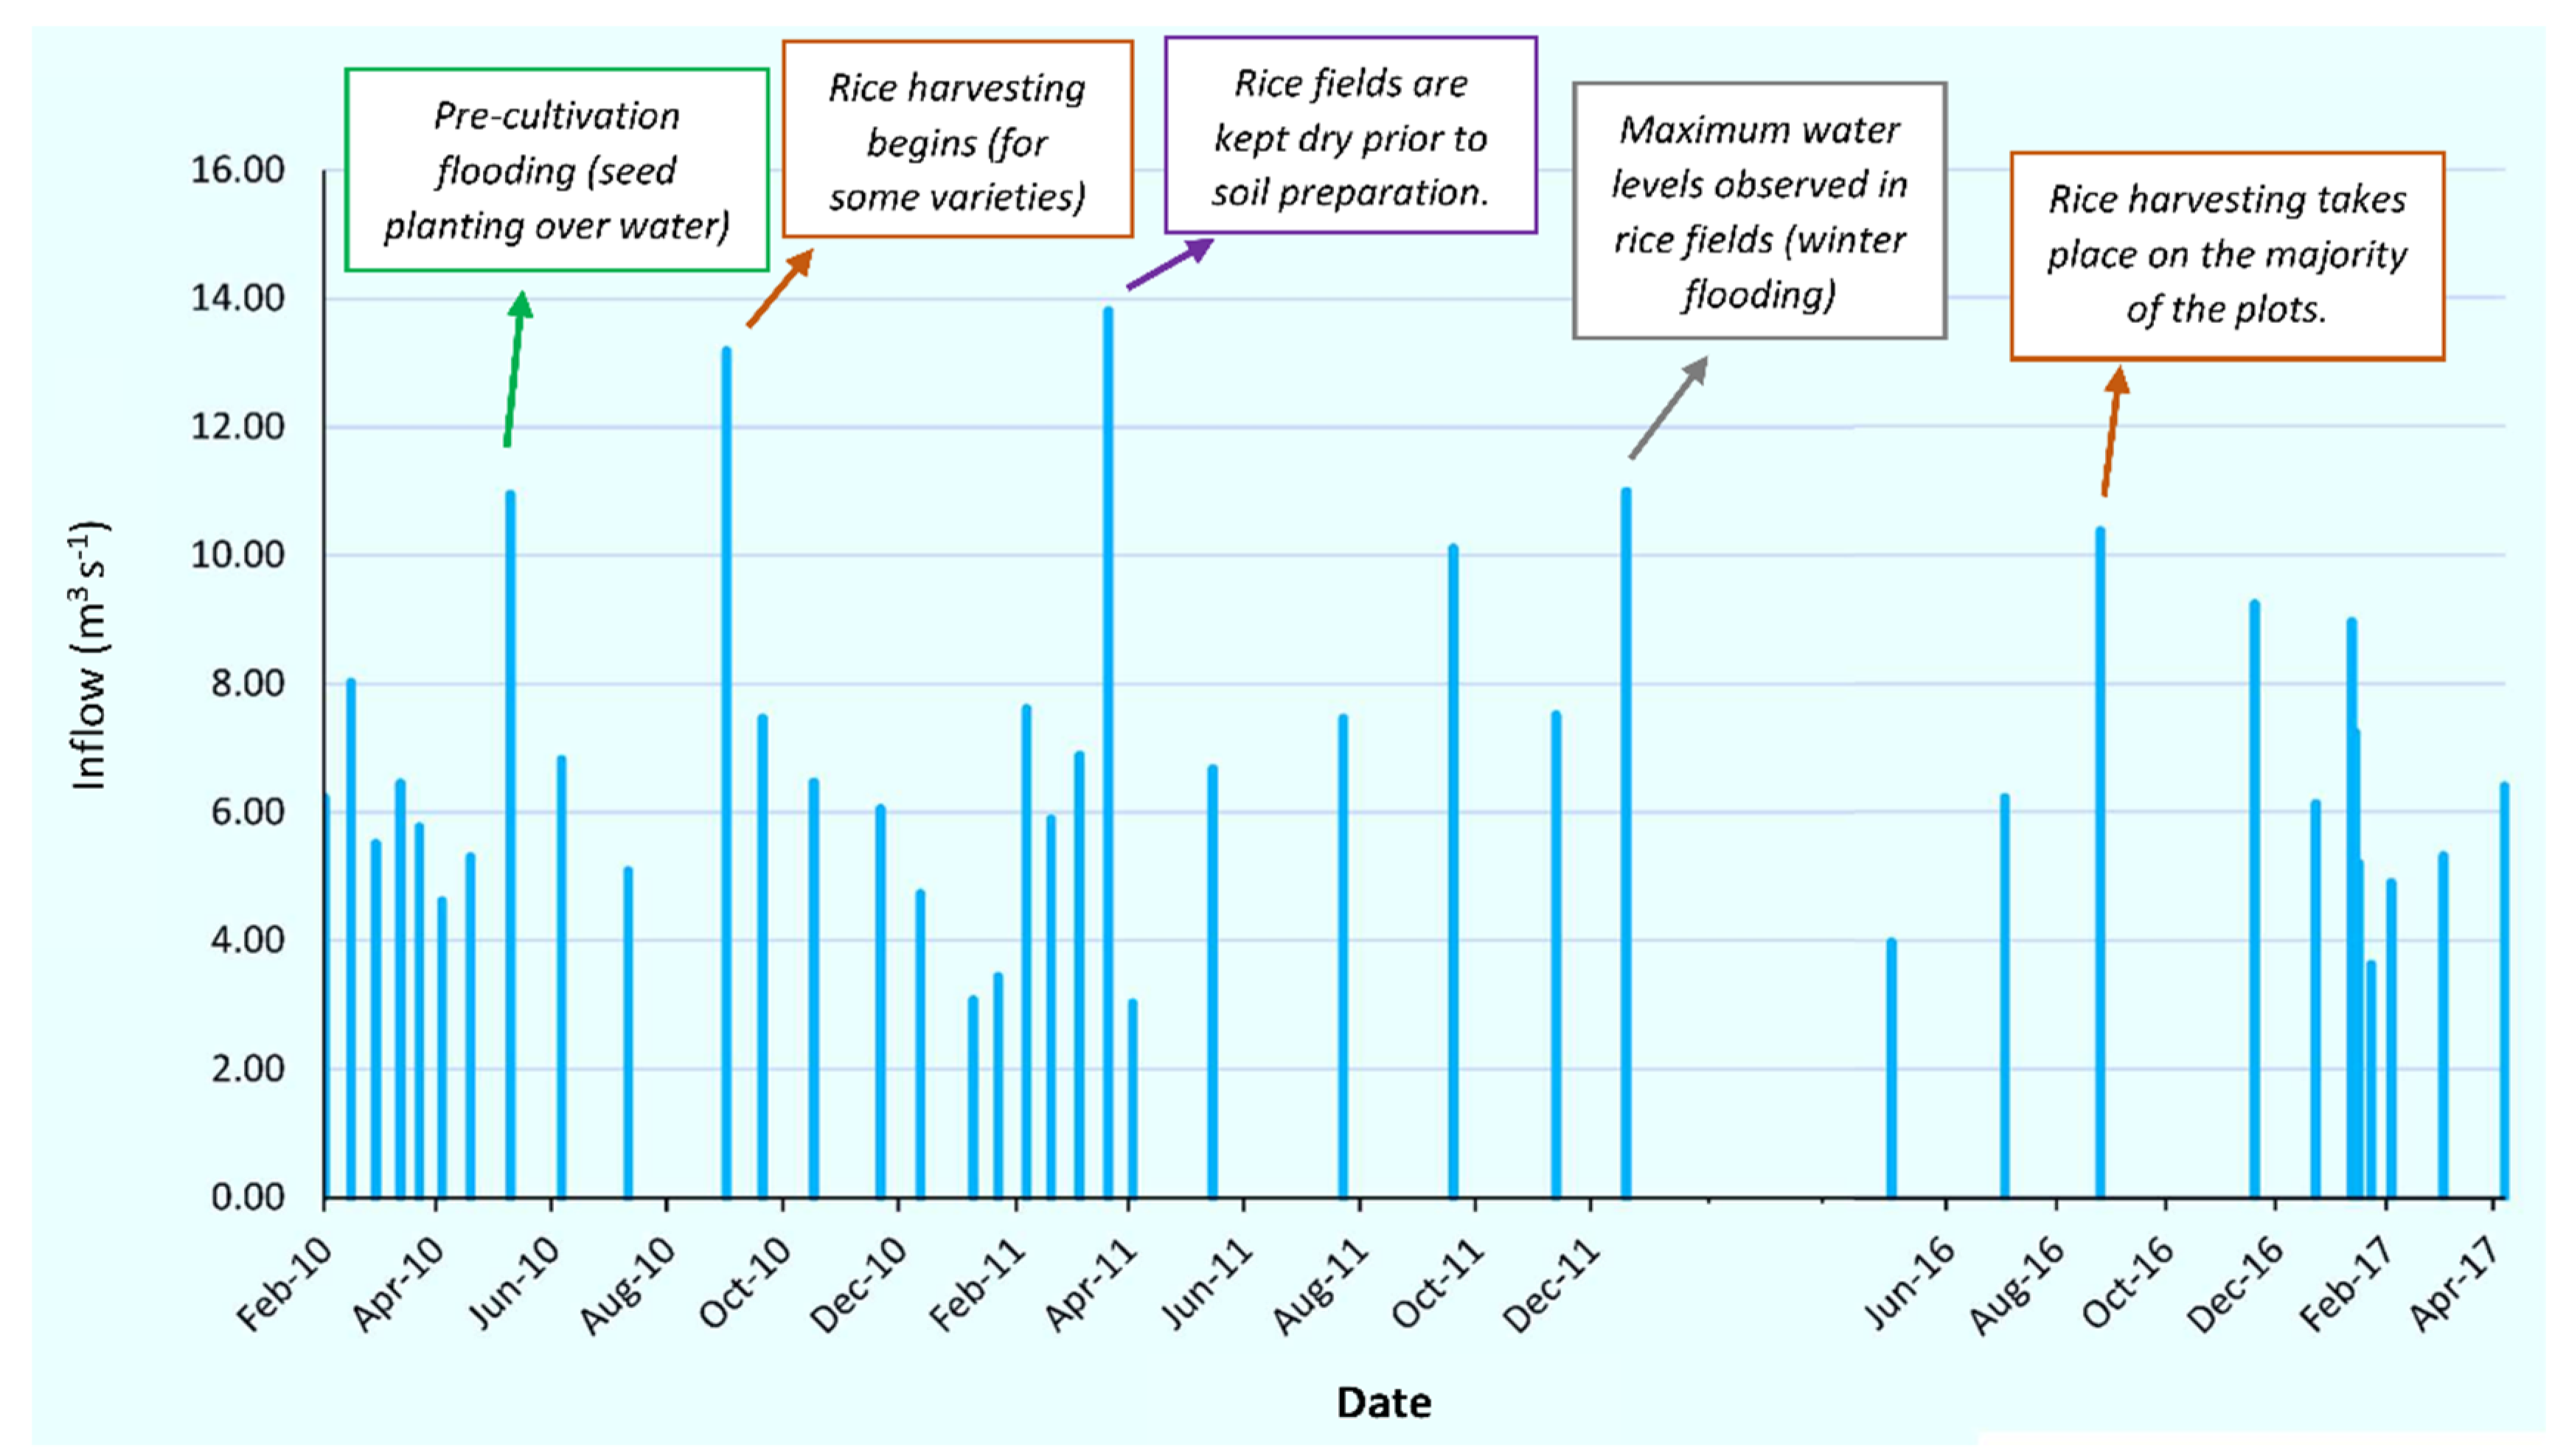
The NDWI index and the calibrated algorithm allowed the determination of flooded area and water volume for 92 of 132 images analyzed. The remaining 40 images correspond to the rice cultivation period (growth and harvest) in which the extent of cultivation and the volume of water under vegetation could be assessed by the NDVI and field data, respectively (there is no significant spatial variability in water level in the rice fields during cultivation). In relation to the flooded area, it reached a mean value of 66.28 ± 4.18 km2 with a range of values from 0.27 to 142.83 km2. The maximum area was reached in July 2018, during the rice cultivation period, when all rice fields are flooded although with low water levels. About the volume of water, it reached a mean value of 11.13 ± 1.02 hm3 with a range from 0.03 to 57.08 hm3. The maximum volume was reached in January 2020, during the winter flooding, at the moment of maximum water entry into the Natural Park. During this period, the highest water level estimated in rice fields and in-situ verified was 0.88 m.
Both variables differed significantly between the months (Kruskal-Wallis, p < 0.001). These differences are due to seasonal changes in the wetland caused by the rice cultivation cycle (Figure 4). In general, July, August and September are the months with the largest flooded area, although with lower water levels, due to agricultural needs. During November–January the volume of water is higher, although the inundation will not cover the entire wetland area (as observed in Figure 3). Figure S3 shows the wetland studied during four key moments of its flood cycle, showing different cover conditions. However, no significant differences were observed in flooded area and volume between the study years (Kruskal-Wallis, p > 0.05). The major inter-annual differences are related to the winter flooding, showing variations for some annual periods (Figure 5). However, cultivated area and water volume during the summer (July–August) are practically constant over the years (Figure 5), with a mean of 131.02 ± 7.64 km2 and 12.07 ± 3.11 hm3, respectively.
These results show how agricultural activity causes artificial flooding periods that are consistent over the years. As exception, the box-plot graph (Figure 4) showed how the water surface values presented a greater variability between years in March, April, and May, which confirms that the pre-sowing flood moment is subject to annual changes. The time series study using the Mann-Kendall test shows a downward trend for the inundated area (S: −41, p: 0.435) and an upward trend for the water volume (S: 74, p: 0.159) but were not statistically significant and therefore should not be considered in the analysis. Both variables, flooded area and volume of water, were positively correlated, although the R was 0.34, not a strong correlation, but significant (p < 0.05). The quantitative analysis of both variables allowed a more accurate analysis of the wetland flood cycle over the 15 years.

3.4. Lake Inflows

Lake inflows were studied for two periods between 2010–2011 and 2016–2017. A total of 455 flow measurements were made during 39 measurement dates. The 19 canals studied showed very different average flow rates between them (Table S2, Supplementary Material B), with a range of values from 0.05 to 1.70 m3 s−1 and a mean value of 0.46 m3 s−1. Table 1 shows the average inflows from the main canals of the Natural Park, which show permanent flows as they are connected to some springs and runoff from the Turia and Jucar rivers. The remaining canals are irrigation ditches and their flow is intermittent and depends directly on the agricultural requirements. For this reason, for some dates these irrigation channels were not considered in the measurement task. In addition, in the study of individual measures, negative flows were determined in some ditches closer to the lagoon (e.g., Reina Nova; Table 1) during certain periods of the year, indicating a discharge of water from the lagoon into the rice fields, instead of an entry into it.
The result of the total inflow measured on each of the dates is shown in Figure 6. The mean value of the lake inflow for the study period was 6.84 ± 2.56 m3 s−1 with a range of values from 3.03 to 13.81 m3 s−1. No periods of drought were observed, as the lake receives a continuous and minimal input from surface and groundwater runoff. In addition, lake inflows showed clear seasonal differences for all the years studied. In 2010, the minimum inflow was recorded at the beginning of April (4.62 m3 s−1), when the fields were still mostly dry before cultivation, while the maximum inflow was determined at the beginning of September (13.18 m3 s−1), coinciding with the moment when the water drainage to the lake for rice harvesting. In 2011, the minimum inflow was recorded again at the beginning of April (3.03 m3 s−1). However, the maximum value was recorded at the end of March (13.81 m3 s−1). This high inflow may be due to runoff from occasional torrential rain, which are discharged into the lake in order to keep the fields dry. Finally, in 2016–2017 the maximum inflow was determined during the second week of September 2016 (10.37 m3 s−1), coinciding again with the drainage of the rice fields at the end of the cultivation period, while the minimum inflow was recorded during the second week of February 2017 (3.63 m3 s−1), when the rice fields are being kept flooded.

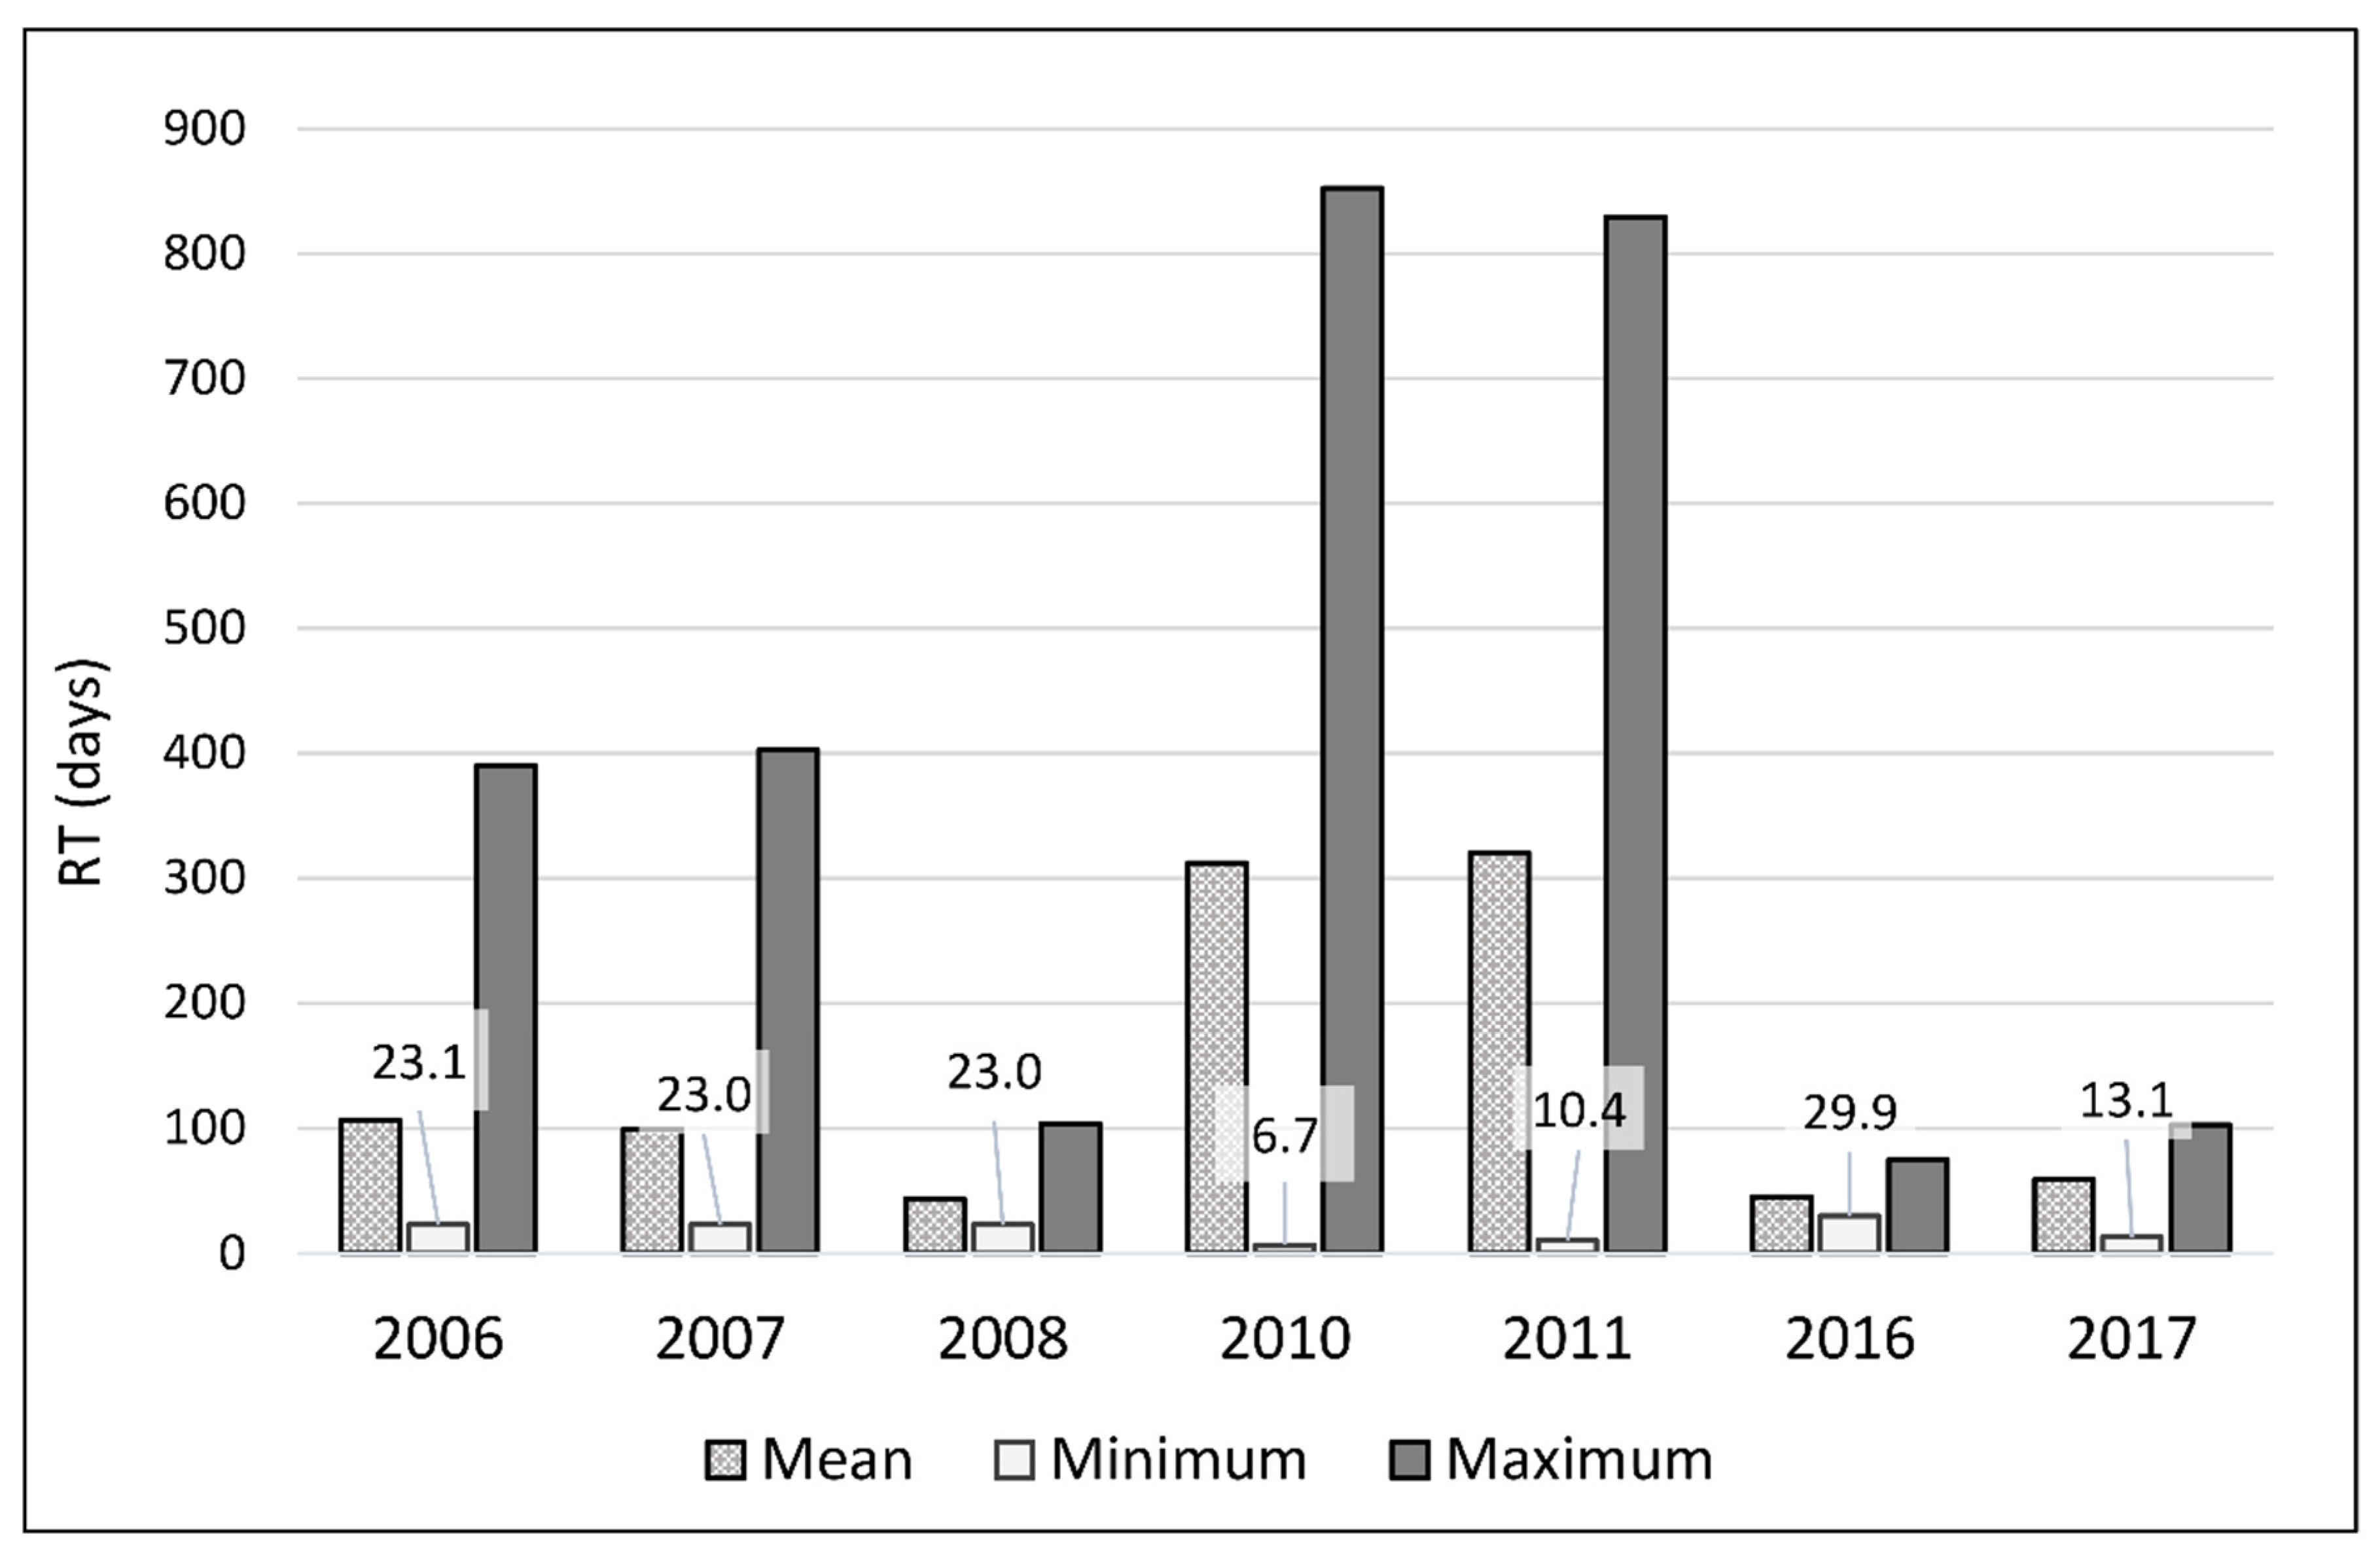
3.5. Water Residence Times of the Lake

The residence times (RT) of the entire lagoon was studied in detail for the years 2006, 2007, 2008, 2010, 2011, 2016, and 2017 using the Equation (5), as a considerable daily record of inputs or outputs was obtained. As explained above, during the determination of the RT, direct rainfall over the lake and evaporation losses were not taken into account in the water balance. For the years studied, the RT reached an average value of 303 days, with a minimum value of 7 days in September 2010 and a maximum value of 852 days in December 2010. As a another comparable measured, the mean value of the renewal rate in this period was 8.5 year−1.
Seasonal changes in RT were also assessed and compared to the different phases of the rice cultivation cycle (Figure 4). Statistically, no significant differences have been observed between the months (Kruskal-Wallis, p = 0.051). However, the results obtained correctly describe the different hydrological periods of the wetland: January and February were the months with the shortest residence times (mean value of 40 and 44 days, respectively), in line with the drainage of the rice fields. March showed greater variability, which can be explained by the irregularity of rainfall at the end of the winter. During this period, the water in the lake is renewed during the rains to keep the rice fields dry in the interest of the farmers. Between July and September, during the rice growth, the residence time values were higher, reaching a mean value of 222 days for the three months. Finally, December was the month with the maximum average residence time (349 days), since the runoff waters are destined to the winter flooding of the wetland, preventing the renewal of the lake. The RT values obtained are grouped in Table 2 according to four key moments in the hydrological cycle of the wetland. As mentioned above, significant differences are observed between the drainage moments and the moments when the water is retained.
No significant differences were observed between years for residence times (Kruskal-Wallis, p > 0.05). However, mean values were considerably higher in 2010 and 2011, with 312 and 320 days, respectively, as well as the maximum values with 852 and 829 days, respectively (Figure 7). The time series study using the Mann-Kendall test shows a downward trend for the RT but were not statistically significant and therefore should not be considered in the analysis (S: −81, Z: −0.37, p: 0.72). No significant correlations were observed between RT and the determined flood areas and volumes of water (R = 0.111 and R = −0.194, respectively; p > 0.05).

3.6. Natural vs. Agricultural Cycle of the Wetland

The rice hydroperiods monitored and renewal rates determined were studied together with the rainfall recorded in the wetland to assess possible mismatch with natural flood cycles. The relationship between precipitations and volume of water in rice fields was studied for the periods February 2006–October 2008, April 2010–October 2011, and May 2016–September 2020, according to the available daily rainfall data (Figure S4, Supplementary Material B). On the one hand, the main rainfall period in the wetland is observed in autumn, with occasional torrential rains in spring and summer. On the other hand, the hydroperiods have two peaks, one in June–July and the other in December–January. Therefore, during the winter the rains are used to flood the fields, preventing the water renewal of the lagoon, while in spring they are quickly drained to keep the rice fields dry, promoting renewal. Both variables were not significantly correlated (R = −0.051; p > 0.05). There was also no strong correlation between monthly rainfall and residence times values (R = −0.374; p < 0.02). High rainfall is not associated with shorter residence times in some months and vice versa. The same adjustment was observed between annual rainfall and average residence times per year, with a weak negative correlation not statistically significant (R = −0.385; p > 0.05) (Table S4, Supplementary Material B). These results confirm that the dynamics of rice fields inundation and the water renewal of the lagoon are not in line with climate, which would indicate an alteration of the natural cycle of the wetland.

4. Discussion

Wetland’s inundation is highly dynamic and can experience important changes through time due to multiple drivers, including precipitation, tides or the agricultural management. The selected study area (Park Natural of Albufera, located in Valencia, Spain) is an example of a coastal wetland of high ecosystem richness, which is linked to rice cultivation activity. The volumetric study of the wetland during the monitoring of flood dynamics was very challenging due to its considerable extension, the connectivity between its different aquatic systems (irrigation channels–rice fields–lake–sea), and the important seasonal changes it undergoes.
At present, satellite imagery has become a widely used tool in floodplains monitoring [33]. In particular, as mentioned above, Landsat imagery is the one used in long series studies due to its large historical record. However, few studies have included an analysis of water level and flood volume during hydroperiods monitoring. Lu et al. [76] analysed volumetric changes in a shallow lake over 40 years from the water surface area and the underwater terrain data using a constructed TIN (triangulated irregular network) volume model. Bhagwat et al. [37] evaluated the volume fluctuations of lakes and reservoirs in California over a 30-year period, using water surface extraction and DEM data. In our study we propose a new approach based on the use of Landsat images, in order to analyse a considerable time period (15 years), and the field measurements of water levels, without the need to take and process altimetric data, which involves a significant deployment of resources. This optimizes the analysis time and facilitates the adaptation of the algorithm obtained to other areas of study. In addition, Landsat imagery is not as heavy as those obtained by other multispectral or SAR satellites, so they do not require as many storage resources and will be easier and faster to process.
Landsat 5 TM and Landsat 8 OLI/TIRS images analysed by NDWI and NDVI indexes have allowed the accurate monitoring of flood dynamics of the Natural Park of Albufera, proving to be an economical, accessible and time-efficient tool. The algorithm adjusted from the extracted pixel values of the NDWI index successfully estimated the volume of water in the rice fields for each generated scene. The results have been compared with the winter flood duration maps of this wetland obtained by Cavallo et al. [60]. They combined three multispectral indices (NDWI, MNDWI and NDVI) and developed an automatic classification method of four land cover classes. Although the volume of water in the rice fields was not analysed in detail, their results are consistent with our observations regarding the extension and duration of submerged zones in different wetland areas. In particular, the areas delineated as Tancats, closer to the Albufera Lake, showed the maximum duration of inundation and were classified as Open Water (W) for an average of 60–80 days [60]. The indices mentioned above have been used to assess long-term land cover variations in other wetlands regions with satisfactory results. For instance, Wang et al. [36] applied the NDVI, NDWI and mNDWI (modified Normalized Difference Water Index) to Landsat images in order to study the dynamics of surface water from 1990 to 2017 in the Middle Yangtze River Basin (China). Xia et al. [31] combined the indexes NDVI, mNDWI and EVI (enhanced vegetation index) to extract surface water areas during 1989 to 2017 in the Huai River Basin. Serra et al. [77] monitored the rice fields’ winter flooding area in Ebro Delta river (Spain) making a supervised classification with discriminant analyses.
Monitoring of seasonal changes in the wetland for 15 years has confirmed the influence of rice cultivation on the hydroperiods, with remain stable over the years, showing the same characteristics as those described by Alonso et al. [59] and Soria [66]. In winter, flooding takes place mainly in the east and the central area of the wetland. During this period the water supply from the Júcar River is used to flood the rice fields, preventing the water renewal of the lake until the end of January. In spring, the fields are kept dry until sowing time. Water-saturated soils have been observed, which indicate that in rainy periods human action keeps the fields dry for agricultural purposes. In summer, rice growth is clearly visible, covering the entire area of the wetland. The water floods the rice fields, although with levels much lower than those detected in winter. Finally, the autumn images show the beginning of the winter flooding. Monitoring was more challenging during the spring, due to the lack of acceptable images (high % cloud cover) and the significant changes in the wetland surface in short time periods. Despite a lower number of images analysed during this seasonal period, it was possible to observe significant differences during March, April and May between the years 2006–2008 and 2010–2020. These changes in the hydrological cycle could indicate a progressive delay of the rice sowing period. This may be due to changes in water management in the river basin, related to lower water availability due to greater rainfall fluctuations. In this context, it is recommended to monitor inter-annual flooding in March-May periods for the next decade, in order to obtain conclusions about water inputs in the wetland and their potential relationship with changes in the Mediterranean climate. The hydrological cycle of this coastal wetland is practically identical to the one observed in the Ebro Delta (Catalonia, Spain), where two different periods of rice field cultivation can be distinguished: the first, from April to September, which includes sowing, growing and harvesting; and the second, from September to February, when the fields remain inactive and flooded [78]. In general, rice cultivation in Mediterranean region has the same main stages as in other climate regions such as the Mekong River Delta (South Vietnam), where the rice production is controlled by the dry season (December to April) and rainy season (May to November) [79], or the Arkansas River Basin (United States), where different crops (rice, cotton, corn and soybean) are developed sharing similar phenological cycles [80].
This study has also evaluated the inflows and residence times values of the Albufera Lake between 2006 and 2017, in order to analyse them with the observed hydroperiods. Lake inflows depended on the phase of rice cultivation cycle taking place in the wetland. Normally, the highest inflows are reached in September-October after rice harvesting, although they can also be observed in February, after the drainage of the fields at the end of the winter flooding, and occasionally during torrential rains in spring, in order to keep the fields dry. The study carried out by Soria et al. [64] confirms the heterogeneity of inflows between months (highest values recorded in October and May) as well as the irregular distribution of flows into the lake, evaluating in detail 18 canals connected to natural basins. Minimum and maximum flow values are similar to those recorded in our study; there are no periods of drought.
The average water renewal of the lake for the period 2006–2017 (8.5 times year−1 = 42.9 days) is slightly higher than that recorded by Soria [66] in 2004 (7.4 times year−1 = 49.5 days). In addition, the average result is practically unchanged with respect to that reported by Soria et al. [64] (8.4 times year−1 = 43,4 days). These values confirm a considerable reduction with respect to the estimated renewal rate in 1988 (9.8 times year−1 = 37 days) [73], which is impossible to recover without increasing inputs and optimizing natural runoff events. Similarly, in Dragon Lake (China), an urban man-made lake, the residence times ranged from 1.5 to 102 days and 1.0 to 66 days depending on the flow conditions [81]. Moreover, the natural hydrological zoning of the lagoon causes the renewal rate to show a significant spatial heterogeneity, as demonstrated by Soria and Vicente [73], which persists today [64]. Although our study does not include a zonal analysis of the RT of the lake, spatial differences are noticeable also in the lake inflows measured, as mentioned above. This spatial variation has also been observed in the Venice Lagoon (Italy), where residence times ranged between values less than 25 days, close to the inlets, and values over 60 days, in the inner areas [82].
In addition, the analysis confirms that water renewal in Albufera lake is dependent on the phases of rice cultivation, with significant seasonal changes. As a consequence, the lake undergoes abrupt water-level changes over an annual cycle, resulting in continuous alterations in turbidity as observed by Sebastiá-Frasquet et al. [30]. These increasingly common turbidity phases can negatively affect the development of vegetation populations in the lake. In general, the annual moments where the highest flows were recorded coincide with the lowest residence times, which implies that the floodgates that connect the lake with the sea were open, promoting a renewal of the lake water and not a dilution effect. These moments are linked to the drainage of the rice fields at the end of the winter flooding or cultivation period. During higher water renewal periods, short-term clear-water events (CWPs) sometimes occur. This rapid flushing has been evaluated in previous studies [61,62,63] and is linked to a significant reduction in salinity and a strong increase in lake transparency, associated with a reduction in phytoplankton biomass and a change in the plankton community composition. This mismatch with the natural flood cycle has also been observed during the analysis of the rainfall data. On the one hand, the main rainfall period in the wetland is observed in autumn, with occasional torrential storms in spring and summer. On the other hand, the hydroperiods have two peaks, one in June-July and the other in December-January. Therefore, during the winter the rains are used to flood the fields, preventing the water renewal of the lagoon, while in spring they are quickly drained to keep the rice fields dry, promoting renewal. In addition, high flood volumes are often observed when the rainfall is low.

5. Conclusions

Wetland are among the most important aquatic ecosystems due to their biological richness and the ecosystem resources they provide. In the Mediterranean region, coastal wetlands have suffered major impacts due to land use change for the benefit of agricultural production. Long-term hydrological regime monitoring of these regions is a priority in order to optimize its hydrological management and ensure the conservation of their natural attributes.
A new method to estimate the water level in flood plains from Landsat images has been developed and validated in this research. This methodology has been applied to a Mediterranean coastal wetland highly linked to the rice production, the Natural Park of Albufera (Valencia, Spain), in order to monitor its flooding dynamics during the last 15 years. A large volume of data has been analysed, both from satellite images and field measurements, in order to obtain a reliable and efficient method. The algorithm developed is consistent and provides maps of the flooded area and water volume with optimal resolution considering the extent of the study area. The methodology followed to study flood cycles is confirmed as an efficient and fast ecological tool. This practical approach can be applied to analyse volume changes in complex flood plains areas, where such estimations are challenging because of the continuous spatial and temporal changes, the dynamic connection between water bodies and the impact of human activities.
This study represents the most extensive temporal analysis of the hydrological cycles of the Natural Park of Albufera to date. No major differences have been observed over the 15 years in the flood cycle, which is governed by the requirements of rice production carried out in the wetland. In addition, the methodology followed to calculate the inflows to the Albufera lake has been successful, allowing the temporal analysis (annual and seasonal) of the residence times of the lake during 2006–2017. This study demonstrates the impact of agricultural activity on the hydrology of the Albufera Lake by reducing its natural renewal rate promoted by rainfall and runoff processes. Therefore, it is necessary to optimize seasonal hydroperiods with the rice cultivation in order to reduce residence times of the lake in winter months and prevent nutrient and organic matter stagnation during summer. These changes will favor the improvement of the Albufera Lake trophic state and the sustainability of its aquatic biodiversity.

Supplementary Materials

The following are available online. Supplementary Material A: Hydrological regime monitoring of the Natural Park of Albufera between 2006 and 2020: Landsat imagery long-time series together with the calculated flooded (or cultivated) area and the volume of floodwater; Supplementary Material B: Table S1: Location of the points selected to measure the water level during winter flooding in the rice fields together with the date of the measurement, the actual water level, the pixel value obtained for the applied NDWI index and the water level resulting from the mathematical adjustment. Table S2: Ubication of each point selected to measure inflows to the lagoon (UTM coordinates) together with the dimension of each canal (width and depth in m), average inflow for the study period (years 2010, 2011, 2016 and 2017) and standard deviation (SD). Table S3: Algorithm validation results based on the linear regression method between the water level values estimated from two Landsat scenes and the real measurements obtained at 12 field points. Table S4: Average residence times and water renewal rates of the Albufera Lake estimated for the period 2006–2017, together with total annual rainfall. Figure S1: Landsat sensors employed together with the total number of images available in the European Space Agency & United States Geological Survey Landsat archives, the number of images downloaded (images with less than 40% land cloud cover) and the number of images finally processed and analysed per year. Figure S2: Examples of Landsat 8 OLI/TIRS images of the Park Natural of Albufera processed by the normalized difference water index (NDWI) and the normalized difference vegetation index (NDVI) representing inundation extent during the winter flooding and cultivated area during summer, respectively. Figure S3: (A) Great egret (Ardea alba) in the rice fields located to the south of the Natural Park of Albufera, during the beginning of winter flooding in October 2018; (B) Flock of Glossy ibis (Plegadis falcinellus) in rice fields in the south of the Natural Park during winter flooding in December 2018; (C) Beginning of rice growth in rice fields located to the south of the Natural Park in June 2019; (D) Rice fields located in the north of the Natural Park prior to their collection in September 2019. Figure S4: Evaluation of the volume of water in the rice fields and the monthly rainfall recorded in the Natural Park of Albufera for the periods 2006–2008, 2010–2011 and 2016–2020.

Author Contributions

Conceptualization: S.R., L.V.-H., J.S. and J.P.; data curation: J.S., J.P. and S.R.; formal analysis: L.V.-H., J.S. and S.R.; investigation: L.V.-H., J.S. and J.P.; methodology: L.V.-H., J.S. and J.P.; supervision: S.R. and J.S.; visualization: L.V.-H.; writing-original draft preparation: L.V.-H.; Writing—review & editing: J.S. and S.R. All authors have read and agreed to the published version of the manuscript.

Funding

This research received no external funding.

Institutional Review Board Statement

Not applicable.

Informed Consent Statement

Not applicable.

Data Availability Statement

Meteorological data are available from public web services (AVAMET, 2021).

Acknowledgments

We are grateful for the inestimable help and support of our students and people from the Natural Park of the Albufera during this study. We thank the Jucar Basin Authority for providing daily meteorological data and the Valencia Environmental Agency for their help and facilities given during all these years. Landsat images are granted by U.S. Geological Survey (https://www.usgs.gov; accessed on 18 November 2020).

Conflicts of Interest

The authors declare no conflict of interest. The funders had no role in the design of the study; in the collection, analyses, or interpretation of data; in the writing of the manuscript, or in the decision to publish the results.

References

  1. Palmer, T.A.; Montagna, P.A.; Pollack, J.B.; Kalke, R.D.; DeYoe, H.R. The Role of Freshwater Inflow in Lagoons, Rivers, and Bays. Hydrobiologia 2011, 667, 49–67. [Google Scholar] [CrossRef]
  2. Langer, T.A.; Cooper, M.J.; Reisinger, L.S.; Reisinger, A.J.; Uzarski, D.G. Water Depth and Lake-Wide Water Level Fluctuation Influence on α- and β-Diversity of Coastal Wetland Fish Communities. J. Great Lakes Res. 2018, 44, 70–76. [Google Scholar] [CrossRef]
  3. Raymond, P.A.; Hartmann, J.; Lauerwald, R.; Sobek, S.; McDonald, C.; Hoover, M.; Butman, D.; Striegl, R.; Mayorga, E.; Humborg, C. Global Carbon Dioxide Emissions from Inland Waters. Nature 2013, 503, 355–359. [Google Scholar] [CrossRef] [Green Version]
  4. Moss, B. Fresh Waters, Climate Change and UK Nature Conservation. Freshw. Rev. 2014, 7, 25–75. [Google Scholar] [CrossRef]
  5. Shaltout, K.; El-Bana, M.; Galal, T. Coastal Lakes as Hot Spots for Plant Diversity in Egypt. In Egyptian Coastal Lakes and Wetlands: Part II; Springer: Cham, Switzerland, 2017; pp. 129–146. [Google Scholar]
  6. Were, D.; Kansiime, F.; Fetahi, T.; Cooper, A.; Jjuuko, C. Carbon Sequestration by Wetlands: A Critical Review of Enhancement Measures for Climate Change Mitigation. Earth Syst. Environ. 2019, 3, 327–340. [Google Scholar] [CrossRef]
  7. Carter, V.; Gammon, P.T.; Garrett, M.K. Ecotone Dynamics and Boundary Determination in the Great Dismal Swamp. Ecol. Appl. 1994, 4, 189–203. [Google Scholar] [CrossRef]
  8. Chapman, L.J.; Chapman, C.A.; Chandler, M. Wetland Ecotones as Refugia for Endangered Fishes. Biol. Conserv. 1996, 78, 263–270. [Google Scholar] [CrossRef]
  9. Davidson, N.C. How Much Wetland Has the World Lost? Long-Term and Recent Trends in Global Wetland Area. Mar. Freshw. Res. 2014, 65, 934–941. [Google Scholar] [CrossRef]
  10. Zhang, L.; Wu, B.; Yin, K.; Li, X.; Kia, K.; Zhu, L. Impacts of Human Activities on the Evolution of Estuarine Wetland in the Yangtze Delta from 2000 to 2010. Environ. Earth Sci. 2015, 73, 435–447. [Google Scholar] [CrossRef]
  11. Gabler, C.A.; Osland, M.J.; Grace, J.B.; Stagg, C.L.; Day, R.H.; Hartley, S.B.; Enwright, N.M.; From, A.S.; McCoy, M.L.; McLeod, J.L. Macroclimatic Change Expected to Transform Coastal Wetland Ecosystems This Century. Nat. Clim. Chang. 2017, 7, 142–147. [Google Scholar] [CrossRef]
  12. Chen, H.W.; Lin, H.C.; Chuang, Y.H.; Sun, C.T.; Chen, W.Y.; Kao, C.Y. Effects of Environmental Factors on Benthic Species in a Coastal Wetland by Redundancy Analysis. Ocean Coast. Manag. 2019, 169, 37–49. [Google Scholar] [CrossRef]
  13. Leberger, R.; Geijzendorffer, I.R.; Gaget, E.; Gwelmami, A.; Galewski, T.; Pereira, H.M.; Guerra, C.A. Mediterranean Wetland Conservation in the Context of Climate and Land Cover Change. Reg. Environ. Chang. 2020, 20, 67. [Google Scholar] [CrossRef]
  14. Cuttelod, A.; García, N.; Malak, D.A.; Temple, H.J.; Stuart, S.N. The Mediterranean: A biodiversity hotspot under threat. In Wildlife in a Changing World: An Analysis of the 2008 IUCN Red List of Threatened Species; Vié, J.-C., Hilton-Taylor, C., Stuart, S.N., Eds.; IUCN: Gland, Switzerland, 2009. [Google Scholar]
  15. Knapp, A.K.; Hoover, D.L.; Wilcox, K.R.; Avolio, M.L.; Koerner, S.E.; La Pierre, K.J.; Loik, M.E.; Luo, Y.; Sala, O.E.; Smith, M.D. Characterizing Differences in Precipitation Regimes of Extreme Wet and Dry Years: Implications for Climate Change Experiments. Glob. Chang. Biol. 2015, 21, 2624–2633. [Google Scholar] [CrossRef] [Green Version]
  16. Escribano Francés, G.; Quevauviller, P.; San Martín González, E.; Vargas Amelin, E. Climate Change Policy and Water Resources in the EU and Spain. A Closer Look into the Water Framework Directive. Environ. Sci. Policy 2017, 69, 1–12. [Google Scholar] [CrossRef]
  17. LeRoy, N.; Allan, J.; Bain, M.; Karr, J.; Prestegaard, K.; Richter, B.; Sparks, R.; Stromberg, J. The Natural Flow Regime. BioScience 1997, 47, 769–784. [Google Scholar]
  18. Liu, Q.; Liu, J.; Liu, H.; Liang, L.; Cai, Y.; Wang, X.; Li, C. Vegetation Dynamics under Water-Level Fluctuations: Implications for Wetland Restoration. J. Hydrol. 2020, 581, 124418. [Google Scholar] [CrossRef]
  19. Zhao, S.; Fang, J. Impact of Impoldering and Lake Restoration on Land-Cover Changes in Dongting Lake Area, Central Yangtze. Ambio 2004, 33, 311–315. [Google Scholar] [CrossRef] [PubMed]
  20. Miller, R.L.; Fujii, R. Plant Community, Primary Productivity, and Environmental Conditions Following Wetland Re-Establishment in the Sacramento-San Joaquin Delta, California. Wetl. Ecol. Manag. 2010, 18, 1–16. [Google Scholar] [CrossRef]
  21. Yang, L.; Wang, L.; Yu, D.; Yao, R.; Li, C.; He, Q.; Wang, S.; Wang, L. Four Decades of Wetland Changes in Dongting Lake Using Landsat Observations during 1978–2018. J. Hydrol. 2020, 587, 124954. [Google Scholar] [CrossRef]
  22. Chen, Y.; Wang, B.; Pollino, C.A.; Cuddy, S.M.; Merrin, L.E.; Huang, C. Estimate of Flood Inundation and Retention on Wetlands Using Remote Sensing and GIS: Spatial modelling of flood inundation and retention on wetlends. Ecohydrol. 2014, 7, 1412–1420. [Google Scholar] [CrossRef]
  23. Casanova, M.T.; Brock, M.A. How Do Depth, Duration and Frequency of Flooding Influence the Establishment of Wetland Plant Communities? Plant Ecol. 2000, 147, 237–250. [Google Scholar] [CrossRef]
  24. Wilcox, D.A. Implications of Hydrologic Variability on the Succession of Plants in Great Lakes Wetlands. Aquat. Ecosyst. Health 2004, 7, 223–231. [Google Scholar] [CrossRef]
  25. Wang, G.; Wang, M.; Yuan, Y.; Lu, X.; Jiang, M. Effects of Sediment Load on the Seed Bank and Vegetation of Calamagrostis Angustifolia Wetland Community in the National Natural Wetland Reserve of Lake Xingkai, China. Ecol. Eng. 2014, 63, 27–33. [Google Scholar] [CrossRef]
  26. Dronova, I.; Gong, P.; Wang, L. Object-Based Analysis and Change Detection of Major Wetland Cover Types and Their Classification Uncertainty during the Low Water Period at Poyang Lake, China. Remote Sens. Environ. 2011, 115, 3220–3236. [Google Scholar] [CrossRef]
  27. Huang, C.; Peng, Y.; Lang, M.; Yeo, I.-Y.; McCarty, G. Wetland Inundation Mapping and Change Monitoring Using Landsat and Airborne LiDAR Data. Remote Sens. Environ. 2014, 141, 231–242. [Google Scholar] [CrossRef]
  28. Lang, M.W.; Bourgeau-Chavez, L.; Tiner, R.W.; Klemas, V.V. Advances in Remotely Sensed Data and Techniques for Wetland Mapping and Monitoring. In Remote Sensing of Wetlands: Applications and Advances; Tiner, R., Lang, M., Klemas, V., Eds.; CRC Press: Boca Raton, FL, USA, 2015; pp. 79–116. [Google Scholar] [CrossRef]
  29. Caballero, I.; Navarro, G.; Ruiz, J. Multi-Platform Assessment of Turbidity Plumes during Dredging Operations in a Major Estuarine System. Int. J. Appl. Earth Obs. 2018, 68, 31–41. [Google Scholar] [CrossRef]
  30. Sebastiá-Frasquet, M.-T.; Aguilar-Maldonado, J.A.; Santamaría-Del-Ángel, E.; Estornell, J. Sentinel 2 Analysis of Turbidity Patterns in a Coastal Lagoon. Remote Sens. 2019, 11, 2926. [Google Scholar] [CrossRef] [Green Version]
  31. Xia, H.; Zhao, J.; Qin, Y.; Yang, J.; Cui, Y.; Song, H.; Ma, L.; Jin, N.; Meng, Q. Changes in Water Surface Area during 1989–2017 in the Huai River Basin Using Landsat Data and Google Earth Engine. Remote Sens. 2019, 11, 1824. [Google Scholar] [CrossRef] [Green Version]
  32. USGS. Landsat Missions. Available online: https://www.usgs.gov/core-science-systems/nli/landsat/ (accessed on 4 October 2021).
  33. Jin, H.; Huang, C.; Lang, M.W.; Yeo, I.-Y.; Stehman, S.V. Monitoring of Wetland Inundation Dynamics in the Delmarva Peninsula Using Landsat Time-Series Imagery from 1985 to 2011. Remote Sens. Environ. 2017, 190, 26–41. [Google Scholar] [CrossRef] [Green Version]
  34. Na, X.; Zang, S.; Wu, C.; Tian, Y.; Li, W. Hydrological Regime Monitoring and Mapping of the Zhalong Wetland through Integrating Time Series Radarsat-2 and Landsat Imagery. Remote Sens. 2018, 10, 702. [Google Scholar] [CrossRef] [Green Version]
  35. Banerjee, B.P.; Raval, S.; Timms, W. Evaluation of Rainfall and Wetland Water Area Variability at Thirlmere Lakes Using Landsat Time-Series Data. Int. J. Environ. Sci. Technol. 2016, 13, 1781–1792. [Google Scholar] [CrossRef] [Green Version]
  36. Wang, C.; Jia, M.; Chen, N.; Wang, W. Long-Term Surface Water Dynamics Analysis Based on Landsat Imagery and the Google Earth Engine Platform: A Case Study in the Middle Yangtze River Basin. Remote Sens. 2018, 10, 1635. [Google Scholar] [CrossRef] [Green Version]
  37. Bhagwat, T.; Klein, I.; Huth, J.; Leinenkugel, P. Volumetric Analysis of Reservoirs in Drought-Prone Areas Using Remote Sensing Products. Remote Sens. 2019, 11, 1974. [Google Scholar] [CrossRef] [Green Version]
  38. Hayashi, M.; van der Kamp, G. Simple Equations to Represent the Volume–Area–Depth Relations of Shallow Wetlands in Small Topographic Depressions. J. Hydrol. 2000, 237, 74–85. [Google Scholar] [CrossRef]
  39. Minke, A.G.; Westbrook, C.J.; van der Kamp, G. Simplified Volume-Area-Depth Method for Estimating Water Storage of Prairie Potholes. Wetlands 2010, 30, 541–551. [Google Scholar] [CrossRef]
  40. Shen, X.; Wang, D.; Mao, K.; Anagnostou, E.; Hong, Y. Inundation Extent Mapping by Synthetic Aperture Radar: A Review. Remote Sens. 2019, 11, 879. [Google Scholar] [CrossRef] [Green Version]
  41. Ahmad, S.K.; Hossain, F.; Pavelsky, T.; Parkins, G.M.; Yelton, S.; Rodgers, M.; Little, S.; Haldar, D.; Ghafoor, S.; Khan, R.H.; et al. Understanding Volumetric Water Storage in Monsoonal Wetlands of Northeastern Bangladesh. Water Resour. Res. 2020, 56, e2020WR027989. [Google Scholar] [CrossRef]
  42. Cao, N.; Lee, H.; Jung, H.C.; Yu, H. Estimation of Water Level Changes of Large-Scale Amazon Wetlands Using ALOS2 ScanSAR Differential Interferometry. Remote Sens. 2018, 10, 966. [Google Scholar] [CrossRef] [Green Version]
  43. Schlaffer, S.; Chini, M.; Pöppl, R.; Hostache, R.; Matgen, P. Monitoring of Inundation Dynamics in the North-American Prairie Pothole Region Using Sentinel-1 Time Series. In Proceedings of the IGARSS 2018—2018 IEEE International Geoscience and Remote Sensing Symposium, Valencia, Spain, 22–27 July 2018; pp. 6588–6591. [Google Scholar]
  44. Bolin, B.; Rodhe, H. A Note on the Concepts of Age Distribution and Transit Time in Natural Reservoirs. Tellus 1973, 25, 58–62. [Google Scholar] [CrossRef]
  45. Strasškraba, M.; Hocking, G. The Effect of Theoretical Retention Time on the Hydrodynamics of Deep River Valley Reservoirs. Int. Rev. Hydrobiol. 2002, 87, 61–83. [Google Scholar] [CrossRef]
  46. Lucas, L.V.; Thompson, J.K.; Brown, L.R. Why Are Diverse Relationships Observed between Phytoplankton Biomass and Transport Time? Limnol. Oceanogr. 2009, 54, 381–390. [Google Scholar] [CrossRef]
  47. Moss, B. Ecology of Freshwaters. Man and Medium, Past to Future; John Wiley & Sons: Hoboken, NJ, USA, 1998. [Google Scholar]
  48. Beklioglu, M.; Romo, S.; Kagalou, I.; Quintana, X.; Bécares, E. State of the Art in the Functioning of Shallow Mediterranean Lakes: Workshop Conclusions. Hydrobiologia 2007, 584, 317–326. [Google Scholar] [CrossRef]
  49. Mooij, W.M.; Janse, J.; Domis, L.D.S.; Hülsmann, S.; Ibelings, B.W. Predicting the effect of climate change on temperate shallow lakes with the ecosystem model PCLake. In Shallow Lakes in a Changing World; Springer: Dodrecht, The Netherlands, 2007; pp. 443–454. [Google Scholar]
  50. Gallagher, B.; Shimada, K.; Gonzalez, F., Jr.; Stroup, E. Tides and Currents in Fanning Atoll Lagoon. Pac. Sci. 1971, 25, 191–205. Available online: https://scholarspace.manoa.hawaii.edu/bitstream/10125/4223/vol25n2-191-205.pdf (accessed on 10 September 2021).
  51. Smith, S.; Jokiel, P. Water Composition and Biogeochemical Gradients in the Canton Atoll Lagoon. In An Environmental Survey of Canton Atoll Lagoon; Naval Undersea Research and Development Center: San Diego, CA, USA, 1976; pp. 15–53. [Google Scholar]
  52. Pilotti, M.; Simoncelli, S.; Valerio, G. A Simple Approach to the Evaluation of the Actual Water Renewal Time of Natural Stratified Lakes. Water Resour. Res. 2014, 50, 2830–2849. [Google Scholar] [CrossRef]
  53. Bezzegh, M.; LeRoy, H.; Steiner, K. Tritium distribution, mixing and age structure of water masses in lake of Lucerne. Swiss J. Hydrol. 1978, 39, 201–225. [Google Scholar]
  54. Michel, R.L.; Kraemer, T.F. Use of Isotopic Data to Estimate Water Residence Times of the Finger Lakes, New York. J. Hydrol. 1995, 164, 1–18. [Google Scholar] [CrossRef]
  55. Aeschbach-Hertig, W.; Holzner, C.P.; Hofer, M.; Simona, M.; Barbieri, A.; Kipfer, R. A Time Series of Environmental Tracer Data from Deep Meromictic Lake Lugano, Switzerland. Limnol. Oceanogr. 2007, 52, 257–273. [Google Scholar] [CrossRef] [Green Version]
  56. García-Oliva, M.; Pérez-Ruzafa, Á.; Umgiesser, G.; McKiver, W.; Ghezzo, M.; De Pascalis, F.; Marcos, C. Assessing the Hydrodynamic Response of the Mar Menor Lagoon to Dredging Inlets Interventions through Numerical Modelling. Water 2018, 10, 959. [Google Scholar] [CrossRef] [Green Version]
  57. Cheng, Y.; Mu, Z.; Wang, H.; Zhao, F.; Li, Y.; Lin, L. Water Residence Time in a Typical Tributary Bay of the Three Gorges Reservoir. Water 2019, 11, 1585. [Google Scholar] [CrossRef] [Green Version]
  58. Huguet, J.-R.; Brenon, I.; Coulombier, T. Characterisation of the Water Renewal in a Macro-Tidal Marina Using Several Transport Timescales. Water 2019, 11, 2050. [Google Scholar] [CrossRef] [Green Version]
  59. Alonso, M.J.C.; Barbero, R.E.; Henar, T.V. Seguimiento Por Teledetección de La Superficie Inundada En Otoño-Invierno En La Zona de Cultivo de Arroz En La Albufera de Valencia. In Proceedings of the XI Congreso Nacional de Teledetección, Puerto de la Cruz, Tenerife, 21–23 September 2005; pp. 21–23. Available online: http://dns2.aet.org.es/congresos/xi/ten89.pdf (accessed on 10 September 2021). (In Spanish).
  60. Cavallo, C.; Papa, M.N.; Gargiulo, M.; Palau-Salvador, G.; Vezza, P.; Ruello, G. Continuous Monitoring of the Flooding Dynamics in the Albufera Wetland (Spain) by Landsat-8 and Sentinel-2 Datasets. Remote Sens. 2021, 13, 3525. [Google Scholar] [CrossRef]
  61. Soria, J.; Vicente, E.; Miracle, M. The Influence of Flash Floods on the Limnology of the Albufera of Valencia Lagoon (Spain). In SIL Proceedings 1922–2010; Informa UK Limited: Stuttgart, Germany, 2000; Volume 27, pp. 2232–2235. [Google Scholar] [CrossRef]
  62. Romo, S.; Soria, J.; Fernández, F.; Ouahid, Y.; Barón-Solá, Á. Water Residence Time and the Dynamics of Toxic Cyanobacteria. Freshw. Biol. 2013, 58, 513–522. [Google Scholar] [CrossRef]
  63. Sòria-Perpinyà, X.; Miracle, M.R.; Soria, J.; Delegido, J.; Vicente, E. Remote sensing application for the study of rapid flushing to remediate eutrophication in shallow lagoons (Albufera of Valencia). Hydrobiologia 2019, 829, 125–132. [Google Scholar] [CrossRef]
  64. Soria, J.; Vera-Herrera, L.; Calvo, S.; Romo, S.; Vicente, E.; Sahuquillo, M.; Sòria-Perpinyà, X. Residence Time Analysis in the Albufera of Valencia, a Mediterranean Coastal Lagoon, Spain. Hydrology 2021, 8, 37. [Google Scholar] [CrossRef]
  65. Generalitat Valenciana Parc Natural de L´Albufera. Available online: http://parquesnaturales.gva.es/ (accessed on 10 January 2021).
  66. Soria, J.M. Past, Present and Future of La Albufera of Valencia Natural Park. Limnetica 2006, 25, 135–142. [Google Scholar]
  67. Jégou, A.; Sanchis-Ibor, C. The Opaque Lagoon. Water Management and Governance in l’Albufera de València Wetland (Spain). Limnetica 2019, 38, 503–515. [Google Scholar] [CrossRef]
  68. Vicente, E.; Miracle, M.R. The Coastal Lagoon Albufera de Valencia: An Ecosystem under Stress. Limnetica 1992, 8, 87–100. Available online: http://www.limnetica.com/documentos/limnetica/limnetica-8-1-p-87.pdf (accessed on 10 September 2021).
  69. Romo, S.; Villena, M.; Sahuquillo, M.; Soria, J.M.; Gimenez, M.; Alfonso, T.; Vicente, E.; Miracle, M.R. Response of a Shallow Mediterranean Lake to Nutrient Diversion: Does It Follow Similar Patterns as in Northern Shallow Lakes? Freshw. Biol. 2005, 50, 1706–1717. [Google Scholar] [CrossRef]
  70. Roselló, V.M. Els Espais Albuferencs Del País Valencià. Acta Geol. Hisp. 1979, 14, 487–493. [Google Scholar]
  71. Miracle, M.R.; Sahuquillo, M. Changes of Life-History Traits and Size in Daphnia Magna during a Clear-Water Phase in a Hypertrophic Lagoon (Albufera of Valencia, Spain). Int. Ver. Für Theor. Und Angew. Limnol. Verh. 2002, 28, 1203–1208. [Google Scholar] [CrossRef]
  72. Fisher, H.B. Transport Models for Inland and Coastal Waters; Academic Press: London, UK, 1981. [Google Scholar]
  73. Soria, J.M.; Vicente, E. Estudio de los aportes hídricos al parque natural de la Albufera de Valencia. Limnetica 2002, 21, 105–115. [Google Scholar]
  74. AVAMET Meteorological Historical Database. Available online: https://www.avamet.org/ (accessed on 10 March 2021).
  75. Hammer, Ø.; Harper, D.A.; Ryan, P.D. PAST: Paleontological Statistics Software Package for Education and Data Analysis. Palaeontol. Electr. 2001, 4, 9. [Google Scholar]
  76. Lu, S.; Ouyang, N.; Wu, B.; Wei, Y.; Tesemma, Z. Lake Water Volume Calculation with Time Series Remote-Sensing Images. Int. J. Remote Sens. 2013, 34, 7962–7973. [Google Scholar] [CrossRef]
  77. Serra, P.; Moré, G.; Pons, X. Monitoring Winter Flooding of Rice Fields on the Coastal Wetland of Ebre Delta with Multitemporal Remote Sensing Images. In Proceedings of the IEEE International Geoscience and Remote Sensing Symposium (IGARSS 2007), Barcelona, Spain, 23–28 July 2007; pp. 2495–2498. [Google Scholar]
  78. Moré, G.; Serra, P.; Pons, X. Multitemporal Flooding Dynamics of Rice Fields by Means of Discriminant Analysis of Radiometrically Corrected Remote Sensing Imagery. Int. J. Remote Sens. 2011, 32, 1983–2011. [Google Scholar] [CrossRef]
  79. Chen, C.; Son, N.; Chen, C.; Chang, L.; Chiang, S. Rice Crop Mapping Using Sentinel-1A Phenological Metrics. In Proceedings of the International International Archives of the Photogrammetry, Remote Sensing and Spatial Information Sciences, 2016 XXIII ISPRS Congress, Prague, Czech Republic, 12–19 July 2016; Volume XLI-B8, pp. 863–865. [Google Scholar]
  80. Wei, P.; Chai, D.; Lin, T.; Tang, C.; Du, M.; Huang, J. Large-Scale Rice Mapping under Different Years Based on Time-Series Sentinel-1 Images Using Deep Semantic Segmentation Model. ISPRS J. Photogramm. Remote Sens. 2021, 174, 198–214. [Google Scholar] [CrossRef]
  81. Gao, X.; Xu, L.; Zhang, C. Estimating Renewal Timescales with Residence Time and Connectivity in an Urban Man-Made Lake in China. Environ. Sci. Pollut. Res. 2016, 23, 13973–13983. [Google Scholar] [CrossRef]
  82. Cucco, A.; Umgiesser, G. Modeling the Venice Lagoon Residence Time. Ecol. Model. 2006, 193, 34–51. [Google Scholar] [CrossRef]
Figure 1. Study area with the limit of the Natural Park of Albufera, the area of Albufera Lake, the drainage area of rice fields (winter flooding area), the 19 points were the inflows to the lagoon was measured and the three outlet channels.
Hydrology 08 00172 g001
Figure 2. Mathematical adjustment between the 47 water level measurements taken in the rice fields during the winter flooding and the pixel values obtained with the NDWI index.
Hydrology 08 00172 g002
Figure 3. Landsat images from 2006, 2010, 2017 and 2020, corrected and processed by the NDWI index, selected as examples of the seasonal changes taking place in the Natural Park of Albufera. The colors are indicative of the estimated water level derived from the adapted algorithm.
Hydrology 08 00172 g003
Figure 4. Seasonal changes in flooded area and water volume in rice fields (2006–2020) and residence times of the Albufera Lake (2006–2017) are showed in box-plots with median, percentiles and outlier values, together with the studied phases of the rice cultivation cycle developed in the Natural Park of Albufera.
Hydrology 08 00172 g004
Figure 5. (a) Comparison of Landsat-derived average flooded area and water volume values in the rice fields of the Natural Park of Albufera together with water level values obtained during the winter flooding periods studied (from November to February); (b) Annual monitoring of the rice cultivation period in the Natural Park of Albufera using the average values of cultivated area and volume of water obtained from the processed Landsat images corresponding to the months of July and August.
Hydrology 08 00172 g005
Figure 6. Total inflow to the Albufera Lake recorded on each of the sampling dates between the periods 2010–2011 and 2016–2017 together with some indications about rice cultivation and field condition considered relevant.
Hydrology 08 00172 g006
Figure 7. Mean, minimum and maximum values of residence time of the entire Albufera Lake recorded from January to December during 2006, 2007, 2008, 2010 and 2011, and from May 2016 to April 2017.
Hydrology 08 00172 g007
Table 1. Average lake inflows and water origin for the main canals of the Natural Park of Albufera, measured in 2010, 2011 and 2016–2017.
CodeCanalsWater OriginAverage Lake Inflow
(m3 s−1)
201020112016–2017
A2Carrera del SalerIrrigation and SWTP *1.5671.8961.670
A6RavisanxoIrrigation and waste0.4160.2200.141
A10Barranc PoyoSpring and waste0.4390.4110.130
A47AlqueresiaIrrigation, waste and SWTP0.5940.8030.511
A50CampetsJucar River and irrigation0.4580.2240.374
A64OveraJucar River and irrigation1.5231.5841.715
A54DretaJucar River, springs and irrigation0.6990.5090.747
A55Reina VellaJucar River and irrigation0.3800.4210.571
A56Reina NovaJucar River and irrigation−0.1000.4030.631
* SWTP: Sewage Water Treatment Plant.
Table 2. Mean, standard error, maximum and minimum values of the residence times of the Albufera Lake for the different hydrological cycle phases established (data from 2006–2017).
Hydrological Cycle PhasesResidence Time (Day) during 2006–2017
MeanSEMaximumMinimum
Rice field drainage
(February–March)
113.441.6829.510.4
Soil treatment and rice sowing
(April–June)
152.946.5653.217.6
Rice growth and harvesting
(July–September)
222.271.4823.16.7
Winter flooding
(October–January)
214.077.9852.322.2
Publisher’s Note: MDPI stays neutral with regard to jurisdictional claims in published maps and institutional affiliations.

