Article

Tropical Convection in the Caribbean and Surrounding Region during a Regional, Warming Sea-Surface Temperature Period, 1982–2020

1
NOAA-CESSRST, The City College of New York, 140 Convent Ave., New York, NY 10031, USA
2
NOAA/STAR/SCSB and CISESS/ESSIC, University of Maryland, 5825 University Research CT, Ste 4001, College Park, MD 20740, USA
3
Systems Research Group Inc., NOAA/NWS/NCEP/Weather Prediction Center, NOAA Center for Weather and Climate Prediction, 5830 University Research CT, College Park, MD 20740, USA
4
NOAA/NWS/NCEP/Weather Prediction Center, NOAA Center for Weather and Climate Prediction, 5830 University Research CT, College Park, MD 20740, USA
5
Mechanical Engineering, The City College of New York, 140 Convent Ave., New York, NY 10031, USA
*
Authors to whom correspondence should be addressed.
Hydrology 2021, 8(2), 56; https://doi.org/10.3390/hydrology8020056
Submission received: 28 February 2021 / Revised: 18 March 2021 / Accepted: 19 March 2021 / Published: 24 March 2021
(This article belongs to the Special Issue Hydrology in the Caribbean Basin)

Abstract

:
Warming sea-surface temperatures (SSTs) have implications for the climate-sensitive Caribbean region, including potential impacts on precipitation. SSTs have been shown to influence deep convection and rainfall, thus understanding the impacts of warming SSTs is important for predicting regional hydrometeorological conditions. This study investigates the long-term annual and seasonal trends in convection using the Galvez-Davison Index (GDI) for tropical convection from 1982–2020. The GDI is used to describe the type and potential for precipitation events characterized by sub-indices that represent heat and moisture availability, cool/warm mid-levels at 500 hPa, and subsidence inversion, which drive the regional Late, Early, and Dry Rainfall Seasons, respectively. Results show that regional SSTs are warming annually and per season, while regionally averaged GDI values are decreasing annually and for the Dry Season. Spatial analyses show the GDI demonstrates higher, statistically significant correlations with precipitation across the region than with sea-surface temperatures, annually and per season. Moreover, the GDI climatology results show that regional convection exhibits a bimodal pattern resembling the characteristic bimodal precipitation pattern experienced in many parts of the Caribbean and surrounding region. However, the drivers of these conditions need further investigation as SSTs continue to rise while the region experiences a drying trend.

1. Introduction

The Caribbean and surrounding region is particularly vulnerable to impacts of global climate changes [1,2,3,4,5]. The National Oceanic and Atmospheric Administration (NOAA) reports that global land and ocean temperatures have been increasing since the early 1900s [6]. Moreover, sea-surfaces temperatures (SSTs) have been consistently warmer within the past several decades (since the 1980s) compared to any time on record [6]. Warming SSTs have many implications for the climate-sensitive Caribbean region, including potential impacts on precipitation and moisture transport [7,8,9,10,11]. SST is a key integrative variable for modulating atmospheric processes and is correlated with region specific climate phenomena, such as the Caribbean Low-Level Jet (CLLJ) and the Atlantic Warm Pool (AWP), which have also been shown to influence regional precipitation [9,12,13,14,15,16].
Historical climate analyses have shown a consistent increasing trend in Caribbean SSTs over extended and recent years. Antuna et al. [17] found statistically significant increases between 1906 and 2005, while most recently, Glenn et al.’s [18] examination of the broader Caribbean shows annual regional increases at a rate of 0.15 C per decade between 1982 and 2012. The Early Rainfall Season (ERS, April–June) and the Late Rainfall Season (LRS, August–November) reflect estimated trends at 0.1 °C per decade and 0.2 °C per decade, respectively. SSTs have been shown to influence deep convection and rainfall; thus, understanding the impacts of warming SSTs is important for predicting hydrometeorological conditions in this region [19].
For the Caribbean, convection is a primary driver of precipitation. Studies show that deep convection increases significantly when SSTs exceed 27 to 28 °C [20,21,22]. In addition to weakening vertical wind shear (≤8 m/s), Caribbean rainfall becomes enhanced once the Main Developing Region (MDR) and Tropical North Atlantic (TNA) (Figure 1) are warmer and SSTs are above the convection threshold of 26.5 °C [23]. Moreover, studies have shown that rainfall dependency could increase by a factor as high as 5 when SSTs increase from 26 °C to 29 °C [24]. Conversely, Waliser et al. [25] observed that when SSTs were below 26.5 °C, there was little variance with the amount of rainfall as a function of SSTs. The influence of relevant teleconnections, such as El Niño Southern Oscillation (ENSO) and the North Atlantic Oscillation (NAO), can be highly variable. While ENSO and the NAO have some influence on precipitation in the Caribbean, the effects vary across the region, as well as per season, and lack persistence and stability depending on the magnitude of the event [26,27,28,29,30].
The objective of this study is to report on convection trends during the SST warming period using an analysis of SST trends through 2020 for the Caribbean and surrounding region (Figure 1). This study also aims to identify whether significant trends can be detected for convection relevant conditions characterized by the Gálvez–Davison Index (GDI) for Tropical Convection. The need to quantify regional effects on precipitation is significant, as extreme precipitation variations, especially drying trends, may have major socioeconomic impacts in the region [4]. Moreover, a drying trend has been reported as a potential outcome of the global warming scenario according to the Intergovernmental Panel on Climate Change (IPCC) [3] and future climate projections as reported by Taylor et al. [31] and Campbell et al. [32].

2. Data and Methods

Analysis of historical SSTs, conditions favorable for moist convection, and precipitation climatology was performed for the Caribbean and surrounding region for the 1982–2020 period using satellite and reanalysis data. The data used are SSTs, air temperature, relative humidity, and precipitation and are provided by the NOAA/Oceanic and Atmospheric Research/Earth System Research Laboratories/Physical Sciences Division (NOAA/OAR/ESRL/PSD) from their website at http://www.esrl.noaa.gov/psd/ accessed on 28 January 2021 (see Data Availability) [33,34,35,36,37]. MATLAB was used for data analysis and data visualization. Additionally, a list of acronyms is provided in Table 1.
The SST dataset is the 1/4° daily NOAA High Resolution Optimum Interpolation (OI) Sea Surface Temperature v2.1 data, which uses satellite data combined with in-situ observations [33]. Environmental conditions related to moist convection were characterized using the GDI, which requires air temperature and relative humidity measurements at 500, 700, 850, and 925 hPa (or 950 based on availability) as input [34]. The National Centers for Environmental Prediction/National Center for Atmospheric Research (NCEP/NCAR) Reanalysis 1 data were selected for both air temperature and relative humidity, available as monthly averages at 2.5° resolution [35]. For regional precipitation climatology calculations, the Global Precipitation Climatology Project (GPCP) precipitation dataset was selected. The GPCP dataset combines observations and satellite precipitation data into 2.5° × 2.5° global grids and provides mean monthly rainfall rates (in mm) [36].
The Caribbean seasons for this analysis are designated as the Early Rainfall Season (ERS, April–June), the Late Rainfall Season (LRS, August–November), and the Dry Season (DS, December–March). On average, the region experiences a wet season from April to November. However, the wet season follows a bimodal pattern that defines the characteristic Caribbean rainy seasons [9,37,38,39,40]. The bimodal pattern of Caribbean region rainfall is due to the Mid-Summer Drought (MSD). The Caribbean MSD is described as a period of relatively low precipitation that occurs from late June through early August. From a regional perspective, July represents the average period in which rainfall markedly decreases during the summer; however, this phenomenon begins in June in the eastern Caribbean and shifts westward across the basin through July [9,40,41,42]. Therefore, for this analysis July is not included due to the significant decrease in precipitation during this month from a regional perspective.

2.1. Trend Analysis

The Mann–Kendall test (MK test) is a ranked based non-parametric test for trends [43,44]. The MK test was selected because the study involves large and highly variable data sets. This test was applied per-grid and to regional average values for the annual, early rainfall, late rainfall, and dry season scenarios. The trends and the associated p-values (significance) were calculated for SSTs and the GDI from 1982–2020. Similar to linear regression, trend values were determined to be statistically significant if the calculated p-value was less than 0.05 (95% test level). The Mann–Kendall test assumes independence between observations. Additionally, this test is not dependent on the magnitude of the data, assumptions of distribution, missing data, or the regularity of monitoring periods. Although the MK test is used in many studies for detection of trends in hydrological time series, there are some caveats regarding the power of the test based on the pre-assigned significance level, magnitude of the trend, sample size, and the amount of variation in the time series [45,46,47,48,49,50].

2.2. Galvez–Davidson Index (GDI) for Tropical Convection

For the analysis of moist convection, the GDI is used to characterize regional patterns and the environment that could be favorable (or unfavorable) for convection to develop. The GDI was specifically designed to diagnose the environment suitable for different types of moist convection in the tropics and subtropics. When used in forecasting, the GDI generally outperforms other indices such as the K, Lifted, Convective Available Potential Energy (CAPE), and Total-Totals on determining the potential for shallow or deep convection [34].
The index was validated over the Caribbean Basin and South America. It is computed using three main sub-indices that characterize three physical processes that modulate tropical convection [34]:
  • Column Buoyancy Index (CBI)—availability of heat and moisture in the low and mid troposphere;
  • Mid-level Warming Index (MWI)—stabilizing/destabilizing effects of mid-level ridges/troughs at 500 hPa;
  • Inversion Index (II)—the entrainment of dry air and stabilization associated with inversions.
Additionally, there is another subindex, the Terrain Correction (TC), that is optional and not considered here. The GDI is calculated using the following equation:
GDI = CBI + MWI + II
The CBI describes the availability of heat and moisture in the column. The MWI characterizes stability based on warm (cool) temperatures at 500hPa. If the mid-troposphere is relatively warm (cool), there is less (more) of a vertical temperature gradient and the underlying layer is more stable (unstable). The II captures the processes that inhibit trade wind convection, regarding stabilization by the trade wind inversion, and dry air entrainment when convection is able to grow beyond the boundary layer [34]. Thus, the CBI represents an enhancement factor favorable for deep convection, whereas the MWI and II act as dampening factors.
The GDI is computed using air temperature and mixing ratio ratios at 500, 700, 850, and 950 hPa. Data was not readily available for the 950 hPa height from NCEP/NCAR; on consultation with Gálvez and Davison it was determined that the 925 hPa height offered a viable alternative. A summary of GDI values and their associated convective regimes are shown in Table 2 [34]. The complete methodology to calculate the GDI and details on validation are provided by the NOAA Weather Prediction Center/International Desks, College Park, MD available at https://www.wpc.ncep.noaa.gov/international/gdi/, accessed on 28 January 2021.

2.3. Correlation Analysis

Correlation analysis was applied to characterize the relationship between the SST and GDI time series through convection index correlations. Precipitation time series per point were also correlated with convection for the same latitude/longitude location. The precipitation correlations with the GDI are included for comparison to SST correlations with the GDI. Additionally, each correlation was tested for statistical significance at the 95% test level.

3. Results

3.1. Trend Analysis Results

Rising and statistically significant trends for SSTs were observed for annual, ERS, LRS, and DS scenarios illustrated in Figure 2, with p-values listed in Table 3. Additionally, as SSTs have continued to increase, the warmest conditions have consistently occurred during the latter half of the period (2000 to 2020). SSTs have remained above the 1982–2020 average even in the absence of strong ENSO events. In 2017, an ENSO neutral year, the region experienced very high average SSTs for the year. Figure 3 illustrates anomalies for annual and LRS SSTs. Results show that late rainfall season SSTs have remained anomalously warm since 2002. As seen from the SST anomalies (Figure 3), the warmest temperatures occurred during the latter half of the study period. Figure 4 shows the spatial representation of average LRS SSTs for the early half (1982–2000) and latter half (2001–2020) of the period. The latter period shows that average SSTs have not only increased but are more widespread throughout the region. The plot in Figure 4 shows that the regional area of SSTs that are greater than 27 °C has increased over time.

3.2. Gálvez–Davison Index (GDI) for Tropical Convection Results

Regional climatology results show that the GDI exhibits a bimodal pattern similar to the characteristic bimodal precipitation pattern experienced in the Caribbean and surrounding region, seen in Figure 5. This is an interesting finding given the apparent independence of the variables. Additionally, the climatology for heat and moisture (CBI) is also bimodal as the annual precipitation cycle in this region is dependent on heat and moisture availability. The climatology results for each sub-index (CBI, MWI, and II) are shown in Figure 6.
Regionally averaged annual trends for the GDI and each sub-index were calculated, shown in Figure 7, with p-values listed in Table 4. Results show the GDI is slightly decreasing over time, while the CBI, MWI, and II are gaining intensity. For example, the annual CBI trend shows an increase, thus reflecting an increase in heat and moisture in the region. However, the MWI and II are also intensifying. Since these are dampening factors, they are represented with negative values. Therefore, these sub-indices becoming more negative represent an intensification of their effects, i.e., a potentially more stable atmosphere and hostile to development. For annual trends, only the CBI, MWI, and II were determined to be statistically significant.
Trends per grid for each season were also calculated, shown in Figure 8. Additionally, the p-values for the regionally averaged values are listed in Table 5. The GDI shows increasing trends for the ERS and LRS, and a statistically significant decreasing trend for the DS. However, all sub-indices reflect increasing trends for all seasons. Although the CBI, the enhancement factor that favors deep convection conditions, shows an increase, the MWI and II also increase in magnitude (they are becoming more negative).

3.3. Correlation Analysis Results

The regional GDI shows a higher correlation with precipitation compared to SSTs. Table 6 summarizes the results for each season. Additionally, precipitation time series show relatively high, positive correlations with convection indices throughout the region (not shown). The GDI calculations are consistent with the pronounced role of cold upper troughs in ERS precipitation and the role of the trade wind inversion during the DS. Additionally, precipitation has a lower correlation during the LRS since processes such as warm convective processes and latent heat driven processes intervene in the variability of precipitation. Note that these results are based on the GPCP data at 2.5° resolution and do not capture local conditions.
Additionally, correlations between SSTs and GDI indices were examined. As seen in Table 7, statistically significant, high correlations are observed between SSTs and GDI sub-indices. The positive CBI correlations suggest that when SSTs increase, heat and moisture availability also increase (and vice versa). Conversely, for the MWI and II, results suggest that if SSTs increase (decrease) these dampening factors become less (more) prominent.

4. Discussion

The Caribbean and surrounding region continues to reflect a warming trend since those last reported by Glenn et al. [14] and more recently by The Climate Studies Group of UW-Mona [51]. The LRS, the season when SSTs are warmest for this region, is warming at a faster rate than other seasons. Increases in SSTs during the LRS are of particular importance because temperatures during this season reach 26.5 °C and above, which is the threshold generally considered for deep convection. Moreover, convection intensity rapidly increases when SSTs increase from 26.5 to 29.5 °C and the LRS reflects an increase in the size and presence of SSTs that reach this favorable range.
A high value for GDI suggests a higher potential for deeper convection and associated heavier precipitation (see Table 1), while results for the individual sub-indices provide an insight into the main driving conditions for precipitation per season. The CBI is an enhancement factor for convection activity associated with precipitation, while the MWI and II are dampening factors. Results show the GDI is highest during the ERS (April to June), suggesting that from a regional perspective this season has the highest potential for deep convective development. However, the LRS (August to November) experiences the most accumulated precipitation, although it has a slightly lower GDI than that of the ERS. This could be due to the MWI being more negative during the ERS. This indicates that precipitation in the LRS is mostly driven by heat and moisture availability (CBI), while the ERS convection is sensitive to 500 hPa instability associated with cold core upper-level troughs (MWI). This is consistent with the climatology of the Caribbean mid-troposphere. The DS (December to March) is dominated by both dampening factors, experiencing a combination of less moisture available and a more stable atmosphere observed though the plots of CBI and II. These two sub-indices overwhelm the less negative values of MWI, which are usually related to a cooler and less stable mid-troposphere.
A decreasing trend in GDI (convection potential) suggests lower potential for deep convection. This is observed to a large extent in the case of ERS and DS when examining the spatial distribution of trends illustrated in Figure 8. This is particularly true for the eastern Caribbean and the Gulf of Mexico in the ERS and DS, and for the Lesser Antilles, northern South America, and northwest Caribbean/Bahamas during the DS. This is demonstrated at the local scale by Mote et al. [52], who report the link between anomalously low GDI values and reduced ERS rainfall during a 2015 drought event in Puerto Rico. Additionally, the Climate Studies Group Mona [51] report increases in the number of consecutive dry days between rainfall events, the amount of rainfall that occurs during a rainfall event, monthly maximum 1-day rainfall amount, and monthly maximum consecutive 5-day rainfall amounts for the region on average. Although the regional trends in CBI (heat and moisture) show an increase, the MWI and II are also increasing in magnitude (they are becoming more negative). This suggests that the dampening factors are dominating the effect of the increasing heat and moisture conditions.

5. Conclusions

A warming trend of sea-surface temperatures (SSTs) has been observed in the Caribbean and its surrounding region for the past 39-years (1982–2020), which could have potential implications for convection and precipitation variability within the region. In this research, long-term trends in convection were analyzed using the Galvez-Davidson Index (GDI) for Tropical Convection. Climatology analyses reveal that convection follows the characteristic bimodal pattern of rainfall in the Caribbean and surrounding region. Additionally, results highlight the atmospheric conditions that modulate convection during seasons. These are large heat/moisture availability during the LRS, low heat/moisture availability and the effects of stronger trade wind inversions in the DS, and enhancement by mid-level troughs during the ERS. Furthermore, relatively high correlations between precipitation time series and decreasing convection potential are observed throughout the region.
Statistically significant correlations between the GDI and precipitation show that the bimodal precipitation pattern is modulated primarily by heat and moisture availability. Because warmer SSTs influence tropical convection, this warrants the need to further investigate why the region is becoming dryer when warmer SSTs and ensuing latent heat content should be promoting favorable conditions for more rainfall. The tight relation between GDI and precipitation trends suggests that future studies should focus on exploring the role of changing atmospheric dynamics as the potential cause of the opposite trend found between SSTs and precipitation.

Author Contributions

Conceptualization, E.G. and J.E.G.; Data curation, E.G.; Formal analysis, E.G.; Funding acquisition, J.E.G.; Investigation, E.G. and K.H.; Methodology, E.G., T.M.S., J.M.G., M.D. and J.E.G.; Resources, J.E.G.; Supervision, T.M.S. and J.E.G.; Validation, J.M.G. and M.D.; Visualization, E.G. and K.H.; Writing—original draft, E.G., T.M.S. and K.H.; Writing—review and editing, E.G., T.M.S., J.M.G., M.D., K.H. and J.E.G. All authors have read and agreed to the published version of the manuscript.
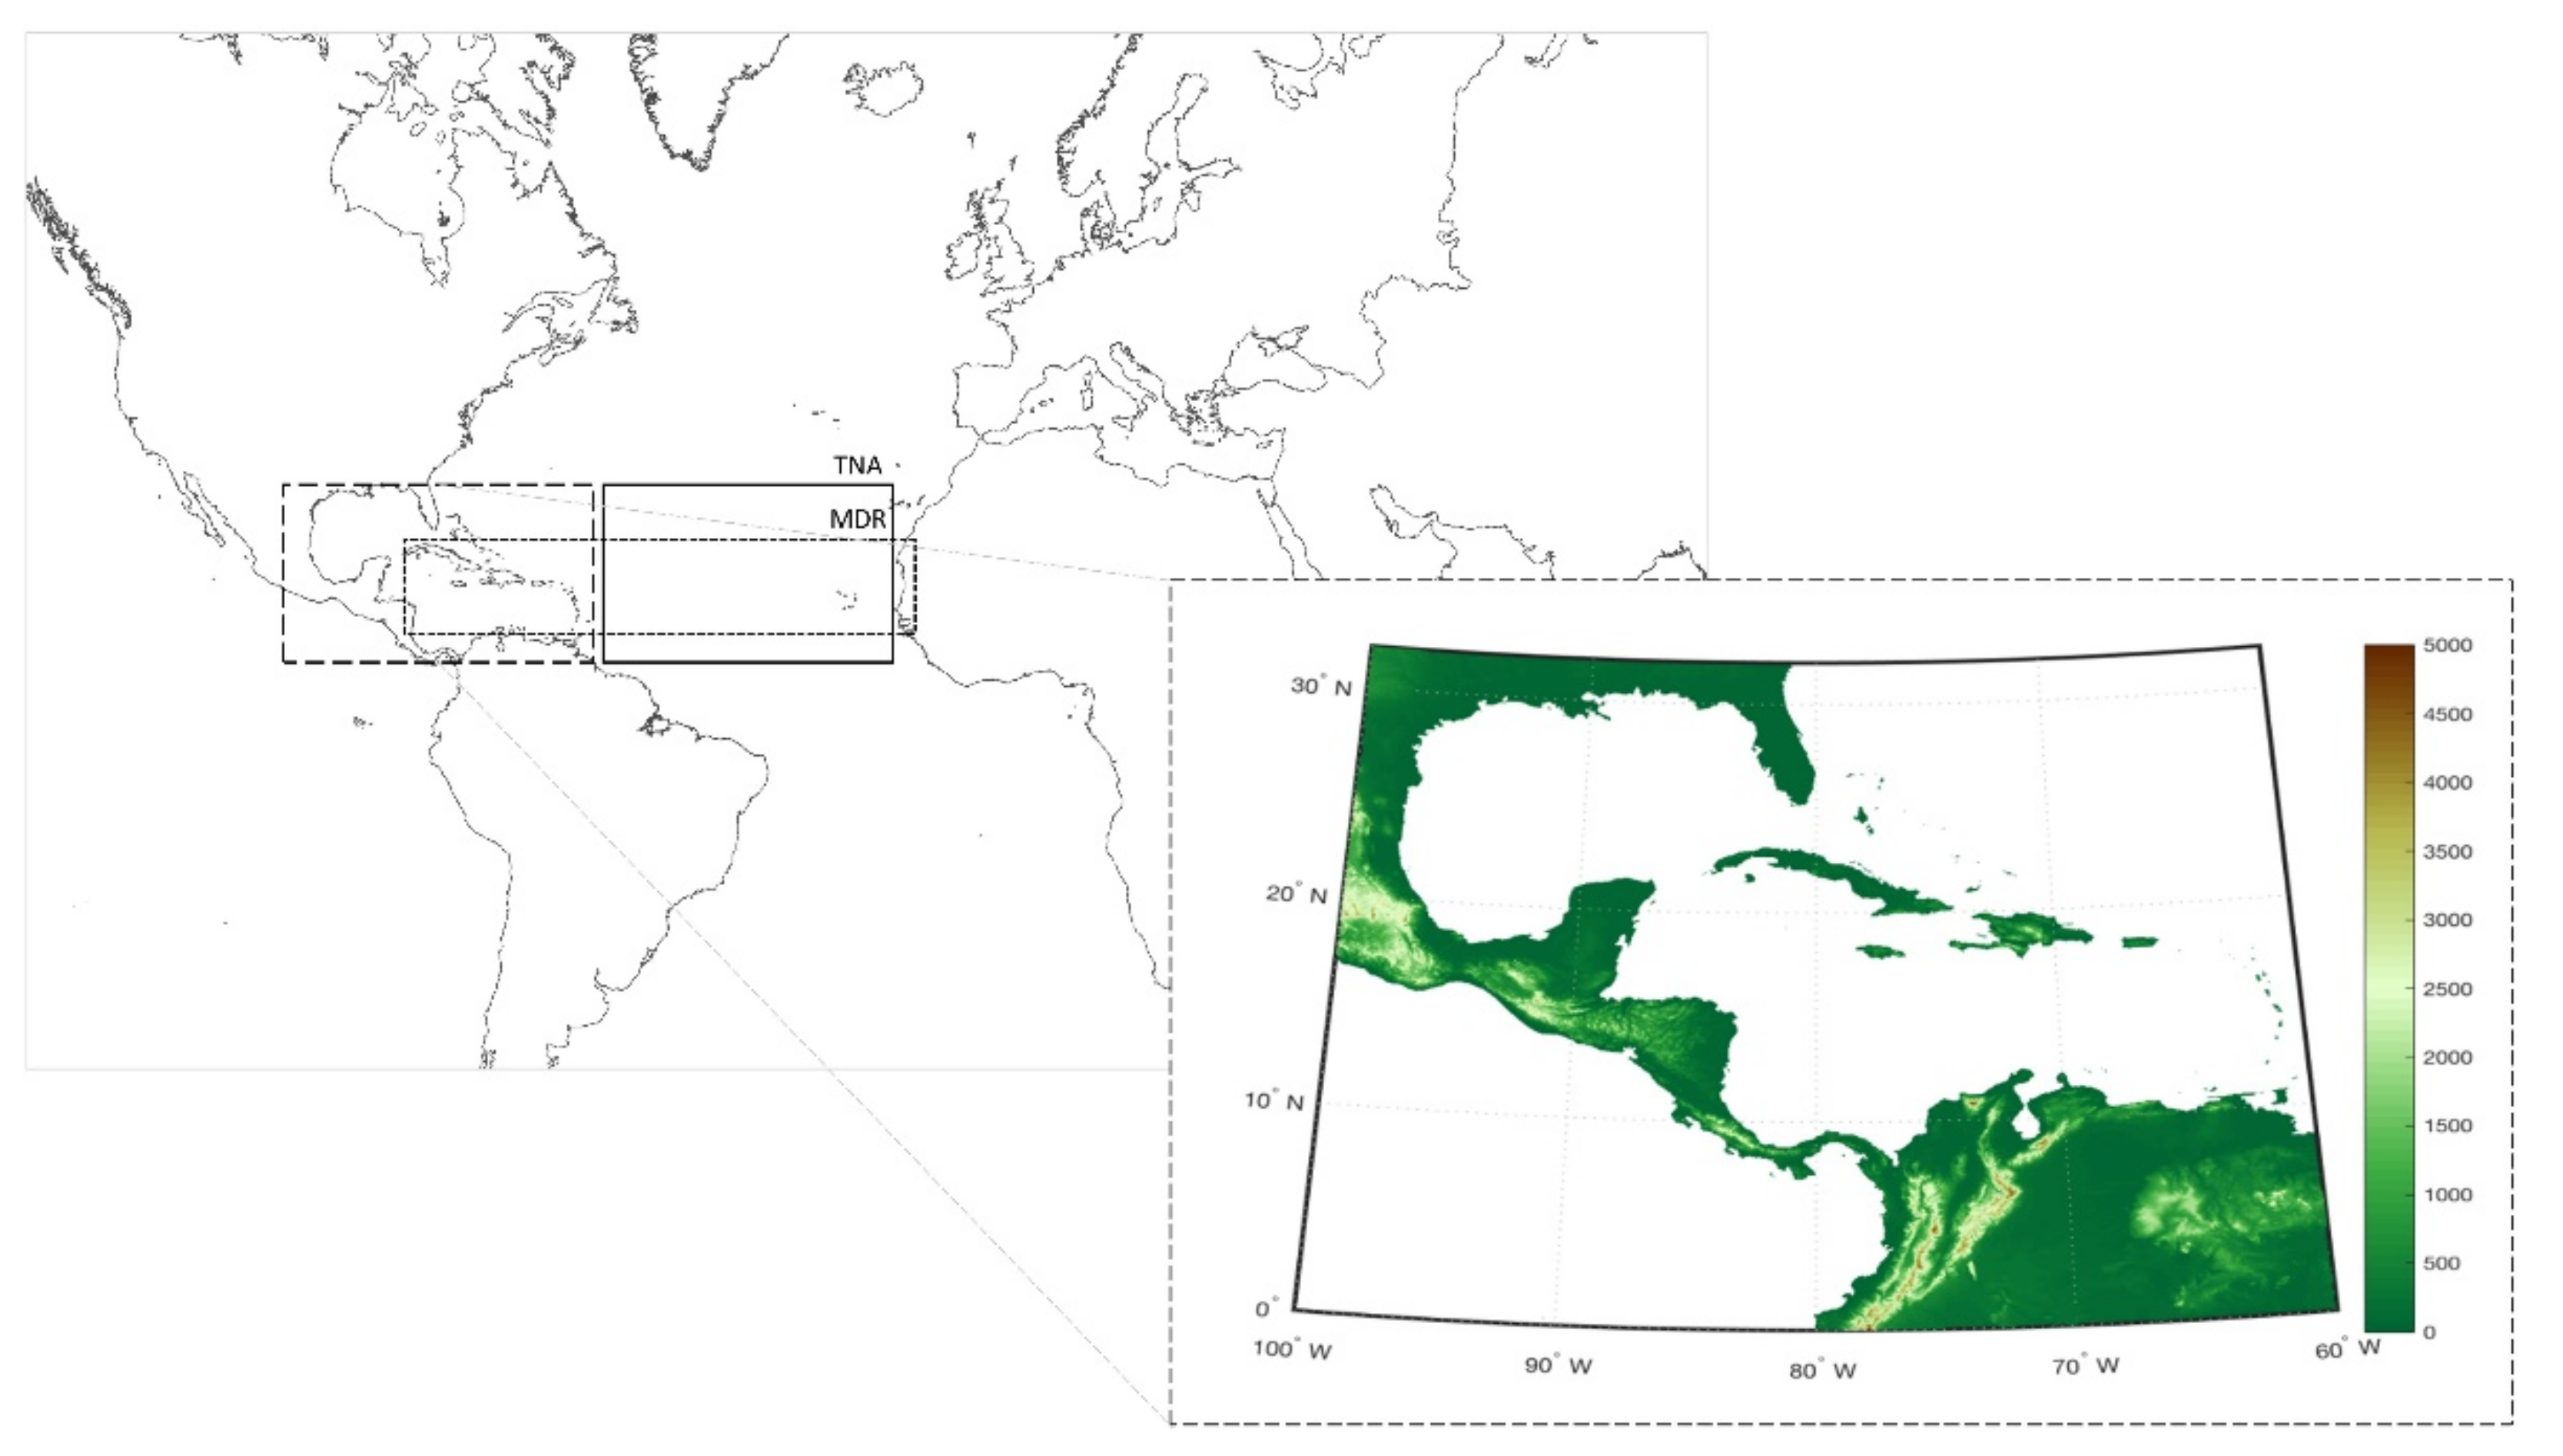
Funding

This publication was supported through NOAA Educational Partnership Program/Minority-Serving Institutions award number NA16SEC4810008 to the Center for Earth System Sciences and Remote Sensing Technologies (CESSRST) at The City College of New York (CCNY). Contents are solely the responsibility of the author(s) and may not represent official views of NOAA or the U.S. Department of Commerce.

Data Availability Statement

NOAA High Resolution SST data is provided by NOAA/OAR/ESRL PSL, Boulder, Colorado, USA, from their website at https://psl.noaa.gov/data/gridded/data.noaa.oisst.v2.highres.html (accessed on 28 January 2021). NCEP/NCAR Reanalysis 1 pressure level data is provided by the National Centers for Environmental Prediction/National Weather Service/NOAA/U.S. Department of Commerce, 1994, updated monthly. NCEP/NCAR Global Reanalysis Products, 1948-continuing. Research Data Archive at NOAA/PSL: /data/gridded/data.ncep.reanalysis.html (accessed on 28 January 2021). GPCP data is provided by NOAA/OAR/ESRL PSL, Boulder, Colorado, USA, from their website at https://psl.noaa.gov/data/gridded/data.gpcp.html (accessed on 28 January 2021).

Acknowledgments

We would like to thank the institutions that provided the data sets and analysis tools that were used for this study. The authors also thank the City College of New York and CESSRST for providing access to the facilities and the software used to perform this research.

Conflicts of Interest

The authors declare no conflict of interest.

References

  1. Nurse, L.A.; Sem, G. Small island states, Climate change 2001—The scientific basis. In Contribution of Working Group 1 to the Third Assessment Report of the Intergovernmental Panel on Climate Change (IPCC); Houghton, J.T., Ding, Y., Griggs, D.J., Noguer, M., van der Linden, P.J., Xiaosu, D., Eds.; Cambridge University Press: Cambridge, UK, 2001; pp. 843–875. [Google Scholar]
  2. Pulwarty, R.S.; Nurse, L.A.; Trotz, U.O. Caribbean Islands in a Changing Climate. Environ. Sci. Policy Sustain. Dev. 2010, 52, 16–27. [Google Scholar] [CrossRef]
  3. Intergovernmental Panel on Climate Change. Managing the Risks of Extreme Events and Disasters to Advance Climate Change Adaptation: A Special Report of Working Groups I and II of the Intergovernmental Panel on Climate Change. Available online: http://ipcc-wg2.gov/SREX/report/full-report (accessed on 3 January 2021).
  4. González, J.E.; Georgescu, M.; Lemos, M.C.; Hosannah, N.; Niyogi, D. Climate change’s pulse is in Central America and the Caribbean. Eos 2017, 98, 1. [Google Scholar] [CrossRef]
  5. Intergovernmental Panel on Climate Change IPCC. An IPCC Special Report on the Impacts of Global Warming of 1.5 °C Above Pre-Industrial Levels and Related Global Greenhouse Gas Emission Pathways’, in the Context of Strengthening the Global Response to the Threat of Climate Change, Sustainable Development, and Efforts to Eradicate Poverty; Hoegh-Guldberg, O., Jacob, D., Bindi, M., Brown, S., Camilloni, I., Diedhiou, A., Djalante, R., Ebi, K., Engelbrecht, F., Guiot, J., et al., Eds.; IPCC: Geneva, Switzerland, 2018; Available online: https://www.ipcc.ch/sr15/ (accessed on 3 January 2021).
  6. NOAA National Centers for Environmental Information. State of the Climate: Global Climate Report for Annual 2020. Available online: https://www.ncdc.noaa.gov/sotc/global/202013 (accessed on 3 January 2021).
  7. Durán-Quesada, A.M.; Gimeno, L.; Amador, J. Role of moisture transport for Central American precipitation. Earth Syst. Dyn. 2017, 8, 147–161. [Google Scholar] [CrossRef] [Green Version]
  8. Durán-Quesada, A.; Sorí, R.; Ordoñez, P.; Gimeno, L. Climate Perspectives in the Intra–Americas Seas. Atmosphere 2020, 11, 959. [Google Scholar] [CrossRef]
  9. Wang, C.; Lee, S.-K. Atlantic warm pool, Caribbean low-level jet, and their potential impact on Atlantic hurricanes. Geophys. Res. Lett. 2007, 34, 02703. [Google Scholar] [CrossRef] [Green Version]
  10. Sorí, R.; Edrumond, A.; Enieto, R. Moisture contribution of the Atlantic Warm Pool to precipitation: A Lagrangian analysis. Front. Environ. Sci. 2015, 3, 3. [Google Scholar] [CrossRef] [Green Version]
  11. Wu, R.; Kirtman, B.P. Caribbean Sea rainfall variability during the rainy season and relationship to the equatorial Pacific and tropical Atlantic SST. Clim. Dyn. 2010, 37, 1533–1550. [Google Scholar] [CrossRef]
  12. Spence, J.M.; Taylor, M.A.; Chen, A.A. The effect of concurrent sea-surface temperature anomalies in the tropical Pacific and Atlantic on Caribbean rainfall. Int. J. Clim. 2004, 24, 1531–1541. [Google Scholar] [CrossRef]
  13. Wang, C.; Enfield, D.B.; Lee, S.-K.; Landsea, C.W. Influences of the Atlantic Warm Pool on Western Hemisphere Summer Rainfall and Atlantic Hurricanes. J. Clim. 2006, 19, 3011–3028. [Google Scholar] [CrossRef]
  14. Gamble, D.W.; Curtis, S. Caribbean precipitation: Review, model and prospect. Prog. Phys. Geogr. Earth Environ. 2008, 32, 265–276. [Google Scholar] [CrossRef]
  15. Maldonado, T.; Alfaro, E.J.; Hidalgo, H.G. A review of the main drivers and variability of Central America’s Climate and seasonal forecast systems. Rev. Biol. Trop. 2018, 66, 153–175. [Google Scholar] [CrossRef] [Green Version]
  16. Martinez, C.; Goddard, L.; Kushnir, Y.; Ting, M. Seasonal climatology and dynamical mechanisms of rainfall in the Caribbean. Clim. Dyn. 2019, 53, 825–846. [Google Scholar] [CrossRef] [Green Version]
  17. Antuña-Marrero, J.C.; Otterå, O.H.; Robock, A.; Mesquita, M.D.S. Modelled and observed sea surface temperature trends for the Caribbean and Antilles. Int. J. Clim. 2015, 36, 1873–1886. [Google Scholar] [CrossRef]
  18. Glenn, E.; Comarazamy, D.; González, J.E.; Smith, T. Detection of recent regional sea surface temperature warming in the Caribbean and surrounding region. Geophys. Res. Lett. 2015, 42, 6785–6792. [Google Scholar] [CrossRef]
  19. Waliser, D.E.; Graham, N.E. Convective cloud systems and warm-pool sea surface temperatures: Coupled interactions and self-regulation. J. Geophys. Res. Space Phys. 1993, 98, 12881–12893. [Google Scholar] [CrossRef]
  20. Krueger, A.F.; Gray, T.I., Jr. Long-Term Variations in Equatorial Circulation and Rainfall. Mon. Weather Rev. 1969, 97, 700–711. [Google Scholar] [CrossRef]
  21. Gadgil, S.; Joseph, P.V.; Joshi, N.V. Ocean–atmosphere coupling over monsoon regions. Nat. Cell Biol. 1984, 312, 141–143. [Google Scholar] [CrossRef]
  22. Nurse, L.A.; Charlery, J.L. Projected SST trends across the Caribbean Sea based on PRECIS downscaling of ECHAM4, under the SRES A2 and B2 scenarios. Theor. Appl. Clim. 2014, 123, 199–215. [Google Scholar] [CrossRef]
  23. Taylor, M.A.; Enfield, D.B.; Chen, A.A. Influence of the tropical Atlantic versus the tropical Pacific on Caribbean rainfall. J. Geophys. Res. Space Phys. 2002, 107, 10–11. [Google Scholar] [CrossRef] [Green Version]
  24. Folkins, I.; Braun, C. Tropical Rainfall and Boundary Layer Moist Entropy. J. Clim. 2003, 16, 1807–1820. [Google Scholar] [CrossRef]
  25. Waliser, D.E.; Gautier, C. A Satellite-derived Climatology of the ITCZ. J. Clim. 1993, 6, 2162–2174. [Google Scholar] [CrossRef]
  26. Malmgren, B.A.; Winter, A.; Chen, D. El Niño–Southern Oscillation and North Atlantic Oscillation Control of Climate in Puerto Rico. J. Clim. 1998, 11, 2713–2717. [Google Scholar] [CrossRef]
  27. George, S.E.; Saunders, M.A. North Atlantic Oscillation impact on tropical North Atlantic winter atmospheric variability. Geophys. Res. Lett. 2001, 28, 1015–1018. [Google Scholar] [CrossRef] [Green Version]
  28. Charlery, J.; Nurse, L.; Whitehall, K. Exploring the relationship between the North Atlantic oscillation and rainfall patterns in Barbados. Int. J. Clim. 2006, 26, 819–827. [Google Scholar] [CrossRef]
  29. Jury, M.; Malmgren, B.A.; Winter, A. Subregional precipitation climate of the Caribbean and relationships with ENSO and NAO. J. Geophys. Res. Space Phys. 2007, 112, 16107. [Google Scholar] [CrossRef]
  30. Hosannah, N.; González, J.E.; Lunger, C.; Niyogi, D. Impacts of Local Convective Processes on Rain on the Caribbean Island of Puerto Rico. J. Geophys. Res. Atmos. 2019, 124, 6009–6026. [Google Scholar] [CrossRef] [Green Version]
  31. Taylor, M.A.; Whyte, F.S.; Stephenson, T.S.; Campbell, J. Why dry? Investigating the future evolution of the Caribbean Low Level Jet to explain projected Caribbean drying. Int. J. Clim. 2012, 33, 784–792. [Google Scholar] [CrossRef]
  32. Campbell, J.; Taylor, M.A.; Stephenson, T.S.; Watson, R.A.; Whyte, F.S. Future climate of the Caribbean from a regional climate model. Int. J. Clim. 2010, 31, 1866–1878. [Google Scholar] [CrossRef]
  33. Reynolds, R.W.; Smith, T.M.; Liu, C.; Chelton, D.B.; Casey, K.S.; Schlax, M.G. Daily High-Resolution-Blended Analyses for Sea Surface Temperature. J. Clim. 2007, 20, 5473–5496. [Google Scholar] [CrossRef]
  34. Gálvez, J.M.; Davison, M. The Gálvez-Davison Index for Tropical Convection. Available online: http://www.wpc.ncep.noaa.gov/international/gdi/GDI_Manuscript_V20161021.pdf (accessed on 10 January 2020).
  35. Kalnay, E.; Kanamitsu, M.; Kistler, R.; Collins, W.; Deaven, D.; Gandin, L.; Iredell, M.; Saha, S.; White, G.; Woollen, J.; et al. The NCEP/NCAR 40-year reanalysis project. Bull. Am. Meteor. Soc. 1996, 77, 437–470. [Google Scholar] [CrossRef] [Green Version]
  36. Adler, R.F.; Huffman, G.J.; Chang, A.; Ferraro, R.; Xie, P.-P.; Janowiak, J.; Rudolf, B.; Schneider, U.; Curtis, S.; Bolvin, D.; et al. The Version-2 Global Precipitation Climatology Project (GPCP) Monthly Precipitation Analysis (1979–Present). J. Hydrometeor. 2003, 4, 21. [Google Scholar] [CrossRef]
  37. Magaña, V.; Amador, J.A.; Medina, S. The Midsummer Drought over Mexico and Central America. J. Clim. 1999, 12, 1577–1588. [Google Scholar] [CrossRef]
  38. Chen, A.A.; Taylor, M.A. Investigating the link between early season Caribbean rainfall and the El Niño + 1 year. Int. J. Clim. 2002, 22, 87–106. [Google Scholar] [CrossRef]
  39. Ashby, S.A.; Taylor, M.A.; Chen, A.A. Statistical models for predicting rainfall in the Caribbean. Theor. Appl. Clim. 2005, 82, 65–80. [Google Scholar] [CrossRef]
  40. Gamble, D.W.; Parnell, D.B.; Curtis, S. Spatial variability of the Caribbean mid-summer drought and relation to north Atlantic high circulation. Int. J. Clim. 2008, 28, 343–350. [Google Scholar] [CrossRef]
  41. Nott, J.A. Extreme Events: A Physical Reconstruction and Risk Assessment; Cambridge University Press: Cambridge, UK, 2006. [Google Scholar]
  42. Angeles, M.E.; González, J.E.; Ramírez-Beltrán, N.D.; Tepley, C.A.; Comarazamy, D.E. Origins of the Caribbean Rainfall Bimodal Behavior. J. Geophys. Res. Space Phys. 2010, 115, 11106. [Google Scholar] [CrossRef] [Green Version]
  43. Mann, H.B. Nonparametric tests against trend. Econometrica 1945, 13, 245–259. [Google Scholar] [CrossRef]
  44. Kendall, M.G. Rank Correlation Methods; Griffin: London, UK, 1975. [Google Scholar]
  45. Yue, S.; Pilon, P.; Cavadias, G. Power of the Mann–Kendall and Spearman’s rho tests for detecting monotonic trends in hydrological series. J. Hydrol. 2002, 259, 254–271. [Google Scholar] [CrossRef]
  46. Wang, F.; Shao, W.; Yu, H.; Kan, G.; He, X.; Zhang, D.; Ren, M.; Wang, G. Re-evaluation of the Power of the Mann-Kendall Test for Detecting Monotonic Trends in Hydrometeorological Time Series. Front. Earth Sci. 2020, 8, 14. [Google Scholar] [CrossRef]
  47. Totaro, V.; Gioia, A.; Iacobellis, V. Numerical investigation on the power of parametric and nonparametric tests for trend detection in annual maximum series. Hydrol. Earth Syst. Sci. 2020, 24, 473–488. [Google Scholar] [CrossRef] [Green Version]
  48. Gioia, A.; Bruno, M.F.; Totaro, V.; Iacobellis, V. Parametric Assessment of Trend Test Power in a Changing Environment. Sustainability 2020, 12, 3889. [Google Scholar] [CrossRef]
  49. Serinaldi, F.; Kilsby, C.G.; Lombardo, F. Untenable nonstationarity: An assessment of the fitness for purpose of trend tests in hydrology. Adv. Water Resour. 2018, 111, 132–155. [Google Scholar] [CrossRef]
  50. Vogel, R.M.; Rosner, A.; Kirshen, P.H. Brief Communication: Likelihood of societal preparedness for global change: Trend detection. Nat. Hazards Earth Syst. Sci. 2013, 13, 1773–1778. [Google Scholar] [CrossRef] [Green Version]
  51. Taylor, M.; Stephenson, T.; Clarke, L.; Charlton, C.; Stephenson, K.; Brown, P.; Rankine, D.; Campbell, J.; Stennett-Brown, R.; Whyte, F.; et al. The State of the Caribbean Climate Report; The University of the West Indies: Kingston, Jamaica, 2020. [Google Scholar]
  52. Mote, T.L.; Ramseyer, C.A.; Miller, P.W. The Saharan Air Layer as an Early Rainfall Season Suppressant in the Eastern Caribbean: The 2015 Puerto Rico Drought. J. Geophys. Res. Atmos. 2017, 122, 966. [Google Scholar] [CrossRef]
Figure 1. Map depicting the extent of the Caribbean and surrounding region domain of interest (5°–31° N, 100° W–55° W) with color contours depicting the elevations (in meters), the Main Developing Region (10° N–20° N, 20° W–80° W), and the Tropical North Atlantic (0° N–40° N, 10° W–100° W).
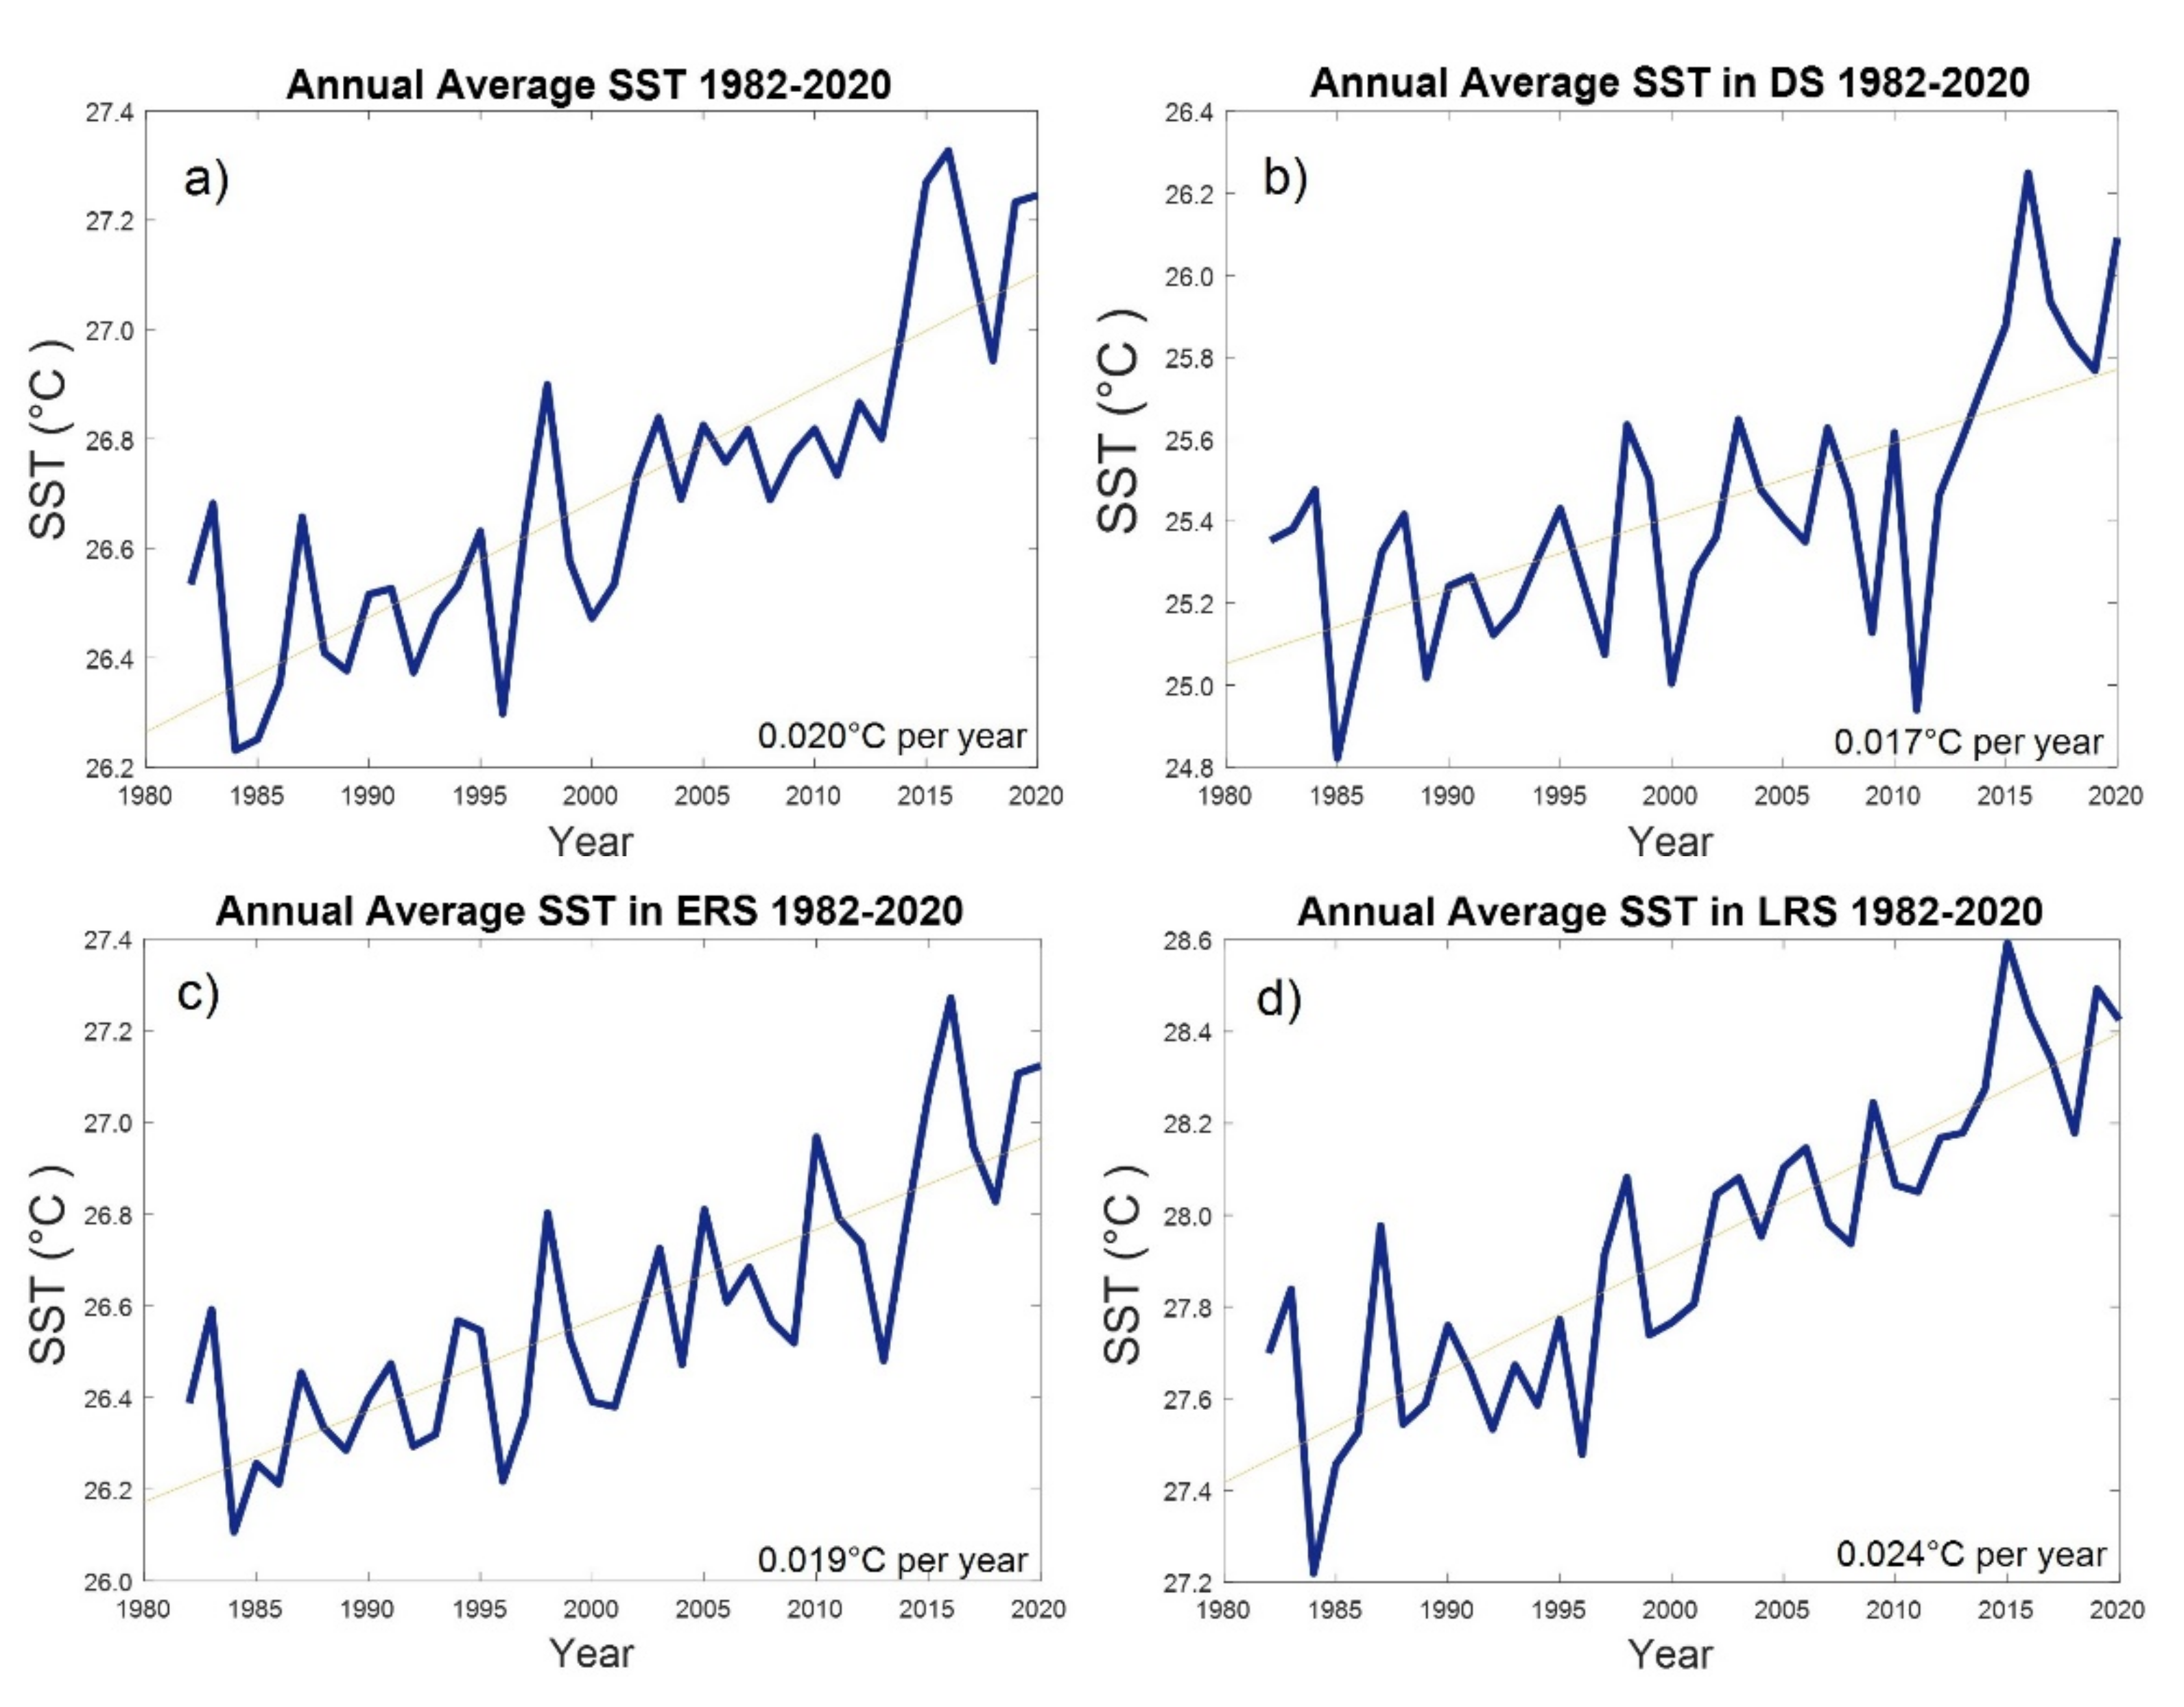
Hydrology 08 00056 g001
Figure 2. Summary of regional (spatial) averaged trends from 1982–2020: (a) annual regional average SST time series for the Caribbean and surrounding region, (b) regional average of SST in the Dry Rainfall Season, (c) regional average of SST in the Early Rainfall Season, and (d) regional average of SST in the Late Rainfall Season.
Hydrology 08 00056 g002
Figure 3. Caribbean and surrounding region sea surface temperature anomalies observation: (a) annual SST anomaly 1982–2020 and (b) Late Rainfall Season SST anomaly 1982–2020.
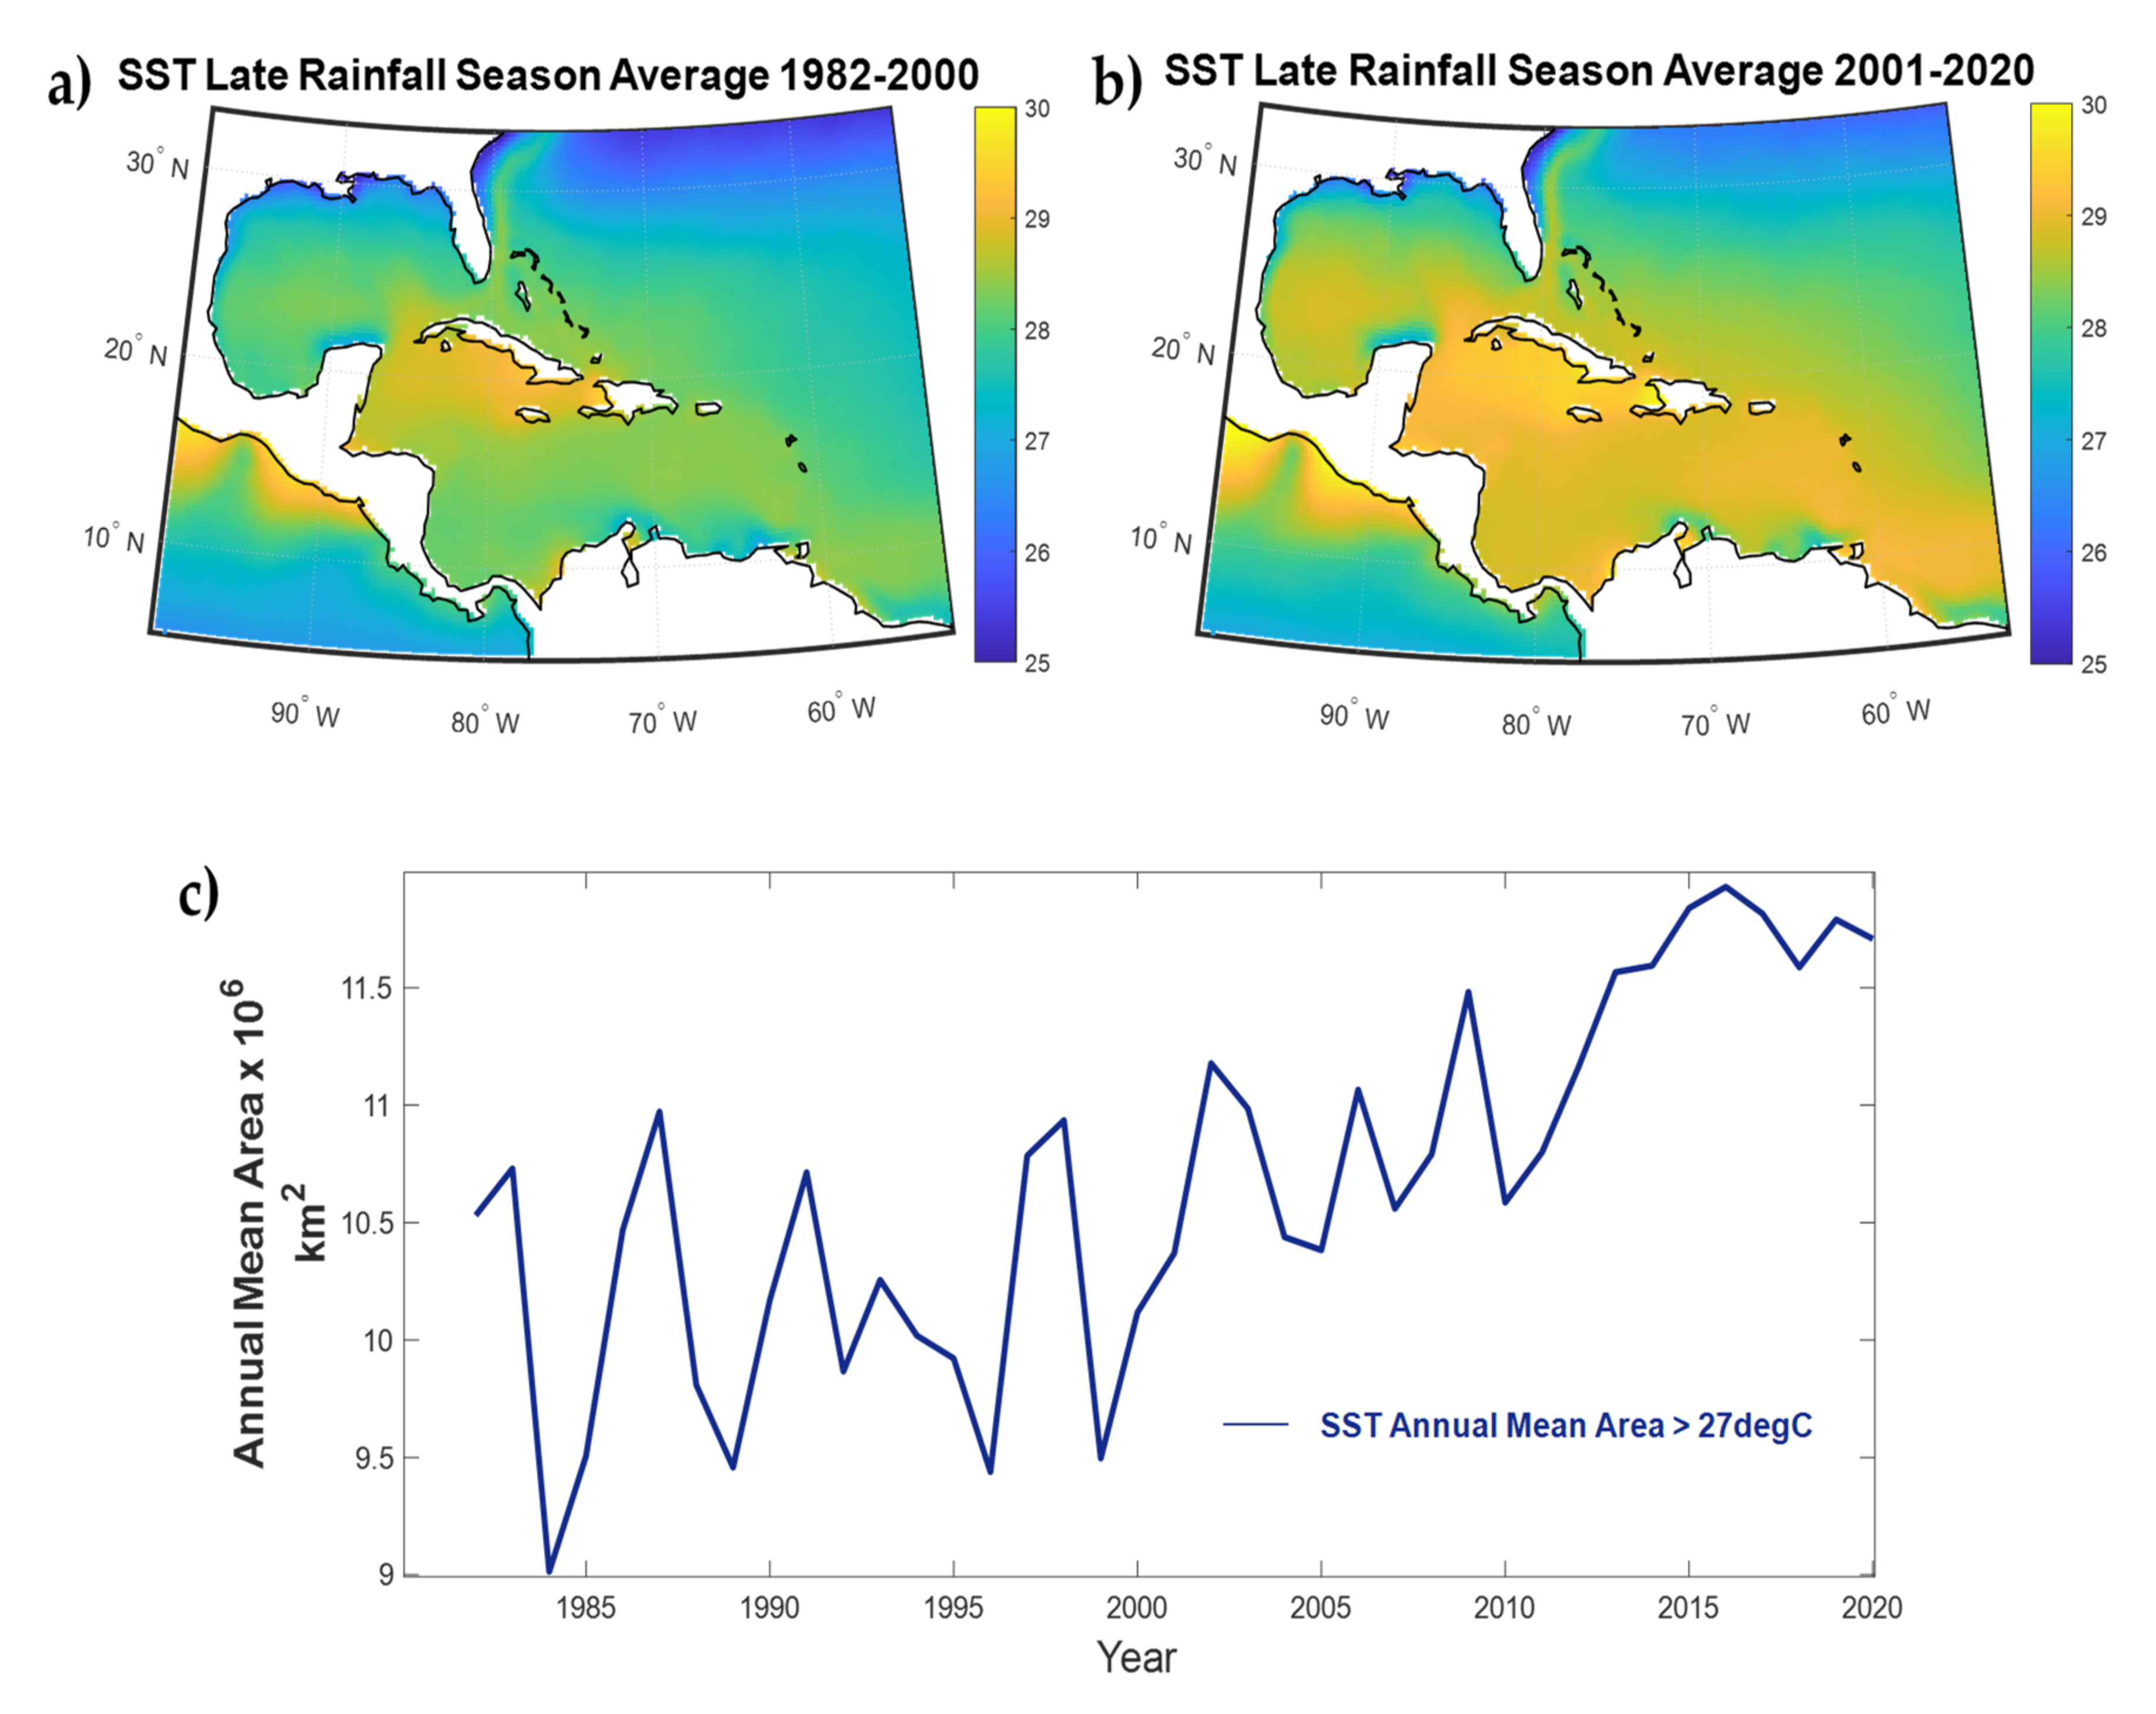
Hydrology 08 00056 g003
Figure 4. Late Rainfall Season sea surface temperature averages for warming SST observation: (a) 1982–2000, (b) 2001–2020, and (c) convection threshold Area Index time series for the Caribbean and surrounding region. The color bar indicates the temperature (°C).
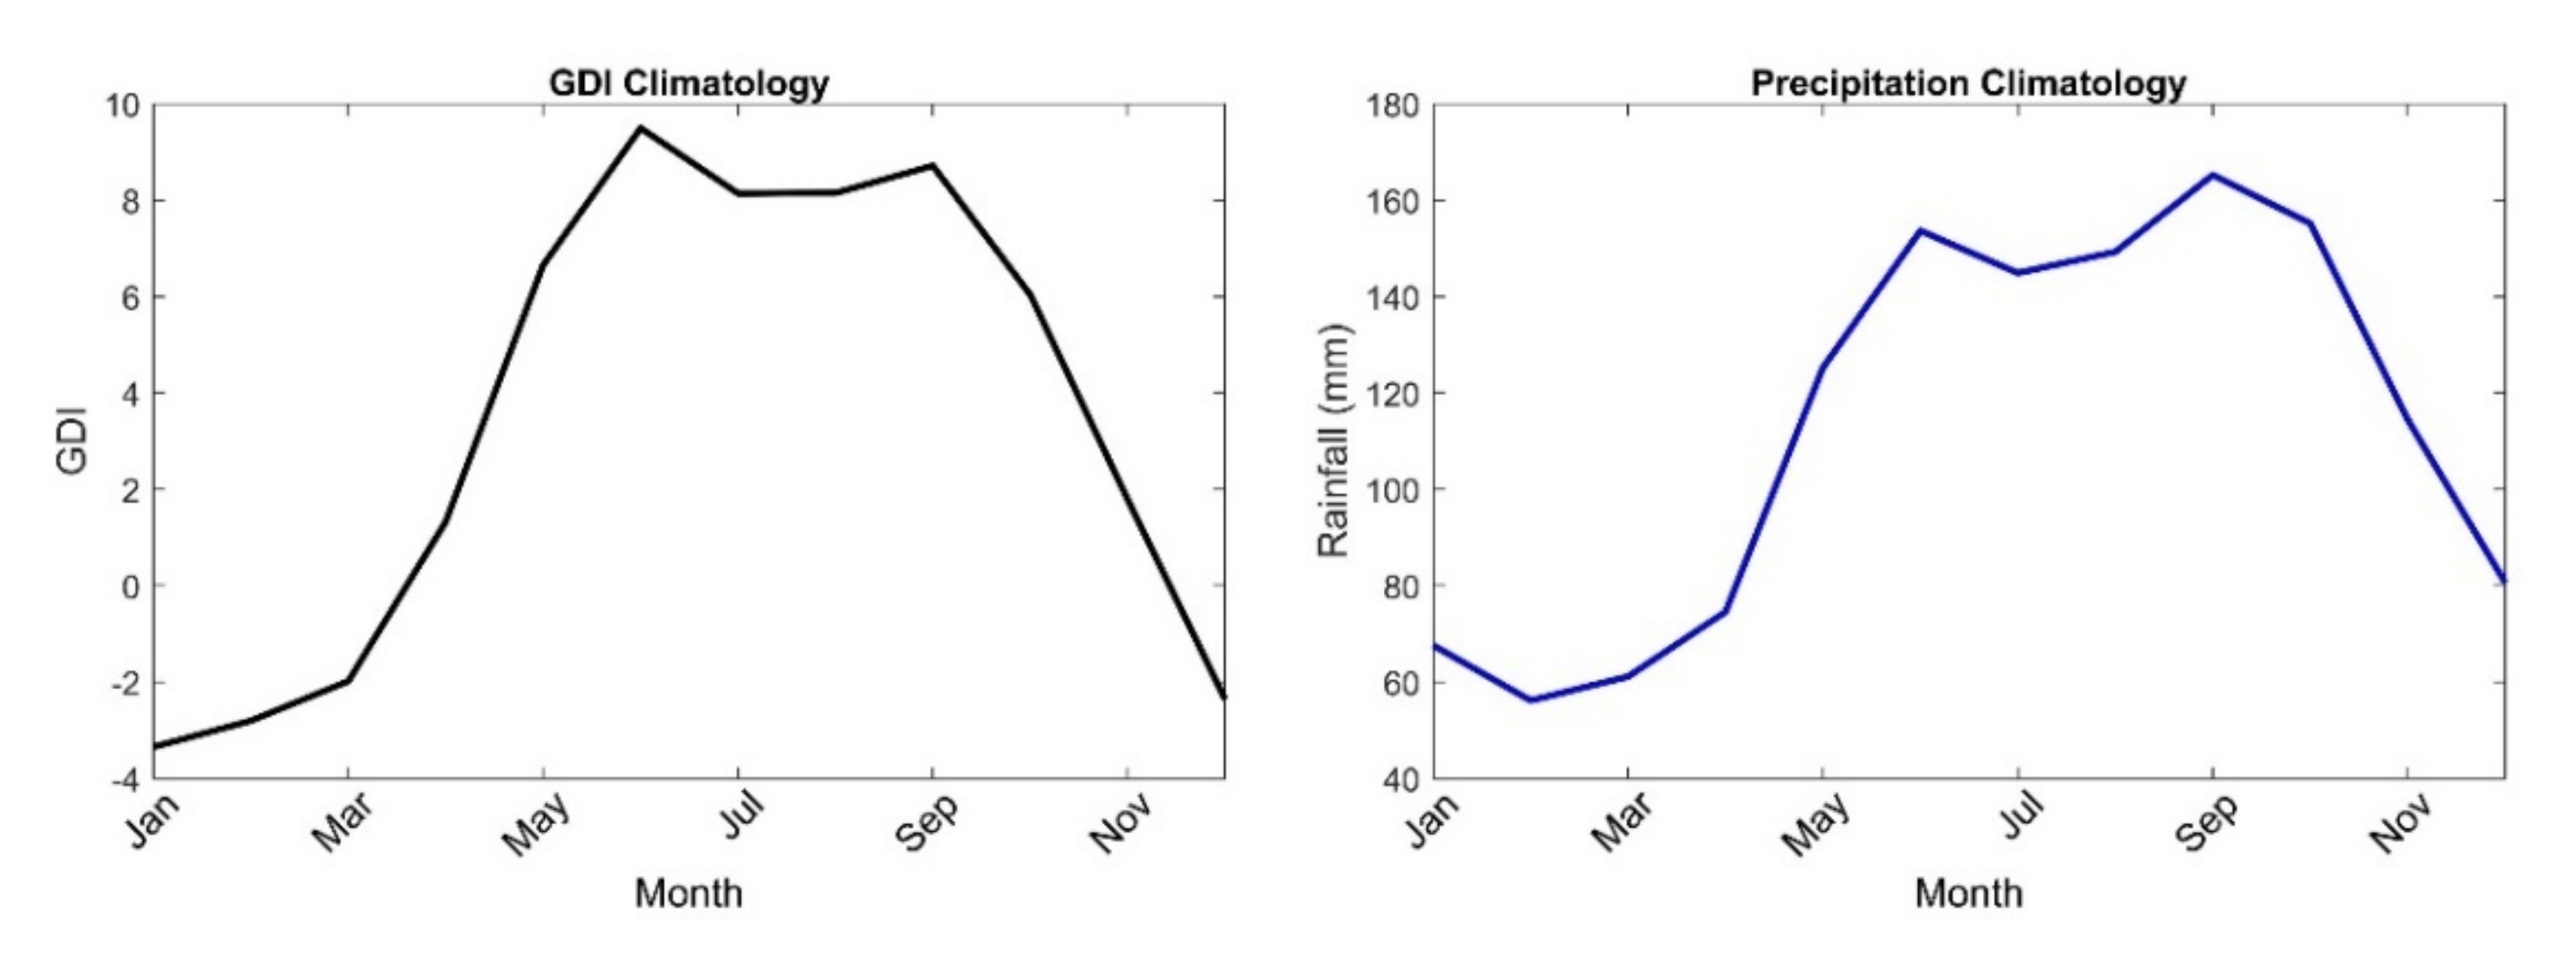
Hydrology 08 00056 g004
Figure 5. The Galvez-Davidson Index (GDI) annual climatology (left) and the precipitation annual climatology (right) for the Caribbean and surrounding region (5°–31° N, 100° W–55° W), also referred to as the Intra-Americas Region (IAR), for base period 1982–2020.
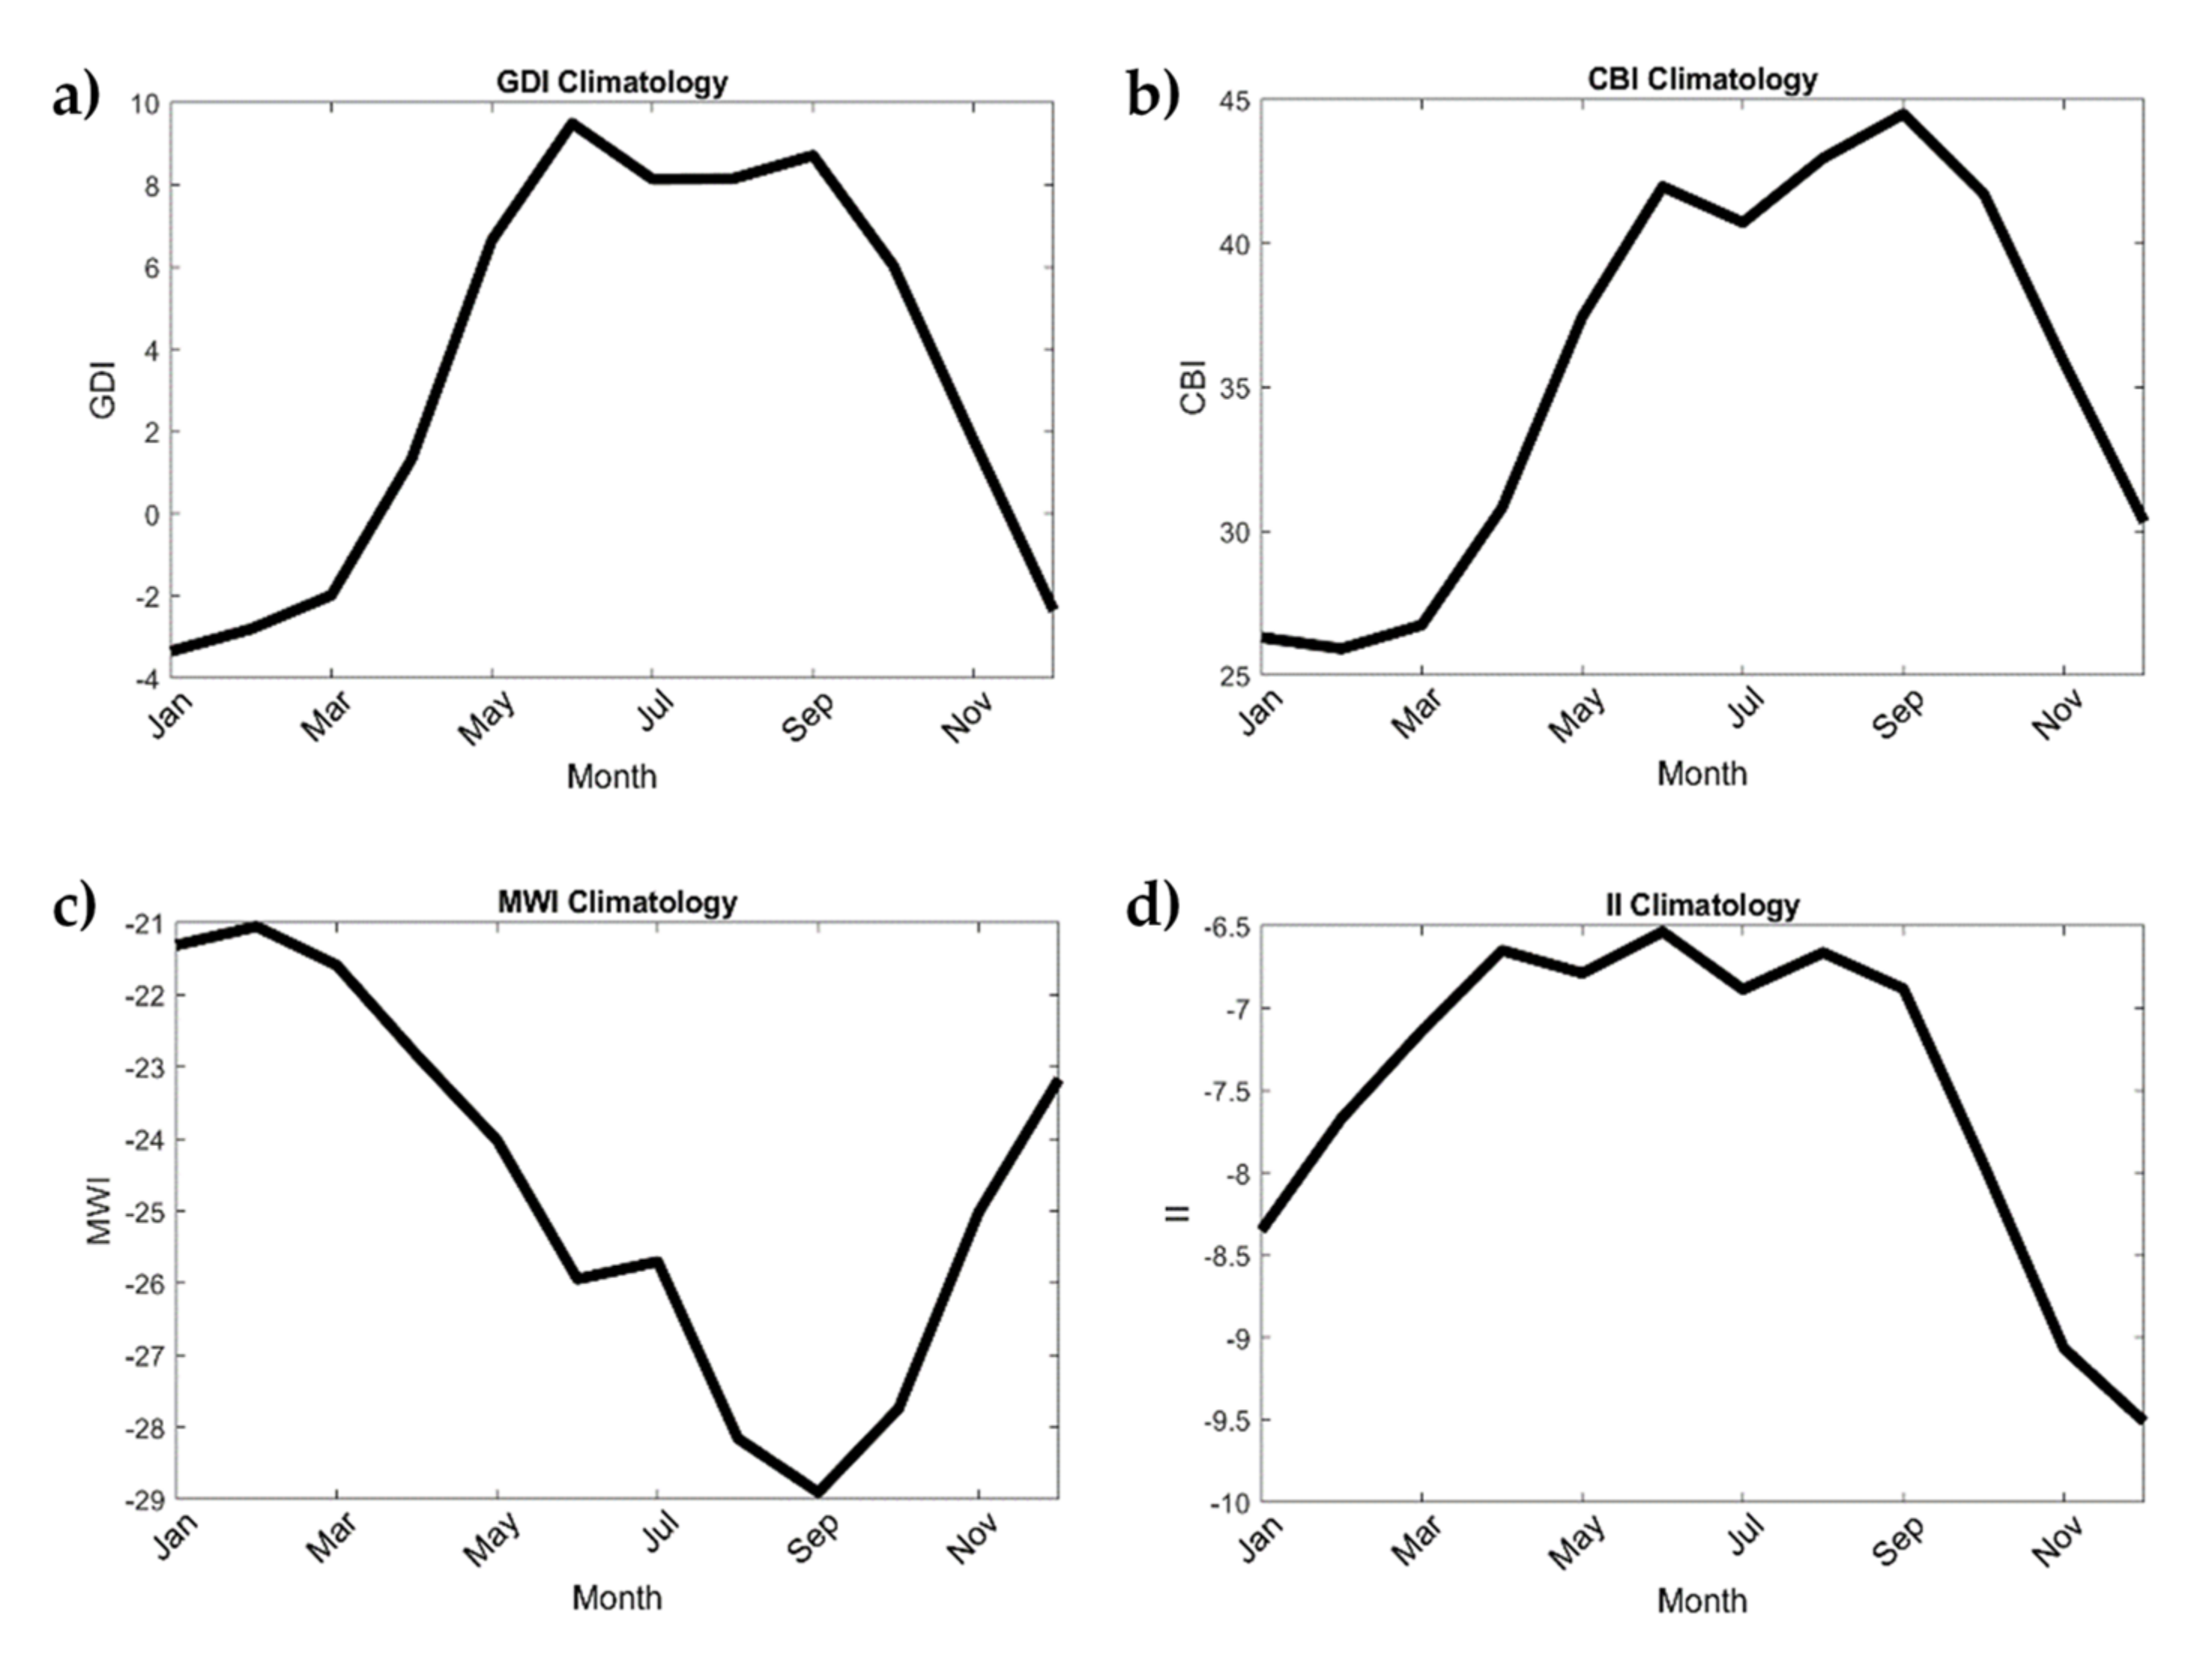
Hydrology 08 00056 g005
Figure 6. Galvez-Davidson Index (GDI) and sub-index annual climatology results for the (a) the GDI, (b) Column Buoyancy Index (CBI), (c) the Mid-level Warming Index (MWI), and (d) the Inversion Index (II) for the Caribbean and surrounding region (5°–31° N, 100° W–55° W) for base period 1982–2020.
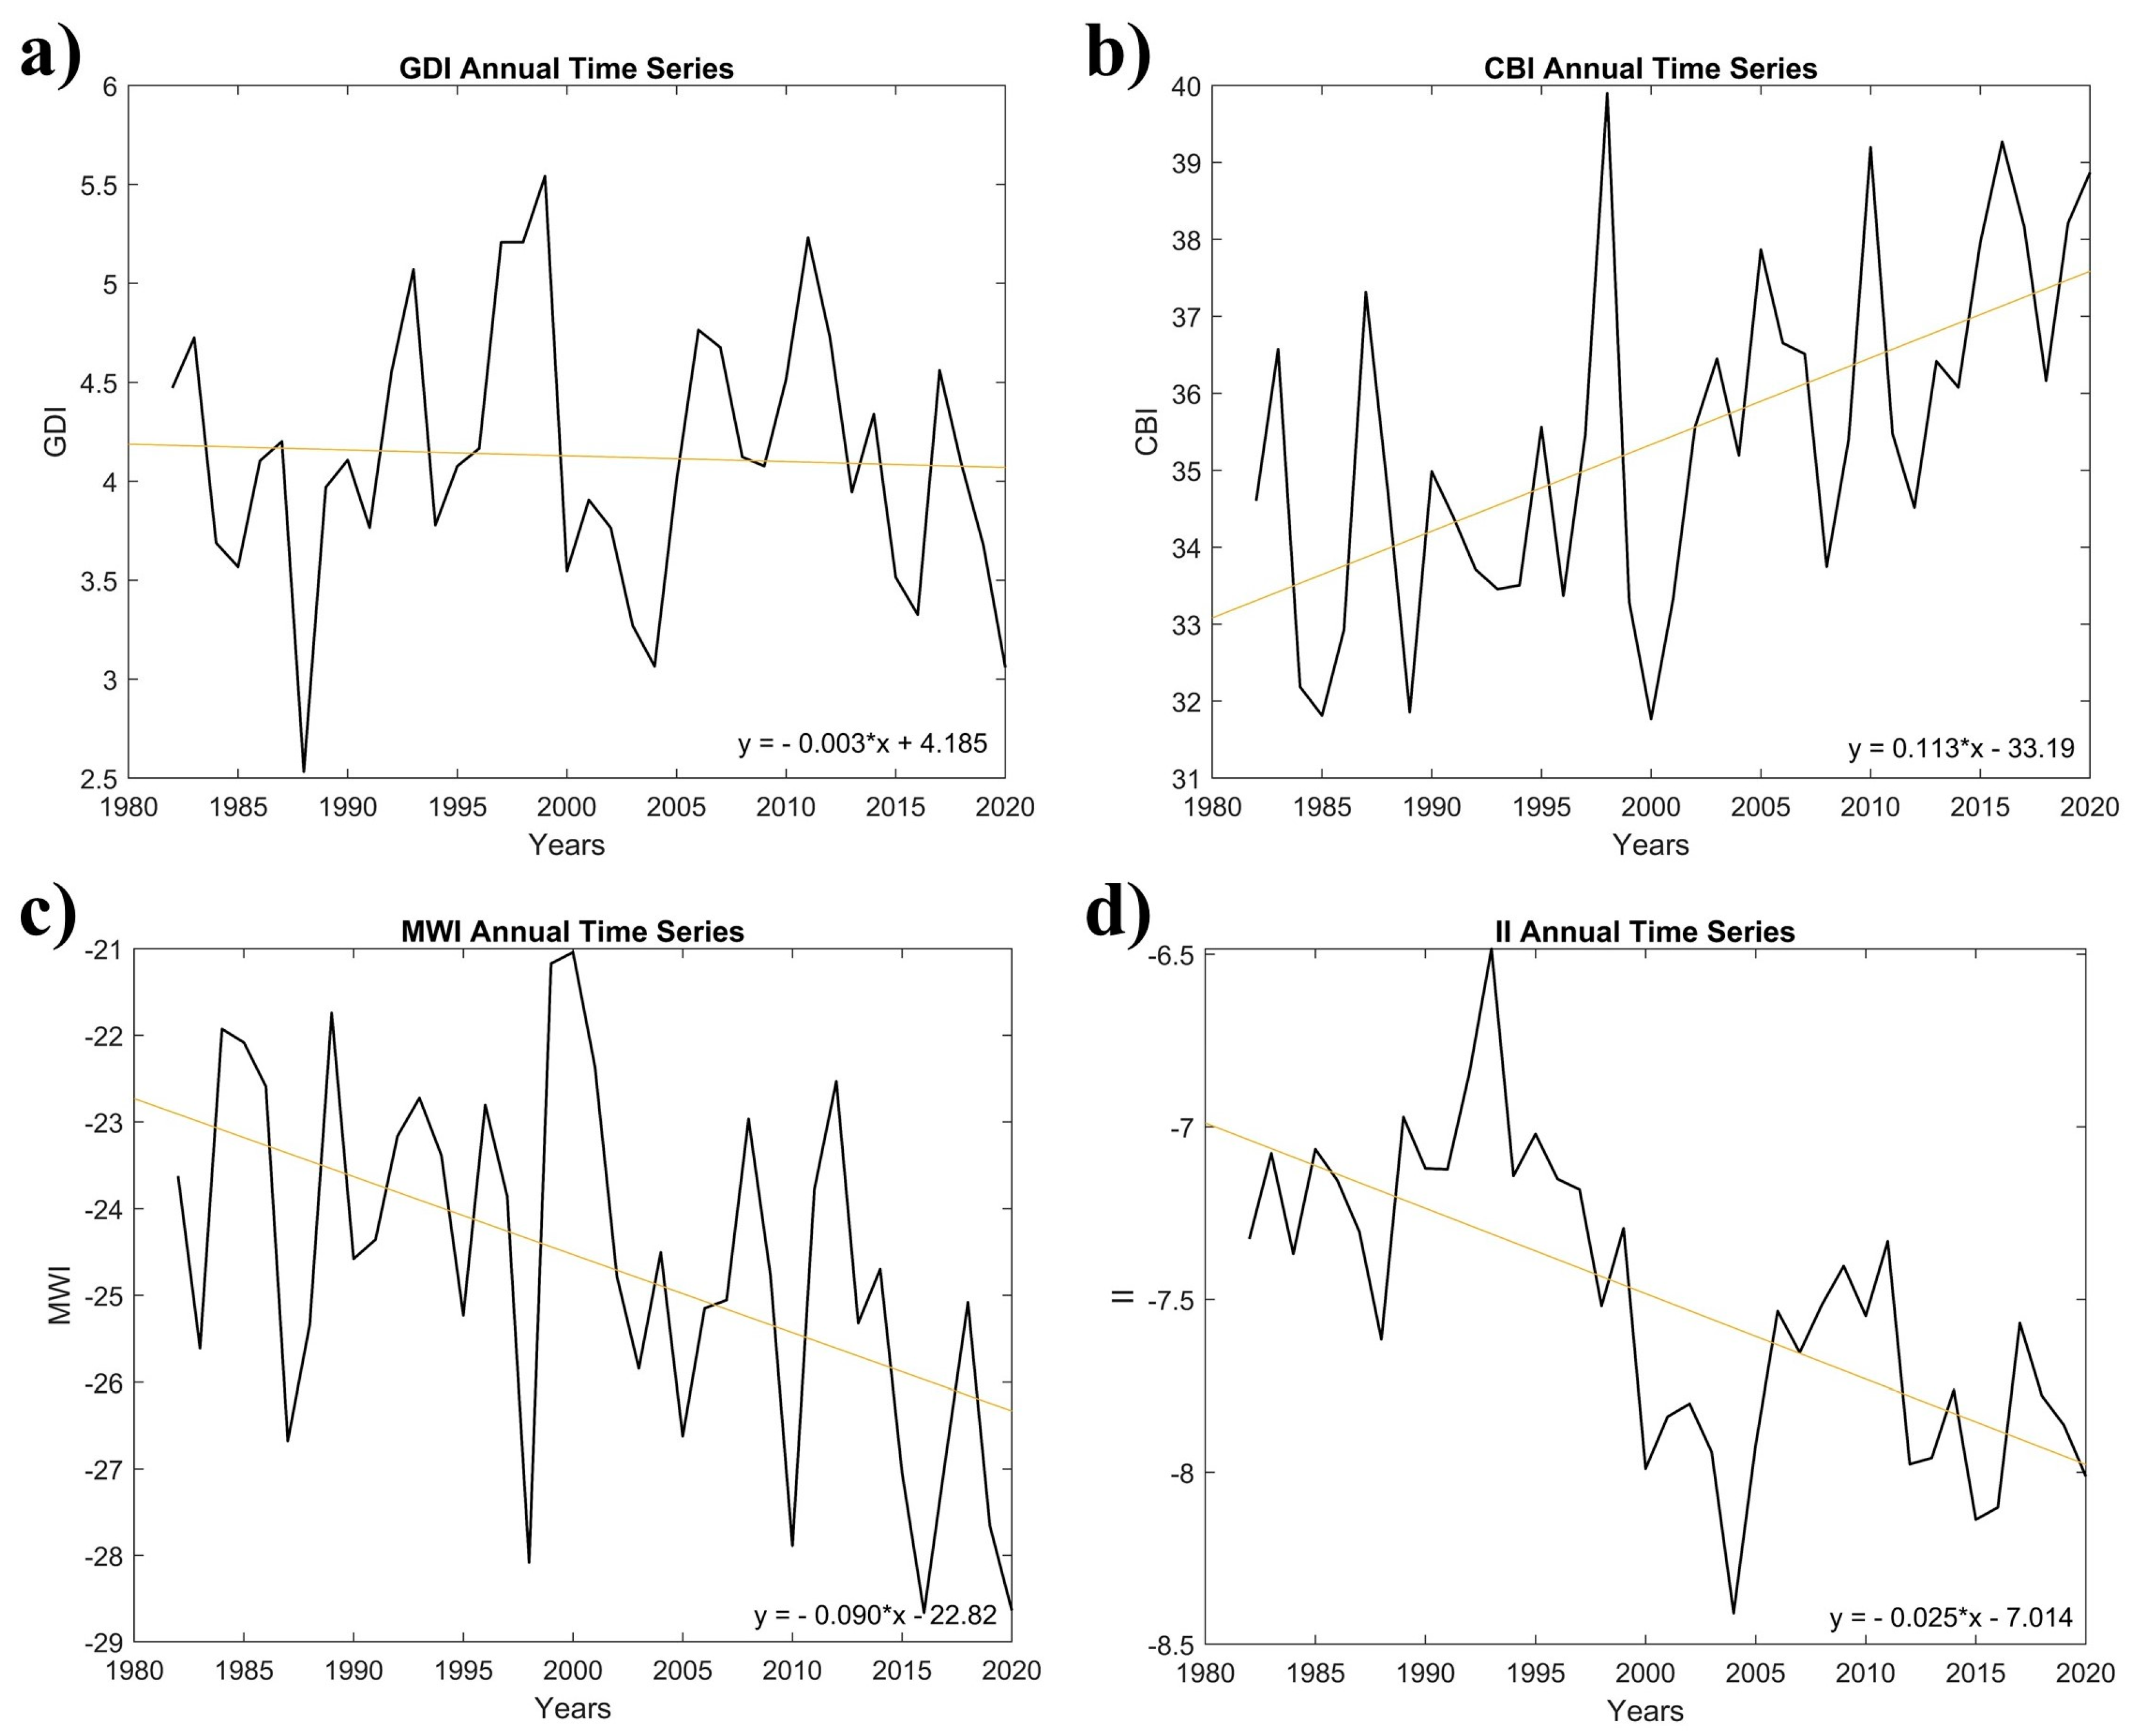
Hydrology 08 00056 g006
Figure 7. Summary of annual regional (spatial) averaged trends over 1982–2020 for (a) the Galvez-Davidson Index (GDI), (b) Column Buoyancy Index (CBI), (c) the Mid-level Warming Index (MWI), and (d) the Inversion Index (II).
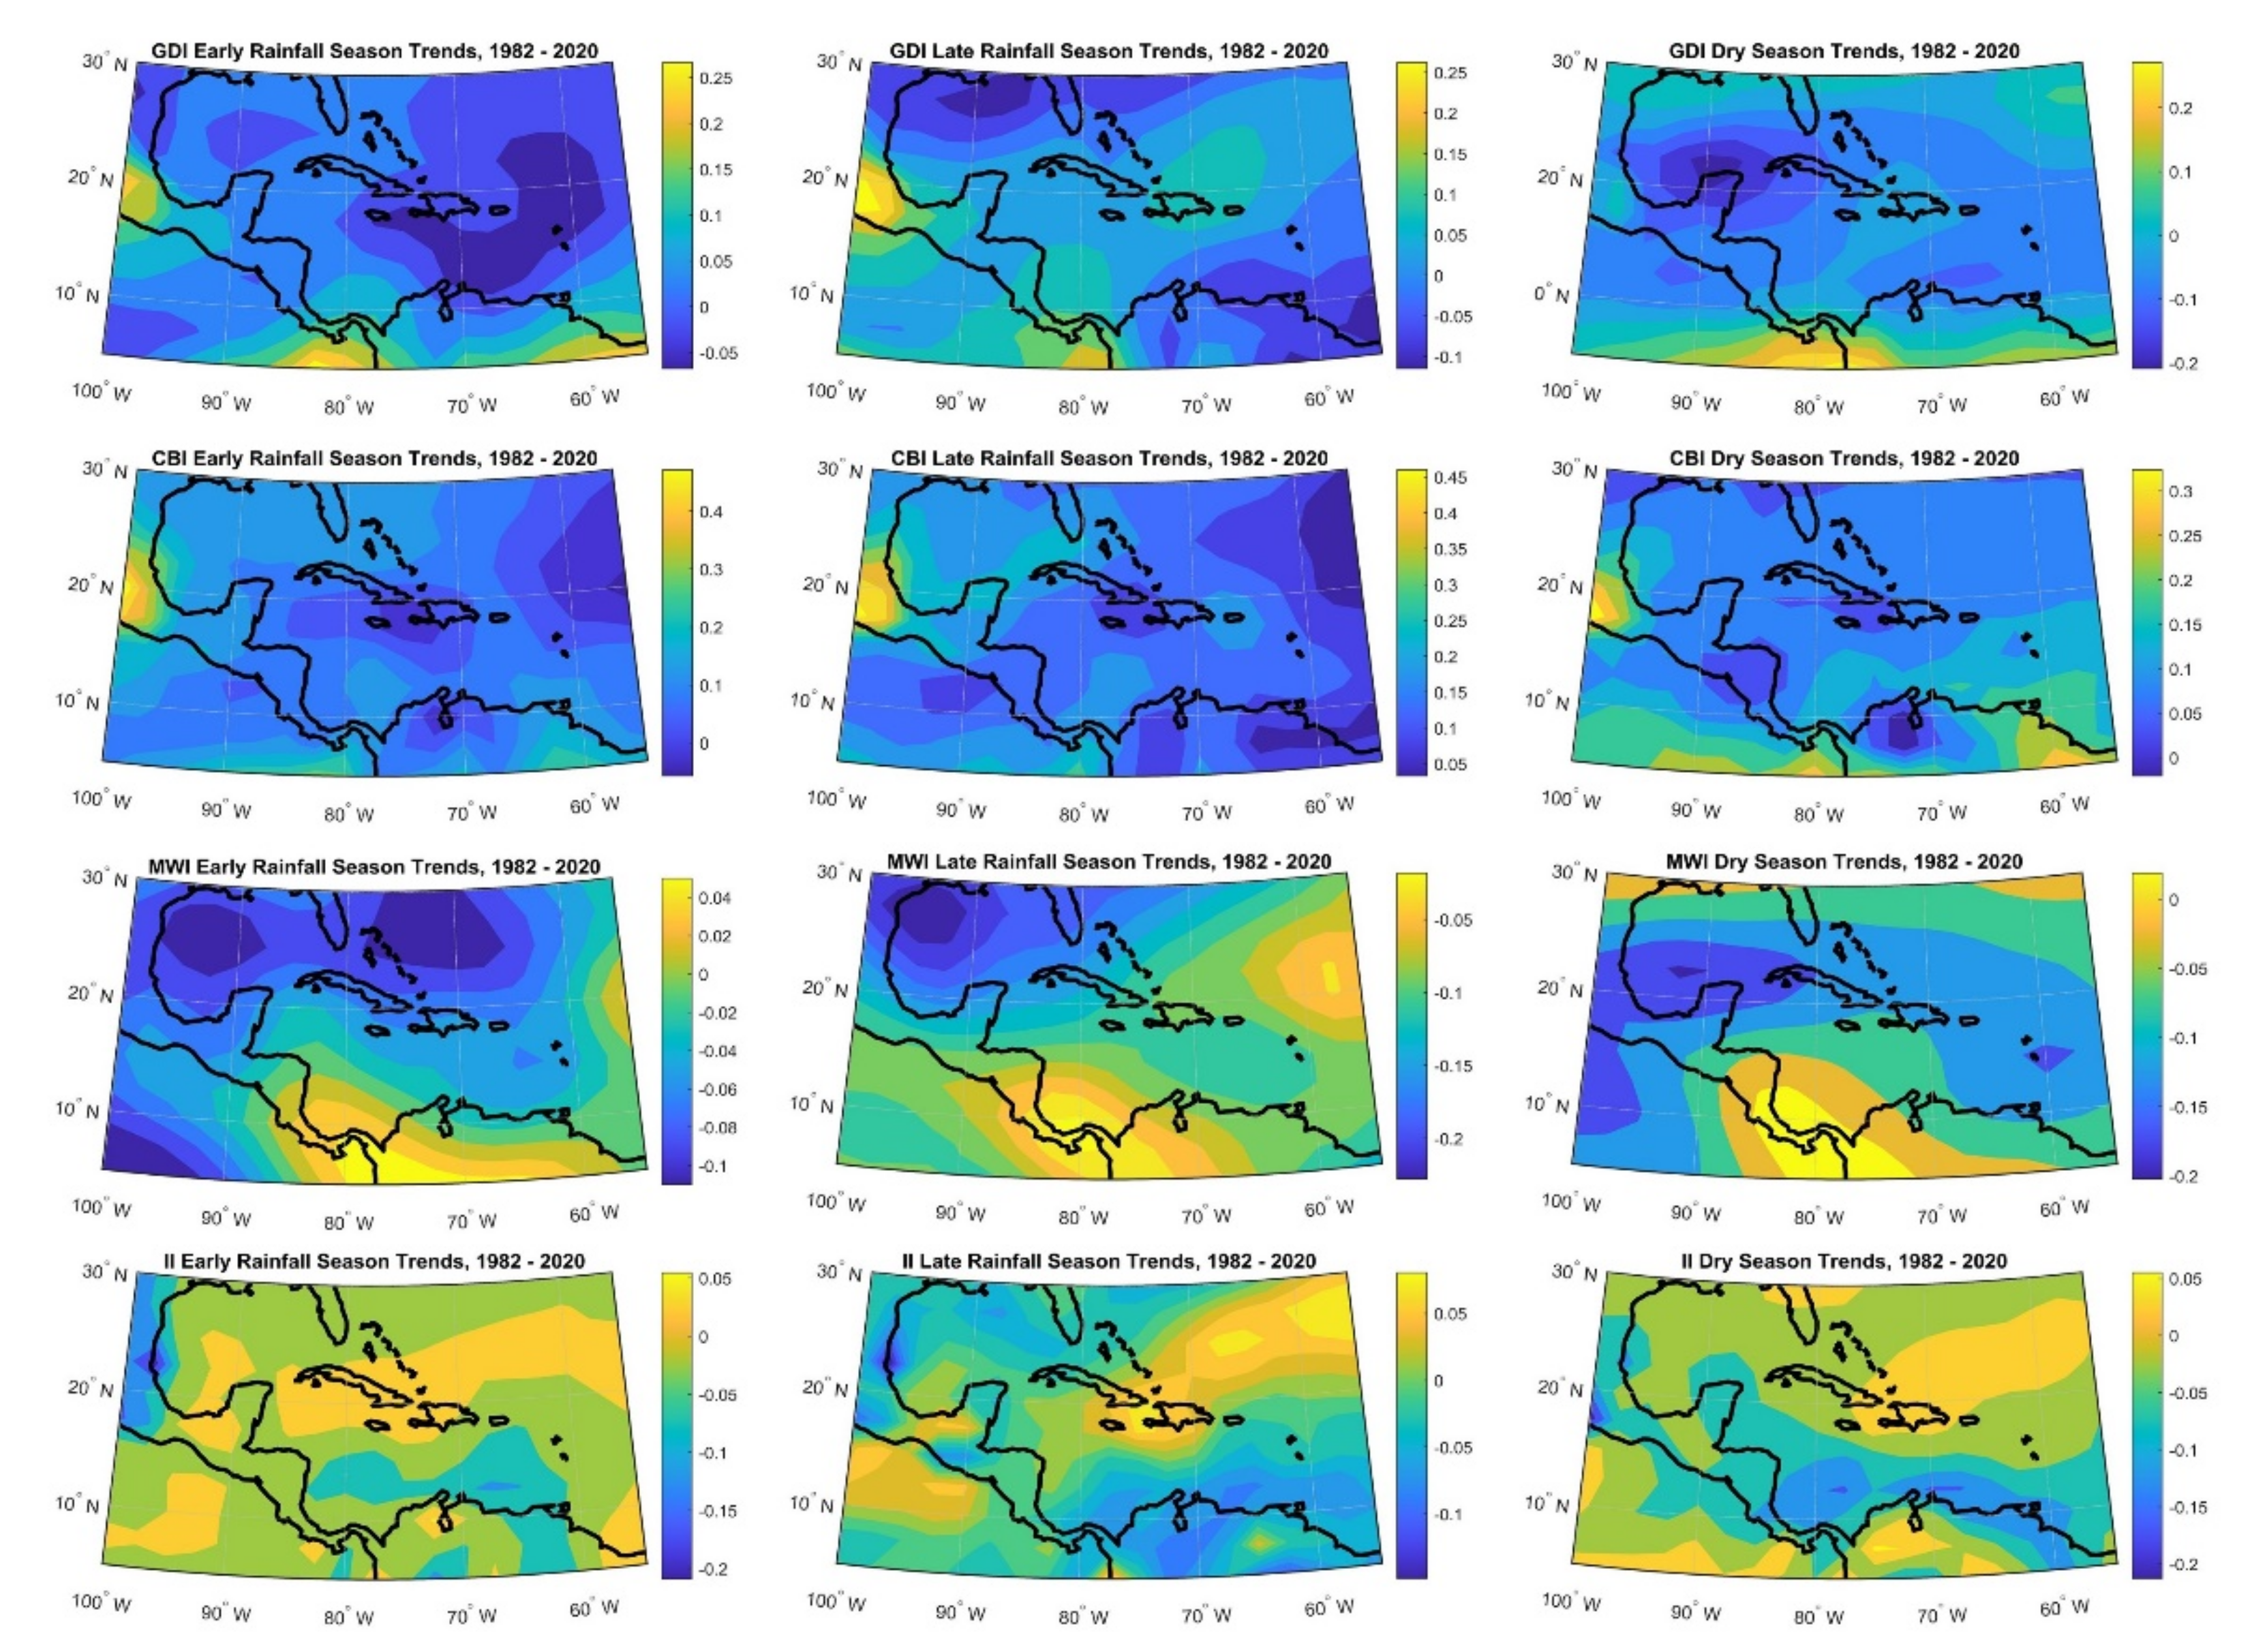
Hydrology 08 00056 g007
Figure 8. Regional trends (slope) per grid for the Galvez-Davidson Index (GDI) and individual sub-indices for the Column Buoyancy Index (CBI), the Mid-level Warming Index (MWI), and the Inversion Index (II).
Hydrology 08 00056 g008
Table 1. List of acronyms.
List of Acronyms
AWPAtlantic Warm PoolLRSLate Rainfall Season
CAPEConvective Available Potential EnergyMKMann-Kendall
CBIColumn Buoyancy IndexMSDMid-Summer Drought
CLLJCaribbean Low-Level JetMWIMid-Level Warming Index
DSDry SeasonNAONorth Atlantic Oscillation
ENSOEl Niño Southern OscillationNCARNational Center for Atmospheric Research
ERSEarly Rainfall SeasonNCEPNational Centers for Environmental Prediction
GDIGálvez-Davison IndexNOAANational Oceanic and Atmospheric Administration
GPCPGlobal Precipitation Climatology ProjectOIOptimum Interpolated
IARIntra-Americas RegionSSTSea Surface Temperature
IIInversion IndexTCTerrain Correction
IPCCIntergovernmental Panel on Climate ChangeTNATropical North Atlantic
Table 2. Summary of Galvez–Davidson Index (GDI) and expected types of convective regimes based on the Caribbean and surrounding region.
GDI ValueExpected Convective Regime
GDI > +45Scattered to widespread heavy rain producing thunderstorms
+35 to +45Scattered thunderstorms, some capable of producing heavy rainfall
+25 to +35Isolated to scattered thunderstorms and/or scattered shallow convection
+15 to +25Isolated thunderstorms, but mostly shallow convection
+05 to +15Isolated, brief thunderstorm possible—potential for shallow convection
−20 to +05Strong subsidence inversion likely—isolated to scattered shallow convection
−20 > GDIStrong subsidence inversion. Convection should be shallow, isolated and produce trace accumulations
Table 3. List of p-values for regional (spatial) averaged SST trends.
p-valueAnnualDSERSLRS
2.15 × 10−117.29 × 10−69.05 × 10−101.39 × 10⁻¹²
Table 4. List of p-values for regional (spatial) averaged GDI trends.
p-valueGDICBIMWIII
0.73412.14 × 10−40.0041.19 × 10−5
Table 5. List of p-values for regional (spatial) averaged trends per season for the GDI and subindices.
GDICBIMWIII
ERS0.25550.0050.00760.0018
LRS0.19972.60 × 10−111.85 × 10−50.0029
DS0.03310.0193.33 × 10−90.0000
Table 6. Summary of regional precipitation correlations with SST and GDI (bold represents significance at 95% test level).
PrecipitationRegional Average Correlation
SSTGDI
Annual0.25570.3779
ERS0.26690.604
LRS−0.08680.3677
DS0.44320.5615
Table 7. Summary of regional sea-surface temperatures (SST) correlations with GDI (bold represents statistical significance at 95% test level).
SSTGDICBIMWIII
Annual−0.060.84−0.78−0.64
ERS0.150.77−0.69−0.5
LRS0.130.86−0.83−0.47
DS−0.170.83−0.77−0.39
Values in bold are determined to be statistically significant at the 95% significance level.
Publisher’s Note: MDPI stays neutral with regard to jurisdictional claims in published maps and institutional affiliations.

