Article

Assessing Hydrological Alterations and Environmental Flow Components in the Beht River Basin, Morocco, Using Integrated SWAT and IHA Models

1
Laboratory of Geo-Resources and Environment, Faculty of Sciences and Techniques, University of Sidi Mohamed Ben Abdellah, Fez 30000, Morocco
2
Department of Marine Sciences, School of Environment, University of the Aegean, 81100 Mytilene, Greece
3
National Thematic Institute for Water Research (INTR-Eau), University Ibn Zohr, Agadir 80000, Morocco
4
Institute of Electronics, Computer and Telecommunication Engineering (IEIIT), Consiglio Nazionale delle Ricerche (CNR), 56122 Pisa, Italy
*
Authors to whom correspondence should be addressed.
Hydrology 2025, 12(5), 109; https://doi.org/10.3390/hydrology12050109
Submission received: 16 April 2025 / Revised: 30 April 2025 / Accepted: 1 May 2025 / Published: 2 May 2025

Abstract

This study presents a comprehensive analysis of hydrological alterations and environmental flow components in the Beht River basin in northwest Morocco, using a coupled approach involving the Soil and Water Assessment Tool (SWAT) for hydrological modeling, the Indicators of Hydrologic Alteration (IHA) for flow regime assessment, and the Standardized Precipitation Index (SPI) for drought characterization. The SWAT model, run on a daily time step, showed satisfactory performance in terms of statistical criteria for both calibration and validation periods, despite encountering limitations, and proved its ability to simulate and reproduce the hydrological behavior of the basin. Using the IHA, we investigated changes in the hydrological regime over two distinct periods, revealing significant hydrological alteration. The SPI analysis supported these findings by highlighting the variable impacts of dry and wet periods on the hydrological regime, thus validating the observed changes in river flow indicators. As a preliminary step toward establishing environmental flows in the Beht River, this study provides foundational insights into the temporal evolution of its hydrology. These findings offer a valuable basis for better water resource management and conservation in the region.

1. Introduction

Climate change has exacerbated extreme weather events in Morocco, with extended droughts followed by strong rainfall episodes resulting in disastrous floods that have devastated infrastructure and agricultural regions [1,2,3,4]. Furthermore, as the demand for water resources increases due to population growth, economic development, and climate change, it is apparent that crucial measures must be put in place to ensure rational and integrated water resource management [5,6,7]. Such management is of paramount importance in the enhancement, mobilization, and protection of water against climatic and anthropogenic hazards [8]. Consequently, these factors significantly modify and alter the natural flow regime of rivers and their ecosystems, leading to serious challenges [9,10].
The comprehension and successful management of water resources in semi-arid watersheds, which are known for their limited water supply, high evapotranspiration rates, and irregular rainfall patterns [11,12], depends mainly on hydrological modeling [13,14]. In particular, it adds critical knowledge to the relationship between climate, land use, and hydrology. Different models can be used in hydrological modeling and take into account a lot of parameters to predict the flow and water quality, requiring a comprehensive set of data, including meteorological, topographical, and hydrological data, which are challenging to obtain particularly in underdeveloped and/or developing countries like Morocco due to the poor quality and scarcity of data [15,16,17], limited spatiotemporal hydro-meteorological gauging networks, and the complexity of hydrological systems. This understanding helps manage diverse impacts on river system flow regimes, ensuring the continued health and functionality of aquatic ecosystems.
The SWAT (Soil and Water Assessment Tool) model is a widely used hydrological model designed for the comprehensive assessment of water resources, land use, and water quality within a watershed or river basin. The model has demonstrated its resilience and adaptability through extensive implementation in diverse climatic and geographical contexts, including Morocco [13,18,19,20,21,22,23,24,25].
In the context of sustainable freshwater management, it is necessary to assess the degree of alteration and the impact of various changes on the river flow regime and its ecosystem, aiming to ensure adequate environmental flows in rivers [26], which, according to the Brisbane Declaration [27], describe “the quantity, quality and duration of water flows necessary to sustain freshwater and estuarine ecosystems to support subsistence and ecosystem well-being”. The assessment of environmental flows requires a detailed study, including a hydrological study to obtain information on the flow regime of the river over the years, i.e., the amount of water flowing in its channels during the different months of the year, the timing of small and large floods, data collection and analysis on fish communities, macro-invertebrates, and riparian vegetation, and an assessment of water quality [28,29]. In addition, the commonly used Indicators of Hydrologic Alteration (IHA) model provides a structure for measuring hydrological changes resulting from human activities and other factors, helping in the assessment of river health and environmental flow needs [28]. To better characterize this climatic variability and support the IHA results, this study also employs the Standardized Precipitation Index (SPI) [30] at multiple timescales.
The aim of the present work is to apply the continuous SWAT model to generate flows that will serve as inputs for evaluating the degree of alteration and the environmental flow components of the Beht River basin using the IHA model. In parallel, SPI analysis is conducted to evaluate the meteorological droughts and wet periods and reinforce the interpretation of long-term hydrological trends. As a preliminary step, which needs to be refined by a comprehensive ecological study, we need to obtain a general idea of the flow conditions on the basis of which ecological flow recommendations should be implemented. This concern has motivated us to investigate and estimate water resources in the Beht River basin, which has a semi-arid climate that is very sensitive to the effects of climate change [31,32,33], and where few similar studies have been carried out [34,35,36].

2. Materials and Methods

2.1. Study Area

The basin is situated in the southwest region of the Sebou basin in northwestern Morocco, and it has a surface area of around 4560 km2 (Figure 1). It is bound to the north by the Gharb plain and the Meknes plateau, to the south by the Oum–Erbia basin, to the west by the Bouregreg basin, and to the east by the Middle Atlas. Its boundaries lie between meridians 5° and 6° west and parallels 33° and 34° north [31].
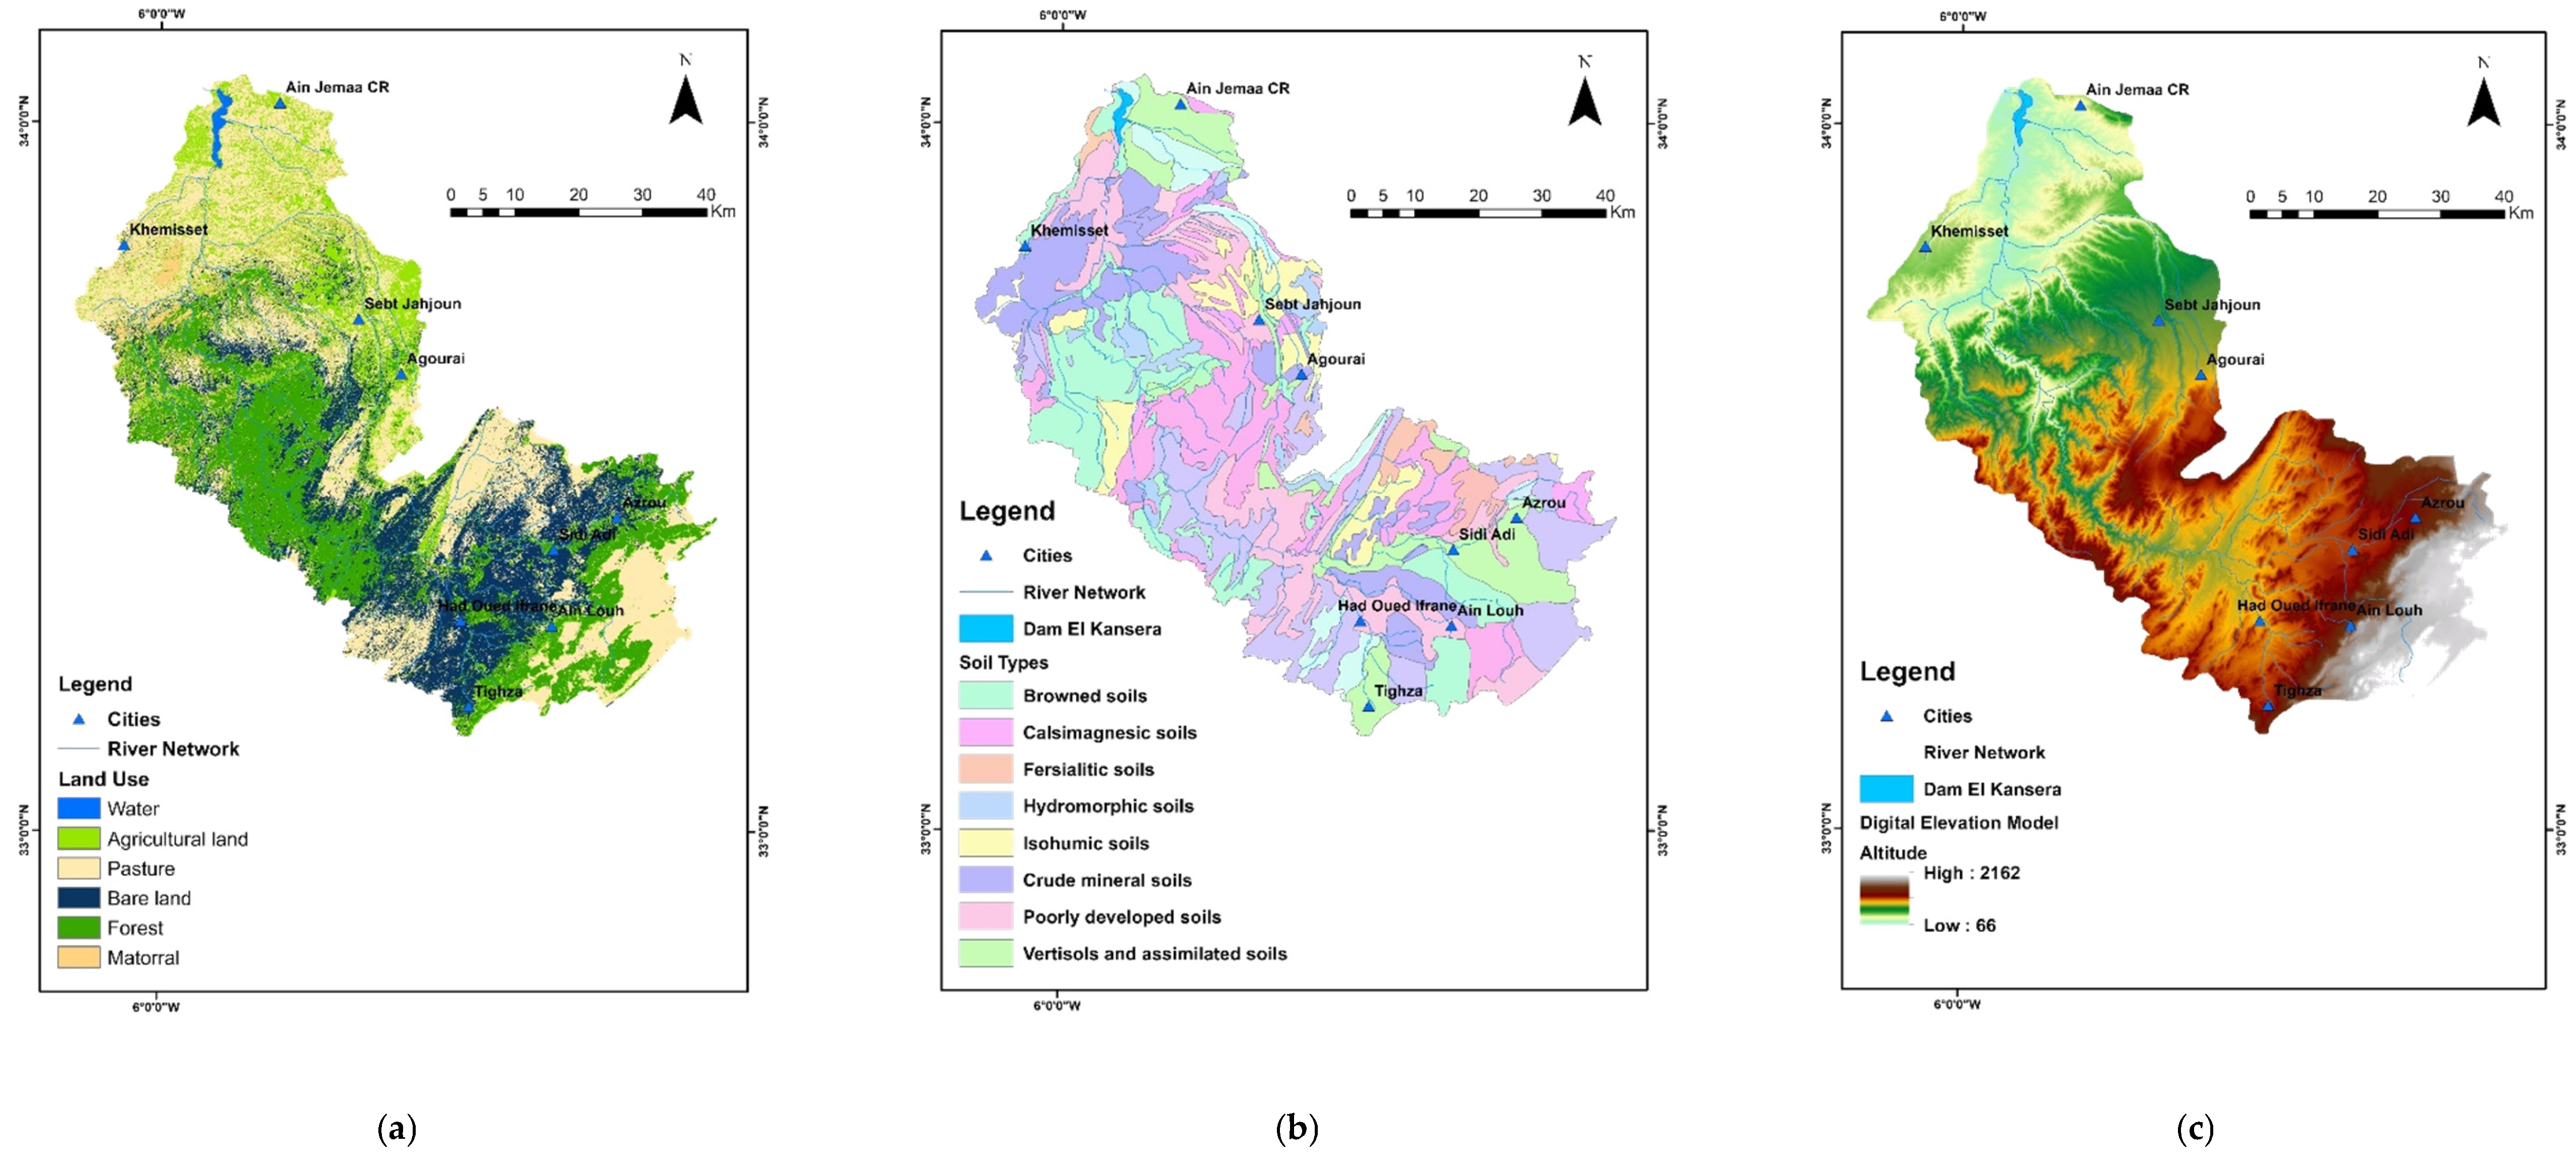
It is dominated by primary formations and has a highly varied mountainous appearance. Its altitudes follow a decreasing gradient from upstream to downstream. Its hydrographic network is 451 km long. The main river flows from southeast to northwest, originating at the confluences of the Oueds Tigrigra and Ifrane. Poorly developed soils, brown soils, Vertisols, and similar soils are the main soil types found in the basin. Rangeland predominates the land cover, accounting for 32% of vegetation cover, while forests make up 20% and agricultural land 18%. In total, 23% of the basin’s surface is bare land (Appendix A). The region has a Mediterranean climate, with summer droughts and heavy rainfall from violent storms. With 513 mm upstream and 340.7 mm downstream, the average annual rainfall is spatially heterogenous. Maximum monthly mean values are recorded in December for all rainfall stations, while minimum values are recorded in July. Temperatures range from 4.1 °C to 30.4 °C. On the other hand, the hydrological regime is characterized by periods of low water during the dry season and periods of high water, which occur mainly during the wet season [37].

2.2. Overall Methodology

The methodology employed includes initial hydrological modeling using the Soil and Water Assessment Tool (SWAT). Then, the generated flow data serve as a crucial component in the study of hydrological alteration and environmental flow components through the application of the Indicators of Hydrologic Alteration (IHA) model. In addition, a Standardized Precipitation Index (SPI) analysis is conducted to highlight the impact of droughts and wet periods on river flows.

2.3. Model Choices and Description

2.3.1. SWAT Model Setup

The Soil and Water Assessment Tool (SWAT) model is a widely used hydrological model that helps simulate the impacts of land management practices on water resources within a watershed. It is developed and maintained by the United States Department of Agriculture’s Agricultural Research Service (USDA) [38,39]. It is primarily used for watershed-scale assessments and provides valuable insights into the quantity and quality of water resources. It takes into account various factors to simulate the movement of water, sediment, nutrients, and agricultural chemicals within the watershed [40].
The SWAT model uses mathematical equations and algorithms to simulate hydrological processes, including precipitation, evaporation, infiltration, surface runoff, groundwater flow, and streamflow [41]. It can estimate the impacts of different land use scenarios, agricultural practices, and climate change on water availability and water quality indicators such as nutrient loading and sediment yield. It uses the following equation for estimating the water balance [41]:
S W t = S W 0 + i = 1 t ( R d a y Q s u r f E a W s e e p Q g w )
SWt: soil water content [mm];
SW0: initial soil water content [mm];
Rday: daily precipitation [mm];
Qsurf: surface runoff [mm];
Ea: evapotranspiration [mm];
Wseep: infiltration [mm];
Qgw: base flow [mm];
t: time [d].
  • Data requirements
The required climate variables for the SWAT model are daily precipitation, daily minimum and maximum temperature, daily mean wind speed, daily relative humidity, and daily solar radiation [39]. For precipitation data, measurements were provided by the Sebou Hydraulic Basin Agency (ABHS), while data for the other variables were sourced from the CFSR (Climate Forecast System Reanalysis) satellite data, which are closest to the observed station, openly available at the SWAT portal “https://globalweather.tamu.edu/ (accessed on 10 March 2023)”. CFSR data, produced by the National Centers for Environmental Prediction (NCEP) [42], are widely used to simulate the hydrological system in Moroccan watersheds [18,19,43] and have shown satisfactory results.
  • Model Calibration and Validation
The calibration of the SWAT model involved a sensitivity analysis to identify the important SWAT parameters to focus on during the procedure, using the SUFI-2 (Sequential Uncertainty Fitting) program [44,45]. To perform the sensitivity analysis, we first defined the optimized objective function in order to compare the observed and simulated flows. It is based on several statistical indices such as the Nash–Sutcliffe coefficient [46], the coefficient of determination (R2), and the root mean square error (RSR). Then, the most significant input parameters affecting the flows in the watershed were identified. Finally, a global sensitivity analysis was conducted in order to reduce the number of parameters to be calibrated, excluding those that have a negligible influence on the studied process.
Considering the spatial heterogeneity and the large area of the Beht River basin, multi-site or sequential calibration was implemented, which has been proposed by some researchers [47,48], which consists of calibrating the model at several points that generally represent the gauging stations. Then, for the validation step, the best performing parameter selected during the calibration were used to re-simulate flows on a new dataset.

2.3.2. IHA Model Setup

In order to characterize natural water conditions, assess changes in flow regimes resulting from human activity and hydraulic infrastructure, and determine the degree of hydrological alteration, the US Nature Conservancy developed a technique known as Indicators of Hydrological Alteration, or IHA [49,50]. Almost 2000 hydrologists, researchers, policymakers, and managers of water resources have used the IHA worldwide [51].
The IHA model generates two types of flow statistics: 33 IHA statistics and 34 flow statistics calculated for five different environmental flow components (EFCs).
The 33 IHA parameters are divided into five groups (magnitude, duration, amplitude, frequency, and timing) as part of the annual flow regime. The five main attributes are programmed into the IHA for their influence on aquatic species at different stages of their life cycle. The IHA model enables simple comparison of the hydrological attributes of a site before and after a certain project activity, or of two sites with different types or levels of impact. It provides a statistical measure of change in the central tendency or degree of variation of an attribute of interest [28].
The 34 environmental flow component statistics are a more recent series of hydrological flow parameters and have been developed to identify and calculate statistics on hydrological events such as floods and droughts. These flow components have been determined to be ecologically essential and included in the IHA tool as “environmental flow components” [52]. Each of these flow components has a respective role in the life of an organism. This classification is also based on the fact that each of these groups consists of a flow event that is characteristic of a natural river hydrograph and is ecologically significant.
  • Data requirements
In order to define the hydrological regime and assess its alteration, as well as the environmental flow components, it is crucial to conduct a comprehensive analysis of the previous and current states of the hydrological regime, termed pre-impact (1970–1992) and post-impact (1993–2014) periods. The analyses were based on daily flow data obtained by applying the SWAT model, calibrated using measurements of daily precipitation and observed flow records at the El Kansera station from 1970 to 2014. The selection of the pre-impact and post-impact periods was driven by the need to understand the historical hydrological regime and changes that have been caused by human activity and climate change. Notably, these time frames encompass a significant environmental transition, characterized by a prolonged period of drought followed by a rainy period. This succession of contrasting climatic conditions underscores the importance of understanding how such variations influence the hydrological dynamics of the river over time.
This comprehensive approach aims to anticipate long-term trends and potential alterations due to anthropogenic action, coupled with the impacts of climate change on river systems, thereby contributing to informed decision-making and adaptation strategies. All parameters were calculated using non-parametric statistics (median and coefficient of dispersion).

2.3.3. Drought Analysis Using the Standardized Precipitation Index (SPI)

The SPI was calculated at three different timescales, 6, 12, and 36 months, based on monthly precipitation data covering the period from 1970 to 2014 and was computed using the gamma distribution, with distribution parameters estimated through the probability-weighted moments (PWMs) method under the programming language R. In addition, a drought event analysis was carried out to identify drought events and their characteristics in terms of duration, magnitude, intensity, and frequency. These indicators were used to complement the IHA results and to better understand the role of drought dynamics in shaping the hydrological alterations observed in the selected periods.

3. Results

3.1. SWAT Model

Use of the SWAT hydrological model of Beht basin was conducted using model calibration, validation, and sensitivity analysis.

3.1.1. Sensitivity Analysis

In order to optimize the implementation of this procedure for the Beht basin, a sensitivity analysis using the OAT (Once at Time) type was first performed. This sensitivity analysis allowed us to classify the sensitive parameters according to their degree of influence (the significant parameter is the one with the lowest p-value and the highest t-stat value). Among 21 parameters, 11 were found to be influential (Table 1).
Among the eleven parameters that most influence hydrological modeling (Table 1), we noticed the presence of parameters related to surface flow (Curve Number “CN2”), groundwater flow (aquifer recharge time “GW_DELAY, ALPHA_BF, GWREVAP, GWQMN, REVAPMN”), evaporation (soil evaporation factor as function of depth “ESCO”), soil (soil water content “SOL_AWC”), and basin routing (CH_K2).
The sensitivity of the model to these calibrated parameters confirms the findings of some studies already carried out in areas with similar characteristics in terms of the semi-arid climatic context [19,24,25,53]; so, as can be seen, most of the sensitive parameters are generally groundwater-related.

3.1.2. Model Calibration/Validation

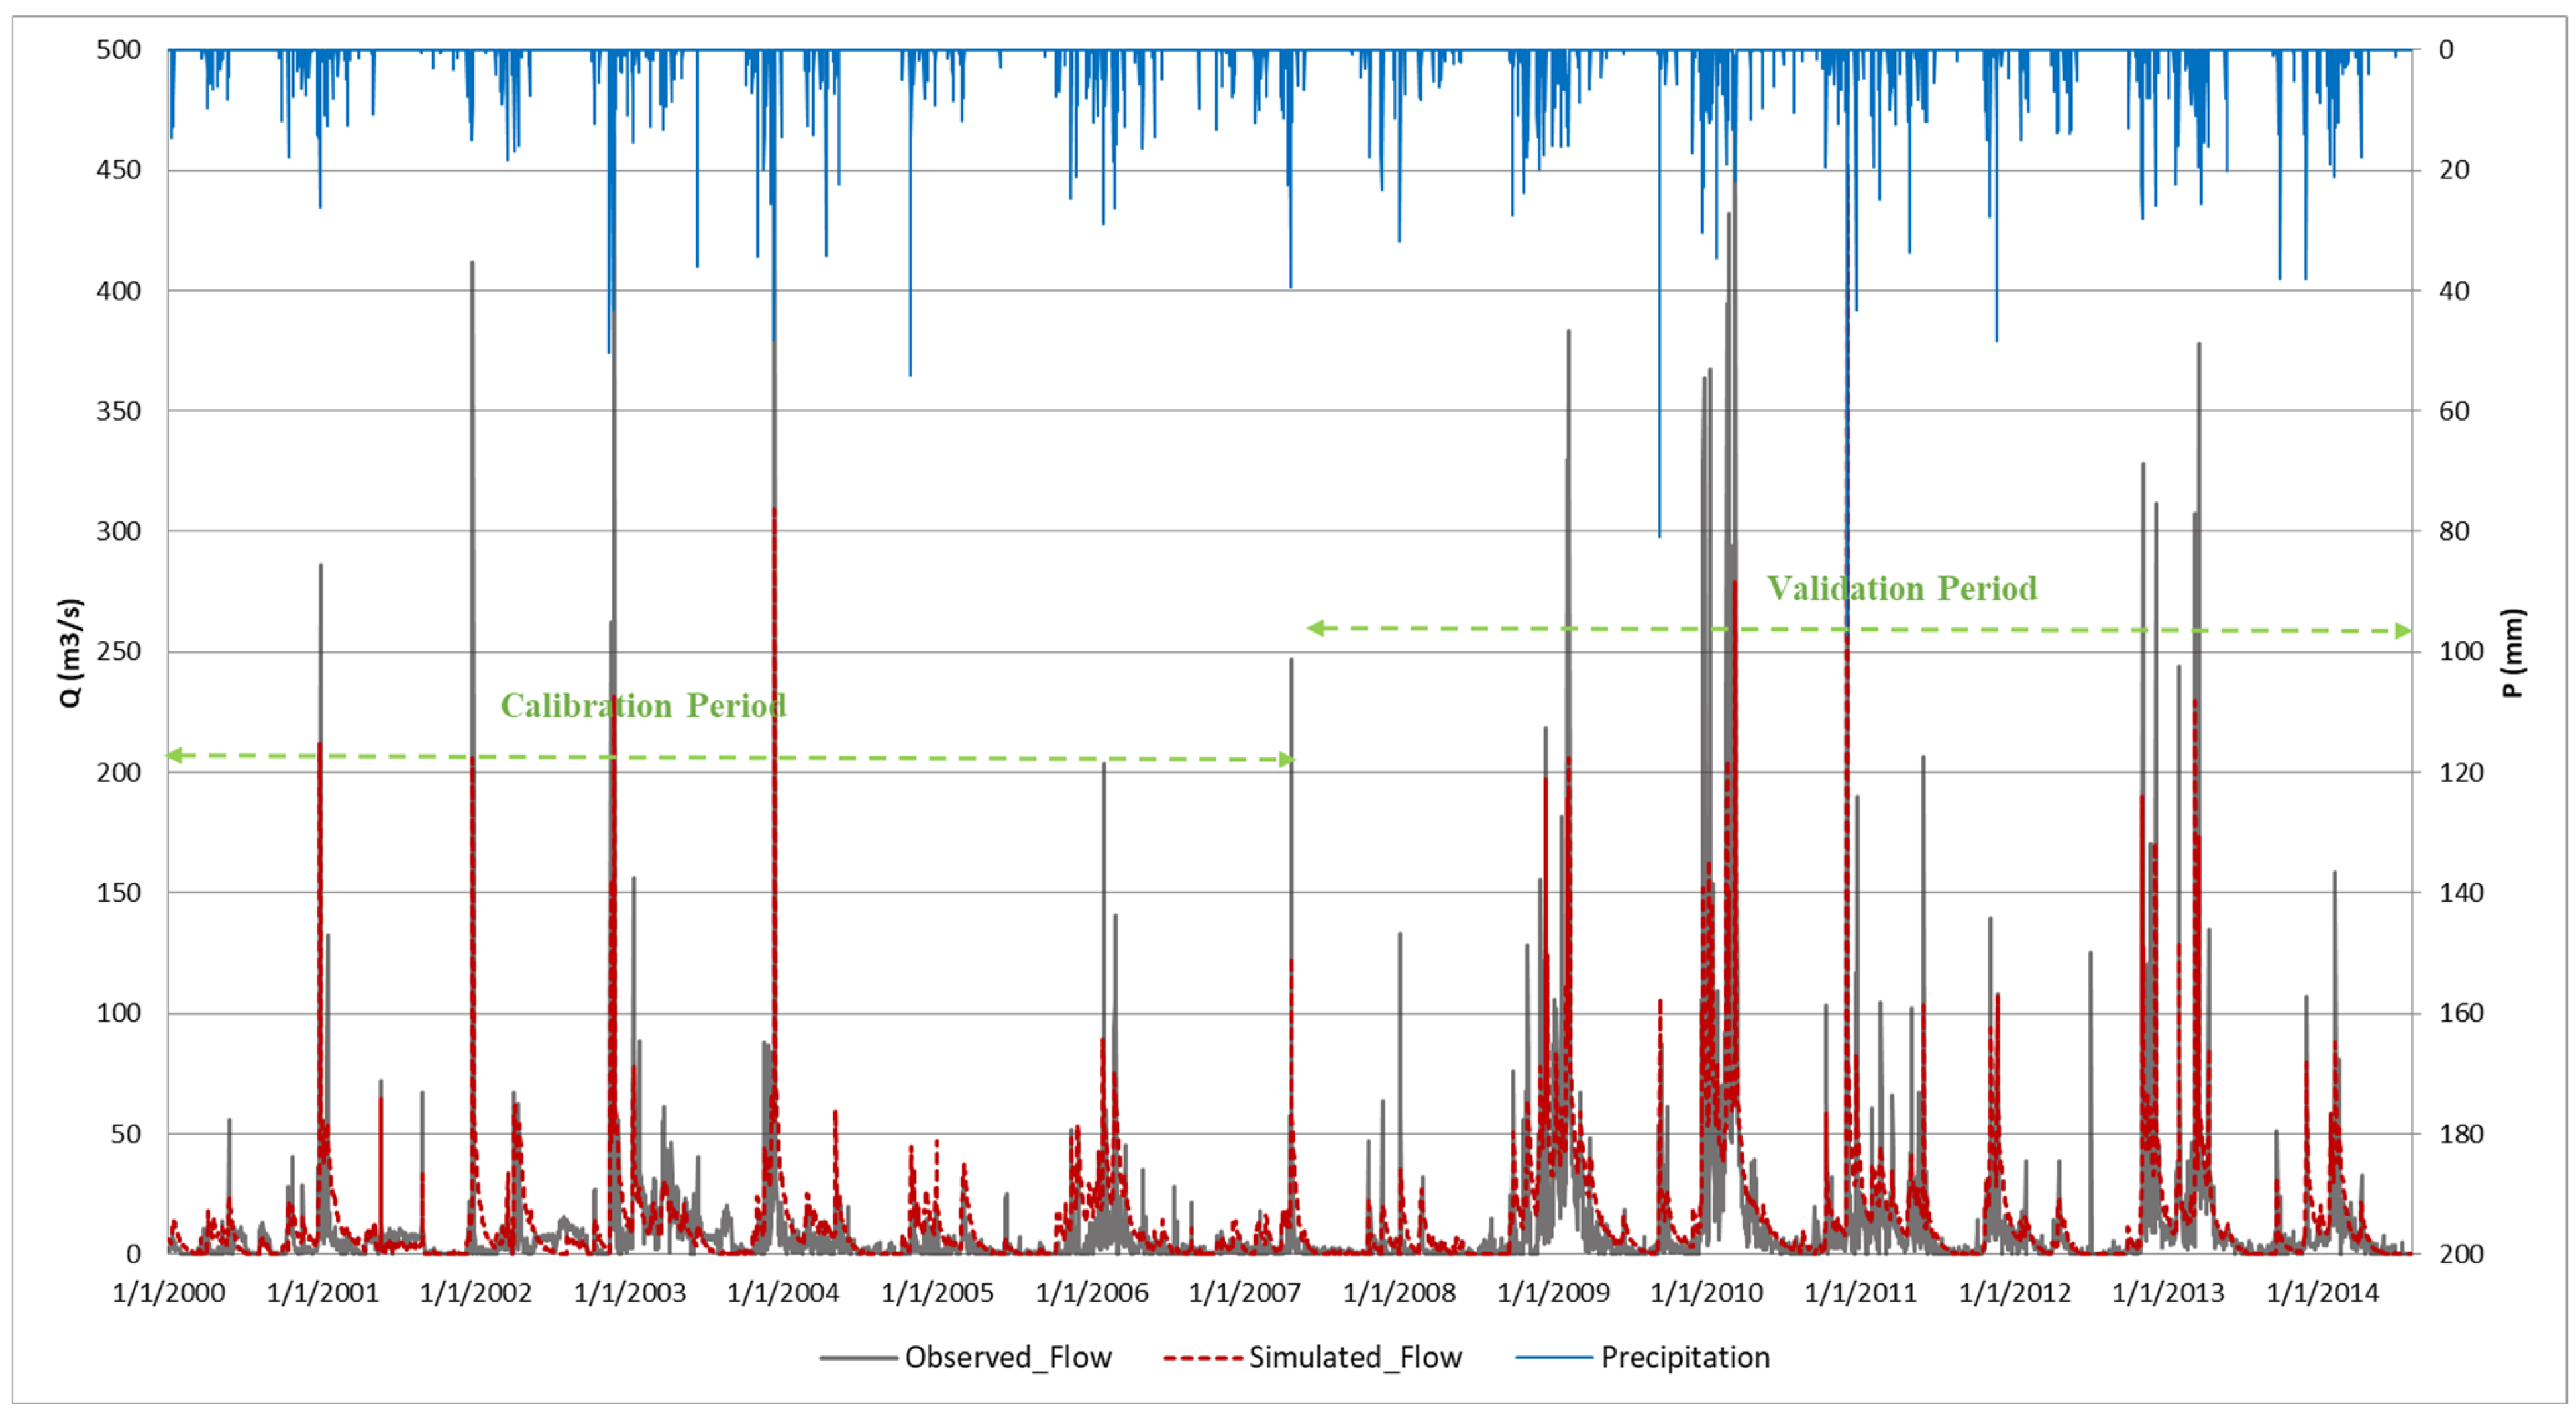
The data presented in Figure 2 correspond to the observed and simulated daily flow calibration and validation for El Kansera gauging station in the outlet of the watershed. This figure shows that the model successfully simulates the flow variation and represents well the different daily peaks, with underestimation of most peak flows and overestimation of base flows. Therefore, the uncertainties in peak flows may be related to the complexity of the watershed characteristics, which may contribute significantly to a relative imperfection in the model.
Previous studies developed for arid and semi-arid basins [24,54,55,56,57,58,59] have used statistical performance criteria such as R2, NSE, and RSR. Reference [60] suggested that the NSE value should not exceed 0.5 and the RSR value should not exceed 0.7 to be able to judge the hydrological calibration and validation as satisfactory; [61] proposed that an R2 value greater than (or equal to) 0.6 is a satisfactory indicator of good SWAT model calibration/validation.
Table 2 lists the calibration evaluation results in daily time step at the El Kansera station. The values indicate good model performance according to the recommended model performance evaluation criteria [60], which resulted in satisfactory simulation of the SWAT model in the studied watershed. Other authors have achieved almost similar results under semi-arid climate conditions [13,19,24,53,62].

3.2. IHA Model

Generally, the IHA model is used to assess the impact of the installation of stations and/or dams on the hydrological regime of a river [63,64,65] or the impact of climate change [66]. In our case study, the dam was created in 1934, but earlier hydrometeorological data are not available. Nevertheless, a study of the earlier and most recent decades of the hydrological regime, referred to as pre- and post-impact periods, is necessary as an initial step in assessing the impact of changes over the last four decades in the Beht River basin.
The findings from the IHA study clarify alterations in 33 ecological indicators, indicating impacts on the river ecology and water flow caused by human activities, categorized into five groups, along with environmental flow components.

3.2.1. IHA Components

Table 3 provides a comprehensive summary of the IHA results, showing pre- and post-impact values for all five groups.
1.
Group 1: Magnitude of monthly flows
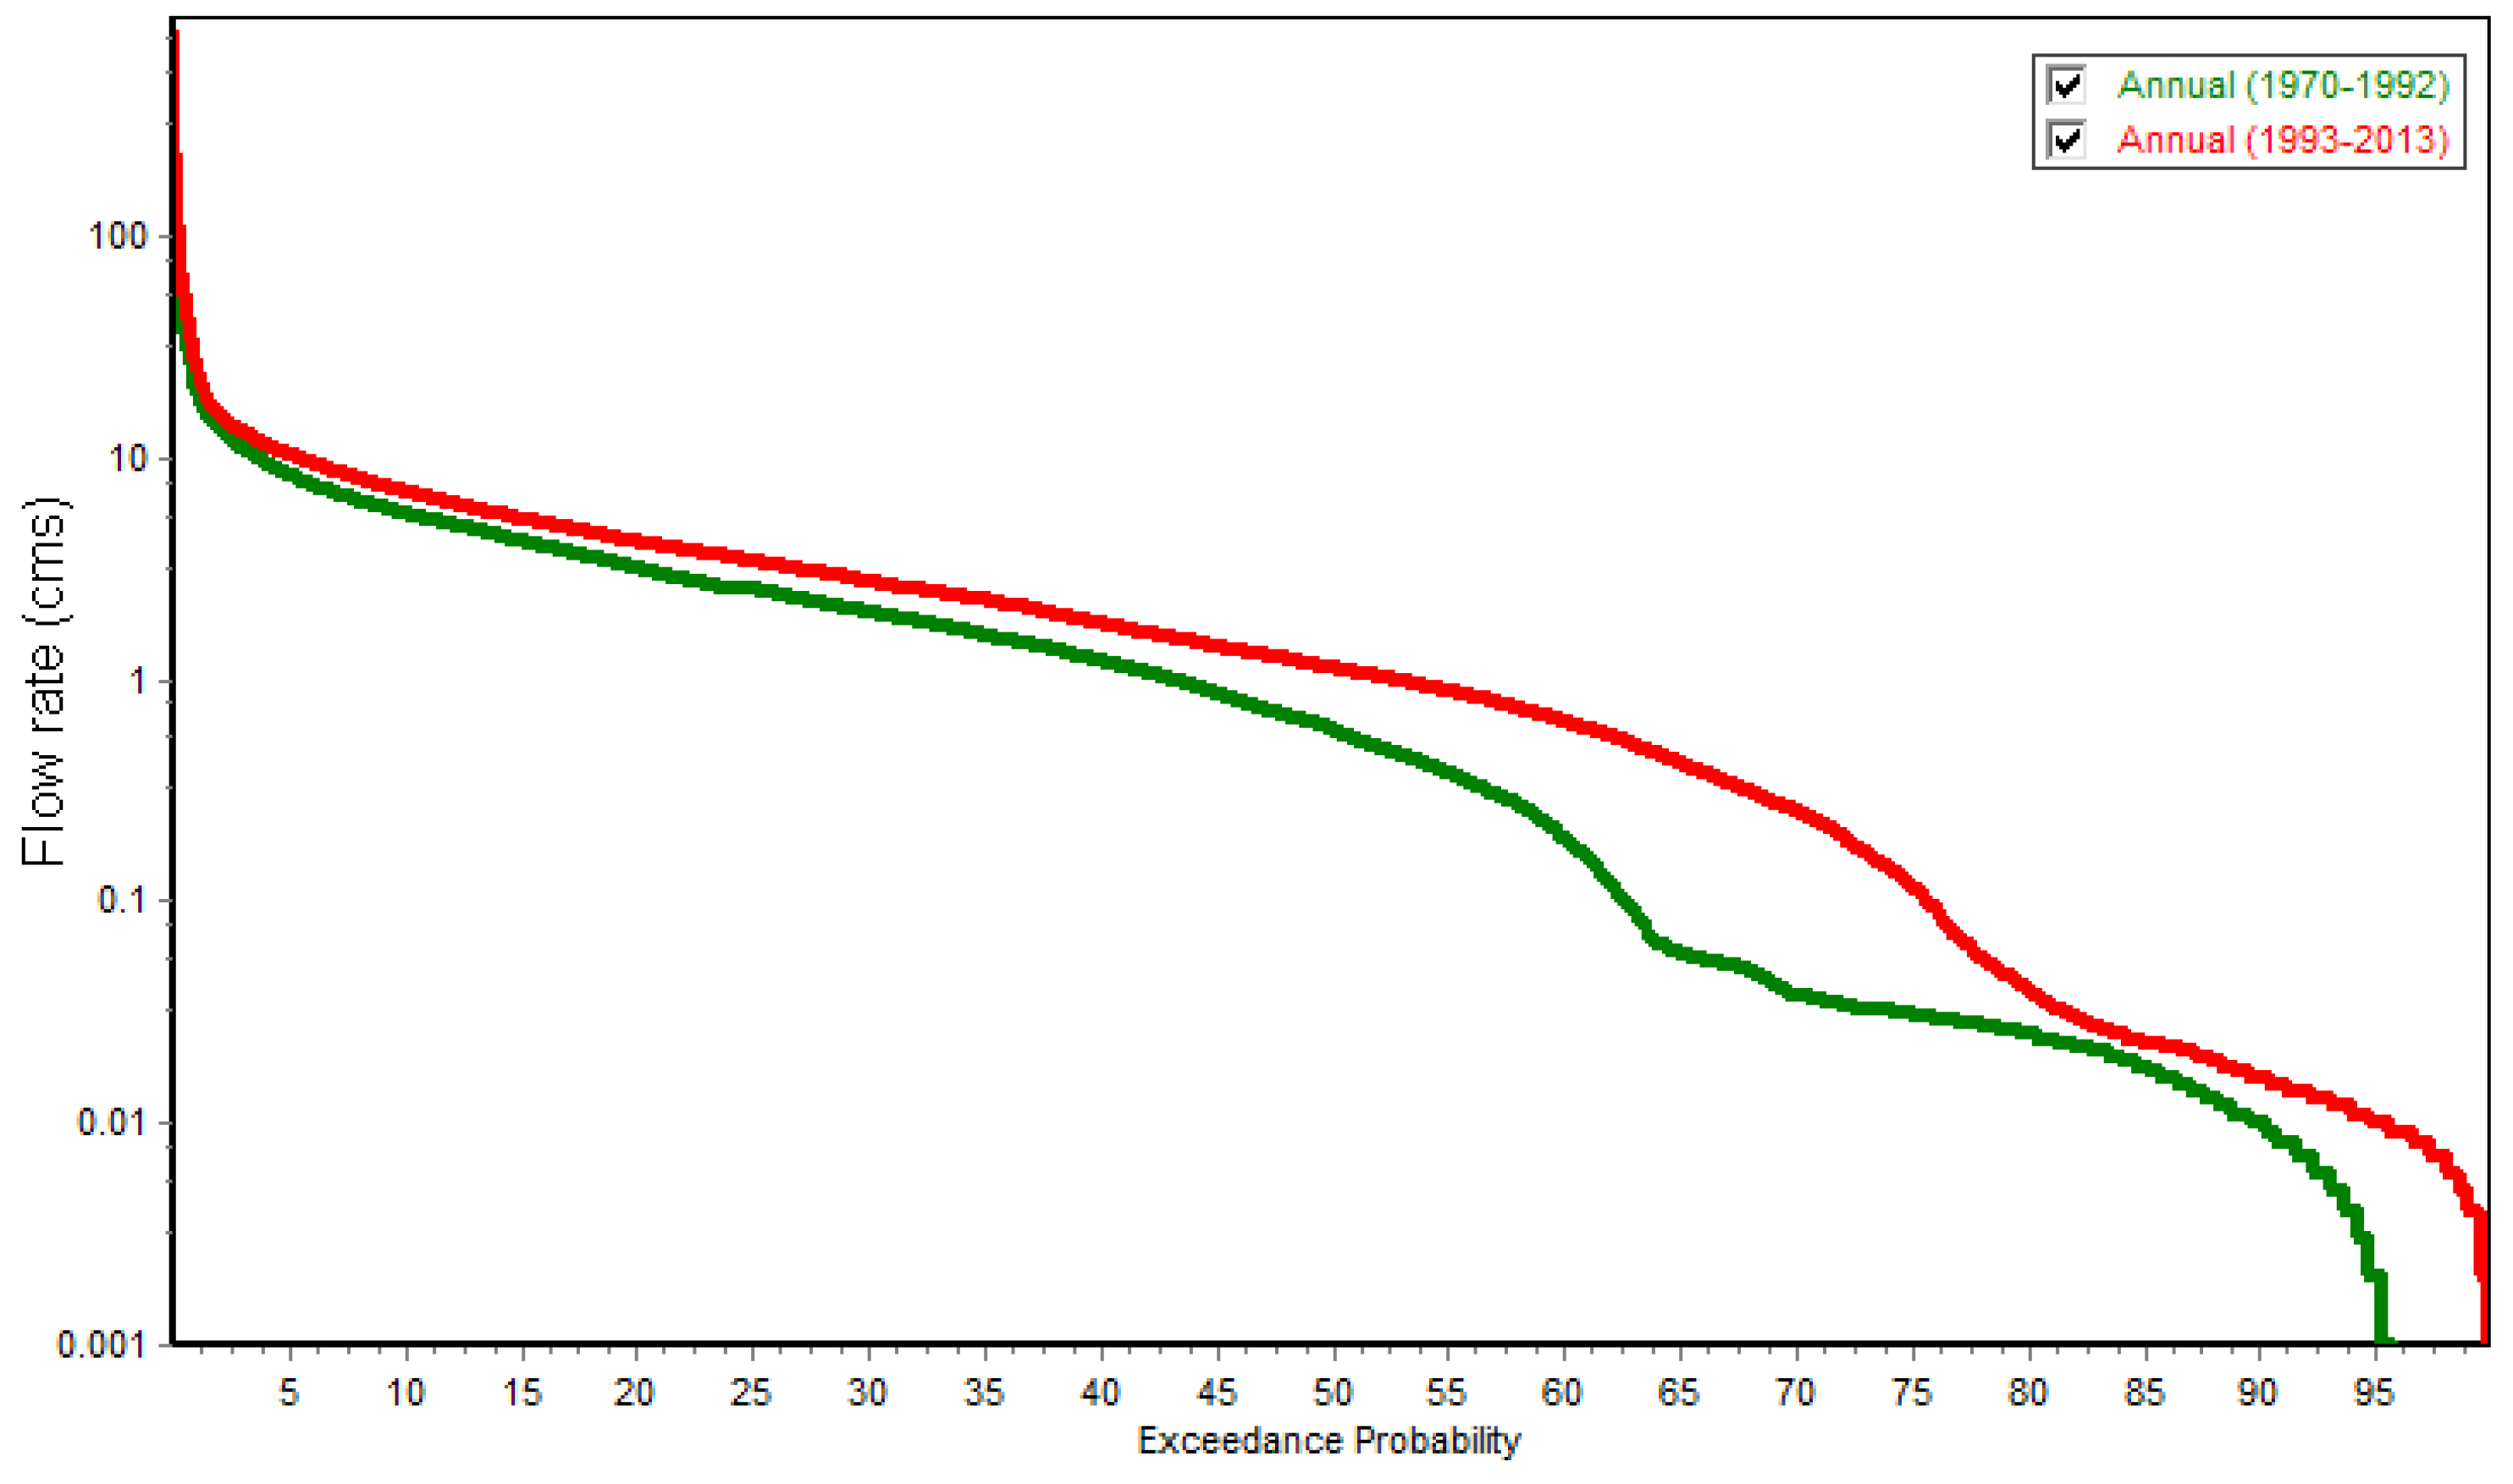
Figure 3 shows the flow duration curves for each month, as well as the annual series. The significance of this graph lies in the ability to assess the probability of exceeding a certain flow magnitude on a given day of a month. Note that the y-axis is represented on a logarithmic scale. The shape of the curve in high and low-flow regimes is particularly important in assessing the characteristics of the river. At high flows, the curve is less abrupt, indicating that high flows occur over several days in both periods. The lower limit, on the other hand, presents a smooth curve, indicating that the capacity of the basin can support low flows during the dry season. These flows are maintained throughout the year due to natural streamflow conditions and/or the high capacity of the groundwater that supports the base flow of the stream. A comparison between the two periods analyzed shows that low and medium flows have increased over the period 1993–2014.
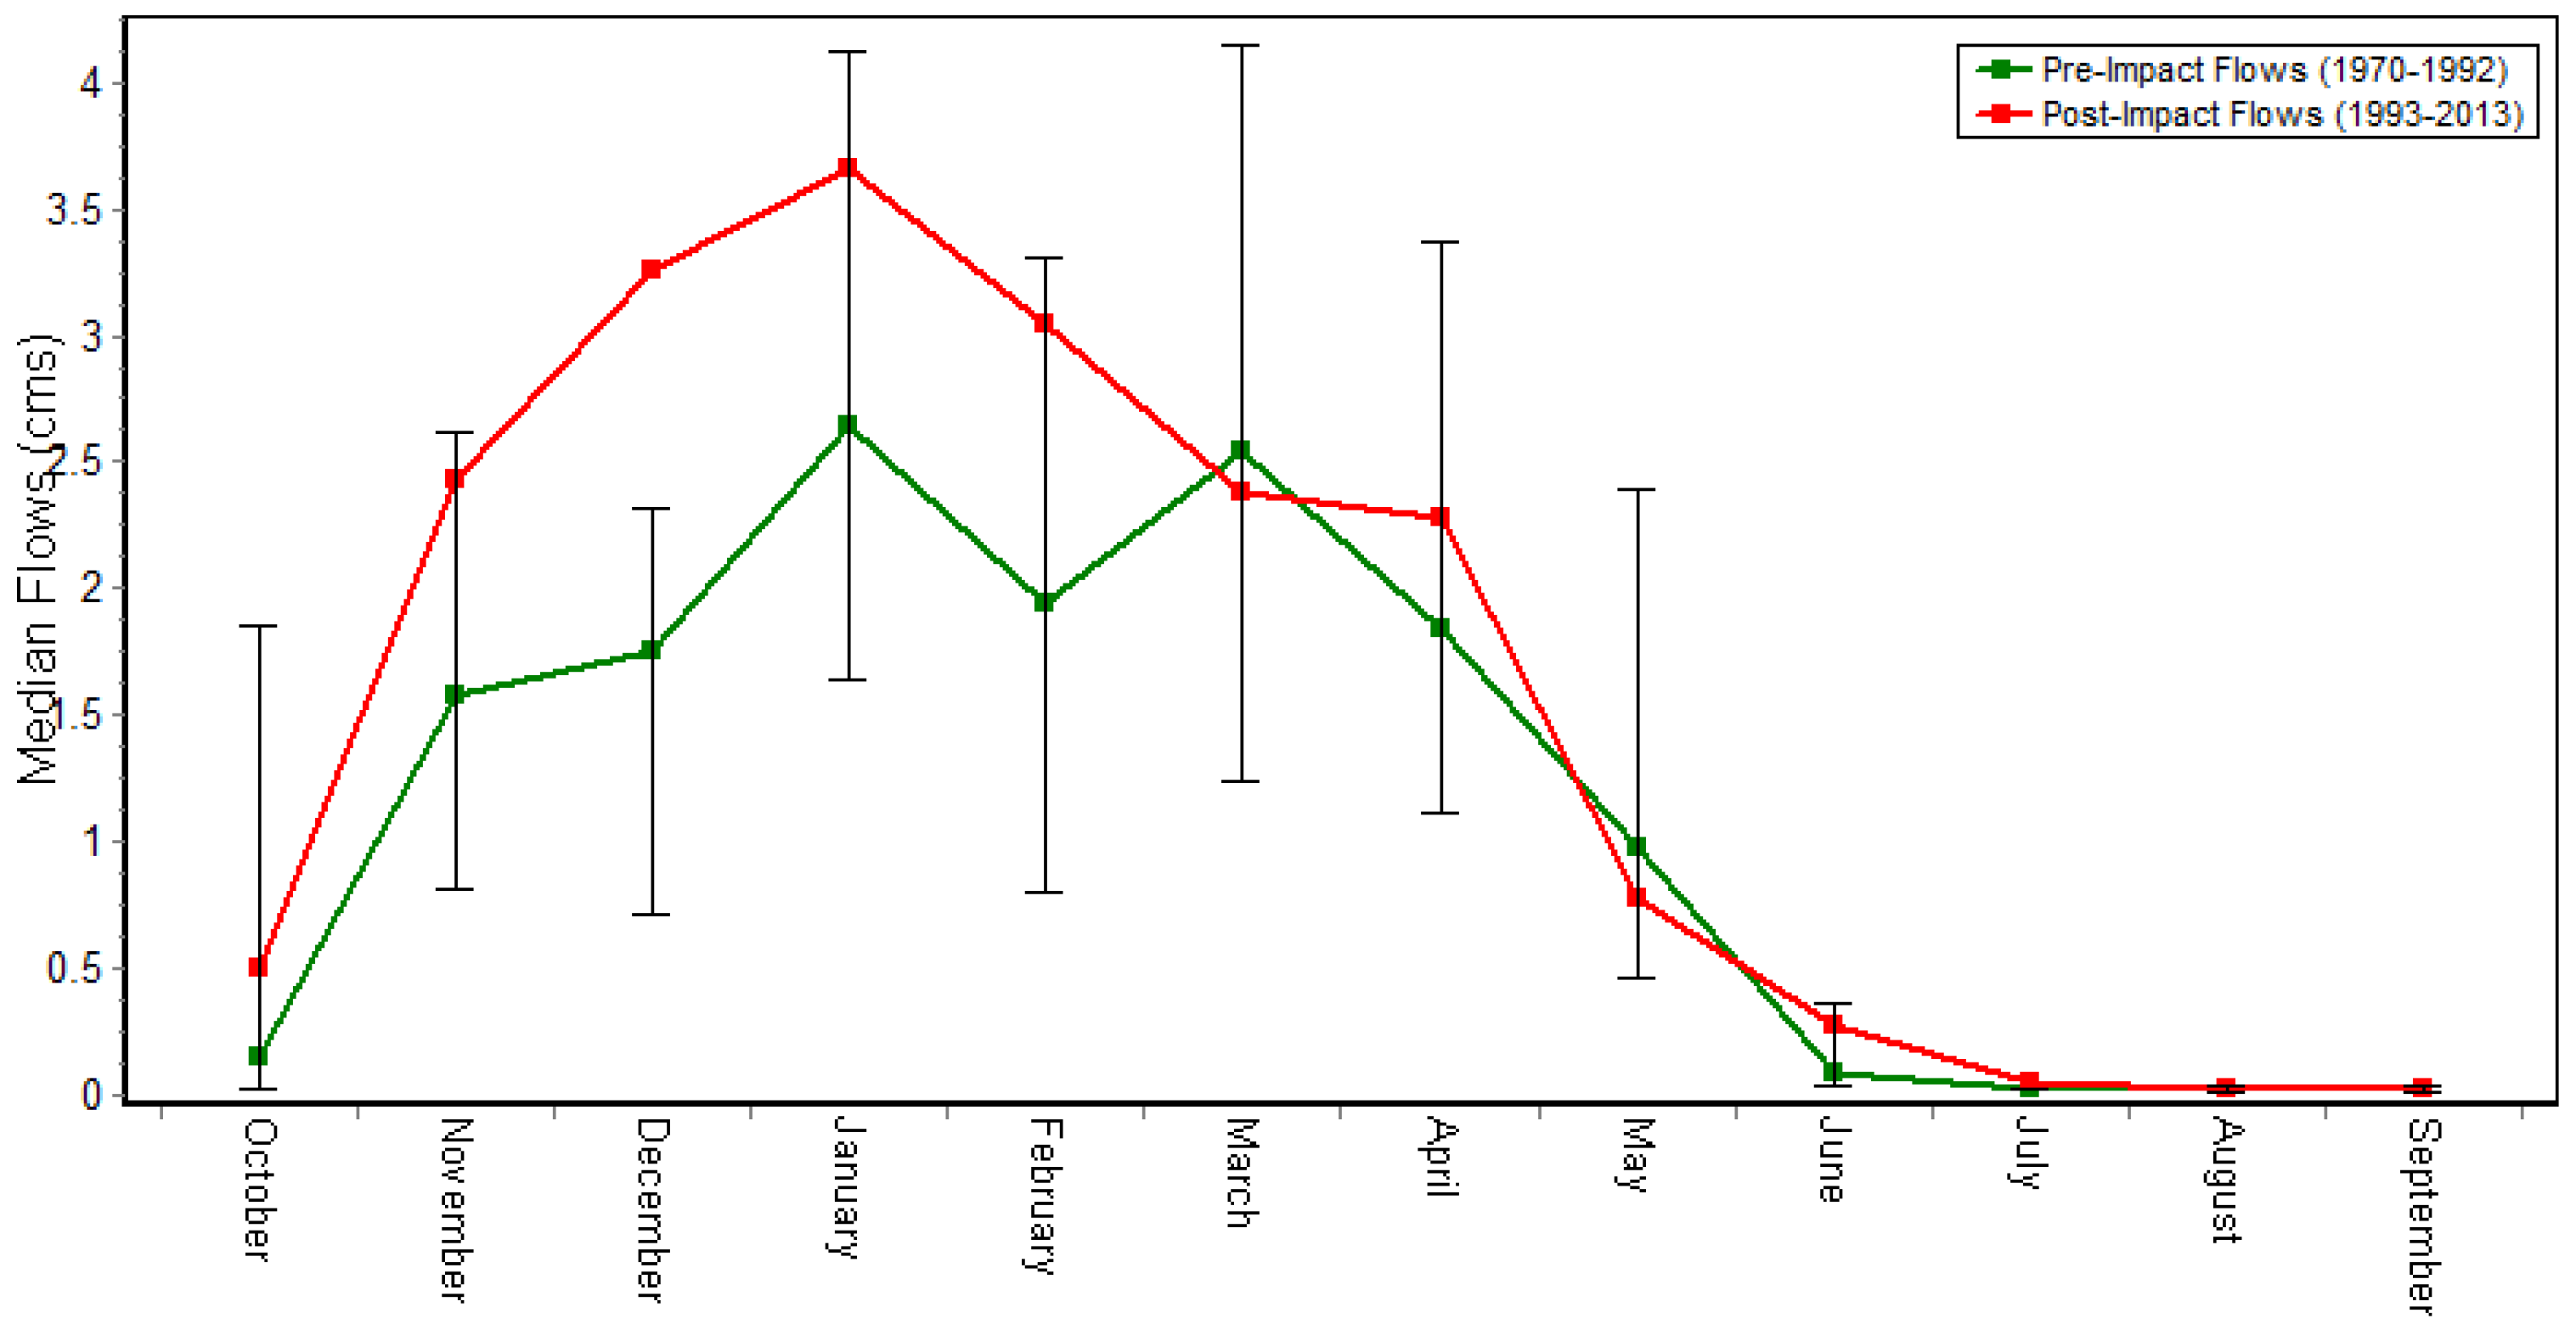
Figure 4 shows the variation in monthly flows between the two periods, indicating however an increase in median flows during the humid period from October to February, with an increase recorded in April. These results are reflected in Table 3, which shows an exceptional increase in the months of October, December, and June, indicated by relative variation values of 227%, 85%, and 193%, respectively.
Additionally, Figure 5 demonstrates changes in flow distribution for the most wet month (January) and the driest month (July), including the percentiles 25th, 50th, and 75th. These alterations are linked to the different weather conditions observed across the two periods studied: from dry to exceptionally wet, with intense rainfall and flooding events, in the post-period. These findings underline the influence of climate variability on river flow dynamics.
2.
Group 2: Magnitude and duration of extreme conditions
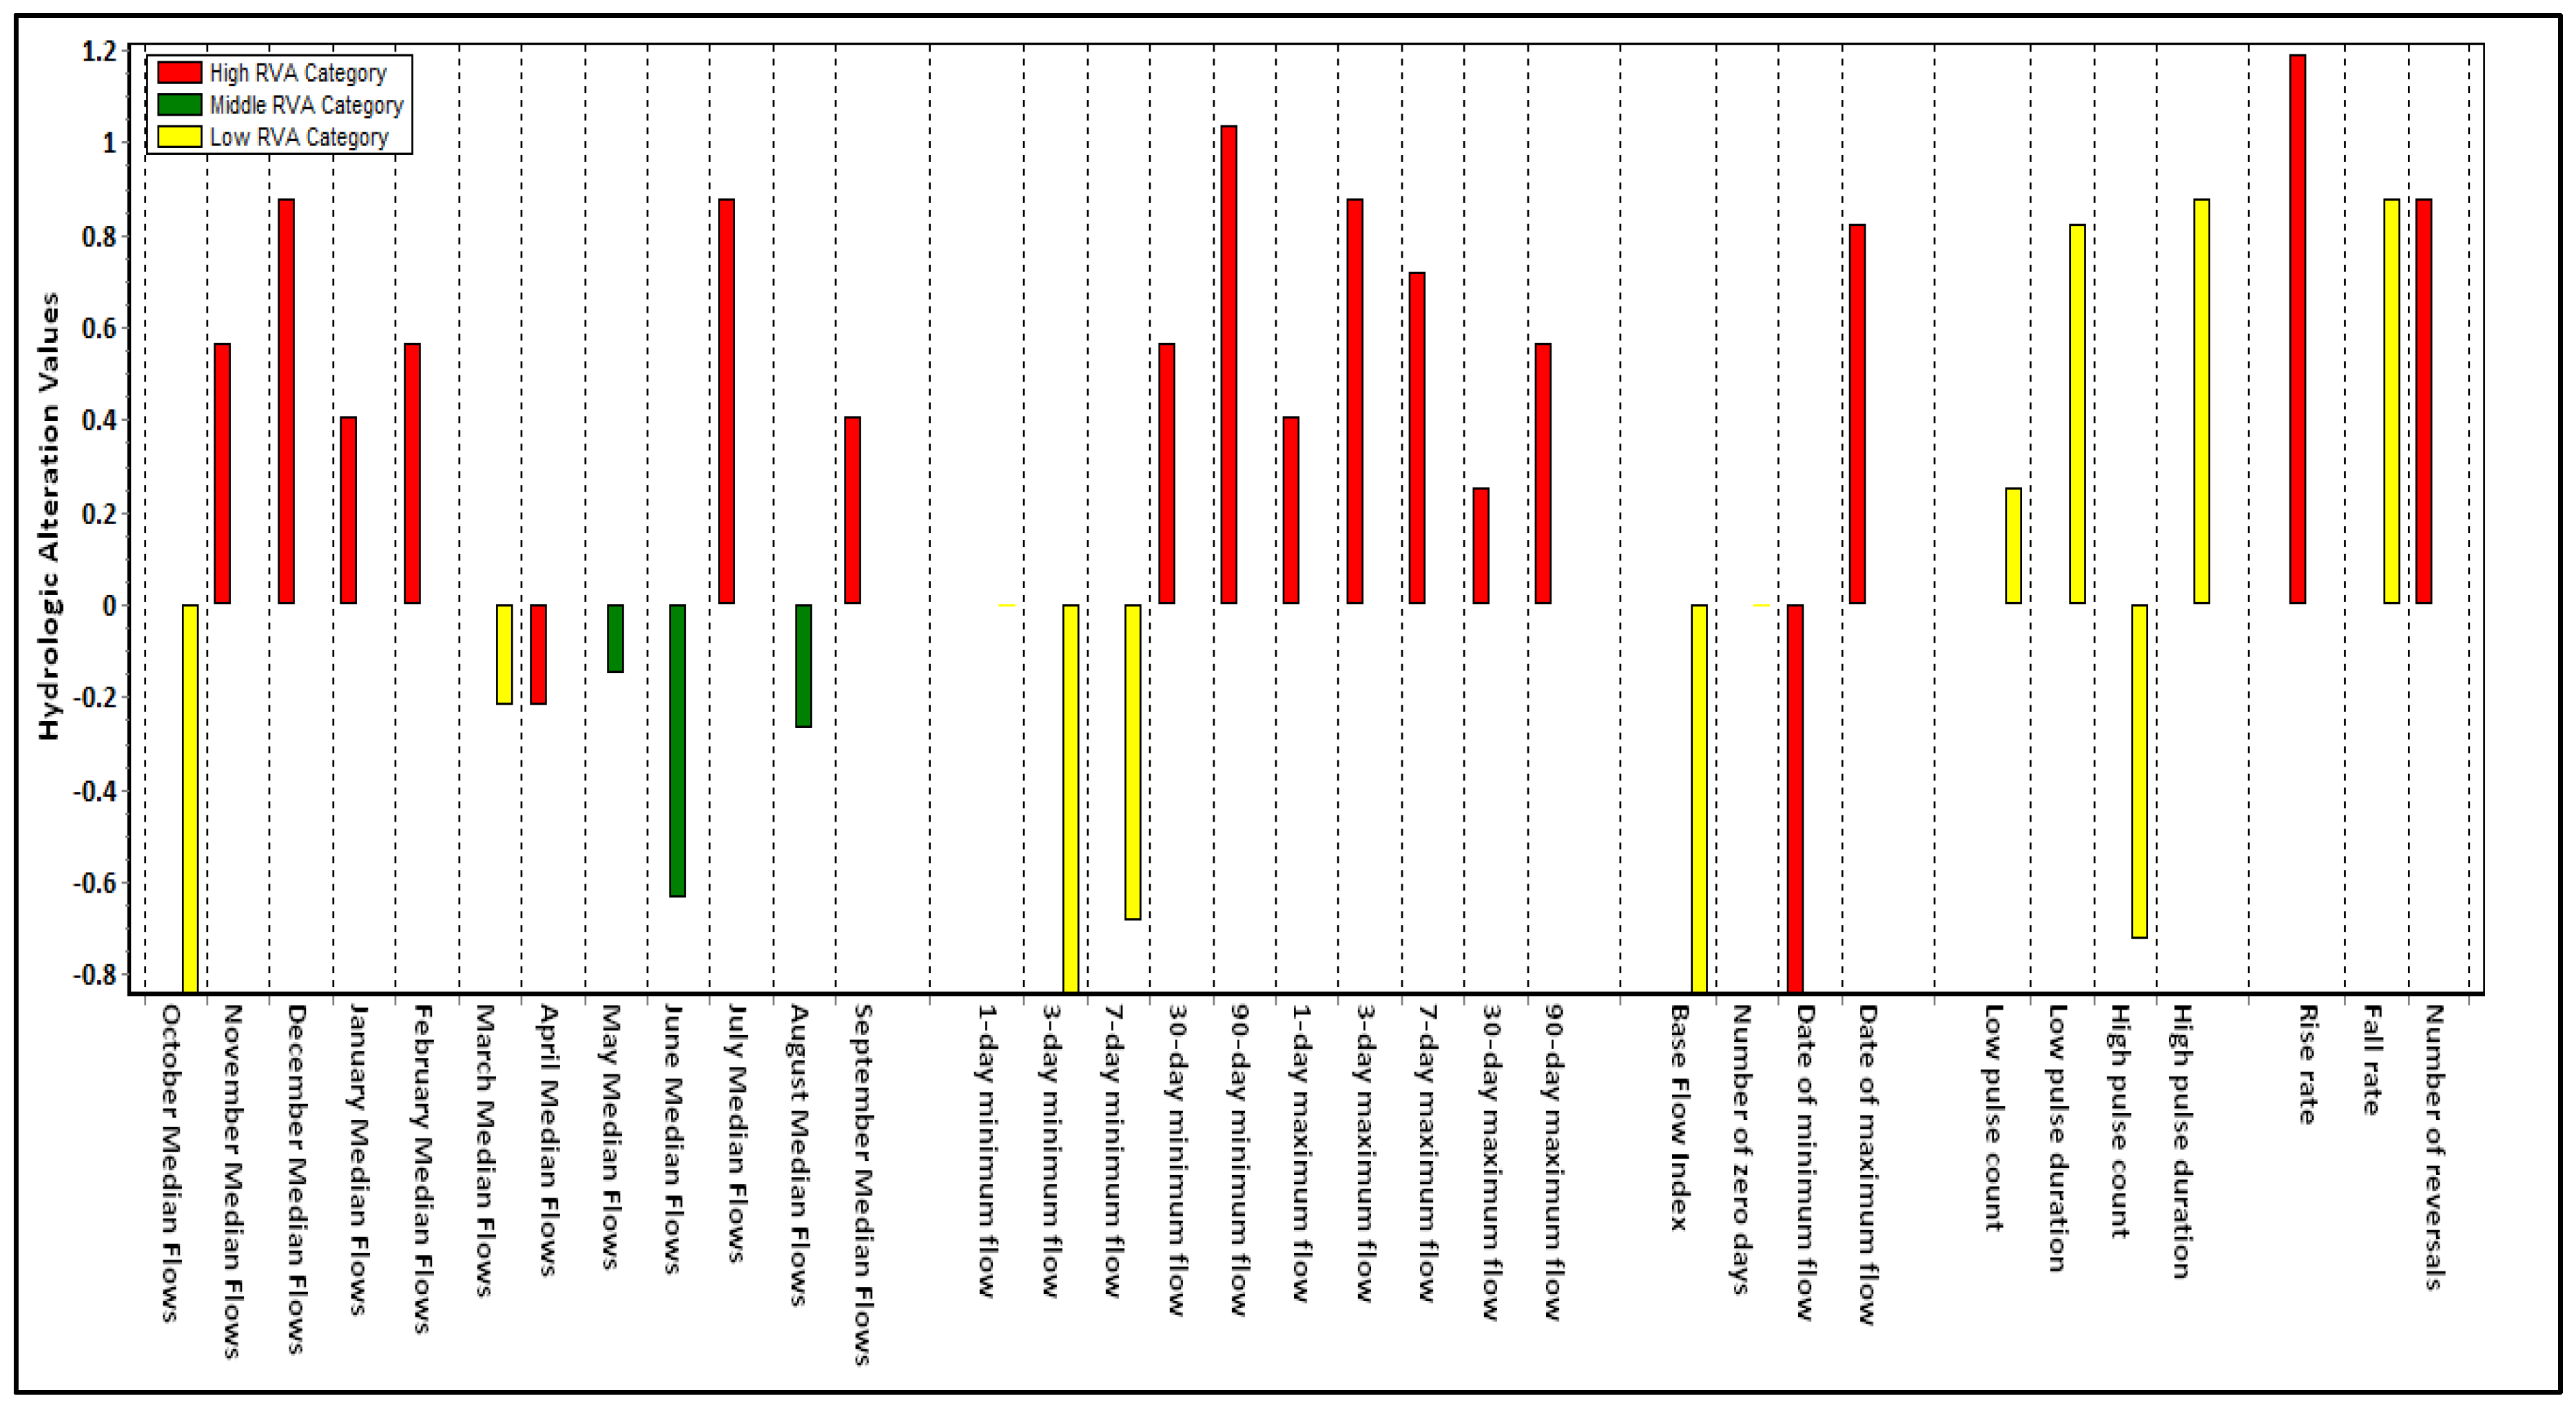
Figure 6 displays the most significant hydrological changes in the study area, detailing the Range of Variability Approach (RVA) classifications (high, medium, low) for each of the 33 hydrological factors. The analysis of the RVA showed a rise in the occurrence frequency of the majority of indicators, primarily in the high RVA category, identified as a major hydrological change.
In particular, there is a marked increase in the frequency of 1-, 3-, 7-, and 90-day maximum flows, indicating higher flood magnitudes and frequency. In terms of minimum flows, the 1- to 7-day minimum flows show negative RVA alterations, indicating lower short duration flows, while 30- and 90-day minimum flows exhibit positive RVA values, suggesting higher baseflow, and this is consistent with the increase in the 90-day minimum flow of 155.71%, in comparison to the 1- to 30-day minimums, which showed lower or even negative flow changes between −9.18% and 2.25%. The significant increase in monthly median flows in October and July supports this trend, with the July increase due to an increase in baseflow, which is confirmed by the baseflow index indicating a negative value. The findings suggest that there has been a notable amount of environmental stress and disruption along the river [67].
3.
Group 3: Timing of extreme annual water conditions
Table 3 presents the findings. The post-impact period showed an increase of 2.16% in the Julian date of each 1-day annual minimum, with a negative alteration degree of −0.8. Similarly, the Julian date of each 1-day annual maximum increased by 5% over the last two decades compared to the two decades before, and Julian days have shifted from 317 pre-impact to 334 post-impact, with a positive alteration value of 0.8. Such a shift of almost a month will have an effect on the aquatic ecosystem, such as spawning and migration, leading to a loss of biodiversity.
4.
Group 4: High and low-flow pulses
The results of group 4 (Table 3) indicate that there has been no significant change in the frequency of low pulses, with a hydrological alteration value of 0.2. The duration of both low and high pulses has decreased, suggesting shorter periods of drought conditions. In general, an increase in flash drought phenomena can be observed. The decrease is −50% for low pulse duration and −34.6% for high pulse duration. Overall, low and high pulse duration as well as high pulse frequency are all noticeably changed and altered by 0.82, 0.87, and −0.7, respectively. The general health of aquatic ecosystems can be impacted by decreased pulse durations, which may cause problems with biological processes including nutrient cycling and sediment transport.
5.
Group 5: Rate and frequency of flow changes
The IHA group 5 parameters show the rate of rise, the rate of fall, and inversions. In general, these factors give details about sudden fluctuations in annual flow. The findings from Table 3 show a 145% increase in the rate of rise, indicating the appearance of more flash flood events, and a 23.8% slight change in the rate of fall, indicating that river biodiversity experiences higher stress and specific measures should be decided for its preservation. More severe drought events cause stress to aquatic habitats and species and may transform some parts of the river network from perennial to intermittent flow. The rate of rise is strongly altered, with a value of 1.19. The rate of fall of the hydrological alteration value is high (0.87). Thus, the number of inversions is strongly altered (0.87).

3.2.2. Environmental Flow Components, Duration and Timing

1.
Environmental flow components
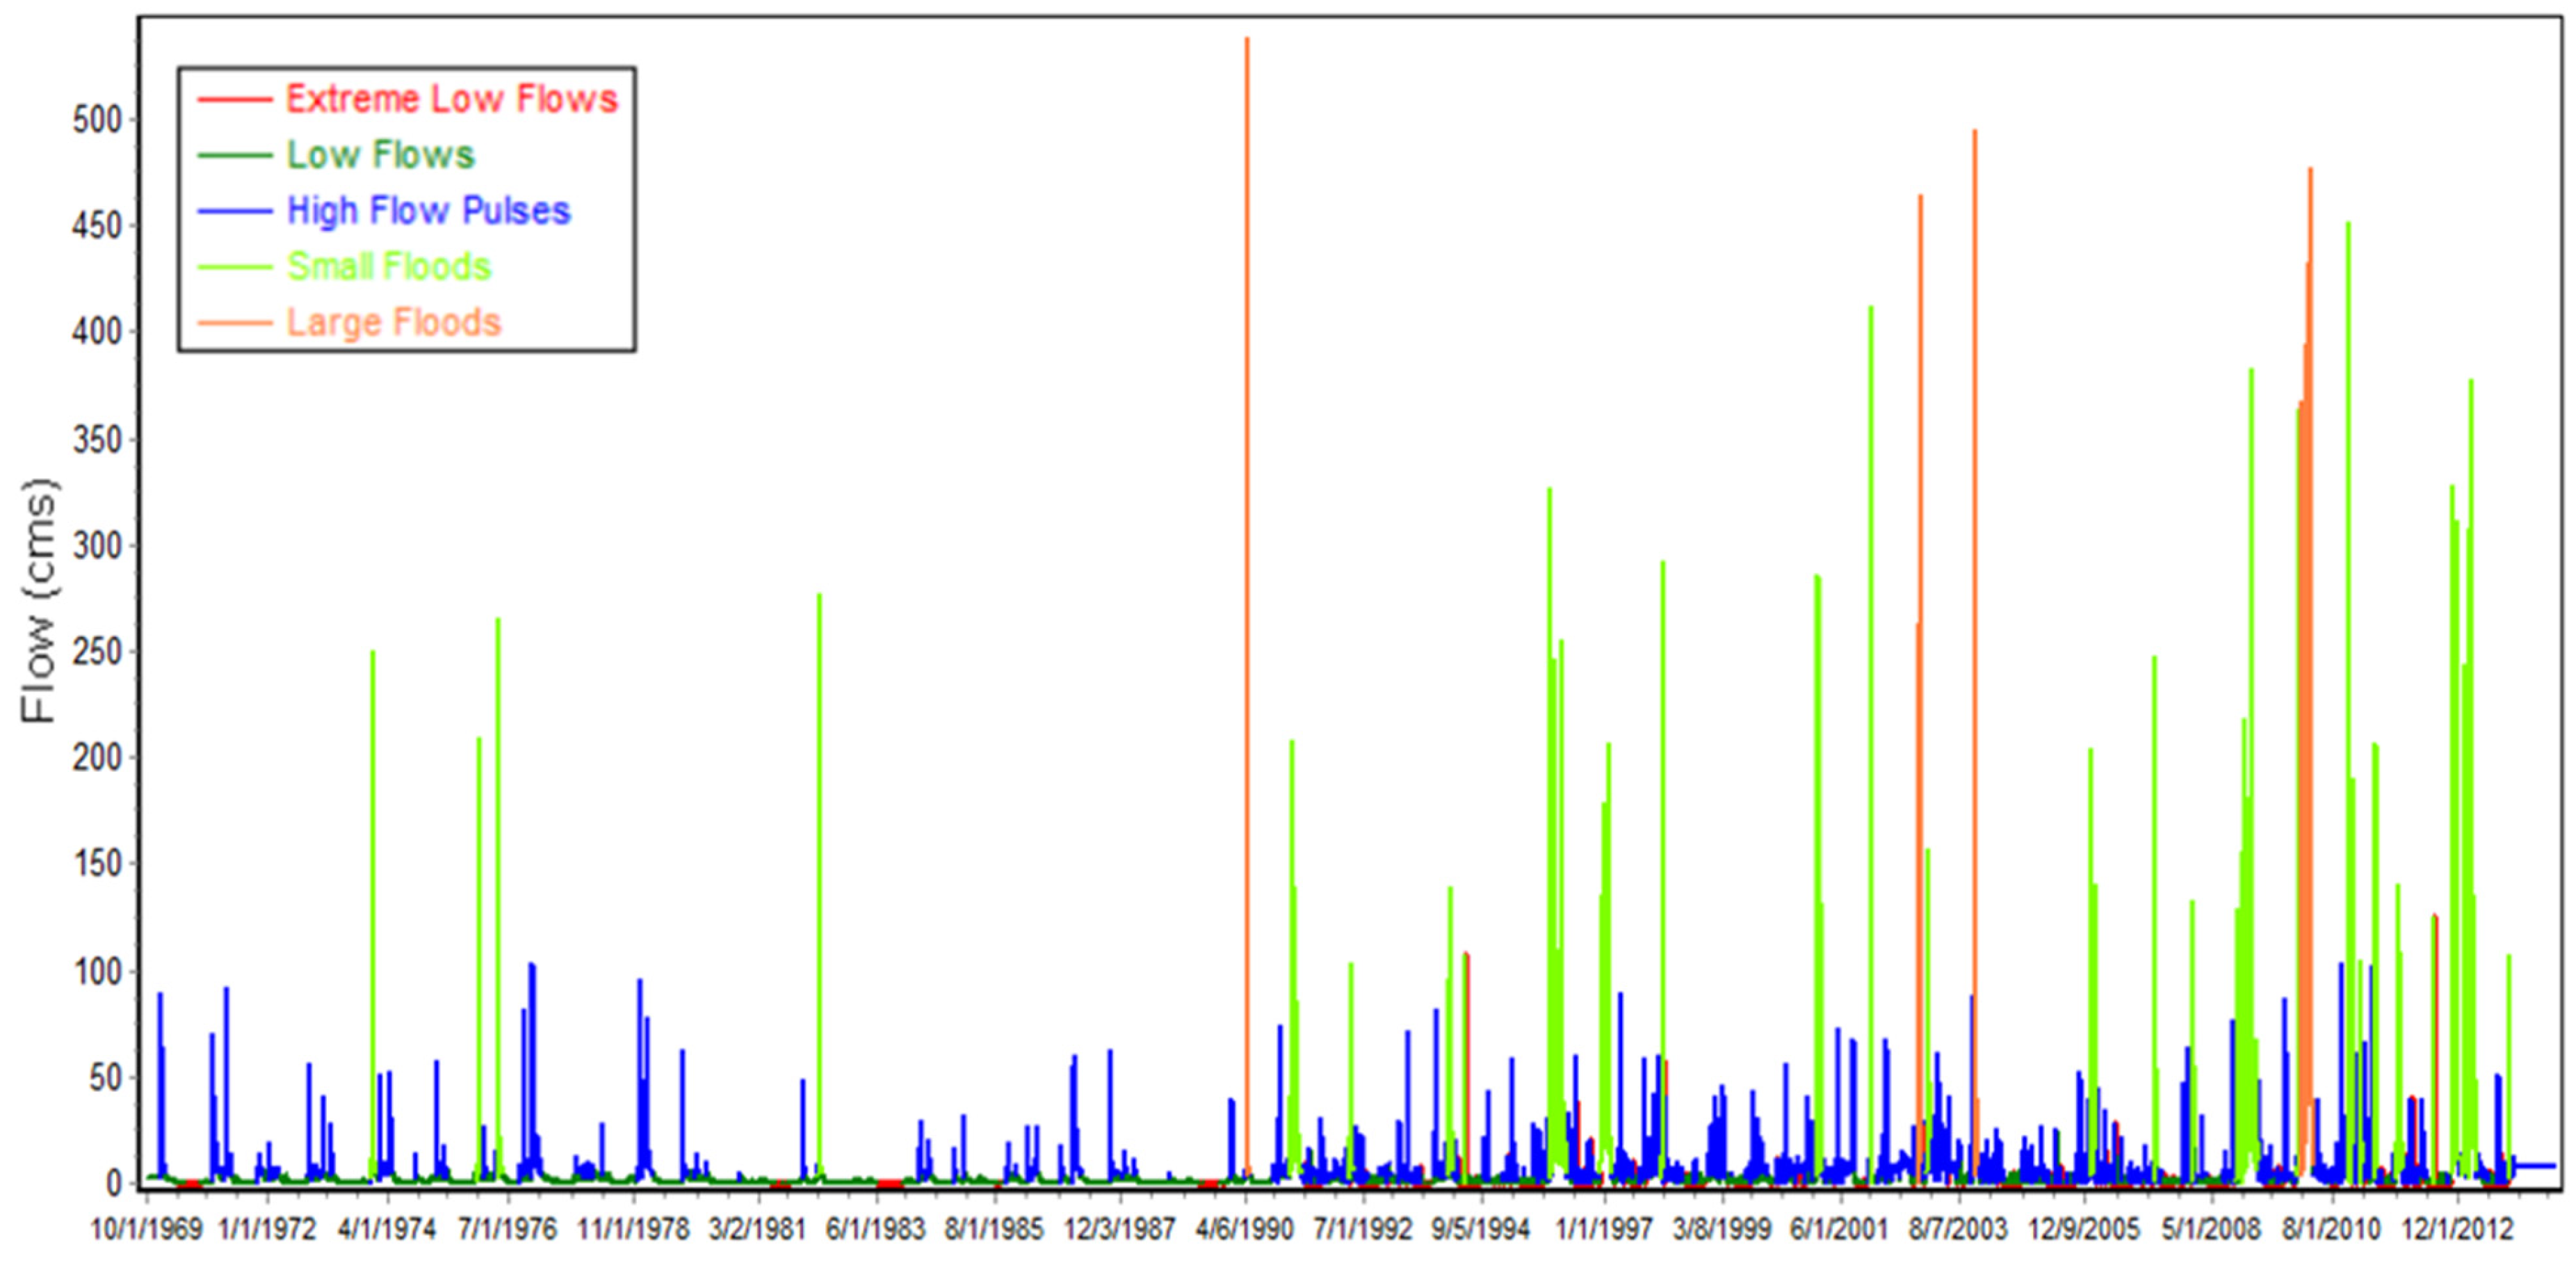
Analysis of environmental flow components for the period 1970 to 1992 revealed only one major flood in 1990 (Figure 7). This period also saw small floods, which facilitated rapid growth of aquatic organisms, as flooded shallow areas are often warmer than the main river and rich in nutrients and insects [51]. This phase experienced a long period of drought, manifested by the presence of extremely low flows, which can be stressful for many organisms but can also provide the conditions necessary for certain plant species to regenerate. As for high flow pulses, they occurred with high frequency throughout the period and are important and necessary in low-flow areas, as they provide rich organic matter to sustain aquatic food.
For the second period (1993–2013), the analysis of environmental flow components revealed three major floods, namely in 2002, 2004, and 2010 (Figure 7). Small floods dominated. Consequently, there was movement of organisms upstream–downstream into the floodplain wetlands of the river, which had a positive impact on the migration of aquatic organisms, spawning/reproduction, and the juvenile growth period [68]. These areas, which are often inaccessible, can provide important food resources. On the other hand, low flows showed significant variation and could have an impact on predator–prey relationships, as well as the diversity and number of organisms [69]. High-flow pulses are almost uniform in magnitude, encouraging mobile organisms to move upstream and downstream.
2.
Flow duration and timing of environmental flow components
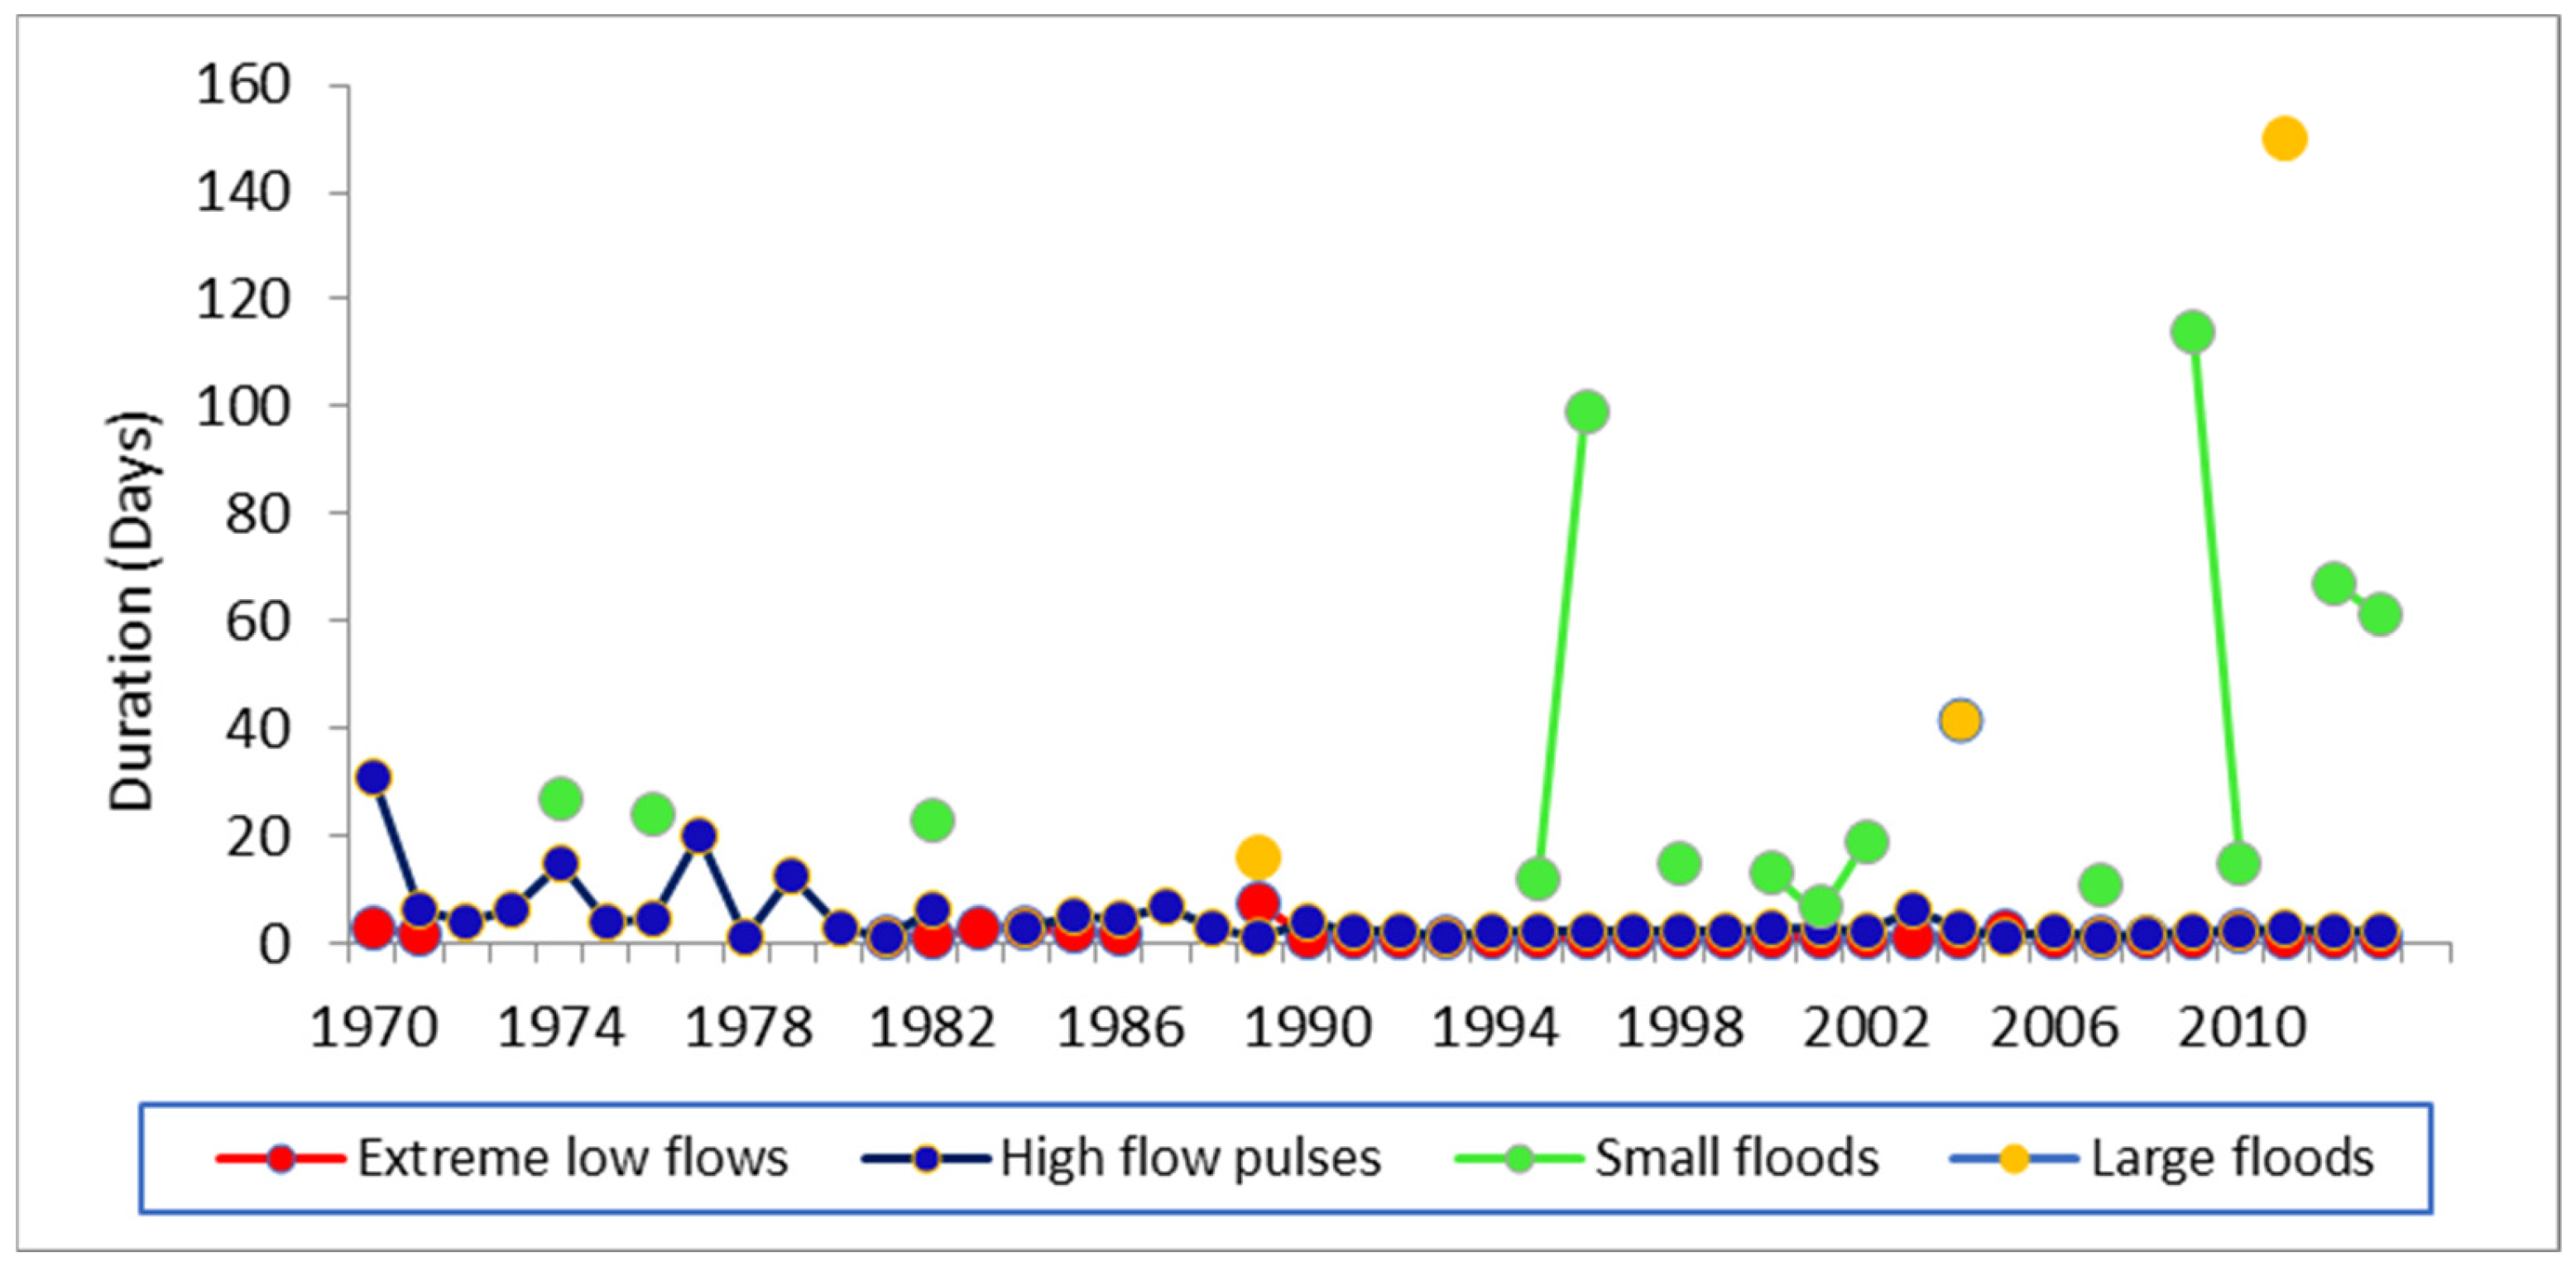
The duration of all environmental flow components increased, with the exception of extremely low flows (Figure 8). Low flows showed an increasing trend, while extreme low flows otherwise decreased. Based on the analysis of flow component, significant floods occurred following 1989 and 1995, with both large and small floods being the most common. The high flow pulse, which occurred at the beginning of the rainy season, was almost undisturbed, potentially making it easier for organisms to move to upstream locations. This component is inadequate for fully supporting the diverse aquatic organisms found in the river and floodplain wetlands during both small and large floods [69].
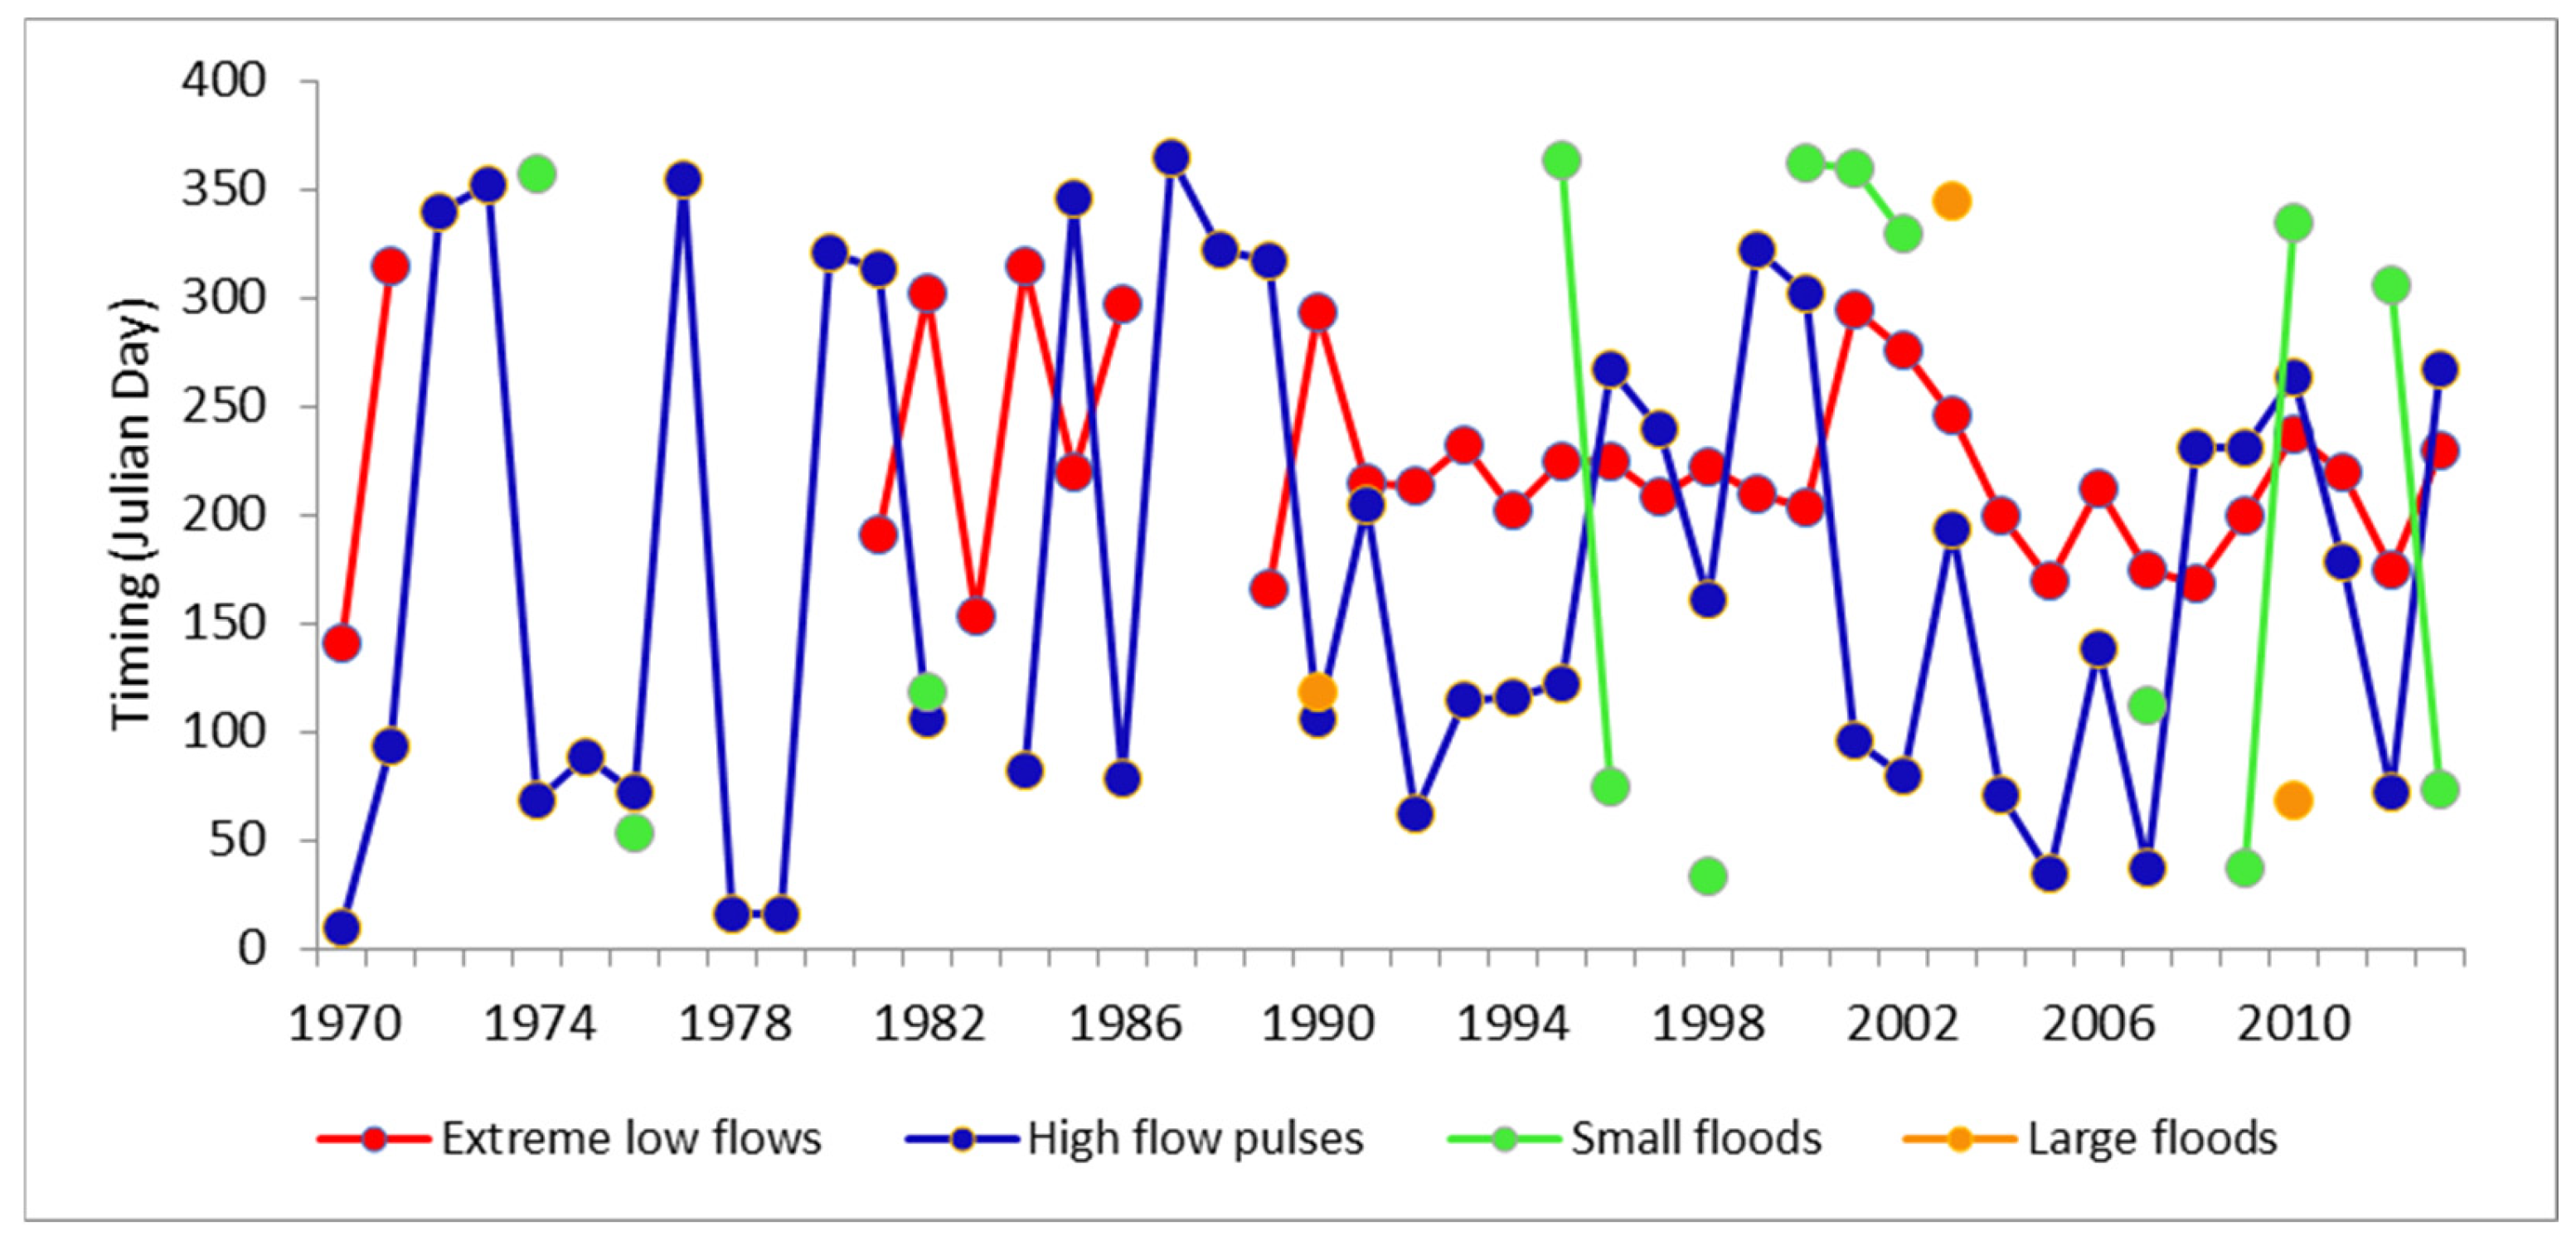
The timing (Julian day) of the occurrence of extreme low flows varies between 140 and 300; this component is steady and represents a median of 216 and a coefficient of dispersion of 0.16. During the first period, these flows occurred in mid-spring (141 Julian day) to autumn (315 Julian day), and for the second period, they generally took place during the summer season and experienced greater variation. Other components of environmental flow are highly variable; high flow pulses experienced greater interannual variation between 1970 and 1992 and occurred during winter and autumn, and between 1993 and 2013 they appeared during all seasons but especially in summer (Figure 9). This can disrupt the reproductive cycle of aquatic organisms living in the river. High-flow pulses indicate to these species to begin moving in rivers toward floodplain spawning grounds. In the case of small floods, they occurred during the winter season and in some years in spring, and were more frequent during the latter period. Extreme floods also occurred during winter, notably between 1993 and 2013, with the exception of the spring flood in 1990.

3.3. Drought Analysis Using Standardized Precipitation Index (SPI)

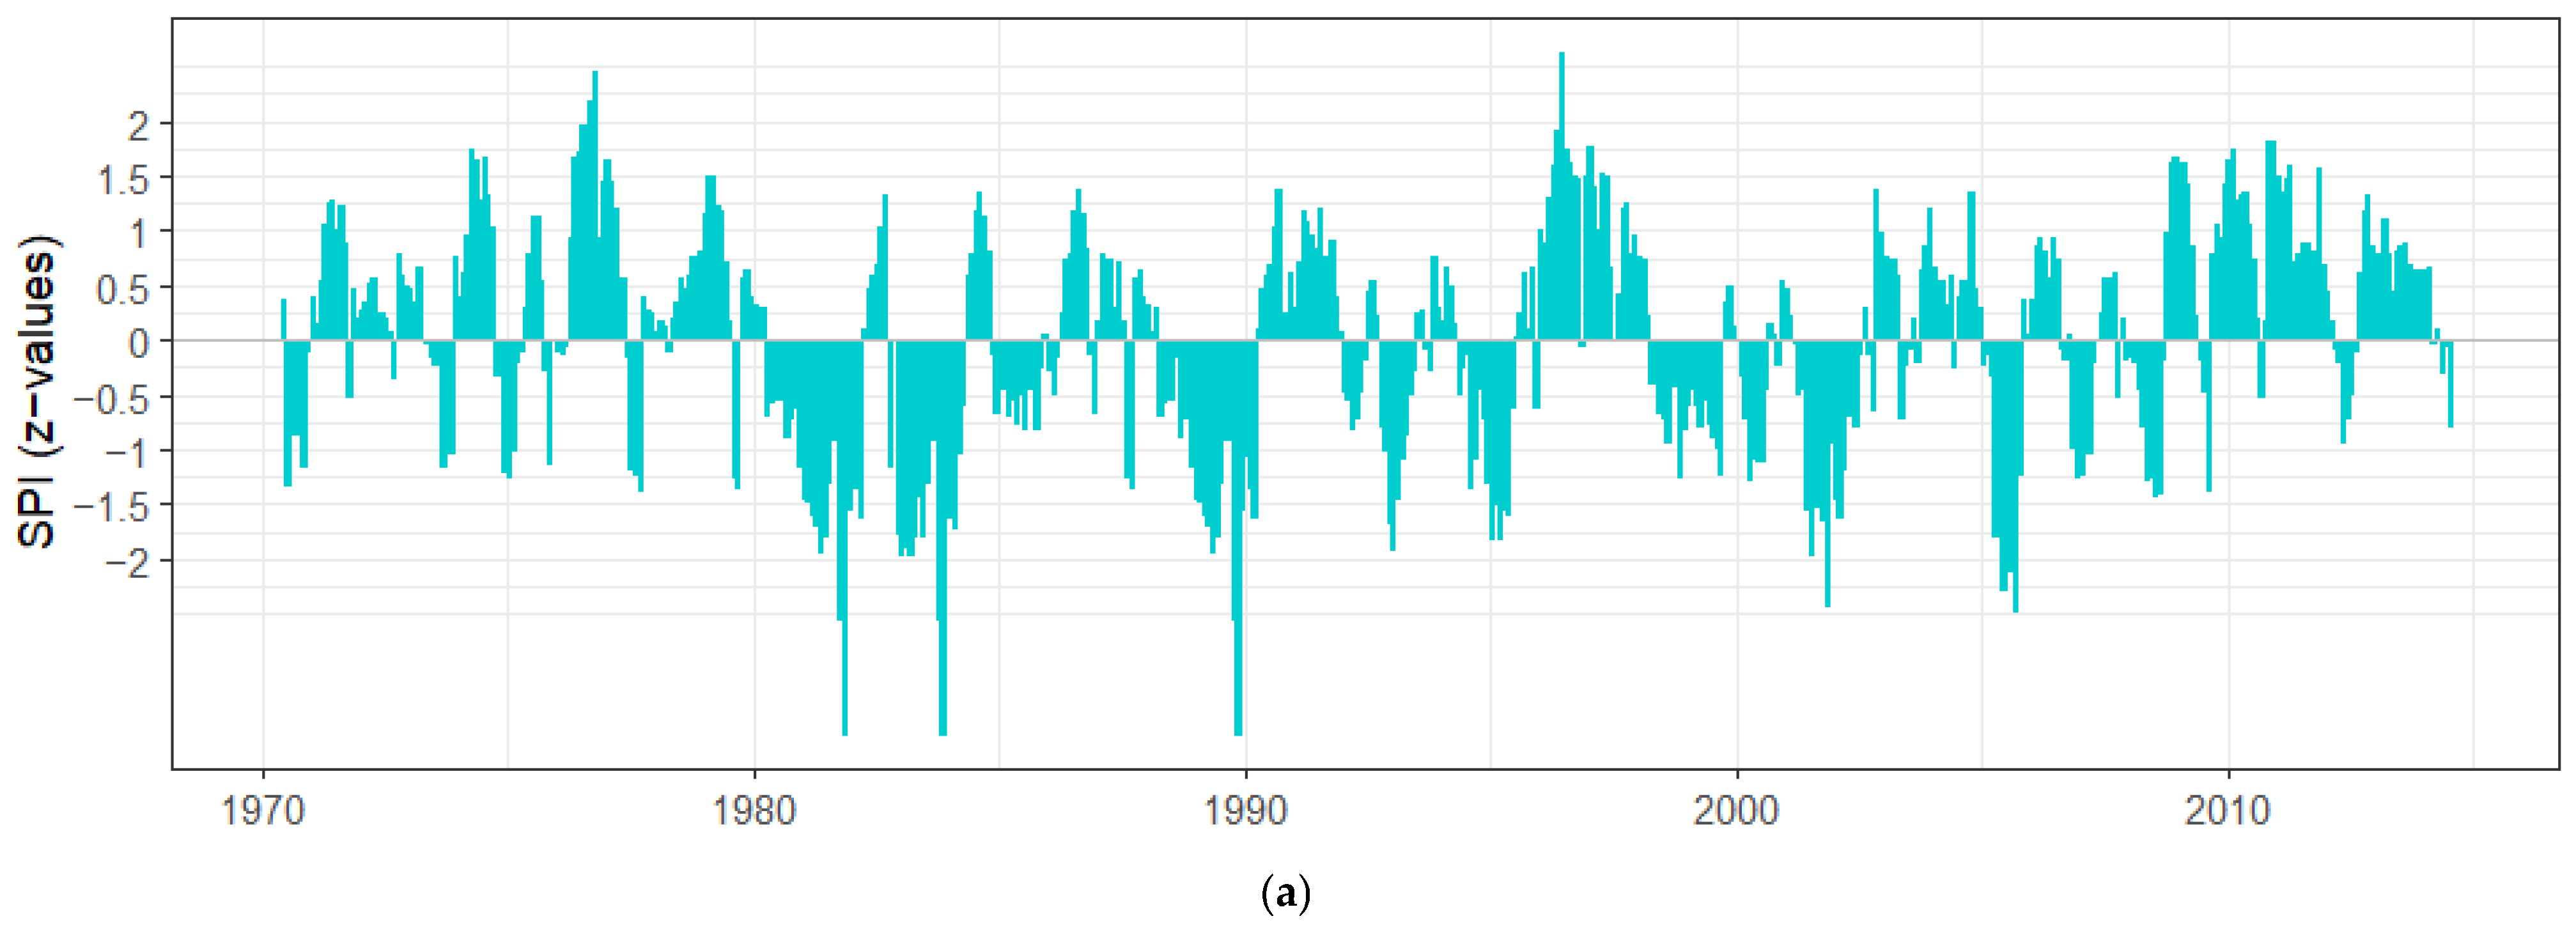
The 6-month SPI (Figure 10a) was calculated to identify and analyze rapid decreases in precipitation over short periods, enabling the detection of sudden transitions between wet and dry conditions.
The most notable decline occurred in the mid-1970s and 1980s—particularly around 1980–1984 and 1988–1990—as well as during the early 2000s. These episodes are marked by sharp transitions from values above +1 to nearly –2 within less than a year.
A total of 12 drought events were identified in the SPI-6 series (Table 4). The durations ranged from 4 to 9 months, and magnitudes varied from –4.55 to –15.0, with drought intensities generally between 0.50 and 0.88. The most intense events occurred between 1980 and 1990 and in 2005. The overall frequency of SPI-6 droughts was estimated as 14.0%, confirming the recurrence of short-term dry spells across the study period.
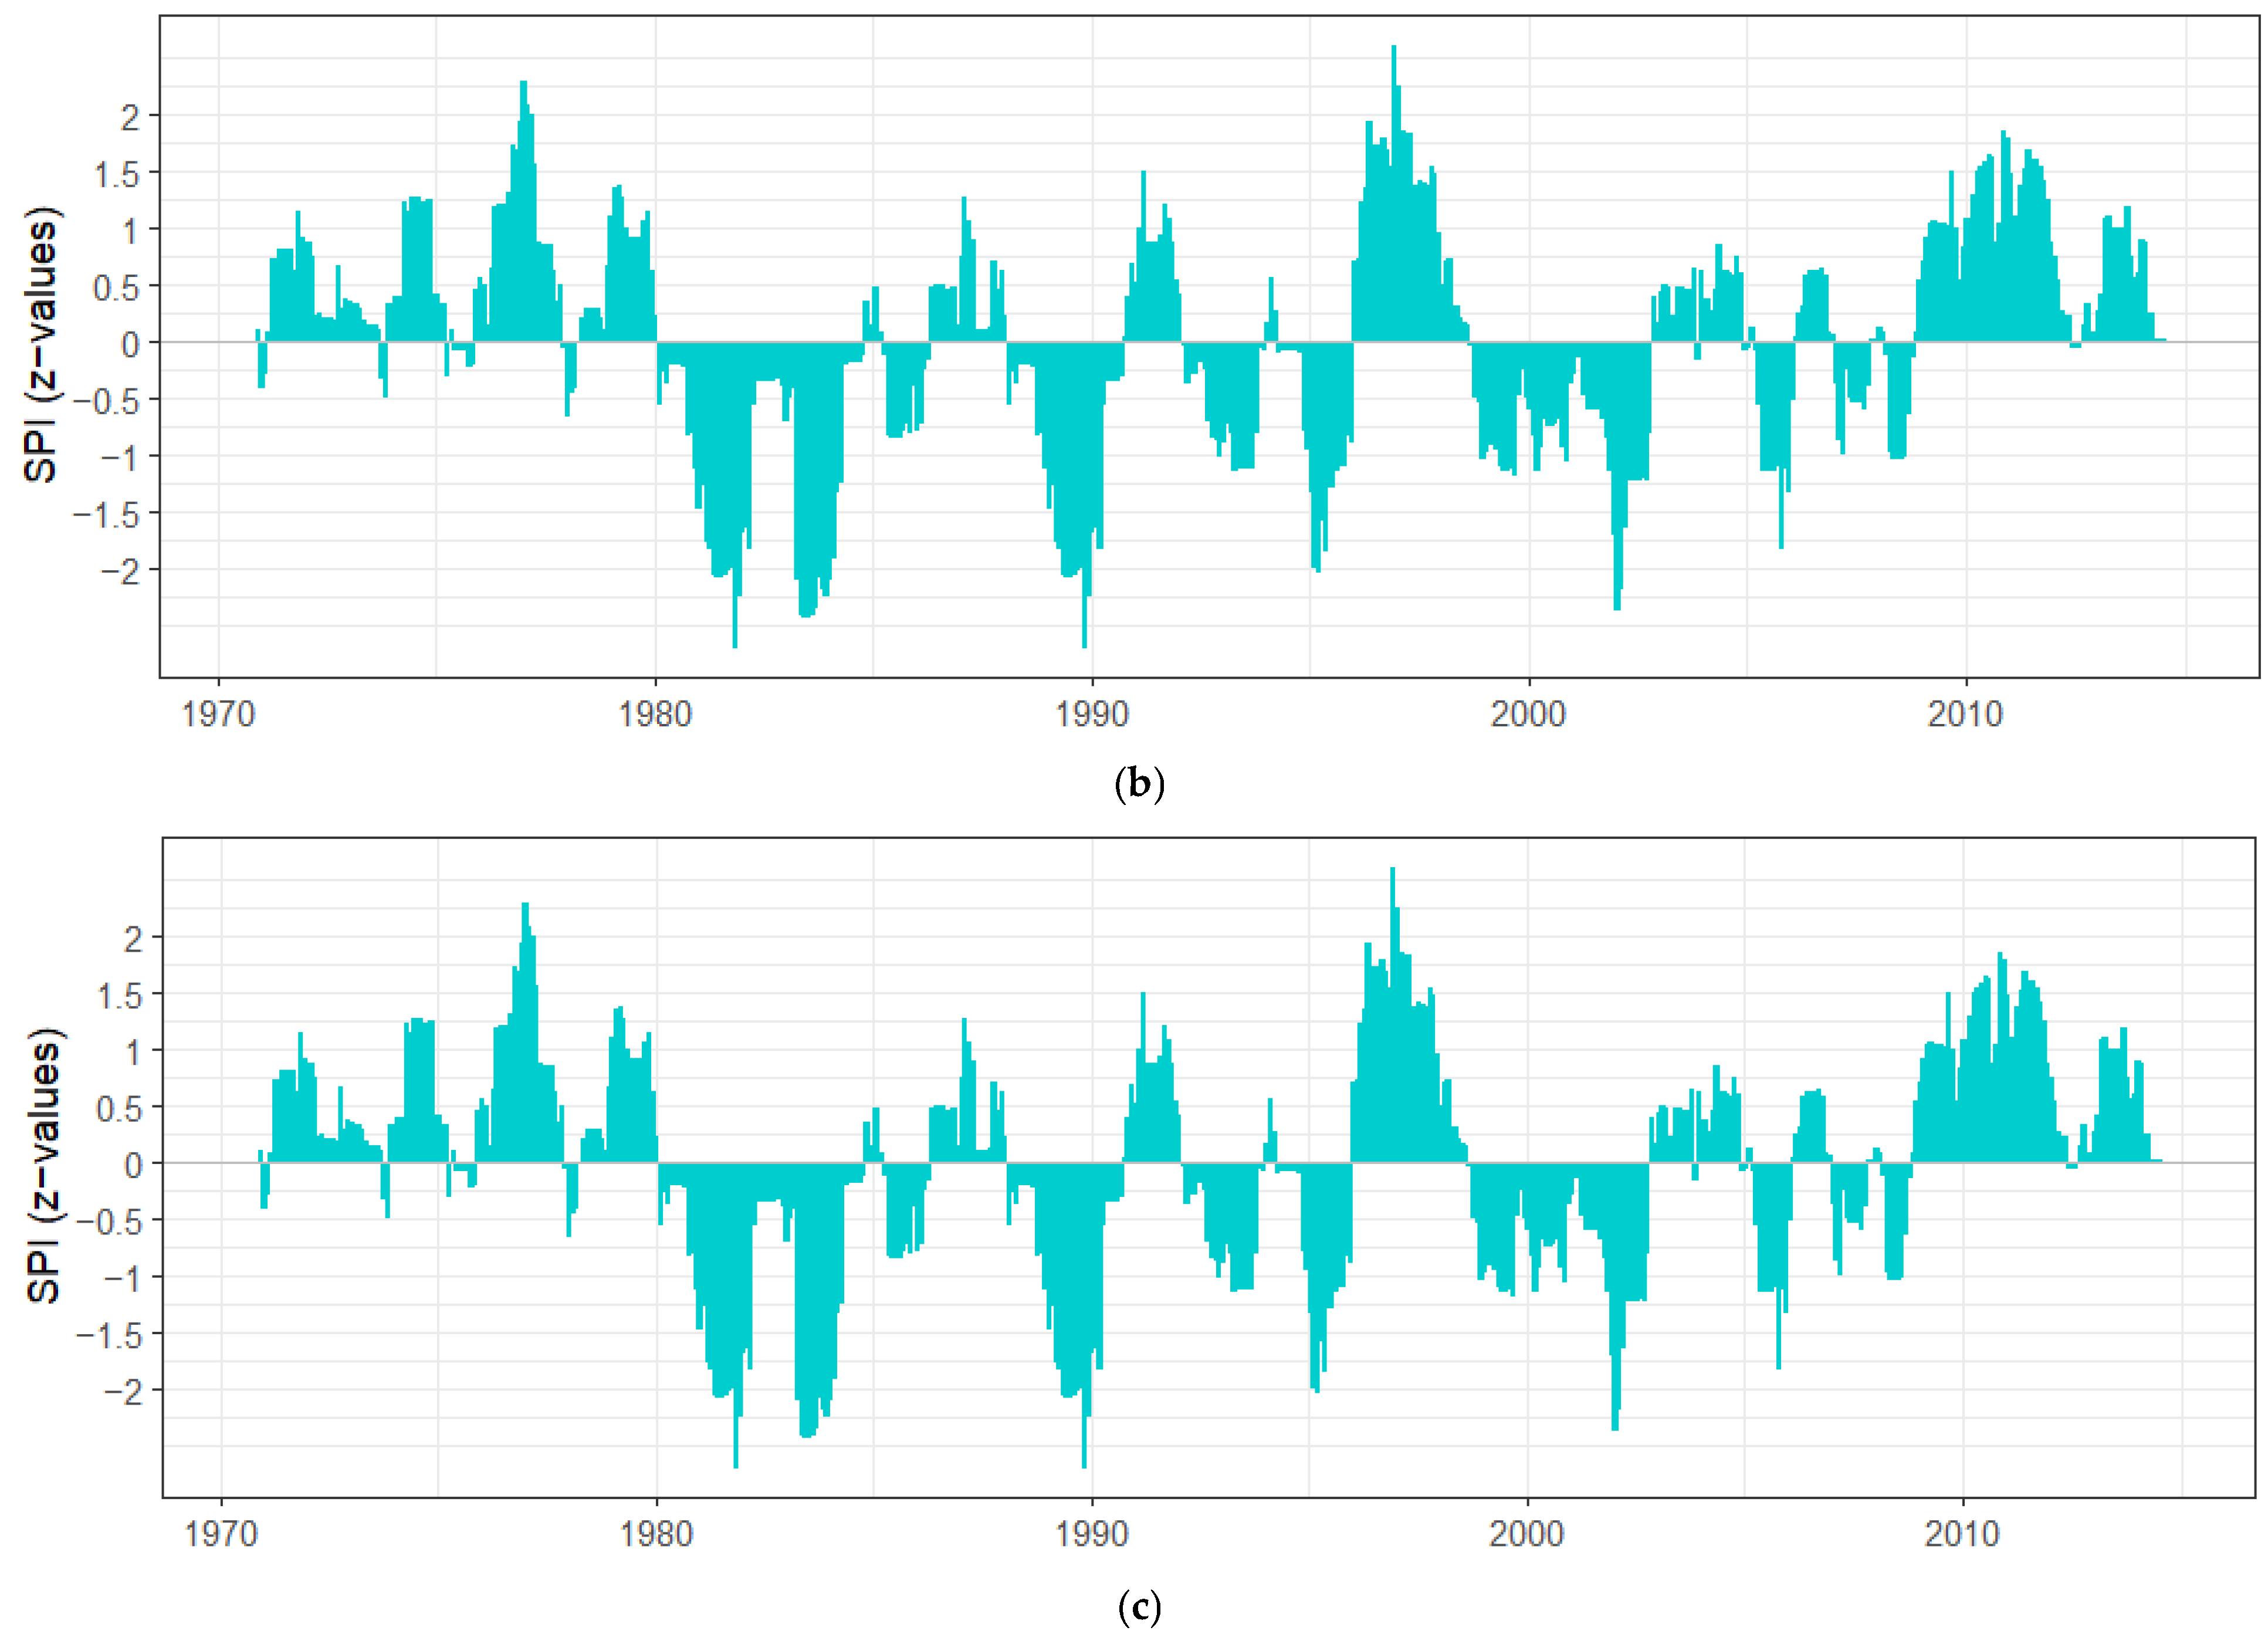
The 12-month SPI values (Figure 10b) show more persistent drought trends. In the period 1970–1992, the values frequently fall below zero, indicating constant drought and reduced precipitation over shorter periods. Some of the most notable dips occur in the 1980s, with SPI values showing significant negative values (below −1), indicating periods of severe drought.
Positive values predominate during the second period. Peaks even exceed an SPI of 2, which indicates very wet conditions. This suggests that the river basin experienced higher levels of precipitation, particularly in the late 1990s and late 2000s to early 2010s.
In total, nine drought events were detected using SPI-12 (Table 4). Two of the most severe droughts occurred between 1980 and 1982 and between 1988 and 1990, each lasting 16 months with a cumulative magnitude of –29.5. Other moderate droughts occurred in 1995, 2001–2002, and 2005, with durations between 4 and 11 months and intensities ranging from 0.48 to 0.99.
The 36-month SPI graph (Figure 10c) also indicates a significant negative trend from 1970 to 1992 with long-duration dry spells over several years. This indicates that this area witnessed long droughts with less recovery between dry periods.
In the second period, the SPI shows sustained positive values, including extended wet phases around the late 1990s and in the early 2010s. This indicates that the basin experienced more than just brief wet periods but it was subject to prolonged wet conditions, suggesting a fundamental climatic change.
Five severe long-duration drought events occurred in the SPI-36 record (Table 4). The longest drought occurred from 1981 to 1984, with a duration of 35 months. The other droughts occurred in 1985, from 1989 to 1991, in 1995, and from 2001 to 2002, with durations of 8 to 19 months. The frequency of overall drought was estimated to have been 16.1%, clearly demonstrating that long-duration droughts had significant impacts on water supply and baseflow in the basin.

4. Discussion

A thorough understanding of hydrological alterations and drought variability is essential for evaluating how climate variability and human activities affect river basins, especially in semi-arid areas like the Beht basin. This study combined hydrological modeling (SWAT), flow regime analysis (IHA), and drought characterization (SPI) to provide a comprehensive understanding of changes over the past four decades.
The SWAT model has been applied in a multitude of research domains, including but not limited to the assessment of soil erosion and sedimentation, as documented in studies by [18,21,70,71,72]. Furthermore, it has been a significant factor in predicting the environmental impacts of land use changes and climate change, as highlighted in the work of [22]. In the field of hydrology and environmental sciences, the capabilities of the SWAT model extend to the simulation of surface water and groundwater systems, facilitating assessments of water quality and quantity, as illustrated by [23]. Additionally, the model has been a valuable tool in the analysis of environmental risks, as demonstrated by the research conducted by [72]. These diverse applications underscore the model’s adaptability and its integral role in advancing our understanding of environmental processes and their interactions within various ecosystems.
The performance of the SWAT model for the Beht River basin was generally satisfactory, especially considering the limited and imprecise data conditions, the spatial distribution of precipitation in the basin which may not be representative, and the heterogeneous characteristics of the basin in terms of land use, soil types, and topography, as well as the flow regime characterized by extremely variable precipitation. Sensitivity analysis revealed that the most sensitive parameter was the Curve Number, due to the presence of the main land cover classes (pasture land, bare land, agricultural areas), which represent more than half of the land uses in the watershed, since runoff is more important in these areas for a rainfall event compared to other land use types. Most of the other sensitive parameters are related to groundwater flow. GW_DELAY and ALPHA_BF regulate water storage in the soil via groundwater to the river. The fact that the predominant soil categories fall under hydrological group B, which is characterized by high drainage capacity, moderate infiltration rates, and water transmission rates, explains the sensitivity to the SOL_AWC and GWQMN parameters. It should be noted that the basin upstream regions are distinguished by the presence of karst geological structures that allow for precipitation infiltration. Following soil saturation, water flows through the deep aquifer and may manifest as base flow after a rainfall event, thereby increasing the total amount of water drained. However, the SWAT model is not able to accurately simulate this aspect. The presence of the sensitive parameters related to evapotranspiration (ESCO, EPCO, REVAPMN) may be due to the significant abstraction of evaporation demands from the lower soil layers.
However, the model’s underestimation of extreme peak flows during rainy seasons indicates that the groundwater component of the hydrological system is not accurately simulated. This underestimation can have significant consequences for the accuracy of flood forecasting and management, and it may be connected to the same factors that affect base flows, including the complex distribution of rainfall and potential impacts from small reservoirs. These extreme peak flows are influenced by a combination of factors, including intense rainfall events, rapid runoff due to the karst evolution, and the groundwater component of the hydrological system. The model’s inability to accurately capture this groundwater component, especially in the face of heavy rainfall, highlights a significant shortcoming in its representation of the hydrological system’s reality. The SWAT model has been shown to perform poorly in simulating rapid hydrological responses in karst areas, largely due to its simplistic representation of groundwater flow [73,74]. Implementing model modifications that account for karst-specific processes, such as those proposed by [75], can improve the simulation of extreme events. The overestimation of base flows can be explained by the poor distribution of rainfall, particularly seepage water in karst areas, and by the potential existence of small reservoirs used to supply water to crops in the catchment, which may affect the flow rate at low levels [76].
Despite these limitations, the SWAT model provides reliable discharge outputs that support the Indicators of Hydrologic Alteration (IHA) analysis. The IHA analysis indicates significant hydrological alteration between the pre-impact (1970–1992) and post-impact (1993–2013) periods. Notably, there was an increase in low and medium monthly flows during the post-impact period, as this was considered a wet period. According to previous studies [77] carried out over the whole of Morocco, the years 1970–1991 were considered a drought period, while the following two decades were wet, which explains this general increase; at the same time, the high flows remained unchanged, which may be linked to climate variability and dam operations [78], since dams are known to reduce the frequency of specified floods [79]. In subsequent years not included in the study, a drought analysis study from 1980 to 2017 showed a drastic increase in drought from 2012 onwards [80]. The variation in monthly flows also showed an exceptional increase in median flows during the wet period from October to February.
The RVA analysis revealed major hydrological changes, with a strong positive alteration mainly in the high RVA category. The increase in maximum flows indicates more frequent and intense flood events driven by short-duration precipitation or human activities like reservoir releases [81]. The increase in minimum flows (30 and 90-day minimum) suggests better maintenance of base flow by improving irrigation practices, monitoring the groundwater level to avoid over pumping, restoring the riparian zone, avoiding high-water-demanding farming practices, and conserving vegetation density. However, short-term minimums remain negatively altered, indicating a temporal divergence in low-flow behavior. This may indicate a seasonal redistribution of flow volumes, where short-term dry events are more intense, but seasonal flow conditions are better maintained, potentially due to human regulation of flow [82].
Alterations were also evident in the timing of extreme annual water conditions, the duration of low and high pulses, the frequency of high pulses, and the rate of rise and fall, thus modifying the flow regime and the aquatic ecosystem. These changes are likely driven by both climatic variability and anthropogenic interventions, including dam operations, groundwater extraction for irrigation, and urban land use expansion.
In addition to climatic variability, anthropogenic pressures, particularly land use and land cover changes, have significantly contributed to the observed hydrological alterations. The Beht basin, as part of the larger Sebou River system, has experienced notable land use transformations over recent decades, including agricultural expansion, urban growth, and deforestation. For example, ref. [83] reported a substantial increase in urbanized areas and cropland in the Sebou Estuary region, changes that likely influenced runoff patterns and the overall river discharge behavior.
Environmental flow components have also been affected, with an increase in the timing and frequency of high-flow pulses during the past-impact period. Major floods occurring in 2002, 2004, and 2010 support these findings. In addition, the decreased duration of extreme low flows suggests more frequent short-term droughts and decreasing baseflow contributions, especially in late summer, which may impact the aquatic habitat dependent on sustained flows.
These hydrological changes, coupled with human impacts, such as the presence of the downstream dam, water pumping for irrigation of cultivated areas, and uncontrolled landfills, have contributed to the degradation of the Beht River basin, which is known for its high diversity of benthic macrofauna [84]. Similar ecological consequences have occurred in other Moroccan and Mediterranean rivers. Reference [85] reported that flow regulation and dam presence brought severe changes in Martil River macroinvertebrate assemblages, with native species decreasing and opportunistic species dominating. Reference [86] showed that reduced flood magnitude in the river affected sediment dynamics and riverbed structure, altering benthic invertebrate habitats. In addition, ref. [87] also demonstrated how minimum flow significantly impacted macroinvertebrates, emphasizing their dependency upon natural low-flow variability. This supports more overall syntheses by [88], which demonstrated that flow timing alterations and reductions in durations of low flow typically destabilize aquatic biodiversity as well as sediment processes in semi-arid regions. These findings underscore the importance of implementing relevant measures aimed at preserving environmental flows. Adaptive management strategies that sustain ecological integrity, while maintaining a balance between ecosystems’ water demands and human activity, are needed to deal with these changes.
The SPI analysis further reinforced the hydrological findings. SPI-6 showed that rapid decreases are likely to have significant impacts on monthly flows. For example, the sharp decreases in the late 1980s, 1988–1990, and the early 2000s could explain reduced river flows in those years, reflected in the IHA results for October, June, and other months. Decreases could also correspond to the increase in low-flow counts (1-day, 3-day minimums) as river discharge decreased in response to short-term droughts. In addition, they are associated with higher pulse reductions (Group 4) and an increase in fall rate (Group 5), indicating a rapid decrease in flow in response to reduced precipitation. Similar studies in Mediterranean catchments confirm that such rapid SPI declines exacerbate flash droughts, altering flow patterns and stressing aquatic ecosystems [89]. Medium-term droughts detected by SPI-12 were also consistent with decreases in minimum flows (Group 2), with negative or stagnant values pre-impact. In contrast, the post-impact period showed more positive SPI values, where monthly flows and maximum flows both showed significant increases (Group 1 and Group 2). As an example, the month of October (+227.45%) showed substantial increases which correspond to the wetter climatic conditions observed in the SPI. Similar trends have been reported in Mediterranean regions, emphasizing susceptibility to alternating periods of severe drought and intense rainfall [90,91]. Finally, the SPI-36 values showed that the basin experienced extended drought conditions, which correspond to low baseflow (as shown by the IHA baseflow index, +40.73%) and minimal changes in river flow regime during the pre-impact period, highlighting the absence of significant hydrological recovery between droughts. In the post-impact period, the trend indicates sustained wet periods, aligned with increases in maximum flows and high-pulse duration (Group 4). The river system has benefited from greater availability of water over longer periods, resulting in more frequent and sustained high flows.
Overall, this combined assessment highlights the importance of maintaining environmental flows and implementing adaptive management strategies to secure the resilience of semi-arid river ecosystems in the face of climate variability and human pressures.

5. Conclusions

This study highlighted significant hydrological changes in the Beht River basin over the past four decades. The IHA analysis showed a general increase in low and medium monthly flows during the post-impact period (1993–2013), which was most likely caused by a combination of dam regulation and wetter climatic conditions. While monthly and minimum flows showed positive trends, the frequency and duration of extreme flow events changed as well, with shorter extreme low-flow durations indicating more frequent short-term drought.
The SPI analysis at multiple timescales supported these findings by demonstrating the high variability between dry and wet periods. These climatic fluctuations, combined with human activities such as dam operations and land use changes, have altered the flow regime and stressed the aquatic ecosystem.
Overall, the findings show ongoing hydrological alterations in a semi-arid Mediterranean basin, emphasizing the critical need to set adequate environmental flow requirements to protect riverine ecosystems. As a first step, this study provides important hydrological insights that can inform future ecological studies and guide sustainable water resource management in the Beht River basin.

Author Contributions

Conceptualization, F.D., O.T. and A.L.; methodology, F.D., S.N. and O.T.; software, S.N. and F.D.; validation, S.N.; investigation, F.D. and O.T.; resources, S.T.; writing—original draft preparation, F.D.; writing—review and editing, F.D., S.N., O.T., T.H. and E.-I.K.; supervision, O.T. and A.L. All authors have read and agreed to the published version of the manuscript.

Funding

This research received no external funding.

Data Availability Statement

The data are contained within the article.

Acknowledgments

O.T. received ERASMUS+ funding for practice mobility in the University of Sidi Mohamed Ben Abdellah, Fez, Morocco, and is grateful to the ERASMUS office support of the University of the Aegean, particularly to G. Koufos, E. Spathopoulou, and Ch. Varkaraki. The authors also gratefully acknowledge the valuable assistance of Vaggelis Livadiotis during the development of the SPI analysis.

Conflicts of Interest

The authors declare no conflicts of interest.

Appendix A

Figure A1. Spatial datasets used in SWAT modeling: (a) land use/land cover; (b) soil types; (c) digital elevation model (DEM).
Hydrology 12 00109 g0a1

References

  1. IPCC. Summary for policymakers. In Climate Change 2021: The Physical Science Basis. Contribution of Working Group I to the Sixth Assessment Report of the Intergovernmental Panel on Climate Change; Masson-Delmotte, V., Zhai, P., Pirani, A., Connors, S.L., Péan, C., Berger, S., Caud, N., Chen, Y., Goldfarb, L., Gomis, M.I., et al., Eds.; Cambridge University Press: Cambridge, UK; New York, NY, USA, 2021; pp. 3–32. [Google Scholar] [CrossRef]
  2. Kantoush, S.A.; Saber, M.; Abdel-Fattah, M.; Sumi, T. Integrated Strategies for the Management of Wadi Flash Floods in the Middle East and North Africa (MENA) Arid Zones: The ISFF Project. In Wadi Flash Floods: Challenges and Advanced Approaches for Disaster Risk Reduction; Springer: Singapore, 2022; pp. 3–34. [Google Scholar] [CrossRef]
  3. Loudyi, D.; Hasnaoui, M.D.; Fekri, A. Flood risk management practices in Morocco: Facts and challenges. In Wadi Flash Floods. Natural Disaster Science and Mitigation; Sumi, T., Kantoush, S.A., Saber, M., Eds.; Springer: Singapore, 2022; pp. 35–94. [Google Scholar] [CrossRef]
  4. World Bank Group. Climate Risk Profile: Morocco. 2021. Available online: https://www.worldbank.org (accessed on 21 September 2022).
  5. Taleb, H. Water management in Morocco. In Management of Intentional and Accidental Water Pollution; Springer: Dordrecht, The Netherlands, 2006; pp. 177–180. [Google Scholar] [CrossRef]
  6. Ait Kadi, M.; Ziyad, A. Integrated water resources management in Morocco. In Global Water Security; Water Resources Development and Management; Springer: Singapore, 2018; pp. 143–163. [Google Scholar] [CrossRef]
  7. World Bank Group. Supporting Morocco’s Journey to Disaster and Climate Resilience. Morocco Integrated Disaster Risk Management and Resilience. 2022. Available online: https://www.worldbank.org/en/results/2022/08/11/supporting-morocco-s-journey-to-disaster-and-climate-resilience (accessed on 21 September 2023).
  8. Han, J.; Lee, D.; Lee, S.; Chung, S.W.; Kim, S.J.; Park, M.; Lim, K.J.; Kim, J. Evaluation of the effect of channel geometry on streamflow and water quality modeling and modification of channel geometry module in SWAT: A case study of the Andong Dam Watershed. Water 2019, 11, 718. [Google Scholar] [CrossRef]
  9. McAllister, D.E.; Craig, J.F.; Davidson, N.; Delany, S.; Seddon, M. Biodiversity Impacts of Large Dams; Background Paper No.1; IUCN/UNEP/WCD: Gland, Switzerland, 2001. [Google Scholar]
  10. Kuriqi, A.; Ardiçlioglu, M.; Muceku, Y. Investigation of seepage effect on river dike’s stability under steady state and transient conditions. Pollack Period. 2016, 11, 87–104. [Google Scholar] [CrossRef]
  11. de Andrade, E.M.; Sena, M.G.T.; da Silva, A.G.R.; Pereira, F.J.S.; Lopes, F.B. Uncertainties of the rainfall regime in a tropical semi-arid region: The case of the State of Ceará. Rev. Agro@Mbiente On-Line 2016, 10, 88–95. [Google Scholar] [CrossRef]
  12. Zhang, L.; Xiao, J.; Zhou, Y.; Zheng, Y.; Li, J.; Xiao, H. Drought events and their effects on vegetation productivity in China. Ecosphere 2016, 7, e01591. [Google Scholar] [CrossRef]
  13. Bouadila, A.; Benaabidate, L.; Bouizrou, I.; Aqnouy, M. Implementation of distributed hydrological modeling in a semi-arid Mediterranean Catchment Azzaba; Morocco. J. Ecol. Eng. 2019, 20, 236–254. [Google Scholar] [CrossRef]
  14. Pulighe, G.; Bonati, G.; Colangeli, M.; Traverso, L.; Lupia, F.; Altobelli, F.; Dalla Marta, A.; Napoli, M. Predicting streamflow and nutrient loadings in a semi-arid Mediterranean watershed with ephemeral streams using the SWAT model. Agronomy 2019, 10, 2. [Google Scholar] [CrossRef]
  15. Näschen, K.; Diekkrüger, B.; Leemhuis, C.; Steinbach, S.; Seregina, L.S.; Thonfeld, F.; Van der Linden, R. Hydrological modeling in data-scarce catchments: The Kilombero floodplain in Tanzania. Water 2018, 10, 599. [Google Scholar] [CrossRef]
  16. Beck, H.E.; Vergopolan, N.; Pan, M.; Levizzani, V.; van Dijk, A.I.; Weedon, G.P.; Brocca, L.; Pappenberger, F.; Huffman, G.J.; Wood, E.F. Global-scale evaluation of 22 precipitation datasets using gauge observations and hydrological modeling. In Satellite Precipitation Measurement. Advances in Global Change Research; Levizzani, V., Kidd, C., Kirschbaum, D., Kummerow, C., Nakamura, K., Turk, F., Eds.; Springer: Cham, Switzerland, 2020; Volume 69, pp. 625–653. [Google Scholar]
  17. Wanzala, M.A.; Stephens, E.M.; Cloke, H.L.; Ficchi, A. Hydrological model preselection with a filter sequence for the national flood forecasting system in Kenya. J. Flood Risk Manag. 2025, 18, e12846. [Google Scholar] [CrossRef]
  18. Boufala, M.; El Hmaidi, A.; Chadli, K.; Essahlaoui, A.; El Ouali, A.; Taia, S. Hydrological modeling of water and soil resources in the basin upstream of the Allal El Fassi dam (Upper Sebou watershed; Morocco). Model. Earth Syst. Environ. 2019, 5, 1163–1177. [Google Scholar] [CrossRef]
  19. Bouslihim, Y.; Kacimi, I.; Brirhet, H.; Khatati, M.; Rochdi, A.; Pazza, N.E.; Miftah, A.; Yaslo, Z. Hydrologic Modeling Using SWAT and GIS; Application to Subwatershed Bab-Merzouka (Sebou; Morocco). J. Geogr. Inf. Syst. 2016, 8, 20–27. [Google Scholar] [CrossRef]
  20. Briak, H.; Mrabet, R.; Moussadek, R.; Aboumaria, K. Use of a calibrated SWAT model to evaluate the effects of agricultural BMPs on sediments of the Kalaya river basin (North of Morocco). Int. Soil Water Conserv. Res. 2019, 7, 176–183. [Google Scholar] [CrossRef]
  21. Markhi, A.; Laftouhi, N.; Grusson, Y.; Soulaimani, A. Assessment of potential soil erosion and sediment yield in the semi-arid N′ fis basin (High Atlas; Morocco) using the SWAT model. Acta Geophys. 2019, 67, 263–272. [Google Scholar] [CrossRef]
  22. Choukri, F.; Raclot, D.; Naimi, M.; Chikhaoui, M.; Nunes, J.P.; Huard, F.; Hérivaux, C.; Sabir, M.; Pépin, Y. Distinct and combined impacts of climate and land use scenarios on water availability and sediment loads for a water supply reservoir in northern Morocco. Int. Soil Water Conserv. Res. 2020, 8, 141–153. [Google Scholar] [CrossRef]
  23. Zettam, A.; Taleb, A.; Sauvage, S.; Boithias, L.; Belaidi, N.; Sanchez-Perez, J.M. Applications of a SWAT model to evaluate the contribution of the Tafna catchment (north-west Africa) to the nitrate load entering the Mediterranean Sea. Environ. Monit. Assess. 2020, 192, 510. [Google Scholar] [CrossRef]
  24. Brouziyne, Y.; Abouabdillah, A.; Bouabid, R.; Benaabidate, L.; Oueslati, O. SWAT manual calibration and parameters sensitivity analysis in a semi-arid watershed in North-western Morocco. Arab. J. Geosci. 2017, 10, 427. [Google Scholar] [CrossRef]
  25. Moumen, Z.; Nabih, S.; Elhassnaoui, I.; Lahrach, A. Hydrologic Modeling Using SWAT: Test the Capacity of SWAT Model to Simulate the Hydrological Behavior of Watershed in Semi-Arid Climate. In Decision Support Methods for Assessing Flood Risk and Vulnerability; IGI Global: Hershey, PA, USA, 2020; pp. 162–198. [Google Scholar] [CrossRef]
  26. Hayes, D.S.; Brändle, J.M.; Seliger, C.; Zeiringer, B.; Ferreira, T.; Schmutz, S. Advancing towards functional environmental flows for temperate floodplain rivers. Sci. Total Environ. 2018, 633, 1089–1104. [Google Scholar] [CrossRef]
  27. Declaration, B. The Brisbane Declaration: Environmental flows are essential for freshwater ecosystem health and human well-being. In Proceedings of the 10th International River Symposium, Brisbane, Australia, 3–6 September 2007. [Google Scholar]
  28. Gopal, B. Methodologies for the assessment of environmental flows. In Environmental Flows: An Introduction for Water Resources Managers; National Institute of Ecology: New Delhi, India, 2013; pp. 129–182. [Google Scholar]
  29. Dutta, V.; Sharma, U.; Kumar, R. Assessment of river ecosystems and environmental flows: Role of flow regimes and physical habitat variables. Clim. Change Environ. Sustain. 2017, 5, 20–34. [Google Scholar] [CrossRef]
  30. McKee, T.B.; Doesken, N.J.; Kleist, J. The relationship of drought frequency and duration to time scales. In Proceedings of the 8th Conference on Applied Climatology, Boston, MA, USA, 17–22 January 1993; Volume 17, pp. 179–183. [Google Scholar]
  31. Abdallaoui, A. Contribution à l’étude Du Phosphore et Des Métaux Lourds Contenus Dans Les Sédiments et de Leur Influence Sur Les Phénomènes d’eutrophisation et de La Pollution. Cas Du Bassin Versant de l’oued Beht et de La Retenue de Barrage El Kansera. Ph.D. Thesis, Faculté des Sciences, Université Moulay Ismail, Meknès, Morocco, 1998. [Google Scholar]
  32. Lakhili, F.; Mohammed, B.; Nouzha, B.; Hamid, L.; Abrerrahim, L. Etude de la qualité physicochimique et de la contamination métallique des eaux de surface du bassin versant de Beht (Maroc). Eur. Sci. J. 2015, 11, 132–147. [Google Scholar]
  33. El Gaatib, R. Cartographie Décisionnelle de l’aménagement Intégré Du Bassin Versant de l’Oued Beht: Analyse Spatiale de l’aléa Érosif Des Sols Pour La Gestion Des Risques Naturels d’envasement de La Retenue Du Barrage El Kansera (Maroc). Ph.D. thesis, Université Mohammed V—Rabat, Ecole Mohammadia d’Ingénieurs, Rabat, Morocco, 2017. [Google Scholar]
  34. El Gaatib, R.; Larabi, A.; Faouzi, M. Integrated elaboration of priority planning of vulnerable areas to soil erosion hazard using Remote Sensing and GIS techniques: A pilot case of the Oued Beht Watershed (Morocco). J. Mater. Environ. Sci. 2015, 6, 3110–3126. [Google Scholar]
  35. El Gaatib, R.; Larabi, A. Integrated evaluation of soil erosion hazard and risk management in the Oued Beht watershed using remote sensing and GIS techniques: Impacts on El Kansra Dam Siltation (Morocco). J. Geogr. Inf. Syst. 2014, 6, 677–689. [Google Scholar] [CrossRef]
  36. Yacine, E.A.; Essahlaoui, A.; Oudija, F.; Mimich, K.; Nassiri, L. Assessment of soil erosion by (RUSLE) using remote sensing and GIS case of watershed of Beht in upstream of Ouljat Sultan dam (Morocco). ARPN J. Eng. Appl. Sci. 2019, 14, 1765–1776. [Google Scholar]
  37. Daide, F.; Afgane, R.; Lahrach, A.; Chaouni, A.A. Beht watershed (Morocco) rainfall-runoff simulation with the HEC-HMS hydrological model. Ecol. Eng. Environ. Technol. 2022, 23, 142–155. [Google Scholar] [CrossRef] [PubMed]
  38. Arnold, J.G.; Srinivasan, R.; Muttiah, R.S.; Williams, J.R. Large area hydrologic modeling and assessment part I: Model development. J. Am. Water Resour. Assoc. 1998, 34, 73–89. [Google Scholar] [CrossRef]
  39. Neitsch, S.L.; Arnold, J.G.; Kiniry, J.R.; Williams, J.R. Soil and Water Assessment Tool Theoretical Documentation, Version 2005; USDA-ARS Grassland Soil and Water Research Laboratory, and Texas A&M University: Temple, TX, USA; Blackland Research and Extension Center: Temple, TX, USA, 2005. [Google Scholar]
  40. Gassman, P.W.; Reyes, M.R.; Green, C.H.; Arnold, J.G. The Soil and Water Assessment Tool: Historical Development, Applications, and Future Research Directions. Trans. ASABE 2007, 50, 1211–1250. [Google Scholar] [CrossRef]
  41. Neitsch, S.L.; Arnold, J.G.; Kiniry, J.R.; Williams, J.R. Soil and Water Assessment Tool. Theoretical Documentation. Version 2009; Technical Report No.406; Texas Water Resources Institute: Forney, TX, USA, 2011. [Google Scholar] [CrossRef]
  42. Saha, S.; Moorthi, S.; Pan, H.L.; Wu, X.; Wang, J.; Nadiga, S.; Tripp, P.; Kistler, R.; Woollen, J.; Behringer, D.; et al. The NCEP climate forecast system reanalysis. Bull. Am. Meteorol. Soc. 2010, 91, 1015–1057. [Google Scholar] [CrossRef]
  43. Brirhet, H. Intégration Des Modèles Globaux et Distribués Dans La Modélisation Hydrologique Du Bassin Versant d’Issan, Région de Souss. Ph.D. Thesis, Université Sidi Mohamed Ben Abdellah, Fez, Morocco, 2016. [Google Scholar]
  44. Abbaspour, K.C.; Johnson, C.A.; Van Genuchten, M.T. Estimating uncertain flow and transport parameters using a sequential uncertainty fitting procedure. Vadose Zone J. 2004, 3, 1340–1352. [Google Scholar] [CrossRef]
  45. Abbaspour, K.C.; Yang, J.; Maximov, I.; Siber, R.; Bogner, K.; Mieleitner, J.; Zobrist, J.; Srinivasan, R. Modelling hydrology and water quality in the pre-alpine/alpine Thur watershed using SWAT. J. Hydrol. 2007, 333, 413–430. [Google Scholar] [CrossRef]
  46. Nash, J.E.; Sutcliffe, J.V. River flow forecasting through conceptual models part I—A discussion of principles. J. Hydrol. 1970, 10, 282–290. [Google Scholar] [CrossRef]
  47. Cao, W.; Bowden, W.B.; Davie, T.; Fenemor, A. Multi-variable and multi-site calibration and validation of SWAT in a large mountainous catchment with high spatial variability. Hydrol. Process. 2006, 20, 1057–1073. [Google Scholar] [CrossRef]
  48. Van Liew, M.W.; Veith, T.L. Guidelines for Using the Sensitivity Analysis and Auto-Calibration Tools for Multi-Gage or Multi-Step Calibration in SWAT. 2010, pp. 1–30. Available online: https://www.researchgate.net/publication/268344153_Guidelines_for_Using_the_Sensitivity_Analysis_and_Auto-calibration_Tools_for_Multi-gage_or_Multi-step_Calibration_in_SWAT (accessed on 2 June 2024).
  49. Richter, B.D.; Baumgartner, J.V.; Powell, J.; Braun, D.P. A method for assessing hydrologic alteration within ecosystems. Conserv. Biol. 1996, 10, 1163–1174. [Google Scholar] [CrossRef]
  50. Richter, B.D.; Baumgartner, J.V.; Wigington, R.; Braun, D. How much water does a river need? Freshw. Biol. 1997, 37, 231–249. [Google Scholar] [CrossRef]
  51. The Nature Conservancy. Indicators of Hydrologic Alteration Version 7.1 User’s Manual; The Nature Conservancy: Arlington, VA, USA, 2009; Available online: https://rdrr.io/rforge/IHA/ (accessed on 28 December 2023).
  52. Mathews, R.; Richter, B.D. Application of the Indicators of hydrologic alteration software in environmental flow setting. JAWRA J. Am. Water Resour. Assoc. 2007, 43, 1400–1413. [Google Scholar] [CrossRef]
  53. Fadil, A.; Rhinane, H.; Kaoukaya, A.; Kharchaf, Y.; Bachir, O.A. Hydrologic modeling of the Bouregreg watershed (Morocco) using GIS and SWAT model. J. Geogr. Inf. Syst. 2011, 3, 279. [Google Scholar] [CrossRef]
  54. Molina-Navarro, E.; Hallack-Alegría, M.; Martínez-Pérez, S.; Ramírez-Hernández, J.; Mungaray-Moctezuma, A.; Sastre-Merlín, A. Hydrological modeling and climate change impacts in an agricultural semiarid region. Case study: Guadalupe River basin, Mexico. Agric. Water Manag. 2016, 175, 29–42. [Google Scholar] [CrossRef]
  55. De Almeida Bressiani, D.; Srinivasan, R.; Jones, C.A.; Mendiondo, E.M. Effects of different spatial and temporal weather data resolutions on the stream flow modeling of a semi-arid basin, Northeast Brazil. Int. J. Agric. Biol. Eng. 2015, 8, 1–16. [Google Scholar] [CrossRef]
  56. Qi, Z.; Kang, G.; Chu, C.; Qiu, Y.; Xu, Z.; Wang, Y. Comparison of SWAT and GWLF model simulation performance in humid south and semi-arid north of China. Water 2017, 9, 567. [Google Scholar] [CrossRef]
  57. Bouadila, A.; Bouizrou, I.; Aqnouy, M.; En-Nagre, K.; El Yousfi, Y.; Khafouri, A.; Hilal, I.; Abdelrahman, K.; Benaabidate, L.; Abu-Alam, T.; et al. Streamflow Simulation in Semiarid Data-Scarce Regions: A Comparative Study of Distributed and Lumped Models at Aguenza Watershed (Morocco). Water 2023, 15, 1602. [Google Scholar] [CrossRef]
  58. Aqnouy, M.; El Messari, J.E.S.; Ismail, H.; Bouadila, A.; Moreno Navarro, J.G.; Loubna, B.; Mansour, M.R.A. Assessment of the SWAT model and the parameters affecting the flow simulation in the watershed of Oued Laou (Northern Morocco). J. Ecol. Eng. 2019, 20, 104–113. [Google Scholar] [CrossRef]
  59. M’barek, S.A.; Rochdi, A.; Bouslihim, Y.; Miftah, A. Multi-site calibration and validation of swat model for hydrologic modeling and soil erosion estimation: A case study in el grou watershed; Morocco. Ecol. Eng. Environ. Technol. 2021, 22, 45–52. [Google Scholar] [CrossRef]
  60. Moriasi, D.N.; Arnold, J.G.; Van Liew, M.W.; Bingner, R.L.; Harmel, R.D.; Veith, T.L. Model evaluation guidelines for systematic quantification of accuracy in watershed simulations. Trans. ASABE 2007, 50, 885–900. [Google Scholar] [CrossRef]
  61. Arnold, J.G.; Moriasi, D.N.; Gassman, P.W.; Abbaspour, K.C.; White, M.J.; Srinivasan, R.; Santhi, C.; Harmel, R.D.; Van Griensven, A.; Van Liew, M.W.; et al. SWAT: Model use; calibration; and validation. Trans. ASABE 2012, 55, 1491–1508. [Google Scholar] [CrossRef]
  62. Abouabdillah, A.; White, M.; Arnold, J.G.; De Girolamo, A.M.; Oueslati, O.; Maataoui, A.; Lo Porto, A. Evaluation of soil and water conservation measures in a semi-arid river basin in Tunisia using SWAT. Soil Use Manag. 2014, 30, 539–549. [Google Scholar] [CrossRef]
  63. Zhang, Z.; Huang, Y.; Huang, J. Hydrologic alteration associated with dam construction in a medium-sized coastal watershed of southeast China. Water 2016, 8, 317. [Google Scholar] [CrossRef]
  64. Šarauskienė, D.; Adžgauskas, G.; Kriaučiūnienė, J.; Jakimavičius, D. Analysis of hydrologic regime changes caused by small hydropower plants in lowland rivers. Water 2021, 13, 1961. [Google Scholar] [CrossRef]
  65. Ali, R.; Kuriqi, A.; Abubaker, S.; Kisi, O. Hydrologic alteration at the upper and middle part of the yangtze river, China: Towards sustainable water resource management under increasing water exploitation. Sustainability 2019, 11, 5176. [Google Scholar] [CrossRef]
  66. Brouziyne, Y.; Belaqziz, S.; Benaabidate, L.; Aboubdillah, A.; El Bilali, A.; Elbeltagi, A.; Tzoraki, O.; Chehbouni, A. Modeling long term response of environmental flow attributes to future climate change in a North African watershed (Bouregreg watershed, Morocco). Ecohydrol. Hydrobiol. 2022, 22, 155–167. [Google Scholar] [CrossRef]
  67. Uday Kumar, A.K.V.J. Assessment of flow regime alteration in the Krishna River basin. ISH J. Hydraul. Eng. 2022, 28, 212–218. [Google Scholar] [CrossRef]
  68. Spurgeon, J.J.; Pegg, M.A. Juvenile growth of a macrohabitat generalist tied to hydrological character of large-river system. Freshw. Biol. 2017, 62, 291–302. [Google Scholar] [CrossRef]
  69. Abebe, W.B.; Tilahun, S.A.; Moges, M.M.; Wondie, A.; Derseh, M.G.; Nigatu, T.A.; Mhiret, D.A.; Steenhuis, T.S.; Camp, M.V.; Walraevens, K.; et al. Hydrological foundation as a basis for a holistic environmental flow assessment of tropical highland rivers in ethiopia. Water 2020, 12, 547. [Google Scholar] [CrossRef]
  70. Bouslihim, Y.; Rochdi, A.; El Amrani Paaza, N.; Liuzzo, L. Understanding the effects of soil data quality on SWAT model performance and hydrological processes in Tamedroust watershed (Morocco). J. Afr. Earth Sci. 2019, 160, 103616. [Google Scholar] [CrossRef]
  71. Briak, H.; Moussadek, R.; Aboumaria, K.; Mrabet, R. Assessing sediment yield in Kalaya gauged watershed (Northern Morocco) using GIS and SWAT model. Int. Soil Water Conserv. Res. 2016, 4, 177–185. [Google Scholar] [CrossRef]
  72. Brouziyne, Y.; Abouabdillah, A.; Chehbouni, A.; Hanich, L.; Bergaoui, K.; McDonnell, R.; Benaabidate, L. Assessing hydrological vulnerability to future droughts in a Mediterranean watershed: Combined indices-based and distributed modeling approaches. Water 2020, 12, 2333. [Google Scholar] [CrossRef]
  73. Yactayo, G.A. Modification of the SWAT Model to Simulate Hydrologic Processes in a Karst-Influenced Watershed. Doctoral Dissertation, Faculty of Virginia Polytechnic Institute and State University, Blacksburg, VA, USA, 2009. [Google Scholar]
  74. Al Khoury, I.; Boithias, L.; Labat, D. A Review of the Application of the Soil and Water Assessment Tool (SWAT) in Karst Watersheds. Water 2023, 15, 954. [Google Scholar] [CrossRef]
  75. Dai, J.; Pan, L.; Deng, Y.; Wan, Z.; Xia, R. Modified SWAT Model for Agricultural Watershed in Karst Area of Southwest China. Agriculture 2025, 15, 192. [Google Scholar] [CrossRef]
  76. Toledo, C.E.; Alcantara, N.R. Sensitivity of hydrological connectivity in a semiarid basin with a high-density reservoir network. Rev. Ambient. Água. 2019, 14, e2367. [Google Scholar] [CrossRef]
  77. Chbouki, N.; Stockton, C.W.; Myers, D.E. Spatio-temporal patterns of drought in Morocco. Int. J. Climatol. 1995, 15, 187–205. [Google Scholar] [CrossRef]
  78. Hrour, Y.; Thomas, Z.; Fovet, O.; Sebari, K.; Rousseau-Gueutin, P. Changes in precipitation and discharge in a Mediterranean catchment as a response to climate change and human activities. J Water Clim Change 2022, 13, 3253–3273. [Google Scholar] [CrossRef]
  79. Fox, H.R.; Wilby, R.L.; Moore, H.M. The impact of river regulation and climate change on the barred estuary of the Oued Massa, southern Morocco. River Res. Appl. 2001, 17, 235–250. [Google Scholar] [CrossRef]
  80. Hakam, O.; Baali, A.; El Kamel, T.; Ahouach, Y.; Azennoud, K. Comparative evaluation of various drought indices (DIs) to monitor drought status: A case study of Moroccan Lower Sebou basin. Kuwait J. Sci. 2022, 49, 1–25. [Google Scholar] [CrossRef]
  81. Ghalley, W.; Niemann, J.D.; Shrestha, S. Hydrologic alteration by hydropower dams and climate change in the Sesan Basin. J. Appl. Water Eng. Res. 2024, 12, 388–406. [Google Scholar] [CrossRef]
  82. Zuo, Q.; Liang, S. Effects of dams on river flow regime based on IHA/RVA. Proc. Int. Assoc. Hydrol. Sci. 2015, 368, 275–280. [Google Scholar] [CrossRef]
  83. El Adnani, A.; Habib, A.; Zourarah, B. Spatio-temporal dynamics and evolution of land use land cover using remote sensing and GIS in Sebou Estuary, Morocco. J. Geogr. Inf. Syst. 2019, 11, 551–566. [Google Scholar] [CrossRef]
  84. Lamhasni, N.; Lahcen, C.; Timallouka, M. Bio-évaluation de la qualité des eaux de surface d’oued Beht (Maroc) Indice Biologique Global des réseaux de contrôle et de surveillance (IBG-RCS). Eur. Sci. J. 2017, 13, 94–111. [Google Scholar]
  85. Guellaf, A.; Kassout, J.; Boselli, V.A.; Bennas, N.; El Alami, M.; Errochdi, S.; Kettani, K. Short-term responses of aquatic ecosystem and macroinvertebrate assemblages to rehabilitation actions in martil river (North-Western Morocco). Hydrobiology 2023, 2, 446–462. [Google Scholar] [CrossRef]
  86. Lobera Galán, G.; Muñoz Gràcia, I.; López Tarazón, J.A.; Vericat Querol, D.; Batalla, R.J. Effects of flow regulation on river bed dynamics and invertebrate communities in a Mediterranean river. Hydrobiologia 2017, 784, 283–304. [Google Scholar] [CrossRef]
  87. Belmar, O.; Velasco, J.; Gutiérrez-Cánovas, C.; Mellado-Díaz, A.; Millán, A.; Wood, P.J. The influence of natural flow regimes on macroinvertebrate assemblages in a semiarid Mediterranean basin. Ecohydrology 2013, 6, 363–379. [Google Scholar] [CrossRef]
  88. Poff, N.L.; Zimmerman, J.K.H. Ecological responses to altered flow regimes: A literature review to inform the science and management of environmental flows. Freshw. Biol. 2010, 55, 194–205. [Google Scholar] [CrossRef]
  89. Vicente-Serrano, S.M.; López-Moreno, J.I. Hydrological response to different time scales of climatological drought: An evaluation of the Standardized Precipitation Index in a mountainous Mediterranean basin. Hydrol. Earth Syst. Sci. 2005, 9, 523–533. [Google Scholar] [CrossRef]
  90. Vélez-nicolás, M.; García-lópez, S.; Ruiz-ortiz, V.; Zazo, S.; Molina, J.L. Precipitation Variability and Drought Assessment Using the SPI: Application to Long-Term Series in the Strait of Gibraltar Area. Water 2022, 14, 884. [Google Scholar] [CrossRef]
  91. Lopez-Bustins, J.A.; Pascual, D.; Pla, E.; Retana, J. Future variability of droughts in three Mediterranean catchments. Nat. Hazards 2013, 69, 1405–1421. [Google Scholar] [CrossRef]
Figure 1. Location of study area: (a) North Africa, (b) Morocco, (c) Sebou watershed, and (d) Beht watershed.
Hydrology 12 00109 g001
Figure 2. Observed vs. simulated daily flows during calibration/validation.
Hydrology 12 00109 g002
Figure 3. Annual flow duration curve.
Hydrology 12 00109 g003
Figure 4. Pre- and post-impact of monthly flows.
Hydrology 12 00109 g004
Figure 5. Monthly flow for January (a) and July (b).
Hydrology 12 00109 g005
Figure 6. RVA classification of the main hydrological alteration factors.
Hydrology 12 00109 g006
Figure 7. Environmental flow components in Beht River basin (1970–2014).
Hydrology 12 00109 g007
Figure 8. Duration of environmental flow components.
Hydrology 12 00109 g008
Figure 9. Timing of environmental flow components.
Hydrology 12 00109 g009
Figure 10. SPI at 6 months (a), 12 months (b), and 36 months (c).
Hydrology 12 00109 g010aHydrology 12 00109 g010b
Table 1. Classification of model sensitive parameters.
Sensitivity LevelParametersOptimal Value
1CN2.mgt0.14
2GW_DELAY.gw (days)31.02
3ESCO.hru0.75
4GW_REVAP.gw0.2
5GWQMN.gw (mm H2O)2190
6ALPHA_BF.gw (days)0.8
7EPCO.hru0.86
8SOL_AWC.sol (mm H2O/mm Soil)0.24
9REVAPMN.gw (mm H2O)400.22
10CH_K2.rte (mm/hr)83.31
11CH_N2.rte0.22
Table 2. Performance indicators for calibration/validation.
IndicesCalibrationValidation
NSE0.680.61
R20.70.73
RSR0.40.3
Table 3. IHA parameter results.
IHA FactorPre-ImpactPost-ImpactVariation (%)
Group 1October0.150.5227.45
November1.582.4354.38
December1.753.2685.92
January2.653.6638.04
February1.953.0456.26
March2.542.38−6.3
April1.852.2823.24
Mai0.980.78−20.3
June0.10.28193.48
July0.030.0578.79
August0.020.02−2.35
September0.030.037.63
Group 21-day minimum0.0120.0132.25
3-day minimum0.0170.015−9.18
7-day minimum0.01850.0183−1.02
30-day minimum0.021660.02163−0.13
90-day minimum0.0270.071155.71
1-day maximum61.9584.5836.52
3-day maximum33.5851.8754.46
7-day maximum18.8332.8474.4
30-day maximum8.0813.8671.36
90-day maximum5.456.85325.53
Number of zero days000
Base flow index0.00580.008240.73
Group 3Date of minimum flow2312362.16
Date of maximum flow3173345.36
Group 4Low pulse count98−11.11
Low pulse duration21−50
High pulse count4525
High pulse duration138.5−34.61
Group 5Rise rate 0.02560.06288145.62
Fall rate−0.1318−0.163223.82
Number of reversals1711837.01
Table 4. Characteristics of drought events based on SPI of 6, 12, and 36 months.
EventStartEndDurationMagnitudeIntensityFrequency
SPI-6112/01/198007/01/19818−12.30.6514.00%
210/01/198103/01/19826−11.70.51
310/01/198207/01/19839−150.6
410/01/198303/01/19846−12.10.5
512/01/198807/01/19898−12.30.65
610/01/198903/01/19906−11.70.51
711/01/199203/01/19935−7.120.7
812/01/199405/01/19956−9.520.63
904/01/200007/01/20004−4.550.88
1006/01/200111/01/20016−10.60.57
1104/01/200510/01/20057−13.10.53
1205/01/200808/01/20084−5.330.75
SPI-12112/01/198003/01/198216−29.50.5416.30%
204/01/198304/01/198413−26.90.48
312/01/198803/01/199016−29.50.54
406/01/199309/01/19934−4.410.91
501/01/199510/01/199510−14.50.69
605/01/199909/01/19995−5.580.9
711/01/200109/01/200211−16.10.68
805/01/200512/01/20058−9.770.82
905/01/200808/01/20084−4.040.99
SPI-36112/01/198110/01/198435−59.10.5916.10%
204/01/198512/01/19859−12.80.7
311/01/198901/01/199115−19.20.78
403/01/199510/01/19958−9.560.84
504/01/200110/01/200219−24.50.78
Disclaimer/Publisher’s Note: The statements, opinions and data contained in all publications are solely those of the individual author(s) and contributor(s) and not of MDPI and/or the editor(s). MDPI and/or the editor(s) disclaim responsibility for any injury to people or property resulting from any ideas, methods, instructions or products referred to in the content.