Abstract
Climate change has intensified extreme rainfall events, increasing the risk of overflow in agricultural reservoirs originally designed without flood control. This study presents a practical approach for assessing the overflow risk by incorporating both hydrological and structural factors. The key evaluation indicators used for analysis were freeboard (height from the flood level to the embankment level), height from the full water level to the embankment level, inflow–outflow relationship, and flood management capacity relative to the watershed area. Based on the design standards, reservoirs in Jeollanam-do were selected for assessment, and those with a high overflow risk were identified. Rainfall runoff simulations were conducted to evaluate the reservoirs, and the results indicated that considering all four indicators allowed an effective assessment of overflow risk. Multiple regression analysis yielded an R2 value of 0.79, suggesting that the relationships among the selected indicators were suitable and had high explanatory power. The findings of this study are expected to provide a practical method for rapidly assessing reservoir overflow risks and developing effective flood response strategies.
1. Introduction
Reservoirs play a crucial role in agricultural production by ensuring a stable water supply, improving crop productivity, and mitigating water shortages. However, climate change has increased the frequency and intensity of extreme rainfall events, significantly exacerbating the risk of reservoir overflow. In addition, most agricultural reservoirs in South Korea have been in operation for over 50 years, leading to structural deterioration and reduced safety. These factors collectively pose serious threats to the structural stability of reservoirs and increase the likelihood of overflow-induced damage [1].
Recently, extreme rainfall events exceeding the original design frequency have occurred due to abnormal climate conditions, resulting in overflow and embankment failures in several cases. These incidents highlight the urgent need to reassess both the structural and hydrological safety of existing reservoirs under changing climatic conditions. As most agricultural reservoirs are designed with natural overflow spillways, the risk of overflow damage increases significantly when flood inflows exceed the discharge capacity [2]. Overflow events can lead to reservoir embankment failure, which can result in severe damage to downstream residential areas, farmlands, and infrastructure. In extreme cases, loss of human life may occur, emphasizing the urgent need for a systematic approach to effectively assess and manage overflow risks.
South Korea has approximately 17,000 agricultural reservoirs, most of which are small to medium-sized and dispersed across rural areas. Given the large number of facilities and the limited resources available for detailed analysis, there is a growing need for a rapid and efficient method to evaluate and manage potential overflow risks across the entire reservoir network. Given this background, developing an effective and simplified method for systematically assessing reservoir overflow risk has become a critical task. A comprehensive assessment should consider the structural, hydrological, and operational characteristics of reservoirs [3]. One of the key methodologies for evaluating overflow risk is flood routing, which simulates reservoir water level fluctuations during flood events and helps analyze reservoir safety. However, owing to the significant spatial and temporal variability of rainfall, establishing a clear and standardized evaluation criterion is challenging. This study aimed to address this challenge by reviewing key data used in flood routing, analyzing hydrological relationships, and conducting regression analysis to propose practical evaluation criteria that facility managers can easily apply.
Several previous studies have proposed different approaches for evaluating the hydrological safety of reservoirs. Shin et al. [4] proposed a three-stage system for evaluating hydrological safety and refining dam safety assessment standards. The first stage assesses the freeboard according to the type and condition of the dam. The second stage evaluates the structural safety against a probable maximum flood (PMF), and the third stage analyzes the downstream risk during PMF inflows. These improvements have been incorporated into existing hydrological safety evaluation standards, particularly for extreme flood scenarios. Kwon et al. [5] suggested improving domestic hydrological safety standards by focusing solely on freeboard availability, overflow occurrence, and downstream risk, regardless of the dam material or structural conditions. Lee et al. [6,7] and Park et al. [8] used an analytic hierarchy process to determine the key factors affecting reservoir safety based on expert surveys, and assigned weights to each factor for evaluation. However, these studies lacked quantitative hydrological analysis. Woo and Choi [9] focused on overflow assessment based on runoff curve analysis using rainfall runoff simulations; however, they neglected the reservoir capacity.
Gabriel-Martin et al. [10] proposed a methodology for economically analyzing the influence of initial reservoir levels on the hydraulic safety of dams and downstream areas by applying an economic risk index. They demonstrated that the variability of initial reservoir levels plays a crucial role in assessing the hydrological safety of dams. Lompi et al. [11] proposed a stochastic approach to integrate climate change into dam safety assessments, using the Eugui Dam in the Aragon River basin, Spain, as a case study. They quantified the impact of climate change on dam overflow risk and presented a more accurate and practical evaluation method by applying various climate scenarios.
Our study proposes an integrated approach for assessing reservoir overflow risk by incorporating both structural and hydrological factors. Key evaluation indicators were identified by analyzing hydrological safety assessments, national design standards, and previous research to develop a simplified evaluation method that facility managers could effectively use. To determine the evaluation criteria, factors identified in various studies were compiled, and their correlation with reservoir rainfall runoff simulation results was examined.
Based on this analysis, this study aimed to achieve the following: first, develop a practical and simplified method for overflow risk assessment using fixed structural indicators. Second, identify and validate key structural and hydrological factors, such as freeboard, inflow–outflow relationships, and flood control volume, which are grounded in national design standards. Third, evaluate the effectiveness of these indicators through simulation-based validation and multiple linear regression analysis.
Qualitative and highly variable factors, such as meteorological characteristics, were incorporated through a general hydrological safety analysis, whereas overflow risk was assessed using fixed and non-variable factors. This simplified approach enables more focused and efficient operation and management during flood seasons and provides a practical tool for improving reservoir safety in the field.
2. Materials and Methods
2.1. Safety Evaluation Indicators
Hydrological safety evaluation followed the “Detailed Guidelines for Safety Inspections and Precision Safety Diagnoses” [12]. The evaluation criteria classify the safety assessment into three categories: freeboard assessment based on dam type and condition, structural safety evaluation against the PMF, and risk assessment of downstream areas.
The first category involves evaluating the freeboard, defined as the vertical distance between the maximum water level and the embankment crest. This measure serves as a direct indicator of overtopping risk and is interpreted differently depending on the dam type—for example, fill dams typically require greater freeboard due to their erosion vulnerability. The second component considers structural safety, which refers to the reservoir’s capacity to withstand extreme hydrological events, particularly the probable maximum flood (PMF), as prescribed by national design standards. Assessing whether a reservoir can endure such events is essential for understanding its performance under worst-case scenarios. Finally, downstream risk is incorporated by examining the presence of residential areas, farmlands, or infrastructure downstream of the reservoir that may be exposed to flood hazards in the event of overflow or dam failure. This consideration adds a spatial and socio-economic dimension to the evaluation framework. These components serve as essential indicators for rainfall runoff simulation and collectively reflect the unique characteristics of agricultural reservoirs in South Korea. Additionally, downstream risk assessment is suitable for emergency action plans to evaluate human and economic damage. This study aimed to develop a simple and easily applicable evaluation method using fixed items that did not require complex calculations. Therefore, qualitative and hydrologically variable factors were excluded, whereas hydrologically fixed factors were prioritized. The indicators identified by Lee et al. [6,7] and Park et al. [8] are listed in Table 1 and were considered.

Table 1.
Hydrological safety assessment factors.
The structural characteristics required for rainfall runoff simulations include embankment height, spillway capacity, effective storage volume, design freeboard, full water level, and flood level. The hydrological characteristics included watershed area, travel time, curve number, rainfall runoff coefficient, design rainfall, inflow, and outflow. The design rainfall varies annually because of unpredictable climatic variations. Therefore, this study excluded design rainfall and focused on indicators that remained unchanged, such as reservoir specifications and watershed conditions. Additionally, downstream human and material damage was excluded because the objective was to identify reservoirs with a high overflow risk. However, the downstream risk factors within the selected high-risk reservoirs were considered for maintenance, management, and reinforcement planning.
2.2. Selection of Evaluation Criteria Based on Design Standards
The evaluation criteria adopted in this study are primarily based on national design standards for agricultural infrastructure [13], which provide technical guidelines for freeboard height, PMF-based flood design, and downstream risk considerations. These standards are a regulatory foundation for assessing hydrological and structural safety and ensure consistent application across various reservoir types. According to the “Design Standards for Agricultural Infrastructure (Fill Dams)—Chapter 4: Design—4.3 Reservoir Capacity” [13], agricultural fill dams do not have a flood control function. During extreme floods, the rapid rise in the water level increases the risk of dam overflow, as inflow floods are discharged without regulation. More than 99% of the agricultural reservoirs in South Korea are small-scale fill dams designed primarily for irrigation rather than flood control. Most were constructed over 50 years ago and lack modern monitoring or active water level management systems. Structurally, these reservoirs are simple in design and are predominantly equipped with free-flow spillways, which are designed to release inflows immediately without any gate-controlled regulation [9,14]. As such, they are fundamentally constructed on the assumption that the inflow volume must be discharged at the same rate, resulting in an approximate 1:1 inflow–outflow relationship under normal conditions. Therefore, reservoirs exposed to overflow risk must be identified rather than performing hydrological analysis for the entire hydrograph. Furthermore, comparing the difference between the peak inflow and outflow is a better approach to determining whether the reservoir has sufficient capacity for smooth water discharge [2].
According to the “Design Standards for Agricultural Infrastructure (Fill Dams)—Chapter 4: Design—4.6 Standard Cross-Section Design—4.6.3 Non-Overflow Dam Height” [13], most agricultural reservoirs without gates do not exceed an overflow depth of 2.5 m, requiring a 2 m freeboard from the design flood level. The criteria are shown in Table 2. Additionally, the “Dam Design Standards—Fill Dams—Freeboard” [15] specify that the freeboard of dams without flood control capacity should be determined based on the normal full water level. The influencing factors are pre-selected before design because the freeboard varies significantly depending on the slope roughness of the dam. The standard freeboard for fill dams is typically 2–3 m. However, as agricultural reservoirs are primarily designed for irrigation, many have insufficient freeboards, making this an important factor for assessment.
Table 2.
Height of the non-overflow section of the embankment.
2.3. Selection of Indicators and Review of Theoretical Formulas
Based on design standards and their significance in rainfall runoff simulations, the inflow–outflow relationship, freeboard, height from full water level to the embankment, and reservoir volume relative to the watershed area were selected to assess the overflow risk of agricultural reservoirs.
The height from the full water level to the embankment represents the available storage space to accommodate sudden increases in water levels due to extreme rainfall. This indicator is essential for estimating flood defense capacity and the reservoir’s safety against water level surges. Freeboard, the distance between the flood level and embankment, is crucial for evaluating the risk of extreme water level rises during floods. Together with the height from the full water level to the embankment, freeboard allows for precise evaluation of the overflow potential.
The reservoir volume relative to the watershed area is another key metric used to determine the reservoir’s ability to store excess inflow during extreme conditions. According to design standards, the volume should ideally be at least 1.5 times the expected maximum inflow volume to accommodate long-term rainfall and extreme climatic events, ensuring the reservoir’s flood management capability.
The inflow–outflow relationship is a fundamental aspect of the original reservoir design and serves as a crucial criterion for assessing the overflow risk. The Rational Method and Weir Equation were applied for the inflow and outflow calculations, respectively. Both equations are widely used in design standards to ensure reliability and practicality. The Rational Method, first proposed by Mulvaney in 1851, is an empirical equation used to estimate the peak runoff from rainfall events. It is widely used in practical applications owing to its simplicity and effectiveness [16]. The equation considers rainfall intensity, watershed area, and the runoff coefficient.
where Q, I, and A denote the runoff (m3/s), rainfall intensity (mm/h), and watershed area (km2), respectively.
In this study, the rainfall intensities of individual reservoirs were not used to reduce regional variations in rainfall intensity and ensure consistency in the evaluation. Instead, the highest recorded rainfall at the observation station with maximum precipitation was used. The runoff coefficient was set to 0.7, corresponding to the typical runoff coefficient for steep mountainous areas. Approximately 70% of South Korea’s land area consists of mountainous terrain, and the upstream watershed of agricultural reservoirs is characterized by steep slopes and rugged terrain. Under these conditions, rainfall runoff occurs rapidly, resulting in low soil infiltration and increased surface runoff. Therefore, the runoff coefficient for a steep mountainous area was applied [2,17].
The Weir Equation is based on Bernoulli’s (1738) fluid mechanics principles and was further refined by Francis (1883) and Rehbock (1929) through extensive experimental research [18,19]. This equation is typically used to estimate the outflow discharge from reservoirs and spillways. Because it assumes simple hydraulic behavior, the discharge can be estimated using basic reservoir specifications, making it highly practical.
where Q, C, , and denote the discharge (m3/s), discharge coefficient, effective spillway length (m), and total head, including the approach velocity head (m), respectively. The discharge coefficient is a key variable in the weir equation, and it varies depending on the characteristics of the overflow section. Commonly used discharge coefficients range from 1.7 to 2.6 and are determined based on the shape and physical characteristics of the weir section, considering the overflow water level (H) and weir crest width (L). From Figure 1 [20], the discharge coefficient (CD) was determined based on the ratio of the spillway height to the total head (P/Hd), as presented in the graph by Roverson [20], and then calculated. The calculation of CD for overflow-type spillways was divided into three sections to improve computational efficiency, and nonlinear regression equations were formulated as presented in Table 3 [2,21].
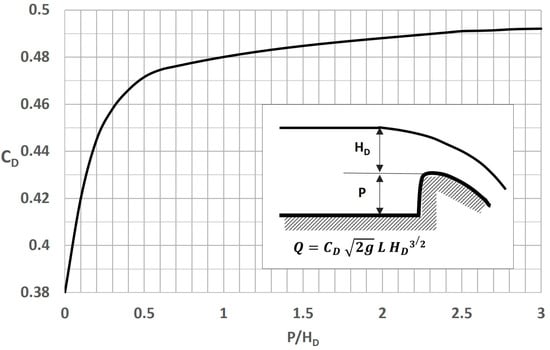
Figure 1.
Estimation of the discharge coefficient (CD) [21].
Table 3.
Estimation of the regression equation for (CD) [20,21].
2.4. Selection of the Study Area
South Korea is highly susceptible to climate change due to its geographical and climatic characteristics. Approximately 60% of its annual precipitation, including heavy rainfall events, occurs between June and September during the rainy and typhoon seasons. This concentrated rainfall, coupled with the country’s mountainous topography and rapid runoff from steep slopes, makes the region particularly vulnerable to flooding, particularly from agricultural reservoirs that lack the infrastructure to manage extreme weather events [22].
Jeollanam-do, which is one of the areas with the highest annual rainfall in South Korea, exhibits considerable rainfall variability. It was selected as the target region in this study, as shown in Figure 2. This region has a high concentration of agricultural reservoirs, a high proportion of mountainous areas, and significant inflow variations owing to rapid rainfall runoff. Therefore, conducting safety assessments of agricultural reservoirs and analyzing flood risk was deemed appropriate.
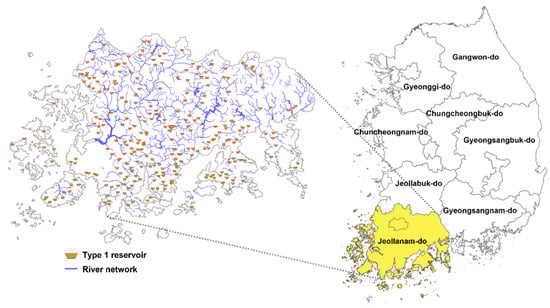
Figure 2.
Study Area.
Reservoirs with established precision safety diagnosis reports were used to ensure data reliability. A total of 251 reservoirs were selected, among which 70 reservoirs with installed gates and 3 pumping-type reservoirs were excluded because they were capable of flood control and water level regulation, including emergency discharge in the event of floods, which can mitigate overflow risks. Among the 50 observation stations in Jeollanam-do, the station with the highest recorded rainfall intensity was the Jindo (Cheomchalsan) station. To ensure a conservative and accurate assessment of overflow risk by reflecting the most extreme cases, the rainfall intensity data from the Jindo (Cheomchalsan) station were uniformly applied [2].
2.5. Theory of Rainfall Runoff Models
Rainfall runoff simulation is the process of predicting the runoff volume of a watershed under specific rainfall conditions. As many of the reservoirs under study are located in ungauged watersheds, the calculation was performed by estimating the synthetic unit hydrograph using empirical formulas. In this study, the Clark unit hydrograph method was utilized. The Clark unit hydrograph method assumes that the reservoir, storage volume, and outflow have a linear relationship, treating the system as a linear reservoir. It derives a single unit hydrograph for a given watershed [13,23,24]. To perform rainfall runoff simulations and reservoir routing, we utilized the KRC-Hydrologic Analysis System (K-HAS), which internally applies the Clark unit hydrograph method. K-HAS automates the process of generating inflow hydrographs based on the watershed area and time of concentration, and performs flood routing to estimate reservoir outflows. This eliminates the need for manual derivation of hydrographs and allows for efficient simulation across multiple reservoirs. The methodology used in K-HAS is conceptually equivalent to the HEC-HMS model developed by the U.S. Army Corps of Engineers. Both adopt the Clark unit hydrograph framework and a linear reservoir assumption for routing. The key difference lies in model integration and user environment: K-HAS provides a simplified, standardized interface tailored to Korean agricultural reservoirs and incorporates domestic design standards [25]. In contrast, HEC-HMS offers modular customization and greater flexibility for complex hydrological systems. Despite these differences, the hydrological simulation logic remains fundamentally similar [26]. In this study, the application is planned to be limited to a single meteorological observation station. Therefore, instead of deriving an instantaneous unit hydrograph, the inflow hydrograph to the outlet reservoir was calculated by applying the hyetograph to the time–area curve. These data were then used to perform flood routing [13]. A linear reservoir can be represented by the storage equation as shown in Equation (4).
where S, K, and O denote the storage (m3/s), storage coefficient, and outflow, respectively; by substituting these into the continuity equation (Equation (5)) and rearranging the instantaneous unit hydrograph (IUH), (Equations (6)–(8)) can be derived as follows.
where are the inflow and outflow at the beginning of the routing period, respectively; and are the inflow and outflow at the end of the routing period, respectively.
Figure 3 shows the concept of the Clark unit hydrograph method [13].
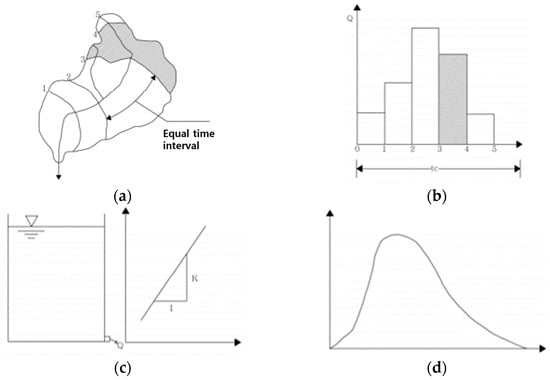
Figure 3.
Concept of Clark unit hydrograph method: (a) Isochrones of a watershed; (b) Time–area histogram; (c) Storage–outflow relationship of a reservoir; (d) IUH.
2.6. Regression Analysis
Regression analysis is a statistical method used to explore and model the relationship between a dependent variable and one or more independent variables [27,28]. Regression analysis is primarily used for two main purposes: predicting new observations and inferring the relationship between variables. Considering that the selected factors and the results of the rainfall runoff simulation allow for inference, it was deemed suitable for use in the validity assessment. The regression coefficients and p-values, which can be easily obtained through regression analysis, represent the influence of variables within the model and the statistical significance of their effects. The regression coefficient indicates the magnitude and direction of the effect that an independent variable has on the dependent variable, whereas the p-value quantitatively represents the likelihood that the observed relationship occurred by chance [28]. By examining both factors, the magnitude of the effect represented by the regression model can be determined, and the existence of sufficient statistical evidence to support that effect can be assessed. Through this balanced interpretation, the significance and reliability of the study’s findings can be accurately understood.
3. Results and Discussion
3.1. Selection of Candidate Reservoirs for Overflow Risk and Rainfall Runoff Simulation
To select candidate reservoirs with overflow risks, the reservoirs were first classified based on design standards and predefined criteria (height from the flood level to the embankment was less than 2 m and a positive inflow–outflow difference) [13]. Among the 178 reservoirs analyzed, 101 had a freeboard less than 2 m. When the selection was further narrowed to reservoirs where the inflow had a higher value than the outflow, 26 reservoirs were identified. To verify the validity of this selection and assess additional criteria, rainfall runoff simulations were conducted for these 26 reservoirs, and the results are presented in Table 4.
Table 4.
Candidate sites for reservoirs with overflow risks and rainfall runoff simulation results.
The simulations revealed that six reservoirs exceeded the embankment elevation, indicating an overflow risk. Some reservoirs had insufficient freeboards, whereas others maintained safe margins. For 11 reservoirs, the height from the full water level to the embankment was less than 2 m, and the simulation results showed that the freeboards were −0.63–0.54 m. For the Geumdong reservoir (Suncheon), Daepo reservoir (Yeosu), and Shinbang reservoir (Boseong), the height from full water level to the embankment was greater than 2 m; however, the simulation results indicated insufficient freeboard. This result was attributed to an insufficient reservoir capacity relative to the watershed area compared with the other reservoirs. The simulation results showed that reservoirs with a freeboard of at least 1 m had sufficient height from the full water level to the embankment and adequate reservoir capacity relative to the watershed area. The Cheoneun reservoir (Gurye) had a significantly insufficient flood management volume relative to the watershed area; however, its height from the full water level to the embankment was sufficient at 3.49 m, confirming its safety. The Chasa reservoir (Suncheon) had insufficient reservoir capacity relative to the watershed area; however, it was considered safe because the difference between the inflow and outflow was minimal, and the freeboard was approximately 2 m.
The predefined criteria were deemed valid and simple for identifying reservoirs at risk of overflow. Reliable results were rapidly and efficiently obtained by classifying candidate reservoirs based on the four criteria and prioritizing them through rainfall runoff simulations.
3.2. Regression Analysis Results
Rainfall runoff simulations were conducted for approximately 70 reservoirs, including 26 candidate reservoirs. Additionally, the relationships and validities of the four evaluation criteria were verified through correlation and multiple regression analyses.
Figure 4 shows the results of the correlation analyses. Correlation analyses were used to examine the relationship between the dependent variable (rainfall runoff simulation results) and the independent variables. The variable with the highest correlation was the freeboard, with a correlation coefficient of 0.7819, followed by the height from the full water level to the embankment, with the second-highest correlation at 0.6992. These two indicators are considered important for the structural safety of reservoir design and for preventing sudden water level increases. They are believed to show a strong correlation with the simulation results. The inflow–outflow difference exhibited a negative correlation. Considering that higher inflow and lower outflow increased both the reservoir water levels and the risk of overflow, the relationship between the inflow and outflow was confirmed to significantly influence the simulation results. Among the various factors, the spillway length exhibited a high correlation with the watershed area, flow-path length, flood management volume (storage between the full water level and embankment), and inflow volume. Thus, the spillway length is a crucial variable in reservoir design that reflects the characteristics of the reservoirs and interacts with the surrounding watershed environment. Consequently, it is an important factor in assessing overflow risk. Travel time represents the time required for the water to flow into the reservoir. While shorter travel times can affect the rate of water level rise and inflow volume, most reservoirs exhibited travel times of less than 1 h, resulting in insufficient variation. Therefore, applying travel time as a criterion for selecting reservoirs at risk of overflow is challenging.
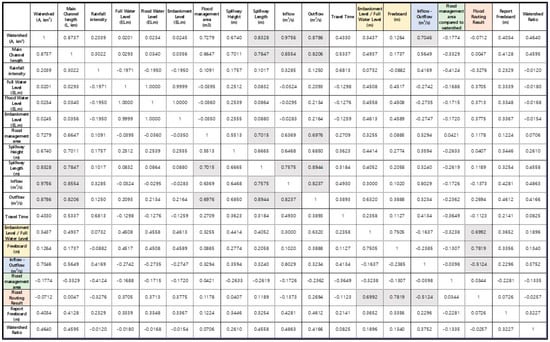
Figure 4.
Correlation analysis results by item.
Multiple regression analysis was conducted using the selected indicators. The validity of these items for overflow risk assessment was verified by analyzing the correlation and impact of the determined variables. The dependent variable was the height from the peak water level to the embankment based on the rainfall runoff simulation results. Multiple regression analysis was conducted using the following four independent variables determined based on the design standards: freeboard, height from full water level to embankment, inflow–outflow difference, and flood management volume relative to the watershed area.
The multiple correlation coefficient (R) of 0.89 and coefficient of determination (R2) of 0.79 indicated that the relationships among the selected variables were strongly correlated, further supporting the methodology of the study by demonstrating the statistical significance and explanatory power of the chosen indicators in evaluating overflow risk. The graph reflecting the regression equation is shown in Figure 5a. The R2 value indicates the explanatory power of the selected indicators, with a higher value signifying that the independent variables can effectively explain the variance in spillway risk. The R value further measures the strength of the correlation between the selected indicators and spillway risk. Freeboard was identified as the most critical factor in determining overflow risk, while the height from the full water level to the embankment was the second most important variable. When analyzed together, these two factors were key indicators for assessing the overflow risk. These two variables are closely related to flood defense and sudden water level rise in reservoir safety assessments, and if sufficient height above the original reservoir embankment was not secured during the initial design, it would be necessary to carefully reassess the safety of the reservoirs. Both variables had p-values < 0.001, indicating that they were statistically highly significant factors, as shown in Table 5. The difference between the inflow and outflow showed a negative correlation, indicating that higher inflow and lower outflow increased reservoir water levels and the risk of overflow. Additionally, the flood management volume relative to the watershed area had a regression coefficient of 0.815, indicating that the overflow risk significantly decreased with increasing flood storage capacity. This variable was also statistically significant (p = 0.003).
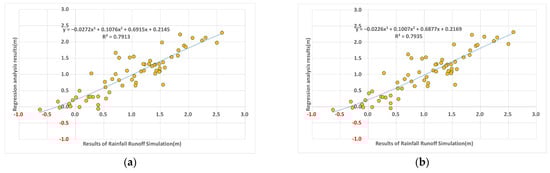
Figure 5.
Relationship between the results of regression analysis and rainfall runoff simulation: (a) decided items; (b) decided items + spillway length.
Table 5.
Regression analysis results.
The four selected items are expected to serve as practical and efficient tools for the quick assessment of overflow risks. Although the spillway length showed a strong correlation with the watershed area, flow path length, flood management volume (storage between the full water level and embankment), and inflow, when included as independent variables, the coefficient of determination (R2) showed no significant change (as shown in Figure 5b), with a p-value of 0.44, which was greater than 0.05, indicating low statistical significance. As the spillway length is already indirectly reflected in the selected items, it is an unnecessary variable for the assessment.
Although freeboard and height from the full water level to the embankment show a high correlation, which may necessitate a multicollinearity analysis, we believe that each variable independently contributes to explaining the variability in overflow risk. However, to further enhance the statistical rigor of the model, we plan to apply multicollinearity diagnostics (e.g., Variance Inflation Factor (VIF)) when developing indicators using the four selected items in future studies, to ensure the independence of the chosen variables and reinforce the reliability of the indicators.
This approach has been statistically validated, showing that overflow risk reservoirs can be quickly classified by using a small number of indicators. It reduces the complexity of the analysis and makes it easily accessible to field managers. Agricultural reservoirs will be able to quickly identify candidate reservoirs at risk of overflow based on their current status and structural parameters. In the future, if these four indicators are used for more systematic verification, such as multicollinearity analysis, it is believed that a much simpler overflow risk assessment for reservoirs will be possible.
4. Conclusions
This paper describes a practical approach to assessing high-risk reservoirs based on watershed conditions and reservoir status before conducting a detailed analysis. The validity of this method was confirmed through rainfall runoff simulations and regression analyses.
The four items determined based on the design standard theory were the freeboard, height from the full water level to the embankment, inflow–outflow difference, and flood management volume relative to the watershed area. The analysis was conducted on 251 reservoirs in the Jeollanam-do region, excluding those with floodgates. Based on the design standards, the two predefined criteria used for classification were a freeboard of less than 2 m and a positive inflow–outflow difference.
When classifying reservoirs with a freeboard of less than 2 m and a positive inflow-outflow difference, 26 reservoirs were identified, and rainfall runoff simulations were conducted. The reservoirs were evenly distributed, ranging from those that exceeded the embankment elevation to those that maintained sufficient freeboard. Here, reservoirs with a relatively higher overflow risk were classified based on the height from the full water level to the embankment and flood management volume relative to the watershed area. By simplifying the classification using four indicators, the candidate reservoirs at risk of overflow were effectively identified, and the method was validated.
Rainfall runoff simulations were conducted for 70 reservoirs, including the 26 selected reservoirs. Correlation and multiple regression analyses were conducted to verify the applicability and validity of the selected items. When examining the relationships between the selected indicators based on the rainfall runoff simulation results, it was found that freeboard and height from the full water level to the embankment showed a high correlation. Considering both of these factors together will provide a more reliable overflow risk assessment. The inflow–outflow difference showed a negative correlation. The flood management volume relative to the watershed area exhibited a low correlation.
In the regression analysis, the correlation coefficient was 0.89, showing a high correlation, and the coefficient of determination (R2) was 0.79, indicating strong explanatory power. Additionally, the p-values for all items were below 0.05, confirming their statistical significance.
Agricultural reservoirs in South Korea share similar geographical and structural characteristics. Thus, the four indicators determined in this study will provide valuable information for reservoir management and safety assessment. Additionally, this approach will offer a practical tool to help field managers quickly assess and manage overflow risks. Specifically, the findings can be applied to real-time monitoring systems or used to pre-identify high-risk reservoirs, which will reduce response times and enhance flood mitigation strategies.
Author Contributions
Conceptualization, K.S. and Y.J.; methodology, K.S.; validation, J.H. and D.K.; formal analysis, K.S.; investigation, Y.J.; writing—original draft preparation, K.S.; writing—review and editing, D.K.; supervision, K.S.; project administration, K.S.; funding acquisition, J.H. All authors have read and agreed to the published version of the manuscript.
Funding
This work was supported by the Ministry of Agriculture, Food and Rural Affairs (MAFRA), Korea (RS-2025-02219948).
Data Availability Statement
The data that support the findings of this study are available from the corresponding author upon reasonable request.
Acknowledgments
We appreciated the anonymous reviewers who significantly improved our earlier version of the manuscript.
Conflicts of Interest
The authors declare no conflicts of interest.
References
- U.S. Army Corps of Engineers. Hydrologic Engineering Requirements for Reservoirs; USACE: Washington, DC, USA, 2018.
- Shim, K.; Heo, J.; Jin, Y. Assessment of overflow risk in agricultural reservoir based on the water balance theory. J. Korean Soc. Agri. Eng. 2024, 24, 203–209. [Google Scholar] [CrossRef]
- HEC-HMS Technical Reference Manual. Flood Routing Techniques for Reservoirs; Hydrologic Engineering Center, U.S Army Corps of Engineers: Davis, CA, USA, 2023.
- Shin, C.S.; Ryu, G.J.; Cho, G.S.; Bae, B.W. Improvement of hydrological safety evaluation guideline for existing dams. J. Water Future 2007, 40, 44–52. [Google Scholar]
- Kwon, J.H.; Shin, S.C.; Ryu, G.J.; Jung, H.S. Examples of hydrological safety evaluation for existing dams. In Proceedings of the Korea Water Resources Association Conference, Busan, Republic of Korea, 16–20 June 2008; pp. 555–559. [Google Scholar]
- Lee, J.J.; Rhee, K.H.; Park, J.S.; Han, C.W.; Jin, W.G. Development of evaluation items and indicators for hydrological safety on agricultural reservoirs. J. Wetl. Res. 2014, 16, 403–411. [Google Scholar]
- Lee, J.J.; Park, J.S.; Rhee, K.H. Development and application of hydrological safety evaluation guidelines for agricultural reservoirs with AHP. J. Wetl. Res. 2014, 16, 235–243. [Google Scholar] [CrossRef]
- Park, J.S.; Rhee, K.H.; Lee, J.J.; Shim, C.S.; Jin, W.G.; Hu, S.Y. Development of hydrological safety evaluation model for agricultural reservoir. J. Wetl. Res. 2015, 17, 130–138. [Google Scholar] [CrossRef]
- Woo, H.; Choi, J. Flood simulation analysis for agricultural reservoirs using runoff curve method. J. Hydrol. 2016, 540, 367–380. [Google Scholar]
- Gabriel-Martin, I.; Sordo-Ward, A.; Garrote, L.; Granados, I. Hydrological Risk Analysis of Dams: The Influence of Initial Reservoir Level Conditions. Water 2019, 11, 461. [Google Scholar] [CrossRef]
- Lompi, M.; Mediero, L.; Soriano, E.; Caporali, E. Climate Change and Hydrological Dam Safety: A Stochastic Methodology Based on Climate Projections. Hydrol. Sci. J. 2023, 68, 745–760. [Google Scholar] [CrossRef]
- Ministry of Land, Infrastructure and Transport. Detailed Guidelines for Safety Inspection and Precision Safety Diagnosis; MLIT: Sejong-si, Republic of Korea, 2017.
- Ministry of Agriculture, Food and Rural Affairs. Design Standards for Agricultural Infrastructure; MAFRA: Sejong-si, Republic of Korea, 2022.
- Shin, E.S.; Lee, J.K. Safety management improving way of small agricultural reservoir. J. Korean Geosynth. Soc. 2012, 11, 53–58. [Google Scholar] [CrossRef]
- Ministry of Land, Infrastructure and Transport. Dam Design Standards; MLIT: Sejong-si, Republic of Korea, 2020.
- Mulvaney, T.J. On the use of self-registering rain and flood gauges in making observations of the relations of rainfall and flood discharges in a given catchment. Proc. Inst. Civ. Eng. Irel. 1851, 4 Pt II, 18–33. [Google Scholar]
- Yoo, C.S.; Park, H.K. Analysis of Morphological Characteristics of Farm Dams in Korea. J. Korean Geogr. Soc. 2007, 42, 940–954. [Google Scholar]
- Francis, J.B. Experiments on the flow of water over weirs. Philos. Trans. R. Soc. Lond. 1883, 36, 311–320. [Google Scholar]
- Rehbock, T. Flow over rectangular weirs. J. Hydraul. Eng. 1929, 55, 225–232. [Google Scholar]
- Roberson, J.A.; Cassidy, J.J.; Chaudhry, M.H. Hydraulic Engineering; John Wiley and Sons: New York, NY, USA, 1998; p. 158. [Google Scholar]
- Oh, J.H.; Jang, S.H.; Oh, K.D. Operation analysis and application of modified slope-area method for the estimation of discharge in multi-function weir. J. Korea Water Resour. Assoc. 2018, 51, 687–701. [Google Scholar]
- Lim, C.H.; Yoo, S.; Choi, Y.; Jeon, S.W.; Son, Y.; Lee, W.K. Assessing Climate Change Impact on Forest Habitat Suitability and Diversity in the Korean Peninsula. Forests 2018, 9, 259. [Google Scholar] [CrossRef]
- Youn, S.; Kan, M.; Yoo, C. Flood runoff analysis considering the uncertainty on the Clark model parameters: A case study on the Chungju dam basin. J. Soc. Hazard Mitig. 2017, 17, 425–438. [Google Scholar] [CrossRef]
- Kim, J.Y.; Kwon, D.S.; Bae, D.H.; Kwon, H.H. Bayesian parameter estimation of Clark unit hydrograph using multiple rainfall-runoff data. J. Korea Water Resour. Assoc. 2020, 53, 383–393. [Google Scholar]
- Korea Rural Community Corporation. K-HAS User Manual; Korea Rural Community Corporation: Naju, Republic of Korea, 2023. [Google Scholar]
- Kim, H.K.; Kang, M.S.; Song, I.; Hwang, S.H.; Park, J.H.; Song, J.H.; Kim, J.H. Flood inundation analysis in a low-lying rural area using HEC-HMS and HEC-RAS. J. Korean Soc. Agri. Eng. 2012, 54, 1–6. [Google Scholar]
- Montgomery, D.C.; Peck, E.A.; Vining, G.G. Introduction to Linear Regression Analysis, 5th ed.; Wiley: Hoboken, NJ, USA, 2012. [Google Scholar]
- Kutner, M.H.; Nachtsheim, C.J.; Neter, J.; Li, W. Applied Linear Statistical Models, 5th ed.; McGraw-Hill/Irwin: New York, NY, USA, 2005. [Google Scholar]
Disclaimer/Publisher’s Note: The statements, opinions and data contained in all publications are solely those of the individual author(s) and contributor(s) and not of MDPI and/or the editor(s). MDPI and/or the editor(s) disclaim responsibility for any injury to people or property resulting from any ideas, methods, instructions or products referred to in the content. |
© 2025 by the authors. Licensee MDPI, Basel, Switzerland. This article is an open access article distributed under the terms and conditions of the Creative Commons Attribution (CC BY) license (https://creativecommons.org/licenses/by/4.0/).