Abstract
Rapid population growth and widespread industrialization are the main contributing factors to the increasing contamination of the world’s diminishing freshwater resources. This work investigates Fe/TiO2 as an efficient and sustainable photocatalyst for treating organic micropollutants in water. The photocatalysts prepared by these mechanochemical methods used a high-energy ball milling technique to manipulate Fe/TiO2’s structural, optical, and catalytic properties for the photo-oxidation of 2,4-Dichlorophenol (2,4-DCP). Doping with iron effectively reduced the band gap of rutile TiO2 from 3 to 2.22 eV. By reducing the ball/powder ratio from 34 to 7, the removal efficiency of 2,4-DCP increased from 65.2 to 84.7%. Measuring the TOC indicated 63.5 and 49.4% mineralization by Fe/TiO2-7 and rutile TiO2, respectively, after 24 h. The energy yields for the Fe/TiO2 and rutile TiO2 were 0.13 and 0.06 g 2,4-DCP/kW h, respectively.
1. Introduction
Global climate change, population growth, and urbanization will see more than four billion people suffer water stress for at least one month each year by 2050 [1,2]. Moreover, decades of unbridled agricultural and industrial expansion have heavily polluted lakes, rivers, and aquifers with heavy metals, chemicals, pesticides, herbicides, and pharmaceuticals that are detrimental to human health and the environment [3,4,5]. Among the emerging pollutants, chlorophenols pose the biggest challenge, being persistent and refractory toxicants that bioaccumulate in the food chain. In addition, their wide use in pesticides, herbicides, fungicides, dyes, and pharmaceuticals [6,7] means they can be found extensively in the environment [8].
The chemical compound 2,4-dichlorophenol (2,4-DCP) is widespread, and due to its toxicity, carcinogenicity, and mutagenicity, it is a priority pollutant of the US Environmental Protection Agency (EPA) [9]. In addition, conventional water and wastewater treatment processes are ineffectual [10,11,12] at treating it, as demonstrated by its increasing occurrence in drinking water at levels exceeding the permissible concentrations of 0.5 ppm [6]. Thus, providing the impetus to develop more efficient treatment technologies such as advanced oxidation processes (AOP) that include photocatalysis [13], UV/H2O2 [14], UV/O3 [15], UV/H2O2/O3 [16], and Fenton/sonolysis methods [17].
Photocatalysis is attractive as it can harness light, particularly sunlight, to generate reactive radical species to degrade pollutants. It provides a low cost, efficient, and sustainable remediation method for treating recalcitrant contaminants [18,19,20]. TiO2 photocatalysts are popular due to their relatively low cost, excellent durability, superb chemical stability, and high electron transport [21]. A critical shortcoming of TiO2 is its wide bandgap, which limits its light utilization to UV wavelengths [22]. Introducing foreign atoms such as Zn [23], Gd [24], Cu [25], Lu [26], and Al [27] can narrow its bandgap, and iron proved to be the most promising [28,29]. Iron’s ionic radii, comparable to Ti4+, are readily inserted into TiO2’s crystal lattice. Iron is also inexpensive and non-toxic compared to the other dopants.
The mechanochemical catalyst preparation process affords a simple, inexpensive, and green preparation of the photocatalysts [30]. This technology can help to reduce particle sizes, which plays a vital role in improving photocatalytic performance and can produce nanoparticles of a large surface area that are enriched in oxygen-containing functional groups [31]. In mechanochemical synthesis, the type of ball mill (e.g., zirconium dioxide), nature of the milling material [32], and milling speed and time [33] are crucial variables. An appropriate ball-to-powder weight ratio (B/P) is another critical parameter in high-energy ball milling. A high B/P sees more ball-to-ball impact and inefficient milling [24], while a very low B/P from overfilling reduces grinding [34]. Prior studies have often neglected the effects of ball sizes when studying B/P, which will be considered in our study of Fe/TiO2 photocatalyst preparation and its impact on Fe3+ insertion and the subsequent structure, morphology, optical, and photocatalytic properties of the photocatalysts.
2. Materials and Methods
2.1. Materials
Titanium (IV) oxide, rutile (99.5% trace metals basis, CAS number: 1317-80-2), and iron (III) nitrate nonahydrate (≥98%, CAS number: 7782-61-8) catalyst precursors and 2,4-dichlorophenol (99%, CAS number: 120-83-2) were purchased from Sigma-Aldrich and used without further purification. The 2,4-DCP solutions were in deionized distilled water.
2.2. Fe/TiO2 Photocatalysts
The Fe/TiO2 catalysts were synthesized in a dry planetary ball mill (PBM-0.4A) at room temperature in air. Three catalyst batches were milled at B/P = 34, 17, and 7 from a powder mixture of 5 wt.% Fe(III) and 95 wt.% TiO2. Briefly, the Fe/TiO2-34 was obtained by milling 2.5 g catalyst precursor mixture with zirconia beads of 15 mm (2), 12 mm (8), 8 mm (6), and 5 mm (42) in size; the Fe/TiO2-17 was prepared by milling 5 g catalyst precursor mixture; and the Fe/TiO2-7 was milled from 5 g catalyst precursor mixture with 8 mm (6) and 5 mm (42) beads. The milling speeds and durations were kept at 400 rpm and 10 h, respectively. The direction of the milling rotation reversed every 10 min. Before conducting photocatalytic reaction, the catalyst was dissolved in 15 mL DDI water and then centrifuged (5000 rpm, 3 min) to remove the possible iron ions on its surface. The catalyst was then dried at 65 °C.
2.3. Catalyst Characterization
The catalysts’ structures, morphologies, and surface textures were determined by X-ray diffraction (XRD), scanning electron microscopy (SEM), and nitrogen physisorption. The powder XRD was conducted in a PANalytical X-ray Diffractometer, Model X’pert Pro, using 2 kW Cu-Kα X-ray radiation with a graphite monochromator at a 1.5406 Å wavelength and a 7 degrees/min scan rate. The crystal size was determined using the Scherrer equation (Equation (1)) by taking the average of the dominant peaks in the diffraction data [35,36], as follows:
where, Ds is the crystal size (nm), K is the shape factor, βD is FWHM, λ is the wavelength of the CuKα radiation (1.5406 Å), and θ stands for the angle of the XRD. K is generally considered to be 1.0 for spherical particles.
The SEM imaging was performed using a JEOL JSM-7100F at 15 kV and 1.1 nm resolution on finely dispersed catalyst powder on a clean silicon wafer. Precautions were taken to minimize sample charging by using conductive carbon tape for sample-mounting the aluminum holder and sputtering the sample with a thin gold layer. The nitrogen physisorption isotherms of the catalysts were obtained using a Belsorp mini X (MicrotracBEL Inc., Haan, Germany). Herein, the powder catalyst was outgassed at 150 °C for 6 h before taking measurements, and the Barrett–Joyner–Halenda (BJH) model was used to determine the pore size distribution.
The catalysts’ surface compositions were analyzed with a Kratos X-ray Photoelectron Spectrometer with a monochromatic Al Ka X-ray source at 1486.6 eV and an X-ray power of 150 W. The binding energy (BE) was referenced to the C 1s signal at 284.8 eV. The catalysts were further analyzed with a UV-vis NIR spectrometer (Perkin Elmer, Lambda 950) for their optical properties and band gap energies. The Raman spectra of the catalysts were collected by a Renishaw InVia Raman spectrometer equipped with a notch filter up to 100 cm–1 and a 100 mW Ar-laser (514 nm) as an excitation source at two scans and 30 s acquisition times under room temperature.
2.4. Photocatalytic Oxidation Reaction
Figure 1 displays the photoreactor for the batch photocatalytic oxidation of the 2,4-DCP. It consisted of a quartz tube reactor placed equidistant (10 mm) from three 6 W GE F6T5 35 lamps. The light from the lamps was filtered by a 3 mm thick polycarbonate UV-cutoff filter to remove wavelengths of <400 nm. The photoreactor setup was placed inside a stainless-steel isolation box to avoid ambient lighting. A pair of DC fan circulated air and maintained a temperature of 25 °C. A 2,4-DCP stock solution (16 mg/L) was diluted to 4.08 mg/L, and 100 mL was added to the reactor, along with 100 mg photocatalyst to create a 1 g/L catalyst loading. The initial pH of the solution was ~6.5 before starting the photocatalytic reaction. The reaction mixture was stirred in the dark for one hour to allow adsorption equilibrium to be reached before turning on the light. Then, at fixed time intervals, 2 mL of the reaction mixture was drawn and centrifuged at 6000 rpm (Labnet C-1200 Mini Centrifuge) for 4 min. The supernatant was analyzed in triplicate by a UPLC (WATERS Acquity H-class) equipped with an ACQUITY UPLC BEH C18 Column (2.1 mm × 100 mm, 1.7 µm). The concentration of 2,4-DCP was recorded by optical spectrum measurement at 284 nm. The mobile phase in the UPLC consisted of acetonitrile and 0.1% trifluoroacetic acid solution at a flow rate of 0.35 mL/min (25 °C). The total organic carbon (TOC) was determined with a Shimadzu TOC-LCPH/CPN. The reaction for each photocatalyst was repeated three times.
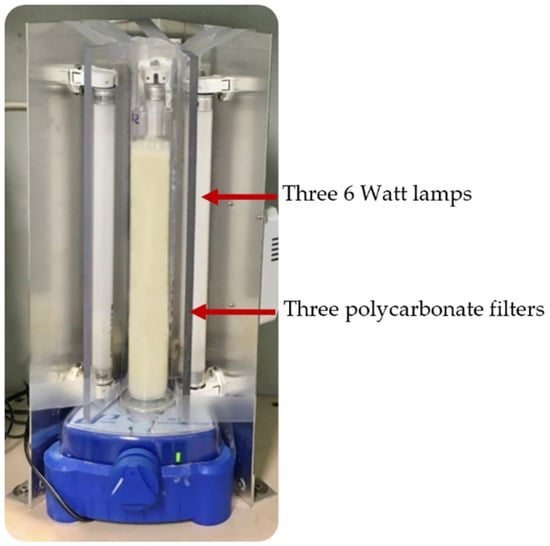
Figure 1.
A photograph of the photoreactor setup for the photocatalytic oxidation of the 2,4-DCP.
The 2,4-DCP conversion was calculated according to Equation (2):
where C0 and are the initial and final concentrations of the 2,4-DCP and t indicates the reaction time. Meanwhile, the mineralization and energy yield are presented in Equations (3) and (4):
where and are the initial and final concentrations of the TOC at time t, respectively and the energy yield (Y, g/kWh) represents the energy efficiency of the pollutant degradation and is strongly influenced by the reactor design and light source [37]:
where is for the initial concentration of the 2,4-DCP, is the degradation efficiency (%) at the reaction time t, and P is the nominal power of the light source (kW). G50 is the energy yield when the degradation efficiency is 50% ( = 50%) at a reaction time of t50. The related cost is calculated according to the electricity cost in Hong Kong.
3. Results and Discussion
3.1. Fe/TiO2 Photocatalysts
Figure 2 plots the X-ray diffraction of the rutile and ball-milled TiO2 and the prepared Fe/TiO2 samples, which display only diffraction peaks corresponding to the rutile TiO2 [38,39]. Doping the samples with 5 wt.% Fe3+ showed a slight 0.033° shift for the Fe/TiO2-34 and Fe/TiO2-17, and a 0.066° shift for the Fe/TiO2-7. In contrast, the ball-milled TiO2 did not show any diffraction shift from that of the rutile TiO2. This slight shrinkage in the lattice (i.e., 0.00003 and 0.006 Å, respectively) is consistent with the lattice substitution of Fe3+ for Ti4+. Indeed, the Fe3+ ion (0.64 Å) is slightly smaller than the Ti4+’s radii (0.68 Å), and i9t can readily be inserted into the TiO2 lattice [40]. The crystal size was smaller following ball-milling, as indicated by the diffraction peaks broadening, and the ball-milled TiO2 measured 48.3, 45.1, and 41 nm for the Fe/TiO2-34, Fe/TiO2-17, and Fe/TiO2-7, respectively, compared to the rutile TiO2 (73.3 nm).
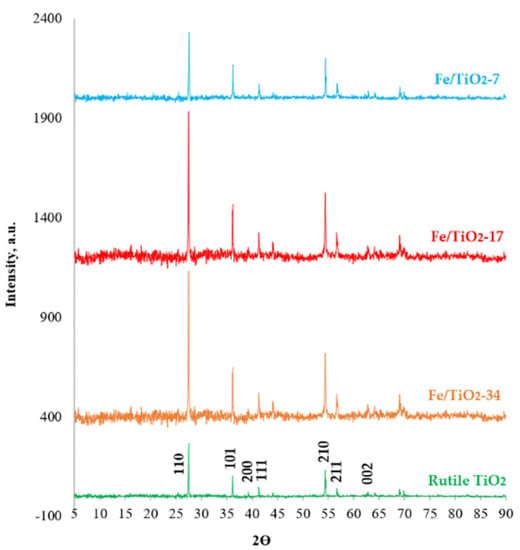
Figure 2.
X-ray diffraction patterns of the rutile TiO2 (Rutile), ball-milled TiO2 (Rutile-7), and Fe/TiO2 (B/P = 7, 17, and 34) prepared by mechanochemical ball-milling at 400 rpm for 10 h.
The micro-Raman spectra in Figure 3 are consistent with the XRD data and display only the characteristic bands of the rutile TiO2 at 144 cm−1 (B1g), 449 cm−1 (Eg), and 611 cm−1 (A1g). The 237 and 1049 cm−1 bands originate from multiple phonon-scattering processes and NO3- ions, respectively [41,42]. The absence of iron-related bands indicates the successful doping of iron into the TiO2. In addition, there were no contaminants from the milling bar and jar detected in the samples. The ball-milled Fe/TiO2 had a light-yellow color compared to the rutile and ball-milled TiO2, as shown in Figure 4.
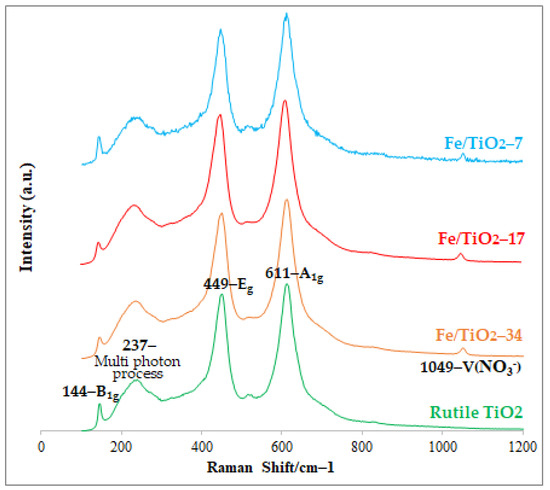
Figure 3.
Micro-Raman spectra of the rutile TiO2 (Rutile), ball-milled TiO2 (Rutile-7), and Fe/TiO2 (B/P = 7, 17, and 34) prepared by mechanochemical ball-milling at 400 rpm for 10 h.
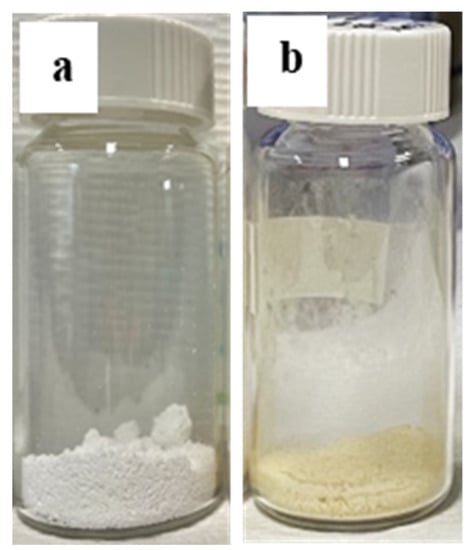
Figure 4.
Photographs of (a) rutile TiO2 and (b) ball-milled Fe/TiO2-7.
Figure 5 presents the scanning electron micrographs of the rutile TiO2 (Figure 5a), Fe/TiO2-34 (Figure 5b), Fe/TiO2-17 (Figure 5c), and Fe/TiO2-7 (Figure 5d). During ball-milling, the sample underwent collisions and attritions which subjected the particles to repetitive breaking–welding–breaking cycles that gradually abraded large particles into fine grains [43]. The ball-milled Fe/TiO2 samples are less aggregated and better dispersed than the rutile TiO2 (Figure 5a). Further, the Fe/TiO2 powders prepared with balls of different sizes (i.e., 15, 12, 8, and 5 mm) have a broader particle size distribution (cf. Figure 5b,c) compared to the powder ball-milled with balls of similar sizes (i.e., 8 and 5 mm), as shown in Figure 5d. The Fe/TiO2 milled at a higher B/P with less sample led to air-grinding and rounder particles.
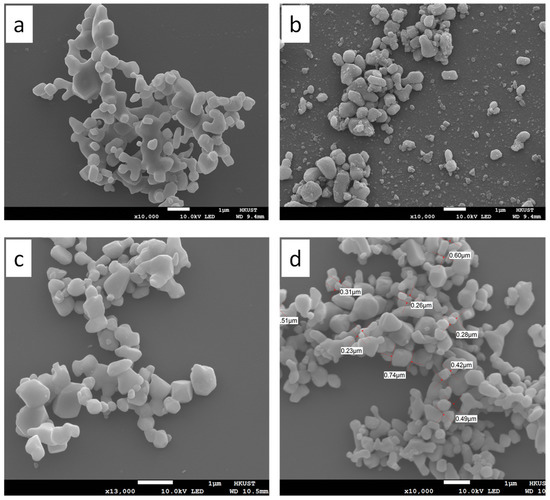
Figure 5.
SEM images of (a) pristine TiO2, (b) Fe/TiO2-34, (c) Fe/TiO2-17, and (d) Fe/TiO2-7.
Figure 6 plots the N2 adsorption–desorption isotherms of the rutile TiO2 and Fe/TiO2-7. Both isotherms are type IV curves with hysteresis loops, which are associated with a mesoporous range (2–50 nm, according to IUPAC classification) [44]. Mesopores are known to enhance diffusion, and thus enhance photocatalytic reactions [45], and according to the BJH model, the mean pore diameters of rutile TiO2 and Fe/TiO2-7 are 7.39 and 14.83 nm, respectively. Table 1 shows the B/P decreasing from 34 to 7, resulting in a smaller mean pore diameter (52.41 to 16.20 and 14.83 nm).
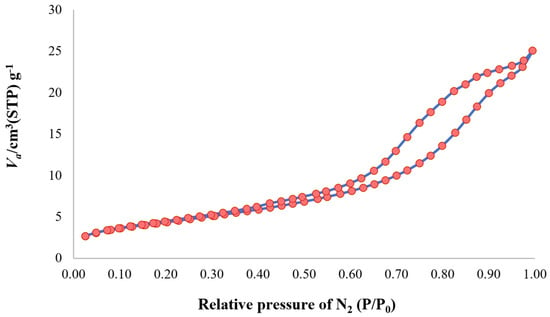
Figure 6.
Nitrogen physisorption isotherms for ball-milled Fe/TiO2-7.

Table 1.
Surface properties of the rutile TiO2 and produced Fe/TiO2 catalysts.
The UV-Vis diffuse reflectance spectra (DRS) and corresponding Tauc plots of the rutile TiO2 and Fe/TiO2-7 are presented in Figure 7. The TiO2 has an absorption edge at the 368 nm wavelength (Figure 7a) and calculated bandgap energy (Eg) of 3.00 eV (at the 417 nm cut-off Landa), which is consistent with the literature [46,47]. Ball-milled Fe/TiO2 shifts the absorption edge of the visible region (546 nm) and narrows the bandgap to 2.22 eV. It is believed the iron creates new e-/h+ and traps energy levels (Fe4+/Fe3+ and Fe3+/Fe2+) between the conduction band and valence band of TiO2 precursors [48,49]. Lattice defects from ball-milling can also play a role [50]. The earlier work by Carneiro et al. [50] prepared Fe/TiO2 by ball-milling aeroxide TiO2 P25 with 10 wt.% Fe to obtain photocatalysts that were 2.45 eV broader, in comparison with this study.
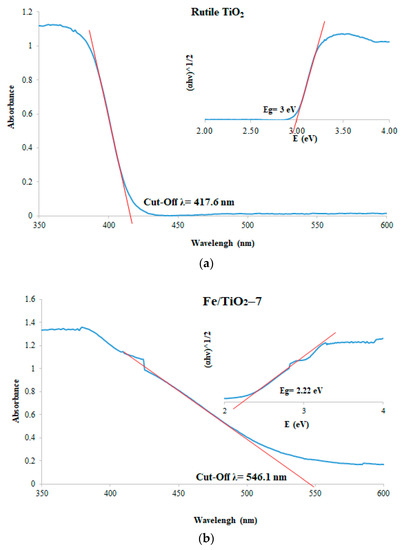
Figure 7.
UV-Vis diffuse reflectance spectra of the (a) bare rutile TiO2 and (b) Fe/TiO2-7, with their corresponding Tauc plot insets.
Figure 8 compares the electronic structure of the rutile TiO2 and Fe/TiO2-7. According to XPS measurements, the conduction band of Fe/TiO2-7 is 0.67 eV compared to 0 eV for the rutile TiO2 and the valence band is 2.89 eV against TiO2’s 3.00 eV. Electrons and holes are generated by the photocatalyst as it absorbs photons with energy equal to or greater than its bandgap energy. The electrons and holes migrate to the catalyst surface and react with adsorbed O2 or H2O to generate reactive hydroxyl radicals (•OH), superoxide radicals (O2•−), and holes (h+) that oxidize the pollutants to reactive intermediates. The highly reactive •OH (redox potential = +3.06 V) is generated by water decomposition or holes and an -OH reaction, while the superoxide anion (O2•−) can participate in the production of a hydroperoxyl radical (HO2•) and, subsequently, H2O2. The general mechanism of photocatalysis over TiO2 is summarized in Equations (5)–(19) [51,52,53,54,55], as follows:
Light irradiation and photoexcitation: TiO2 + hv → e− + h+
e− trapping: e−CB → e-TR
h+ trapping: h+VB → h+TR
h+ + H2O → •OH + H+
Hydroxyl oxidation: OH− + h+ → •OH
h+ + 2H2O → H2O2 + H+
e− scavenging: (O2)ads + e− → O2•−
Superoxide protonation: O2•− + H+ → HO2•
e− co-scavenging: HO2• + e− → HO2−
H2O2 formation: e− + O2•− + 2H+ → H2O2
e− + H2O2 → •OH + OH−
O2•− + H2O2 → •OH + OH− + O2
2HO2• → O2 + H2O2
Photocatalytic oxidation by •OH: R-H + •OH → R• + H2O
Photocatalytic oxidation by direct h+: R-H + h+ → •R+ → degradation by-products
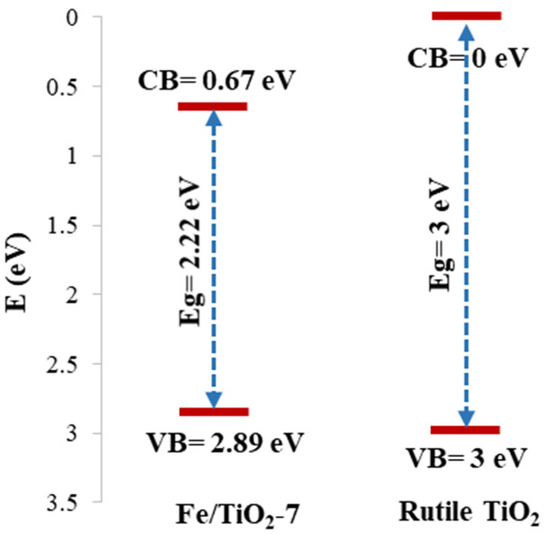
Figure 8.
Electronic structure of the rutile TiO2 and Fe/TiO2-7 from UV-Vis DRS and XPS measurements.
The XPS analysis of the rutile TiO2 and Fe/TiO2-7 is shown in Figure 9. The O 1s peak at 530.1 eV (Figure 9a) belongs to the lattice oxygen [56], and the peak at 532.8 eV is from chemisorbed (O) [56]. The Ti 2p spectra in Figure 9b show two main peaks of Ti2p3/2 and Ti2p1/2 at 458.8 and 464.6 eV, respectively, with a signal separation of 5.8 eV, which corresponds to Ti4+ [57,58]. Compared to the rutile TiO2, the Ti 2p3/2 and Ti 2p1/2 peaks shifted upward by 0.3 eV, which is attributed to lattice distortions following Fe3+ doping and the milling process. Figure 9c displays two peaks at 725 and 711.3 eV, assigned to Fe 2p1/2 and Fe 2p3/2, respectively. A satellite peak at 719.2 eV indicates the presence of Fe3+ [59]. All these peaks provide conclusive evidence for the presence of Fe3+ ions in the samples [56,60]. None of the binding energies of the Fe2+ (709 and 723 eV) and zero-valent iron (707 and 720 eV) were observed [61,62], which indicates the successful insertion of iron into the TiO2 lattice.
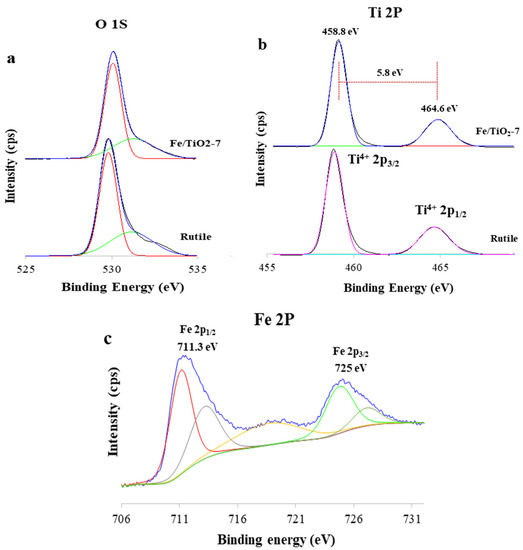
Figure 9.
Deconvolution and XPS spectra curve fitting for the (a) O 1 s, (b) Ti 2p, and (c) Fe 2p of TiO2 and Fe/TiO2-7.
3.2. Photocatalytic Oxidation of the 2,4-DCP
Figure 10 presents the photocatalytic oxidation of the 2,4-DCP over the rutile TiO2 and ball-milled Fe/TiO2 photocatalysts. After equilibrating under dark conditions, the 0.1 g TiO2, Fe/TiO2-34, Fe/TiO2-17, and Fe/TiO2-7 photocatalysts adsorbed 16.8, 18.8, 26.7, and 19.7%, respectively, of 4.08 mg/L 2,4-DCP (100 mL) and converted 59.4, 64.4, 71.8, and 81.4%, respectively, of 2,4-DCP after 24 h irradiation under visible light. A photolysis experiment exhibited a negligible reduction in the 2,4-DCP concentration (7.5%) after 24 h. The Fe/TiO2 is a more efficient photocatalyst, as Fe3+ ions can transform into Fe2+ and Fe4+ ions trapping e-/h+, as described in Equations (20) and (21) [63]:
Fe3+ + h+ → Fe4+
Fe3+ + e− → Fe2+
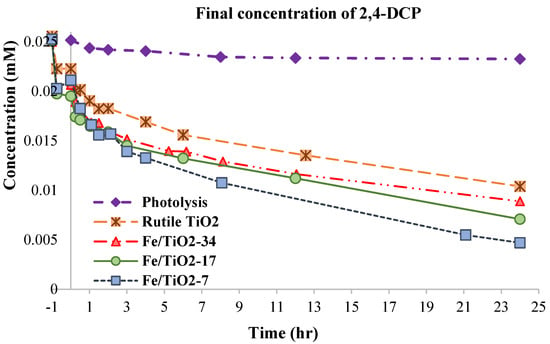
Figure 10.
Plots of the 2,4–DCP concentrations during photocatalytic oxidation reactions over the rutile TiO2, Fe/TiO2-34, Fe/TiO2-17, and Fe/TiO2-7 under visible light irradiation. Note: [2,4–DCP]0 = 4.08 mg/L, [TOC]0 = 9.47 mg/L, catalyst loading = 1 g/L, room temperature, no pH adjustment.
The Fe2+ and Fe4+, being less stable than Fe3+ and their relative energy levels Fe3+/Fe4+ and Fe3+/Fe2+ (Figure 11), allow the trapping of photo-generated e-/h+ and increase their lifetimes [64]. Prior work [65] has indicated that the energy level of the Fe3+/Fe2+ is below the TiO2 conduction band, while that of Fe4+/Fe3+ is above the TiO2 valence band [66]. Therefore, the transition of e- from Fe 3d orbitals to CB of TiO2 induces local states below the conduction band edge. This can significantly decrease the bandgap and increase the removal efficiency [59,66].
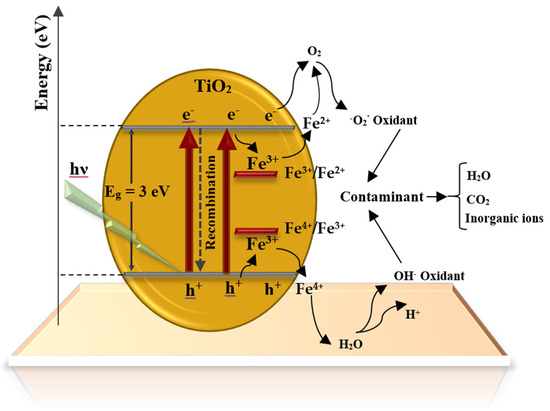
Figure 11.
Schematic display of the electronic band structure of Fe/TiO2-7.
Figure 12 presents the photoreaction kinetics, assuming a Langmuir–Hinshelwood (LH)) model as described by Equation (22) [67]:
where r, Ct, t, , and K refer to the reaction rate (mg/L·h), the concentration of 2,4-DCP at the reaction time t (mg/L), reaction time (h), photocatalytic reaction rate constant (h−1), and equilibrium constant for adsorption (L/mg), respectively. In heterogeneous photocatalytic reactions and at low concentrations (K × Ct << 1), Equation (22) can be simplified to Equation (23) [68]:
where is the apparent rate constant and can be calculated by plotting the graph of ln(Ct) versus t, as shown in Figure 12. Table 2 summarizes the reaction rate constant (k) and the linear correlation coefficients (R2) for the rutile TiO2 and Fe/TiO2 photocatalysts.
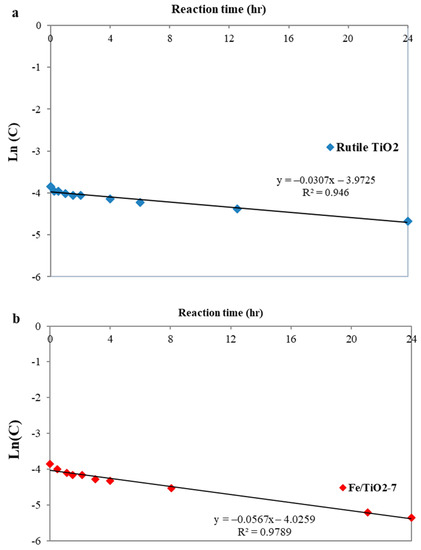
Figure 12.
Linear-log plot ln(C0) versus reaction time (h) for the degradation kinetic after 24 h reaction using (a) rutile and (b) Fe/TiO2-7 photocatalysts.

Table 2.
Kinetic parameters of the Fe/TiO2 samples (C0 = 0.025 mM, catalyst = 1 g/L).
Among the catalysts, Fe/TiO2-7 indicated the best performance in 2,4-DCP conversion. Despite using low-power light in the present study, the result is favorably comparable to the photocatalytic yield of Fe/TiO2 photocatalysts reported in other studies. The 10 wt.% Fe/TiO2 ball-milled catalyst (B/P = 8, 250 rpm, 5 h) prepared by Carneiro et al. [50] degraded 50.7% rhodamine B (5 mg/L) after 2 h irradiation under a pair of 15 W UV lamps. The 5 wt.% Fe/TiO2 (B/P = 5, 300 rpm, 5 h) prepared by Hadi et al. [69] converted 37% methylene blue (2 mg/L) after 4 h irradiation under 150 W visible light. Ramírez-Sánchez and Bandala [45] fabricated a hydrothermal sol-gel Fe/TiO2 catalyst which converted 10.63% estriol (2.9 mg/L) within 8 h of irradiation under a pair of 15 W visible light lamps (without UV cut-off filters). Mancuso et al. [63] prepared 3.5 wt.% Fe/TiO2 via a soft-templating method for treating 10 mg/L Acid Orange 7. They reported 32% conversion after a 3 h reaction time under 10 W white LED lighting.
Figure 13 plots the TOC with the reaction time for the rutile TiO2 and Fe/TiO2-7, showing that the latter has a greater mineralization of 2,4-DCP pollutants (i.e., 63.5 vs. 49.4%). In comparison, the 1 wt.% Fe/TiO2 prepared by the NaBH4 reduction method [70] reached 35% TOC removal for a 2,4-DCP solution after 3 h under an intense 100 W tungsten halogen lamp and vigorous aeration. Slow mineralization indicates the presence of refractory by-products that can pose more hazards than the main contaminant [71].
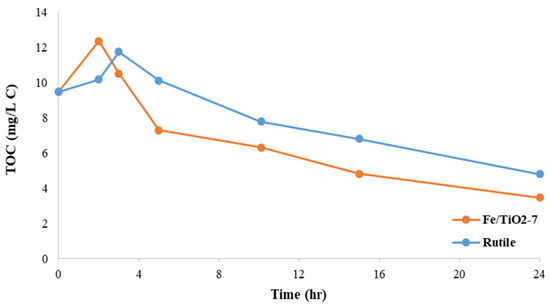
Figure 13.
Plots of TOC removal during photocatalytic oxidation reactions over TiO2 and Fe/TiO2-7 under visible light irradiation. Note: [2,4-DCP]0 = 4.08 mg/L, [TOC]0 = 9.47 mg/L, catalyst loading = 1 g/L, room temperature, no pH adjustment.
The energy consumed during the photocatalytic reaction is essential for calculating the operating cost of pollution treatment [72]. The G50s for the decomposition of 4.08 mg/L 2,4-DCP in the laboratory photoreactor setup using the rutile TiO2 and Fe/TiO2-7 were 0.13 and 0.06 g 2,4-DCP/kW·h. Thus, the Fe/TiO2-7’s energy yield is approximately twice that of the rutile TiO2. It costs $0.077 and $0.168 to degrade a gram of 2,4-DCP, according to Hong Kong electricity costs [73].
4. Conclusions
Ball-milling allows a simple and inexpensive method for inserting iron dopants into TiO2 to produce a series of visible light, photoactive Fe/TiO2 catalysts that include 5 wt.% iron. It is a green synthesis method that avoids the use of solvents. Applying different B/P ratios (34, 17, 7) and differently sized balls affect the particle morphology and size distribution. The mesoporous Fe/TiO2-7 prepared under optimum milling conditions (B/p: 7, at 400 rpm and 10 h) displayed the best photocatalytic activity. Fe3+ was successfully inserted into the TiO2 lattice, with no extraneous iron detected by XPS or micro-Raman. A concomitant change in lattice spacing was detected by XRD following the preparation of the Fe/TiO2-7. It was two times more efficient at 2,4-DCP conversion and mineralization compared to the rutile TiO2 and the other catalysts. The catalyst’s performance is commensurate to, or better than, similar Fe/TiO2 photocatalysts and requires less energy to degrade pollutants ($0.077 with respect to Hong Kong electricity costs).
Author Contributions
S.T.: methodology, investigation, software, writing—review and editing. K.-L.Y.: supervision, writing—review and editing, funding acquisition, and resources. B.A.-A.: supervision and review. All authors have read and agreed to the published version of the manuscript.
Funding
The authors are grateful for the financial support from the Hong Kong Research Grant Council (16211421), the Project of Hetao Shenzhen-Hong Kong Science and Technology Innovation Cooperation Zone (HZQB-KCZYB-2020083), and the staff from the MCPF, AEMF, and CBE in HKUST.
Institutional Review Board Statement
Not applicable.
Informed Consent Statement
Not applicable.
Data Availability Statement
Not applicable.
Acknowledgments
The authors acknowledge the funding of Postgraduate Studentships (PGSs) awarded by the Hong Kong University of Science and Technology.
Conflicts of Interest
The authors declare no competing financial interests.
References
- Naseri, A.; Sarabi, G.A.; Samadi, M.; Yousefi, M.; Ebrahimi, M.; Moshfegh, A.Z. Recent advances on dual-functional photocatalytic systems for combined removal of hazardous water pollutants and energy generation. Res. Chem. Intermed. 2022, 48, 911–933. [Google Scholar] [CrossRef]
- Boretti, A.; Rosa, L. Reassessing the projections of the World Water Development Report. npj Clean Water 2019, 2, 15. [Google Scholar] [CrossRef]
- Mariana, M.; HPS, A.K.; Yahya, E.B.; Olaiya, N.; Alfatah, T.; Suriani, A.; Mohamed, A. Recent trends and future prospects of nanostructured aerogels in water treatment applications. J. Water Process Eng. 2021, 45, 102481. [Google Scholar] [CrossRef]
- Hojjati-Najafabadi, A.; Mansoorianfar, M.; Liang, T.; Shahin, K.; Karimi-Maleh, H. A review on magnetic sensors for monitoring of hazardous pollutants in water resources. Sci. Total Environ. 2022, 824, 153844. [Google Scholar] [CrossRef]
- Kadmi, Y.; Favier, L.; Yehya, T.; Soutrel, I.; Simion, A.I.; Vial, C.; Wolbert, D. Controlling contamination for determination of ultra-trace levels of priority pollutants chlorophenols in environmental water matrices. Arab. J. Chem. 2019, 12, 2905–2913. [Google Scholar] [CrossRef]
- Zhu, X.; Zhang, K.; Wang, C.; Guan, J.; Yuan, X.; Li, B. Quantitative determination and toxicity evaluation of 2, 4-dichlorophenol using poly (eosin Y)/hydroxylated multi-walled carbon nanotubes modified electrode. Sci. Rep. 2016, 6, 1–12. [Google Scholar] [CrossRef]
- Esmaeili, N.; Saraei, F.E.K.; Pirbazari, A.E.; Tabatabai-Yazdi, F.-S.; Khodaee, Z.; Amirinezhad, A.; Esmaeili, A.; Pirbazari, A.E. Estimation of 2,4-dichlorophenol photocatalytic removal using different artificial intelligence approaches. Chem. Prod. Process Model. 2021. [Google Scholar] [CrossRef]
- Wu, C.; Zhou, L.; Zhou, C.; Zhou, Y.; Zhou, J.; Xia, S.; Rittmann, B.E. A kinetic model for 2,4-dichlorophenol adsorption and hydrodechlorination over a palladized biofilm. Water Res. 2022, 214, 118201. [Google Scholar] [CrossRef]
- Marwat, M.A.; Ullah, H.; Usman, M.; Ehsan, M.A.; Zhang, H.; Khan, M.F.; Ali, S.; Yousaf, M. Significantly improved photocatalytic activity of the SnO2/BiFeO3 heterojunction for pollutant degradation and mechanism. Ceram. Int. 2022, 48, 14789–14798. [Google Scholar] [CrossRef]
- Taghipour, S.; Ayati, B. Cultivation of aerobic granules through synthetic petroleum wastewater treatment in a cyclic aerobic granular reactor. Desalination Water Treat. 2017, 76, 134–142. [Google Scholar] [CrossRef]
- Taghipour, S.; Ayati, B.; Razaei, M. Study of the SBAR performance in COD removal of Petroleum and MTBE. Modares Civ. Eng. J. 2017, 17, 17–27. [Google Scholar]
- Taghipour, S.; Ayati, B. Study of SBAR Capability in Petroleum Wastewater Treatment. Water Reuse 2015, 2, 119–128. [Google Scholar]
- Taghipour, S.; Jannesari, M.; Ataie-Ashtiani, B.; Hosseini, S.M.; Taghipour, M. Catalytic Processes for Removal of Emerging Water Pollutants. In Emerging Water Pollutants: Concerns and Remediation Technologies; Bentham Science: Sharjah, United Arab Emirates, 2022; Volume 1, pp. 290–325. [Google Scholar] [CrossRef]
- Khorsandi, H.; Teymori, M.; Aghapour, A.A.; Jafari, S.J.; Taghipour, S.; Bargeshadi, R. Photodegradation of ceftriaxone in aqueous solution by using UVC and UVC/H2O2 oxidation processes. Appl. Water Sci. 2019, 9, 81. [Google Scholar] [CrossRef]
- Wang, Z.; Xu, J.; Yang, J.; Xue, Y.; Dai, L. Ultraviolet/ozone treatment for boosting OER activity of MOF nanoneedle arrays. Chem. Eng. J. 2021, 427, 131498. [Google Scholar] [CrossRef]
- Gomes, J.; Bernardo, C.; Jesus, F.; Pereira, J.L.; Martins, R.C. Ozone Kinetic Studies Assessment for the PPCPs Abatement: Mixtures Relevance. ChemEngineering 2022, 6, 20. [Google Scholar] [CrossRef]
- Pandis, P.K.; Kalogirou, C.; Kanellou, E.; Vaitsis, C.; Savvidou, M.G.; Sourkouni, G.; Zorpas, A.A.; Argirusis, C. Key Points of Advanced Oxidation Processes (AOPs) for Wastewater, Organic Pollutants and Pharmaceutical Waste Treatment: A Mini Review. ChemEngineering 2022, 6, 8. [Google Scholar] [CrossRef]
- Jabbar, Z.H.; Ebrahim, S.E. Recent advances in nano-semiconductors photocatalysis for degrading organic contaminants and microbial disinfection in wastewater: A comprehensive review. Environ. Nanotechnol. Monit. Manag. 2022, 17, 100666. [Google Scholar] [CrossRef]
- Taghipour, S.; Khadir, A.; Taghipour, M. Carbon Nanotubes Composite Membrane for Water Desalination. In Sustainable Materials and Systems for Water Desalination; Springer: Cham, Switzerland, 2021; pp. 163–184. [Google Scholar]
- Khadir, A.; Ramezanali, A.M.; Taghipour, S.; Jafari, K. Insights of the Removal of Antibiotics from Water and Wastewater: A Review on Physical, Chemical, and Biological Techniques. In Applied Water Science: Remediation Technologies; Wiley: Hoboken, NJ, USA, 2021; Volume 2, pp. 1–47. [Google Scholar]
- Li, Z.; Li, Z.; Zuo, C.; Fang, X. Application of Nanostructured TiO2 in UV Photodetectors: A Review. Adv. Mater. 2022, 2, 2109083. [Google Scholar] [CrossRef]
- Su, K.; Li, L.; Deng, S.; Gao, Z.; Qin, Q.; Yang, J.; Zhang, S.; Chen, J. Research progress of TiO2 photocatalytic reduction of oxyanion pollutants in water: A mini review. Green Chem. Lett. Rev. 2021, 15, 35–44. [Google Scholar] [CrossRef]
- Algarin, P.C. Effects of Zn Doping and High Energy Ball Milling on the Photocatalytic Properties of TiO2. Master’s Thesis, University of South Florida, Tampa, FL, USA, 2008. [Google Scholar]
- Wu, D.; Li, C.; Zhang, D.; Wang, L.; Zhang, X.; Shi, Z.; Lin, Q. Enhanced photocatalytic activity of Gd3+ doped TiO2 and Gd2O3 modified TiO2 prepared via ball milling method. J. Rare Earths 2019, 37, 845–852. [Google Scholar] [CrossRef]
- Saber, D.; El-Aziz, K.; Felemban, B.F.; Alghtani, A.H.; Ali, H.T.; Ahmed, E.M.; Megahed, M. Characterization and performance evaluation of Cu-based/TiO2 nano composites. Sci. Rep. 2022, 12, 1–14. [Google Scholar] [CrossRef] [PubMed]
- Wu, D.; Li, C.; Kong, Q.; Shi, Z.; Zhang, D.; Wang, L.; Han, L.; Zhang, X.; Lin, Q. Photocatalytic activity of Lu3+/TiO2 prepared by ball milling method. J. Rare Earths 2018, 36, 819–825. [Google Scholar] [CrossRef]
- Santos, D.M.D.L.; Navas, J.; Sánchez-Coronilla, A.; Alcántara, R.; Fernández-Lorenzo, C.; Martín-Calleja, J. Highly Al-doped TiO2 nanoparticles produced by Ball Mill Method: Structural and electronic characterization. Mater. Res. Bull. 2015, 70, 704–711. [Google Scholar] [CrossRef]
- Nasralla, N.; Yeganeh, M.; Astuti, Y.; Piticharoenphun, S.; Shahtahmasebi, N.; Kompany, A.; Karimipour, M.; Mendis, B.G.; Poolton, N.R.J.; Šiller, L. Structural and spectroscopic study of Fe-doped TiO2 nanoparticles prepared by sol–gel method. Sci. Iran. 2013, 20, 1018–1022. [Google Scholar]
- Kissoum, Y.; Mekki, D.E.; Bououdina, M.; Sakher, E.; Bellucci, S. Dependence of Fe Doping and Milling on TiO2 Phase Transformation: Optical and Magnetic Studies. J. Supercond. Nov. Magn. 2019, 33, 427–440. [Google Scholar] [CrossRef]
- Wei, M.; Wang, B.; Chen, M.; Lyu, H.; Lee, X.; Wang, S.; Yu, Z.; Zhang, X. Recent advances in the treatment of contaminated soils by ball milling technology: Classification, mechanisms, and applications. J. Clean. Prod. 2022, 340, 130821. [Google Scholar] [CrossRef]
- Kumar, M.; Xiong, X.; Wan, Z.; Sun, Y.; Tsang, D.C.; Gupta, J.; Gao, B.; Cao, X.; Tang, J.; Ok, Y.S. Ball milling as a mechanochemical technology for fabrication of novel biochar nanomaterials. Bioresour. Technol. 2020, 312, 123613. [Google Scholar] [CrossRef] [PubMed]
- Krusenbaum, A.; Grätz, S.; Tigineh, G.T.; Borchardt, L.; Kim, J.G. The mechanochemical synthesis of polymers. Chem. Soc. Rev. 2022, 51, 2873–2905. [Google Scholar] [CrossRef]
- Coste, S.; Bertrand, G.; Coddet, C.; Gaffet, E.; Hahn, H.; Sieger, H. High-energy ball milling of Al2O3–TiO2 powders. J. Alloy. Compd. 2007, 434–435, 489–492. [Google Scholar] [CrossRef]
- Pedrayes, F.; Norniella, J.G.; Melero, M.G.; Menéndez-Aguado, J.M.; del Coz-Díaz, J.J. Frequency domain characterization of torque in tumbling ball mills using DEM modelling: Application to filling level monitoring. Powder Technol. 2018, 323, 433–444. [Google Scholar] [CrossRef]
- Patterson, A.L. The Scherrer Formula for X-Ray Particle Size Determination. Phys. Rev. 1939, 56, 978–982. [Google Scholar] [CrossRef]
- Paul, T.C.; Podder, J. Synthesis and characterization of Zn-incorporated TiO2 thin films: Impact of crystallite size on X-ray line broadening and bandgap tuning. Appl. Phys. A 2019, 125, 818. [Google Scholar] [CrossRef]
- Wu, L.; Xie, Q.; Lv, Y.; Zhang, Z.; Wu, Z.; Liang, X.; Lu, M.; Nie, Y. Degradation of methylene blue by dielectric barrier discharge plasma coupled with activated carbon supported on polyurethane foam. RSC Adv. 2019, 9, 25967–25975. [Google Scholar] [CrossRef] [PubMed]
- Soundarrajan, P.; Sankarasubramanian, K.; Logu, T.; Sethuraman, K.; Ramamurthi, K. Growth of rutile TiO2 nanorods on TiO2 seed layer prepared using facile low cost chemical methods. Mater. Lett. 2014, 116, 191–194. [Google Scholar] [CrossRef]
- He, J.; Du, Y.-E.; Bai, Y.; An, J.; Cai, X.; Chen, Y.; Wang, P.; Yang, X.; Feng, Q. Facile Formation of Anatase/Rutile TiO2 Nanocomposites with Enhanced Photocatalytic Activity. Molecules 2019, 24, 2996. [Google Scholar] [CrossRef]
- Wan, L.; Chua, D.H.; Sun, H.; Chen, L.; Wang, K.; Lu, T.; Pan, L. Construction of two-dimensional bimetal (Fe-Ti) oxide/carbon/MXene architecture from titanium carbide MXene for ultrahigh-rate lithium-ion storage. J. Colloid Interface Sci. 2020, 588, 147–156. [Google Scholar] [CrossRef]
- Challagulla, S.; Tarafder, K.; Ganesan, R.; Roy, S. Structure sensitive photocatalytic reduction of nitroarenes over TiO 2. Sci. Rep. 2017, 7, 1–11. [Google Scholar] [CrossRef]
- Franceschini, F.; Bartoli, M.; Tagliaferro, A.; Carrara, S. Electrodes for Paracetamol Sensing Modified with Bismuth Oxide and Oxynitrate Heterostructures: An Experimental and Computational Study. Chemosensors 2021, 9, 361. [Google Scholar] [CrossRef]
- Wang, M.; Zhao, Q.; Yang, H.; Shi, D.; Qian, J. Photocatalytic antibacterial properties of copper doped TiO2 prepared by high-energy ball milling. Ceram. Int. 2020, 46, 16716–16724. [Google Scholar] [CrossRef]
- Thommes, M.; Kaneko, K.; Neimark, A.V.; Olivier, J.P.; Rodriguez-Reinoso, F.; Rouquerol, J.; Sing, K.S.W. Physisorption of gases, with special reference to the evaluation of surface area and pore size distribution (IUPAC Technical Report). Pure Appl. Chem. 2015, 87, 1051–1069. [Google Scholar] [CrossRef]
- Ramírez-Sánchez, I.M.; Bandala, E.R. Photocatalytic Degradation of Estriol Using Iron-Doped TiO2 under High and Low UV Irradiation. Catalysts 2018, 8, 625. [Google Scholar] [CrossRef]
- Maleki-Ghaleh, H.; Shakeri, M.; Dargahi, Z.; Kavanlouei, M.; Garabagh, H.K.; Moradpur-Tari, E.; Yourdkhani, A.; Fallah, A.; Zarrabi, A.; Koc, B.; et al. Characterization and optical properties of mechanochemically synthesized molybdenum-doped rutile nanoparticles and their electronic structure studies by density functional theory. Mater. Today Chem. 2022, 24, 100820. [Google Scholar] [CrossRef]
- Luan, P.; Xie, M.; Liu, D.; Fu, X.; Jing, L. Effective charge separation in the rutile TiO2 nanorod-coupled α-Fe2O3 with exceptionally high visible activities. Sci. Rep. 2014, 4, 6180. [Google Scholar] [CrossRef] [PubMed]
- Kanjana, N.; Maiaugree, W.; Laokul, P. Photocatalytic activity of nanocrystalline Fe3+-doped anatase TiO2 hollow spheres in a methylene blue solution under visible-light irradiation. J. Mater. Sci. Mater. Electron. 2022, 33, 4659–4680. [Google Scholar] [CrossRef]
- Moradi, H.; Eshaghi, A.; Hosseini, S.R.; Ghani, K. Fabrication of Fe-doped TiO2 nanoparticles and investigation of photocatalytic decolorization of reactive red 198 under visible light irradiation. Ultrason. Sonochemistry 2016, 32, 314–319. [Google Scholar] [CrossRef]
- Carneiro, J.A.O.; De Azevedo, S.S.; Fernandes, F.D.P.; Freitas, E.; Pereira, M.A.C.D.C.; Tavares, C.J.; Lanceros-Mendez, S.; Teixeira, V.M.P. Synthesis of iron-doped TiO2 nanoparticles by ball-milling process: The influence of process parameters on the structural, optical, magnetic, and photocatalytic properties. J. Mater. Sci. 2014, 49, 7476–7488. [Google Scholar] [CrossRef]
- Taghipour, S.; Hosseini, S.M.; Ataie-Ashtiani, B. Engineering nanomaterials for water and wastewater treatment: Review of classifications, properties and applications. New J. Chem. 2019, 43, 7902–7927. [Google Scholar] [CrossRef]
- Taghipour, S.; Ataie-Ashtiani, B.; Hosseini, S.M.; Yeung, K.L. Graphitic carbon nitride-based composites for photocatalytic abatement of emerging pollutants. In Micro and Nano Technologies; Wiley: Hoboken, NJ, USA, 2022; pp. 175–214. [Google Scholar]
- Jannesari, M.; Akhavan, O.; Hosseini, H.R.M. Graphene oxide in generation of nanobubbles using controllable microvortices of jet flows. Carbon 2018, 138, 8–17. [Google Scholar] [CrossRef]
- Jannesari, M.; Akhavan, O.; Madaah Hosseini, H.R.; Bakhshi, B. Graphene/CuO2 nanoshuttles with controllable release of oxygen nanobubbles promoting interruption of bacterial respiration. ACS Appl. Mater. Interfaces 2020, 12, 35813–35825. [Google Scholar] [CrossRef]
- Ahmadpur, M. Impact of COVID-19 spread on road safety indices of Turkey. Int. J. Inj. Control. Saf. Promot. 2022, 29, 1–12. [Google Scholar] [CrossRef]
- Wu, T.; Zhu, X.; Xing, Z.; Mou, S.; Li, C.; Qiao, Y.; Liu, Q.; Luo, Y.; Shi, X.; Zhang, Y.; et al. Greatly improving electrochemical N2 reduction over TiO2 nanoparticles by iron doping. Angew. Chem. Int. Ed. 2019, 58, 18449–18453. [Google Scholar] [CrossRef]
- Khalid, N.R.; Hussain, M.K.; Murtaza, G.; Ikram, M.; Ahmad, M.; Hammad, A. A Novel Ag2O/Fe–TiO2 Photocatalyst for CO2 Conversion into Methane Under Visible Light. J. Inorg. Organomet. Polym. Mater. 2019, 29, 1288–1296. [Google Scholar] [CrossRef]
- Zhang, M.; Wang, S.; Li, Z.; Liu, C.; Miao, R.; He, G.; Zhao, M.; Xue, J.; Xia, Z.; Wang, Y.; et al. Hydrothermal synthesis of MoS2 nanosheet loaded TiO2 nanoarrays for enhanced visible light photocatalytic applications. RSC Adv. 2019, 9, 3479–3485. [Google Scholar] [CrossRef]
- Ghorai, T.K.; Chakraborty, M.; Pramanik, P. Photocatalytic performance of nano-photocatalyst from TiO2 and Fe2O3 by mechanochemical synthesis. J. Alloy. Compd. 2011, 509, 8158–8164. [Google Scholar] [CrossRef]
- Aguinaco, A.; Amaya, B.; Ramírez-del-Solar, M. Facile fabrication of Fe-TiO2 thin film and its photocatalytic activity. Environ. Sci. Pollut. Res. 2022, 29, 23292–23302. [Google Scholar] [CrossRef] [PubMed]
- Pan, F.; Zhong, X.; Xia, D.; Yin, X.; Li, F.; Zhao, D.; Ji, H.; Liu, W. Nanoscale zero-valent iron/persulfate enhanced upflow anaerobic sludge blanket reactor for dye removal: Insight into microbial metabolism and microbial community. Sci. Rep. 2017, 7, srep44626. [Google Scholar] [CrossRef]
- Pei, K.; Liu, T. Enhanced Cr (VI) removal with Pb (II) presence by Fe2+-activated persulfate and zero-valent iron system. Environ. Technol. 2022, 1–15. [Google Scholar] [CrossRef]
- Mancuso, A.; Sacco, O.; Vaiano, V.; Bonelli, B.; Esposito, S.; Freyria, F.; Blangetti, N.; Sannino, D. Visible Light-Driven Photocatalytic Activity and Kinetics of Fe-Doped TiO2 Prepared by a Three-Block Copolymer Templating Approach. Materials 2021, 14, 3105. [Google Scholar] [CrossRef]
- Wang, M.; Gao, J.; Zhu, G.; Li, N.; Zhu, R.; Wei, X.; Liu, P.; Guo, Q. One-step solvothermal synthesis of Fe-doped BiOI film with enhanced photocatalytic performance. RSC Adv. 2016, 6, 106615–106624. [Google Scholar] [CrossRef]
- Sakar, M.; Prakash, R.M.; Do, T.-O. Insights into the TiO2-Based Photocatalytic Systems and Their Mechanisms. Catalysts 2019, 9, 680. [Google Scholar] [CrossRef]
- Solano, R.A.; Herrera, A.P.; Maestre, D.; Cremades, A. Fe-TiO2 nanoparticles synthesized by green chemistry for potential application in waste water photocatalytic treatment. J. Nanotechnol. 2019, 2019, 4571848. [Google Scholar]
- Senol, S.D.; Boyraz, C.; Ozugurlu, E.; Gungor, A.; Arda, L. Band Gap Engineering of Mg Doped ZnO Nanorods Prepared by a Hydrothermal Method. Cryst. Res. Technol. 2019, 54, 1800233. [Google Scholar] [CrossRef]
- Azarpira, H.; Sadani, M.; Abtahi, M.; Vaezi, N.; Rezaei, S.; Atafar, Z.; Mohseni, S.M.; Sarkhosh, M.; Ghaderpoori, M.; Keramati, H.; et al. Photo-catalytic degradation of triclosan with UV/iodide/ZnO process: Performance, kinetic, degradation pathway, energy consumption and toxicology. J. Photochem. Photobiol. A Chem. 2018, 371, 423–432. [Google Scholar] [CrossRef]
- Ahadi, S.; Moalej, N.S.; Sheibani, S. Characteristics and photocatalytic behavior of Fe and Cu doped TiO2 prepared by combined sol-gel and mechanical alloying. Solid State Sci. 2019, 96, 105975. [Google Scholar] [CrossRef]
- Liu, L.; Chen, F.; Yang, F.; Chen, Y.; Crittenden, J. Photocatalytic degradation of 2,4-dichlorophenol using nanoscale Fe/TiO2. Chem. Eng. J. 2011, 181–182, 189–195. [Google Scholar] [CrossRef]
- Aziz, K.H.H.; Miessner, H.; Mueller, S.; Mahyar, A.; Kalass, D.; Moeller, D.; Khorshid, I.; Rashid, M.A.M. Comparative study on 2,4-dichlorophenoxyacetic acid and 2,4-dichlorophenol removal from aqueous solutions via ozonation, photocatalysis and non-thermal plasma using a planar falling film reactor. J. Hazard. Mater. 2018, 343, 107–115. [Google Scholar] [CrossRef]
- Neghi, N.; Kumar, M. Performance analysis of photolytic, photocatalytic, and adsorption systems in the degradation of metronidazole on the perspective of removal rate and energy consumption. Water Air Soil Pollut. 2017, 228, 1–12. [Google Scholar]
- Available online: https://www.info.gov.hk/gia/general/202111/09/P2021110900485.htm (accessed on 25 April 2022).
Publisher’s Note: MDPI stays neutral with regard to jurisdictional claims in published maps and institutional affiliations. |
© 2022 by the authors. Licensee MDPI, Basel, Switzerland. This article is an open access article distributed under the terms and conditions of the Creative Commons Attribution (CC BY) license (https://creativecommons.org/licenses/by/4.0/).