1. Introduction
Open-cell foam materials combine high strength, a large surface area, a low pressure drop, and intense heat transfer, making them preferred for use in catalytic processes. In the work [
1], the modeling of acetylene hydrogenation in a fixed bed reactor was carried out using an open-cell foam material. A pseudo-homogeneous and heterogeneous reaction model was used. The process of catalyst deactivation was also simulated as a function of time and temperature.
Researchers in [
2] simulated the heat and mass transfer process, assessing their influence on the kinetics of the reaction. The simulation considered the presence of a free gas phase, a porous shell with a supported catalyst, and a porous inner part of the catalyst granules, which did not affect the reaction kinetics. In [
3], the mechanism of acetylene hydrogenation was investigated using quantum mechanics and the Monte-Carlo method.
The authors calculated the activation energy, investigated the dissociation of hydrogen, and calculated acetylene and ethylene’s hydrogenation reaction. One article [
4] was also devoted to modeling the process of acetylene hydrogenation using three kinetic models. The research results have shown that the selectivity of the reaction can be achieved by reducing hydrogen consumption. A modification of the acetylene hydrogenation process with a decreased yield of by-products is proposed.
One study [
5] provides CFD modeling of adiabatic and isothermal industrial reactors. The optimal values of the ratio of the geometric parameters in the reactor (diameter and length) were determined. The experimental simulation of an endothermal reaction in catalytic porous media conducted by [
6] revealed that an increase in the porosity and decrease of the inlet velocity could induce a multicomponent flow outside of the Darcy range in endothermal reactions because of the surface catalytic reaction.
Heat transfer during the acetylene hydrogenation reaction in the case of a two-temperature model of a porous medium was considered in [
7]. The results for the two-temperature model were compared with the calculation results for the one-temperature model. The optimal ratios of the reaction components at the inlet and their temperature were determined. In general, for catalytic processes, a porous matrix on which a catalyst layer is deposited plays an important role.
The intensification of catalytic processes is affected by the thermal conductivity of the porous medium. In the article [
8], it is shown that the porosity and thermal conductivity of the material itself significantly affect the value of the effective thermal conductivity of the porous medium; the shape and size of the cells do not have a significant effect. The authors proposed cubic unit cells. This structure made it possible to increase the effective thermal conductivity of the medium significantly.
In article [
9], a combined experimental and numerical approach was applied to study heat and mass transfer in an open-cell foam medium. The obtained Sherwood–Reynolds dependence correlates well with the obtained data. The average strut size was used as the characteristic length for foams, which allows for versatility in open-cell foam material studies. The heat transfer process in catalytic structures that are diamond lattice and tetrakaidekahedral is discussed in the paper [
10]. Various dependencies of the parameters of the indicated porous structures for the Sherwood and Reynolds numbers are given.
The authors of the article [
11], when numerically simulating the process of heat transfer in porous structures, used the specification of artificial heat sources, which are analogs of the heat of exothermic reaction. This approach made it possible to significantly reduce the computational resources required for calculating the chemical reactions. As a result of a large-scale study, it was proven that this approach allows one to obtain many reliable heat transfer characteristics with a simplified model.
The conjugate problem of heat transfer in a structure created using Kelvin cells was solved in [
12]. The research results showed that the thermal conductivity and strut size were critical parameters for heat transfer. One article [
13] investigated the quantitative contribution of thermal radiation to heat transfer in heterogeneous catalysis. The authors concluded that, even for the cases of open-cell foam materials with a significant value of the thermal conductivity of the medium, neglecting the mechanism of thermal radiation can significantly change the process.
Moreover, some heat and mass transfer investigations in porous structures have been carried out using other simulation techniques. The authors of [
14] built a 3D numerical model to obtain a conjugate flow and heat transfer at pore scale for a porous medium with particular porosity values. While studying open cell metal foam, the authors of work [
15] observed a correlation for the Nusselt number, which depends only on the porosity and the Reynolds numbers.
Furthermore, in [
16], the authors successfully overcame limitations of typical experimental facilities by achieving high Reynolds numbers in the near-wall region of a reactor packed with open-cell foams. Their findings outlined the importance of proper alignment and fitting in the reactor for better results output. In further research [
17], the authors developed an Immersed Boundary Method (IBM) for flow and heat transfer in a model of porous structures.
They, therefore, successfully derived pressure drop and heat transfer coefficients for the foam structure considered. In a study [
18] on heat transfer intensification in catalytic reactors, researchers used periodic open cellular structures (POCS) to derive a new heat transfer correlation. Thus, POCS are susceptible to allow optimization when considered during the design of reactors. Relatively easy to manufacture by additive manufacturing, POCS are part of a novel cellular catalyst generation that is being investigated.
Their fluid dynamic correlation and morphological structures were earlier developed by [
19,
20]. Recently, a systematic analysis of the limitations of mass transfer in open-cell foam was conducted by [
21]. They noticed high mass transfer limitations for high Reynolds numbers and low effective diffusion coefficients. Additionally, for the first time, a resin-based 3D catalyst support was developed for mass transfer to prove rich hydrogen catalytic oxidation [
22]. On the other hand, the authors of [
23] opted for an integrated experimental and modeling approach while using foam catalysts to control their model’s selectivity.
Substantial diffusion limitations induced selectivity deviation and a loss in the catalyst efficiency. Proven very efficient for highly exothermic catalytic reactions in characterizing foam structures [
24], the Fischer–Tropsch Synthesis (FTS) method was considered by [
25] in a system with cobalt catalyst coated metallic foam. In their studies, they observed that an increase in the reaction temperature induced growth in the amount of Carbon Monoxide (CO) converted due to heat generated in the fixed-bed reactor. Their results were in accordance with revolutionary work conducted by [
26], who investigated the synthesis of hydrocarbon by dehydrogenation of CO using the FTS method.
The researchers in [
26] also noticed that a mixed catalytic reactor could facilitate easy product reabsorption. In the paper [
27], studies were carried out in open-cell foam materials serving as a matrix for catalyst deposition. The authors of [
28] performed a numerical simulation of the methanation reaction on a porous structure consisting of Kelvin cells. They determined that, for open-cell foam structures in catalysis, the pressure value and the superficial velocity significantly affect the heat removal. The type of fluid and the gravity force did not significantly affect heat transfer.
Along with previously stated findings, the authors of [
29] recently demonstrated an improvement in the analysis of catalytic fixed bed reactors. They demonstrated that some changes in the active catalytic mass are a result of contact modifications on the void fraction. While generating higher-ordered mesh structures, similar observations have been reported for the simulation of pebble beds [
30], biomass pyrolysis [
31], and fixed bed reactors [
32,
33].
For catalytically active and catalytically inert packings, the researchers of [
34] showed the existence of the reactant supply in a lower proportion during the analysis of their radial distribution of catalytic activities for their study of local transport and reaction rates in a fixed bed reactor tube. For this research, particle-resolved CFD (PRCFD) simulations were conducted for an exothermic reaction. Studying dry-reforming methane (DRM), the authors of [
35] noticed that low temperature and retention of the catalyst could lead to weak hydrogen production. These results were similar to the work [
36] in which the deactivation by carbon capture was simulated.
Some works have been devoted to studying the gas behavior in the open-cell foam media for a better understanding of other physicochemical processes. The authors of article [
37] demonstrated that the calculated and experimental values of the pressure drop in open-cell foam materials of various authors differed significantly. The pressure drop in open-cell foam structures at low values of the Reynolds number (less than 50) was estimated numerically and experimentally. The experimental samples were 3D printed from computer models used in practice.
The dependence of the pressure drop on porosity, cell size, and strut shape was derived. The paper concluded that open-cell foam materials had a significant advantage over honeycomb monoliths. The results of studies [
38] showed that in exothermic reactions for small and medium conversions, open-cell foam materials had a significant advantage over bulk granules. However, the authors concluded that monolithic sponges should not be used for large industrial reactors since they are effective at a large specific surface area, that is, at small window diameters, and this fact leads to a significant increase in the pressure drop. The article studied the mechanical and diffusion dispersion of a gas in open-cell foam structures of various geometries [
39].
The authors conclude that diffusion dispersion is present even at high gas flow rates. The effect of the structure of an open-cell foam material on gas flow was studied numerically and experimentally using the method of non-invasive magnetic resonance velocimetry in [
40]. The numerical simulation results show a deviation of no more than 10 percent relative to the experimental data.
2. Problem Formulation and Solution Method
2.1. Problem Formulation
Recently, open-cell foam material catalysts are actively replacing traditional granular catalysts. The process of purifying ethylene from acetylene can be considered as a case study. In [
41,
42,
43], an experimental comparison of the efficiency and selectivity of two types of catalysts was conducted: catalyst 1 was made of cylindrical granules with palladium deposition, and catalyst 2 was an open-cell foam material with palladium deposition. The mass of palladium was considered to be the same for both catalyst layer 1 and the layer of open-cell foam material.
The experimental studies demonstrated that the catalyst based on open-cell foam provided higher values of the conversion and selectivity parameters compared with the granular catalyst at the same weight of the supported catalyst. Therefore, it is of interest to study, in more detail, the behavior of gas movement in open-cell foam for the process of acetylene hydrogenation.
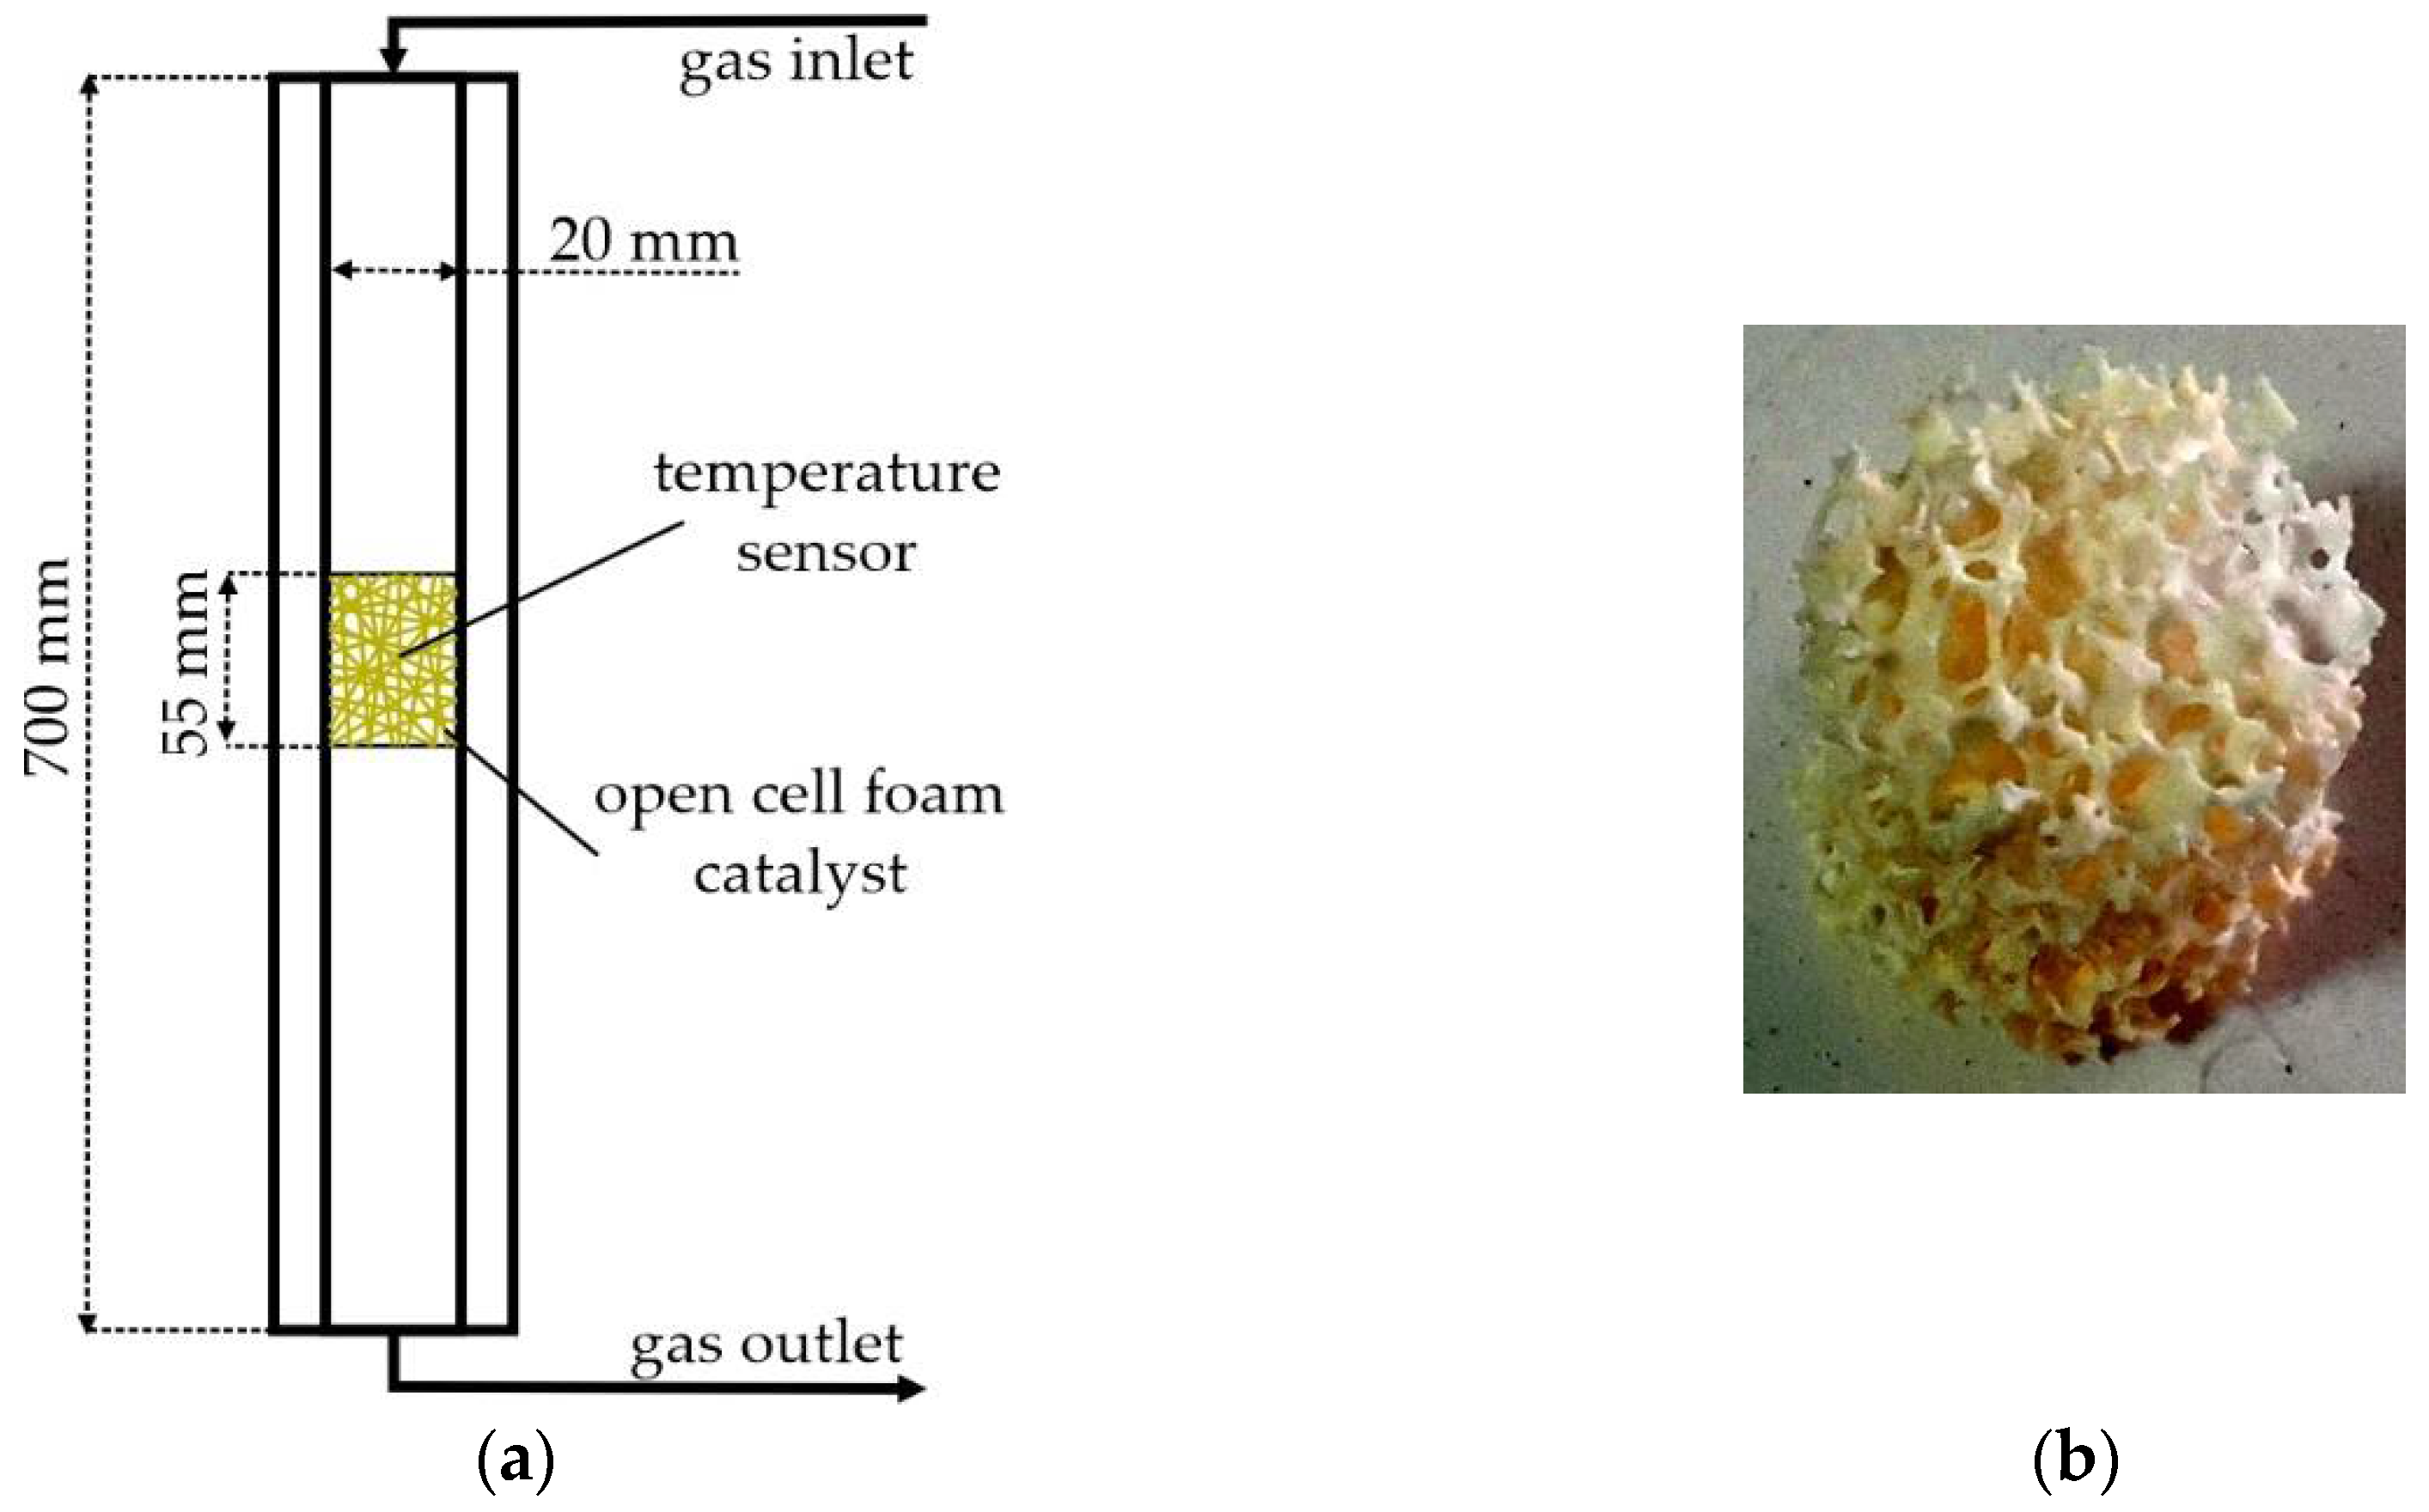
The catalyst was a complex composite material prepared in several stages. The basis of the material was made of nickel open-cell foam. An alumina layer was applied on top of the nickel, and palladium was deposited on the alumina layer. A detailed description of the preparation of the catalyst material is presented in [
41,
42]. The catalyst was tested in an isothermal cylindrical reactor. The reactor constituted of a hollow steel tube of an inner diameter of 20 mm, and a sample of a foam catalyst was 55 mm in length (
Figure 1).
The gas temperature range was 30–60 °C at a pressure of 1 atm. The mass fraction of corresponded to argon (24%), ethylene (74.93%), hydrogen (0.07%), and acetylene (1%). Passing through the catalyst, acetylene was hydrogenated to ethylene.
In addition to the primary reaction, undesirable side reactions can occur, for example, the hydrogenation of ethylene to ethane
As the criteria for the catalyst operation, an estimation of the acetylene conversion and selectivity can be expressed as
In this study, a comparative analysis of the reactors’ operation for acetylene’s selective hydrogenation with various open-cell foam structure parameters was conducted. A detailed numerical simulation of reactors from experimental studies was carried out to analyze the effects of cell size and porosity, which affect the reaction’s activity and selectivity. Experimental data were needed to construct and verify a mathematical model of the chemically reacting flow.
The study aims to determine the optimal geometric parameters of a catalyst based on an open-cell foam material for the selective hydrogenation of acetylene to maximize the values of conversion and selectivity. The purpose of the study is to determine the limitations that may arise and hinder an increase in the efficiency of the catalyst and are associated with the geometric features of open-cell foam for the selective hydrogenation of acetylene.
2.2. Open-Cell Foam Model
An experimental sample of a catalyst based on open-cell foam material is a structure with a random arrangement of cells. In this case, the cell diameter varies from 2.0 to 3.0 mm, with an average value of 2.5 mm. The fiber size can range from 0.1 to 0.2 mm with an average value of 0.15 mm. In this work, the Kelvin cell model is taken into consideration as an approximation to the experimental model of open-cell foam material. Studies conducted by [
12,
44,
45,
46] showed that Kelvin cells are a good approximation to open-cell foam material structure.
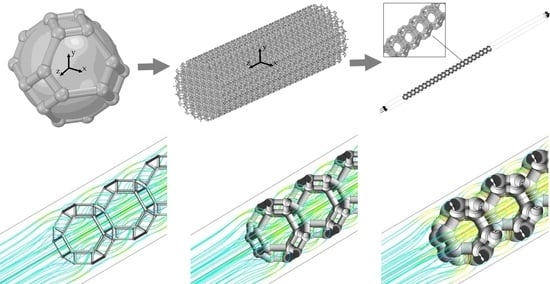
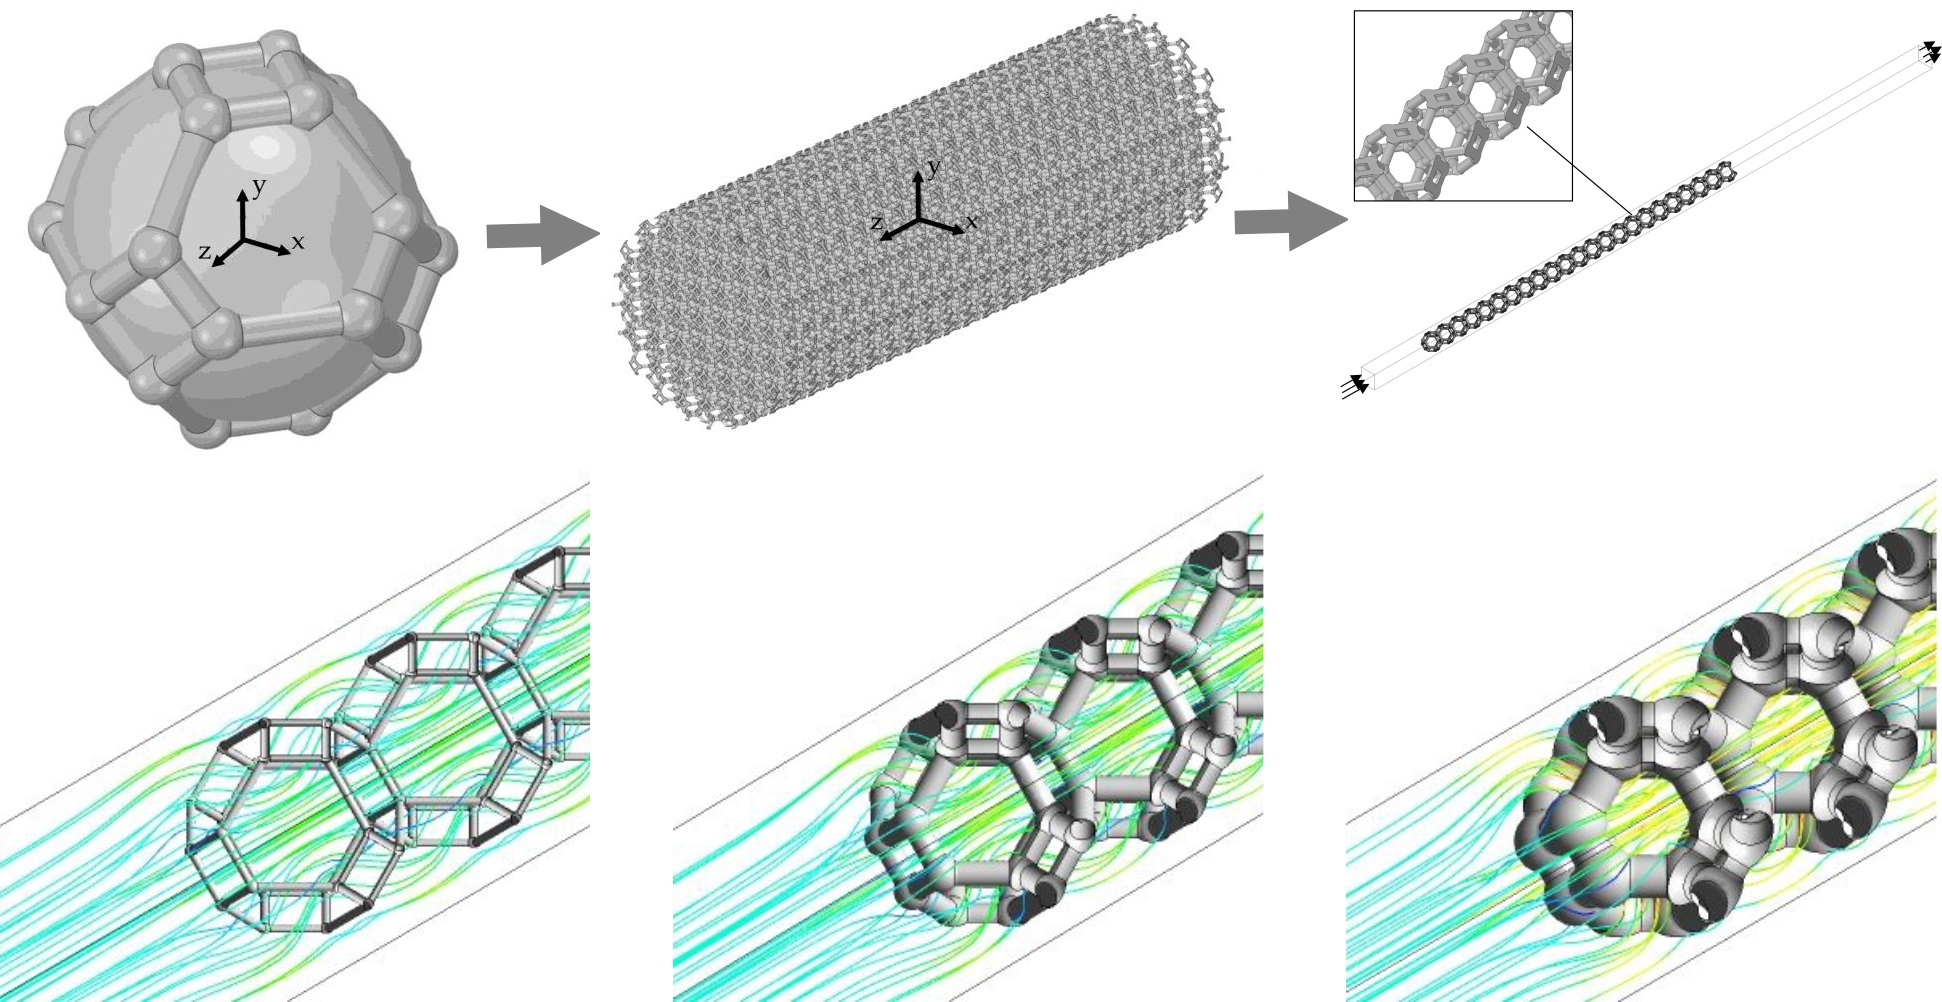
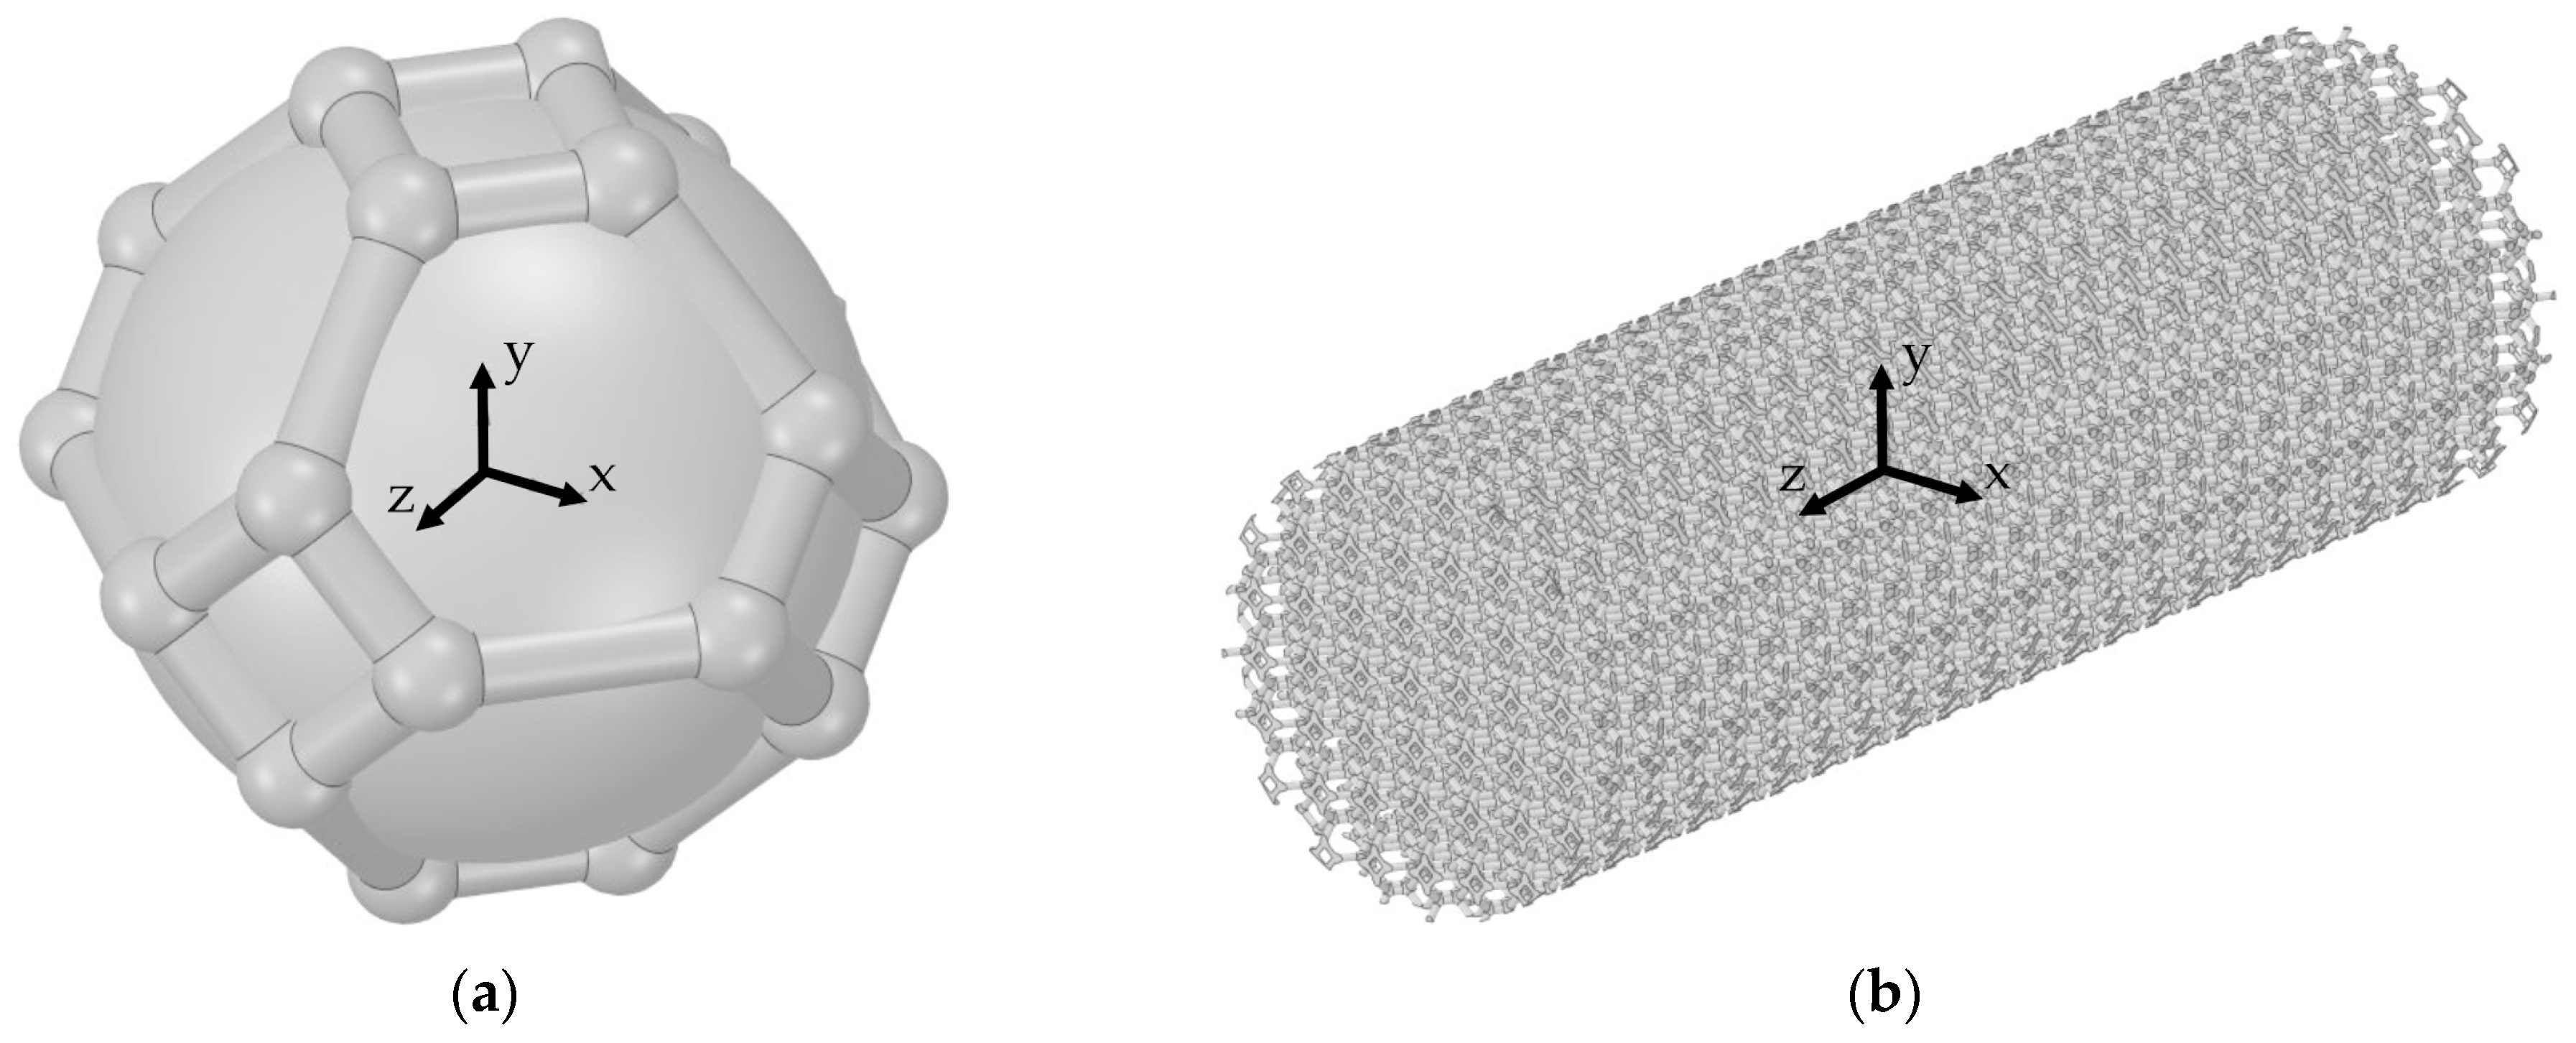
Figure 2a shows a model of the constructed Kelvin cell around a sphere with a cell diameter
= 2.5 mm. We chose cylinders with a diameter
as fibers; spheres with a diameter of 1.5
are located at the joints of the cylinders.
Figure 2b shows a model of a porous structure constructed from Kelvin cells, which corresponds to the dimensions of the experimental sample.
Furthermore, this work investigates the degree at which the cell size
and fiber diameter
of open-cell foam material can affect the catalyst’s activity and selectivity by the acetylene hydrogenation process. Three cell sizes (
= 2.0, 2.5, and 3.0 mm), and five diameter sizes (
= 0.05, 0.10, 0.15, 0.20, and 0.25 mm) were chosen. As a result, 15 different cell variants were obtained.
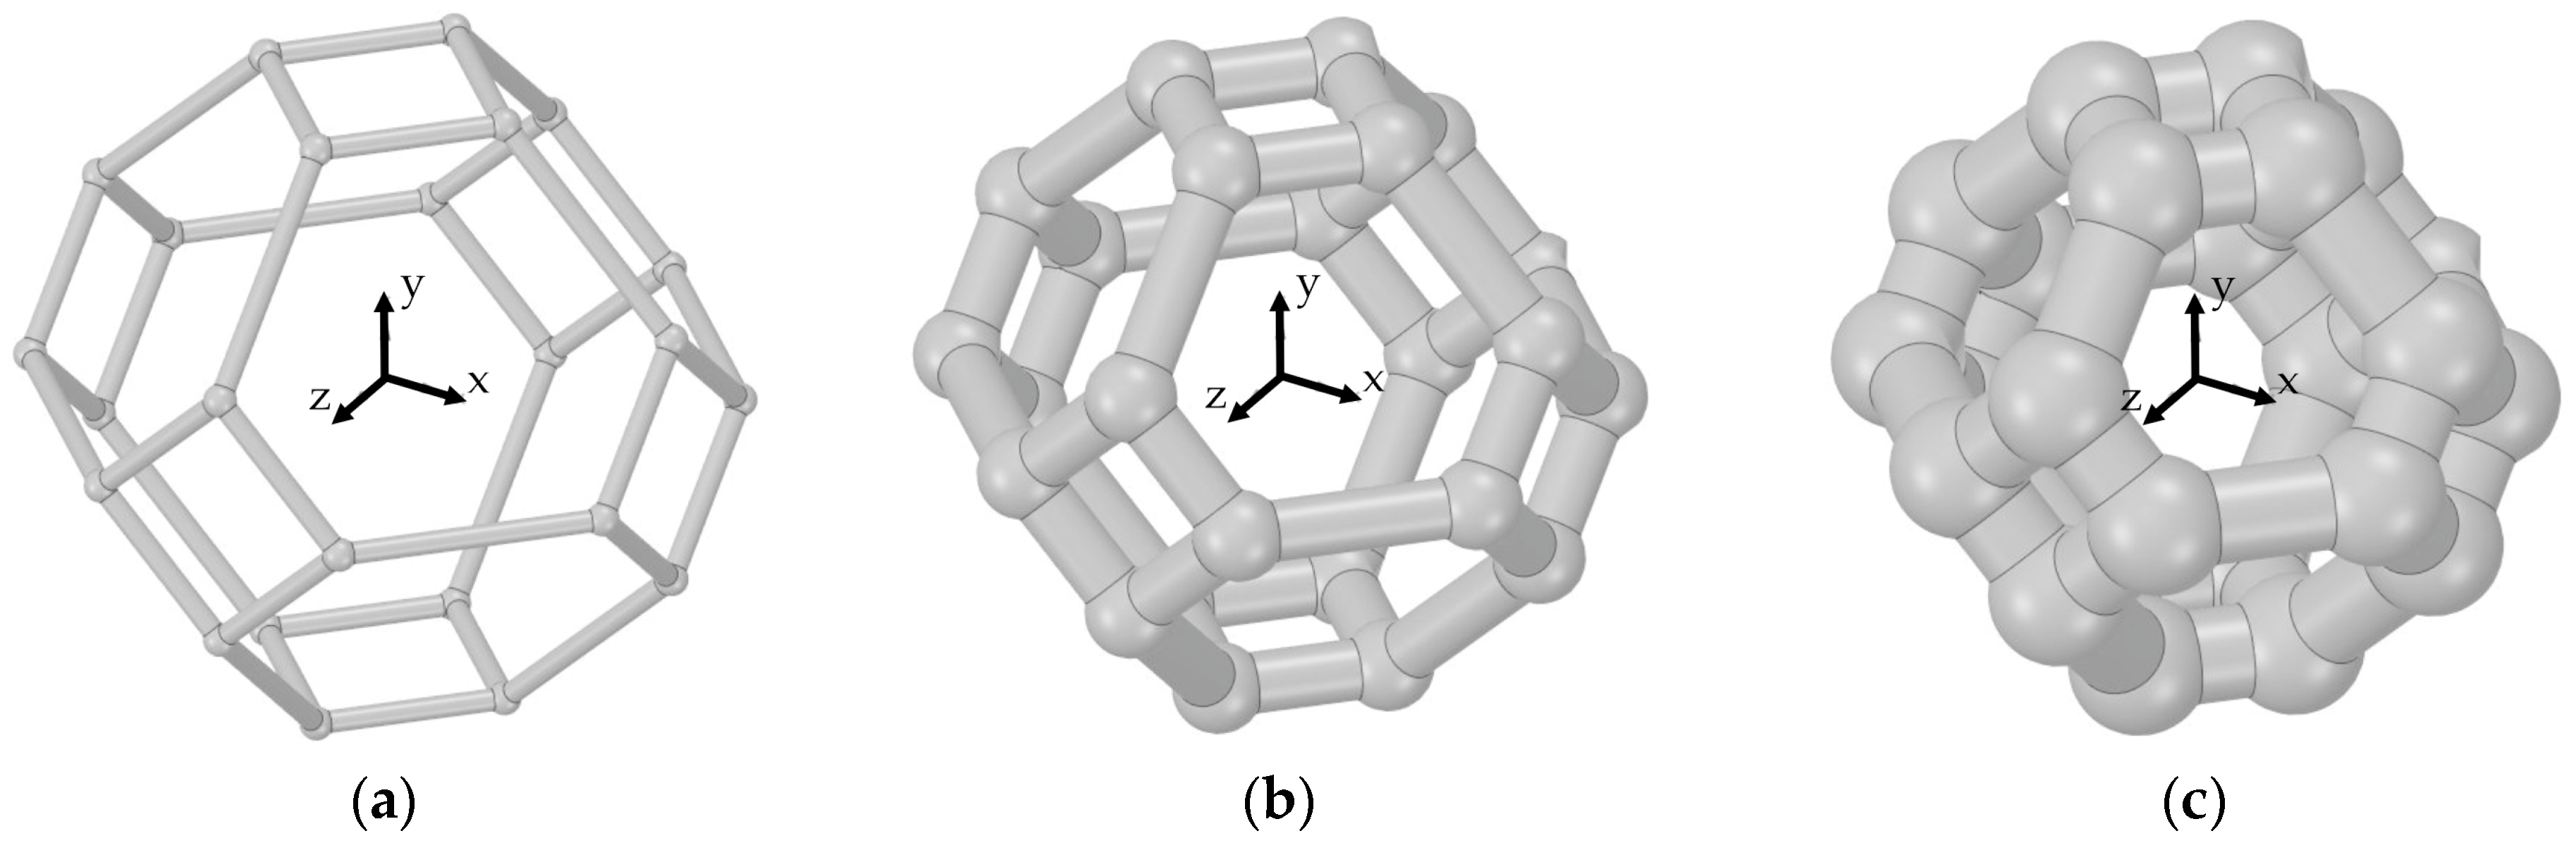
Figure 3 shows a visual comparison between cells of various sizes of
.
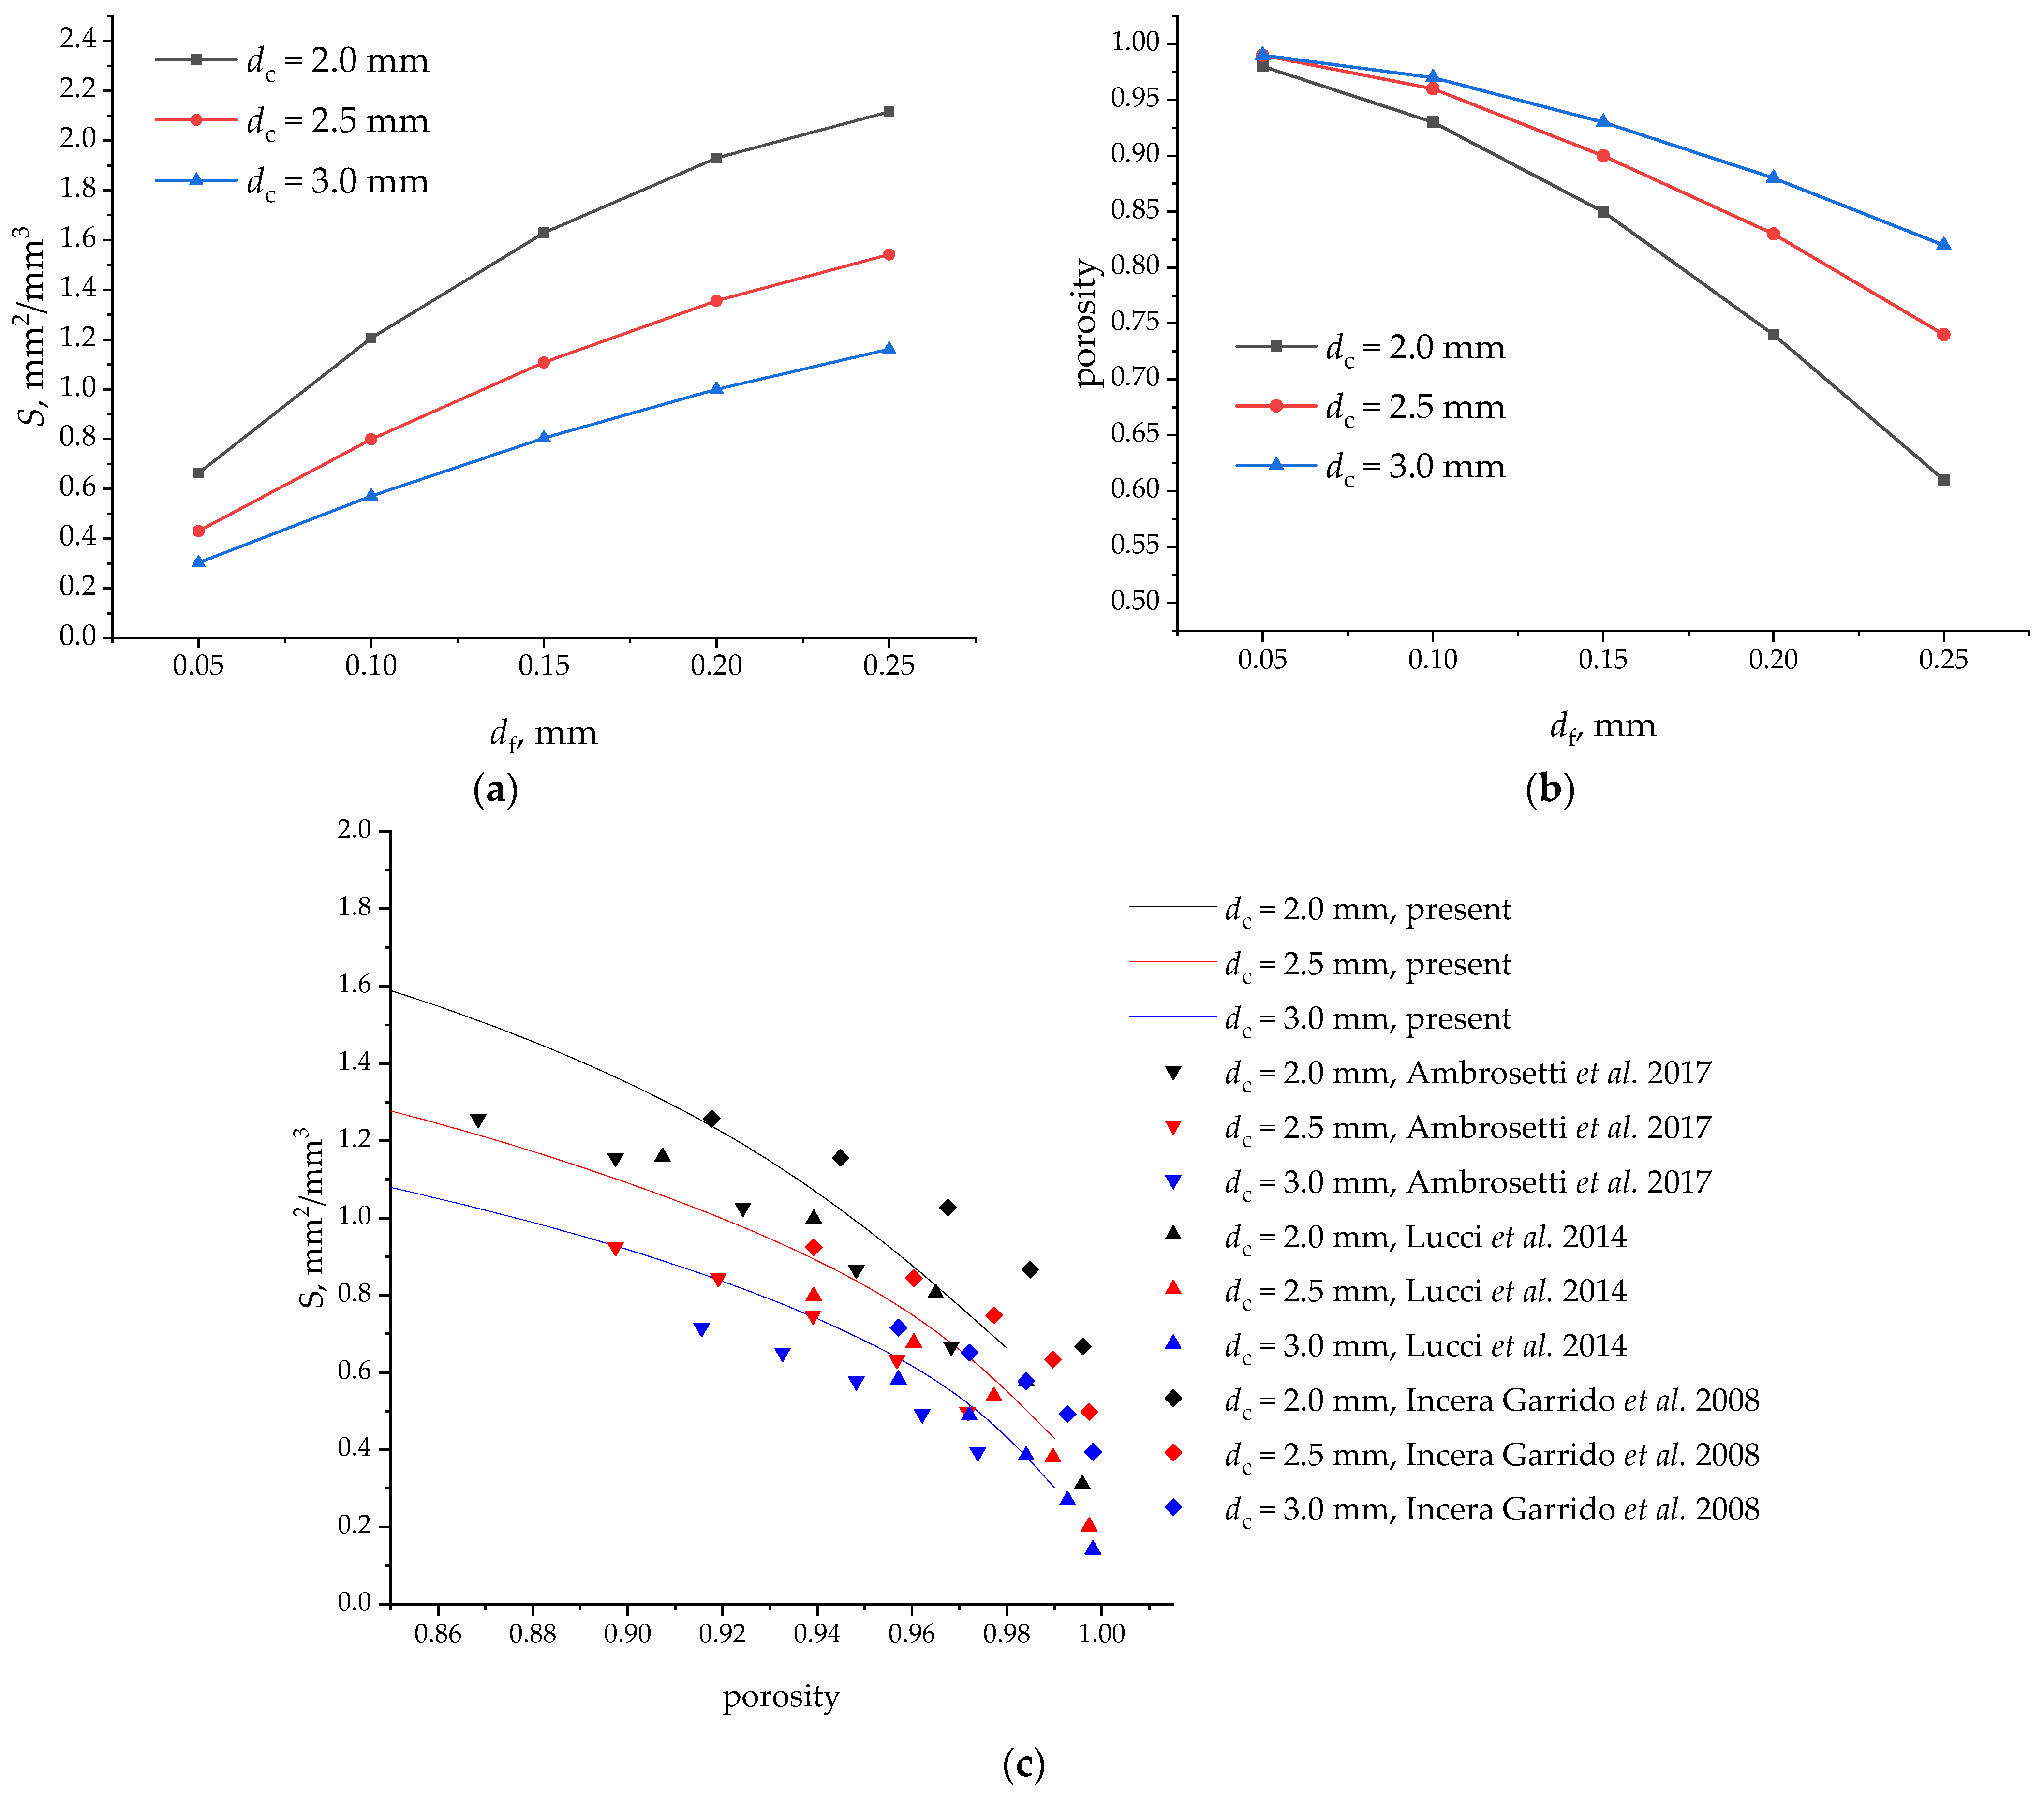
Estimation of certain parameters of the considered cell geometries was also conducted.
Figure 4a presents the calculated values of the surface area of the cell structure, referred to as the occupied volume (
S, m
2/m
3). Despite noticing that cells with a diameter of
= 3.0 mm had the largest total surface area, after normalization per unit volume, cells with a diameter of
= 2.0 mm depicted the largest surface area.
Figure 4b shows the values of the porosity ε of each cell depending on the diameter of the cell
and the diameter of the fiber
. When the value of the fiber diameter
= 0.05 mm, the porosity approaches 0.99 for all the values of investigated cell diameter values
. With increasing
, the porosity begins to decrease. Therefore, for
= 0.25 mm the porosity is ε = 0.61 (
= 2.0 mm), ε = 0.74 (
= 2.5 mm), and ε = 0.82 (
= 3.0 mm).
To build a model of the cellular material, we chose the Kelvin cell approximation. In this case, the cells can be built in different ways: with cylindrical or triangular fibers, with a change in the thickness of the fiber along the length, with additional nodes, or without nodes at the intersection points of the fibers. A large number of studies are devoted to experimental studies of open-cell foam materials and the choice of geometric models of the shapes of cells and fibers, which more accurately describe an open-cell foam material in terms of the geometric and physical parameters.
In our study, the choice of a simple model with fibers in the form of straight cylinders, as well as the location of additional spheres at the intersection points of the cylinders, leads to an increase in the specific surface area and a decrease in porosity compared to more complex models with a variable shape and thickness of the fibers. Let us compare results with the correlations of the authors [
44,
47,
48] obtained for the models of the Kelvin cell with cylindrical fibers.
The results of the dependence of specific surface area on porosity are presented in
Figure 4c. The curves of our calculations and those constructed from the correlations of other authors have similar behavior. At the same time, some correlations are higher than our results, and some are lower. In general, we can assume that, in our studies, the dependence of the specific surface area on porosity is within the limits of the studies of other authors.
2.3. Gas Flow Model
The solution to the problem of the chemically reacting gas flow movement was conducted using the finite volume method. The considered region of the reactor was divided into triangular elements. The flow taken into consideration was stationary. For a multicomponent gas phase, the conservation laws of mass, momentum, and energy were fulfilled.
Mass conservation equation
where
is the density and
. is the velocity.
The momentum conservation equation
where
is the pressure and
is the stress tensor. In Equation (6), the stress tensor is
where
is the viscosity and
is unit tensor.
Mass conservation equation for the
i-th component of the gas mixture
where
is the mass fraction of the
i-th component of the gas mixture,
is the consumption of the
i-th component of the chemical reaction, and
is the diffusion flux of the
i-th component arising from the concentration and temperature gradients.
where
is the temperature,
is the mass diffusion coefficient, and
is the temperature diffusion coefficient.
Energy conservation equation
where
is the enthalpy, and
where
is the thermal conductivity of the gas mixture and
is the number of components in the mixture.
For chemical reactions, the parameter
in Equation (8) can be written as
where
is the molecular weight of the
i-th component of the mixture and
is the number of reactions involving the
i-th component of the mixture.
where
is the concentration of the
j-th component of the mixture,
is the exponent for the reactant
j-th component in the reaction, and
is the reaction rate constant.
The reaction rate constant for Equations (1) and (2) is determined by the Arrhenius expression
where
is the pre-exponential factor and
is the activation energy. The choice of the kinetic Arrhenius model is based on the analysis of the authors’ works [
2,
5,
7]. In our study, from the analysis of experimental data for reaction Equation (1):
= 4.67 × 10
10,
= 48 kJ/mol; for reaction Equation (2):
= 3.4 × 10
13,
= 90 kJ/mol.
The ANSYS Fluent 19.2 software was used to solve the written system of equations. Many of the component properties parameters were taken from the database of the software. The physicochemical properties of the components were estimated according to the polynomial dependence on temperature.
In our calculations, only a laminar gas flow model was considered. The mass flow rate of the gas in the tube in the experiment was 1.7 × 10⁻⁶ kg/s. Subsequently, the density and viscosity parameters of the gas mixture were determined from the ANSYS Fluent models, namely, the density of the components as an ideal gas and the viscosity from the kinetic theory model. Furthermore, for a mixture of gases = 1.173 kg/m3, = 1.63 × 10⁻⁵ kg/m s, the average gas velocity over the cross-section was = 4.5 × 10⁻³ m/s. For the characteristic geometric size, the fiber diameter was chosen from 0.05 to 0.25 mm. Then, the Reynolds number ranged between 0.016 and 0.081.
In our model, we do not consider the heat transfer through the solid body of the catalyst material. This approximation was chosen due to the small dimensions of the sample along the length in experimental studies. The sample length was 55 mm, and the content of the reacting components in the gas mixture was about 1%. In the experiments and numerical simulations, the gas temperature changed by no more than 0.1 °C. Therefore, we neglect the thermal conductivity in solid materials in this work.
2.4. Boundary Conditions and Mesh
The constructed model of the catalyst sample shown in
Figure 2b consists of a large number of elements and will require a large number of computational resources and time to carry out the required number of calculations.
As an assumption, a periodic series of cells will be considered. This is possible because of the symmetry of the used cell model. In [
12,
28,
49], the authors considered the region of a quarter of a cylinder, which made it possible to consider the peculiarities of gas movement near the reactor wall. In our problem, the Kelvin cell is already an approximation to the disordered structure of the open-cell foam.
At the same time, estimates show that, when filling the cross-section of a cylinder, one-piece cells can fill from 82% to 95% of the cross-sectional area, depending on the size of the cells and the location of the center of the circle. The gas velocity in the experiment was = 4.5 × 10⁻³ m/s, which should not contribute to the formation of a large near-wall boundary layer with its flow features. Therefore, in this study, we will restrict ourselves to one chain of cells.
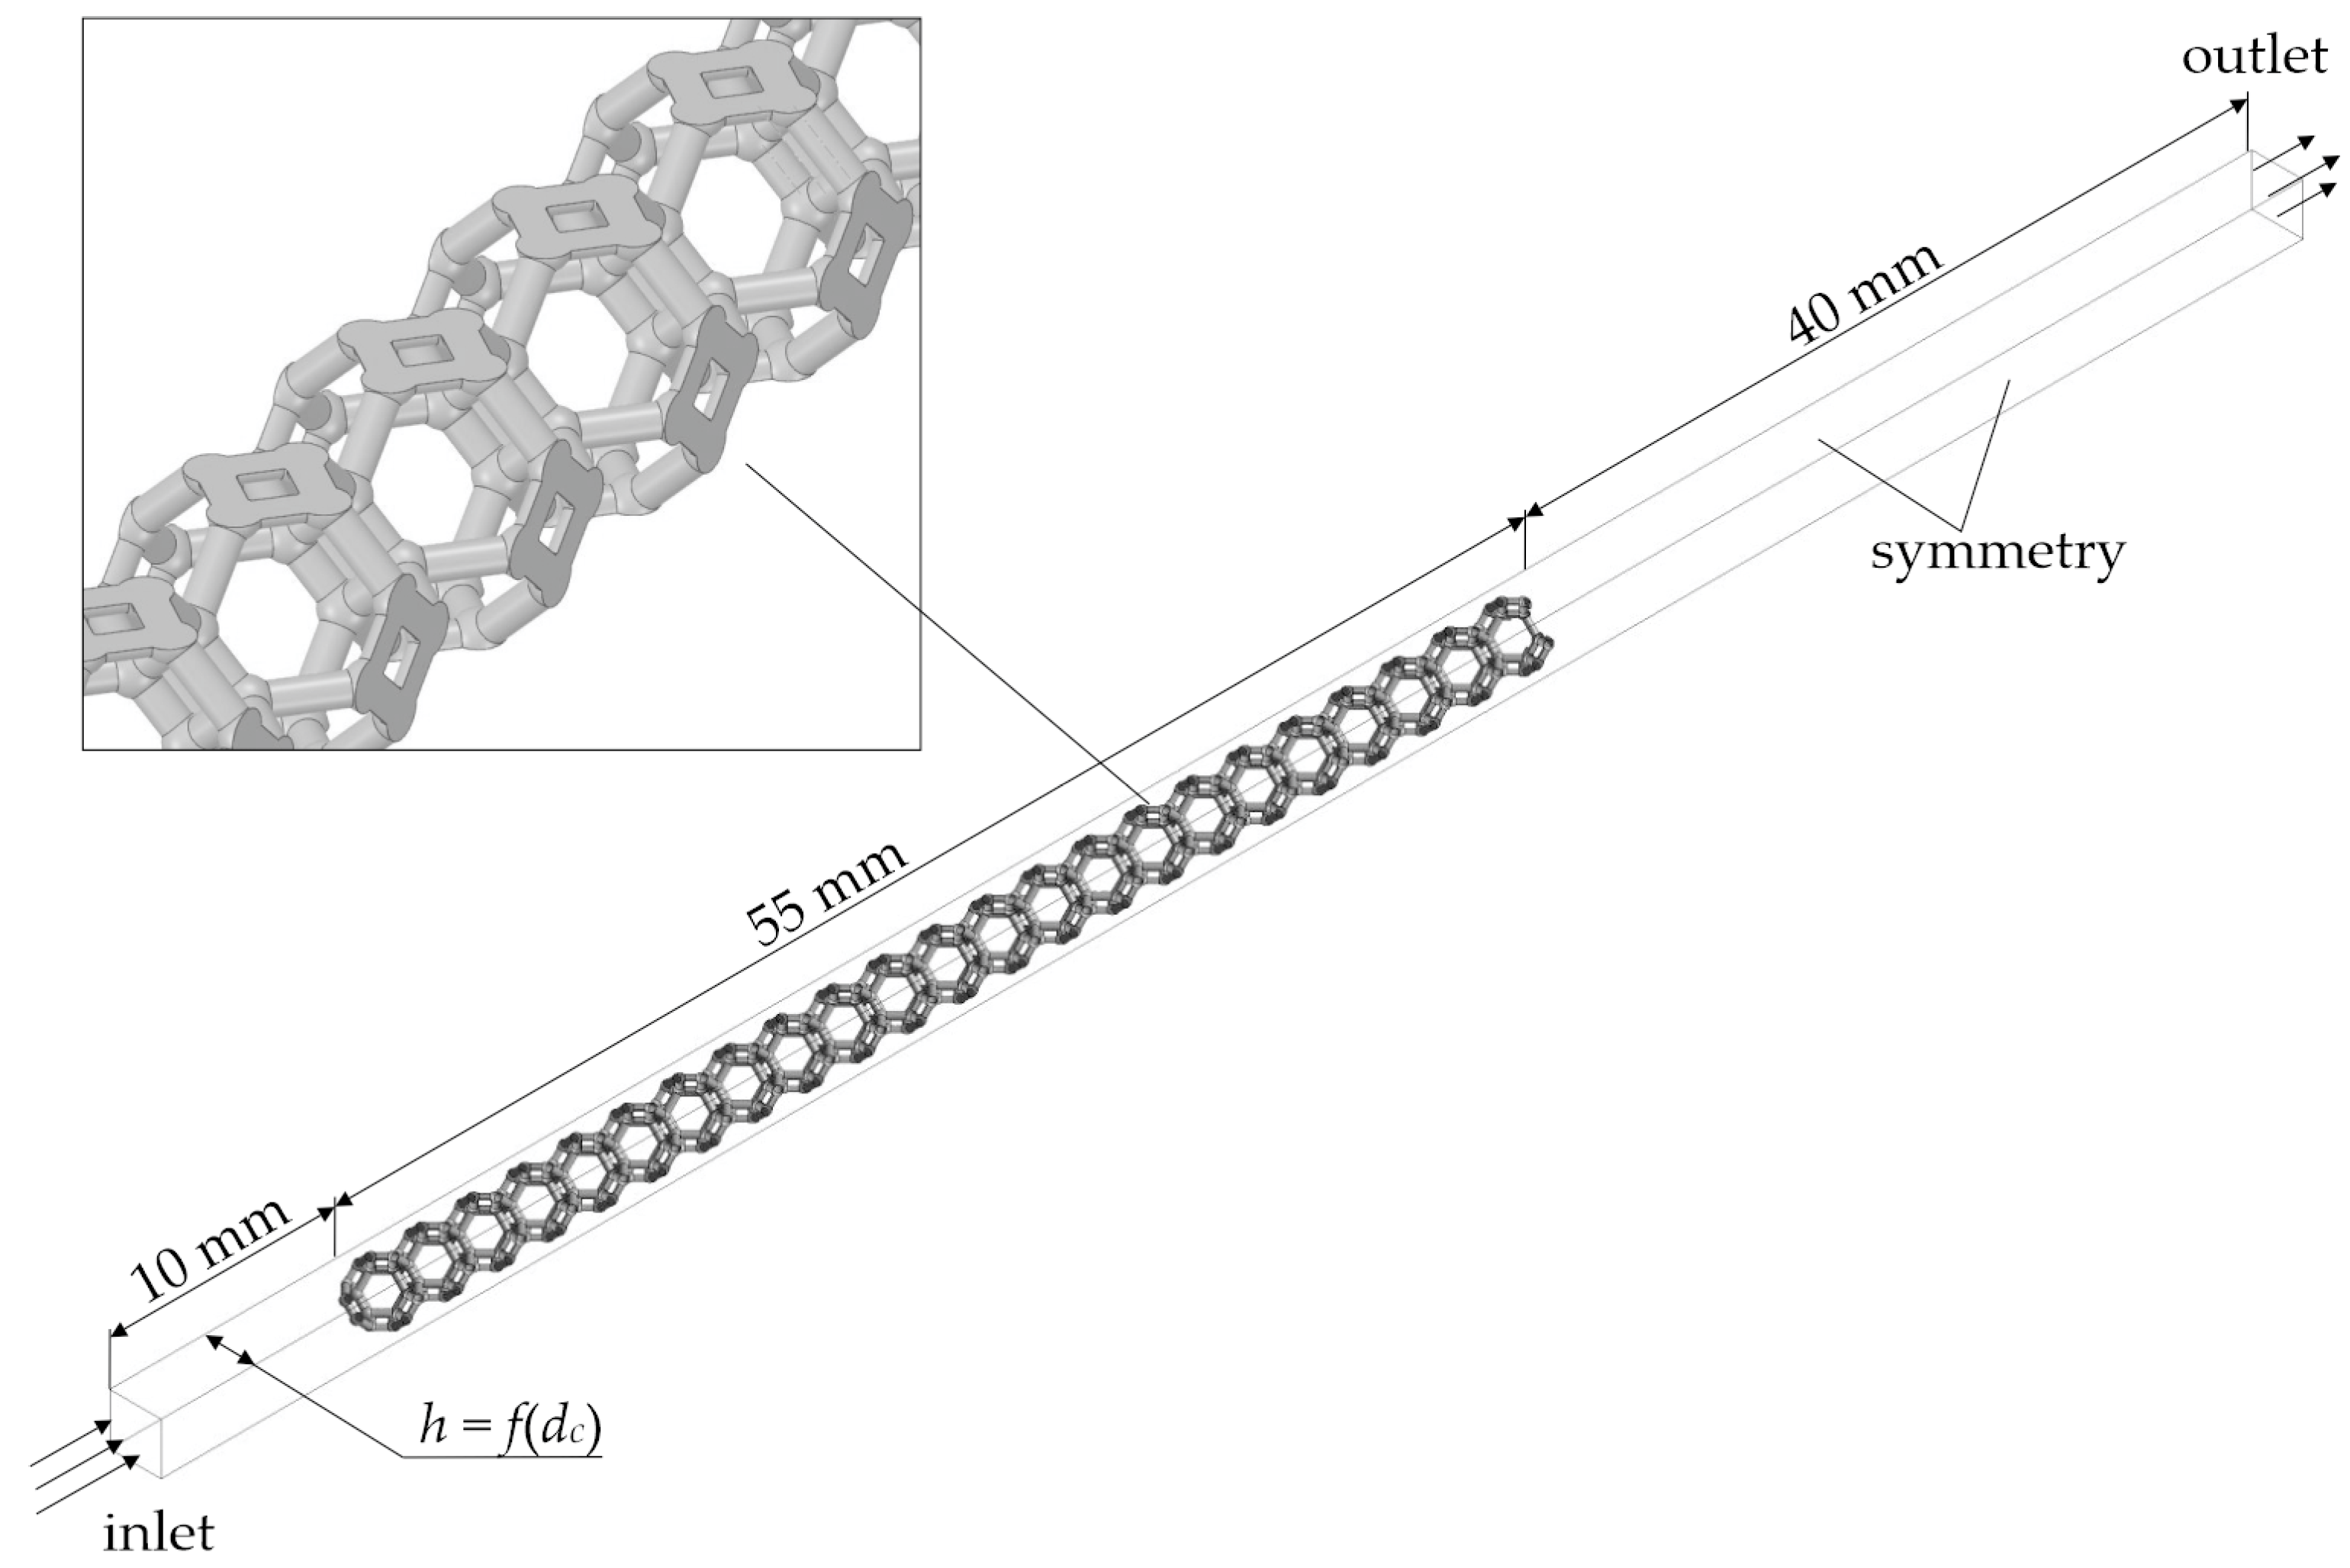
The final computational domain in the form of a rectangle as shown in
Figure 5. The size of the cross-section of the region
depends on the size of the cell diameter
:
.
In the study, boundary conditions were specified in specific zones to solve hydrodynamic and mass and heat transfer problems in the reactor (
Figure 5). At the inlet boundary, the mass flow rate of the gas mixture was set to be equal to
. Here,
= 1.7 × 10
−6 kg/s is the mass flow rate value from the original cylindrical domain (
Figure 2b),
S0 is the inlet square value from the original cylindrical domain (
Figure 2b), and
Sin is the inlet square value from the determined computational domain (
Figure 5).
The inlet gas temperature was set from 30 to 60 °C. The four boundaries were set as symmetry. The no-slip condition was accepted on the impenetrable wall of the catalyst. The conditions for external pressure outside the area studied were stated for the gas outlet. The operation pressure was 101,325 Pa.
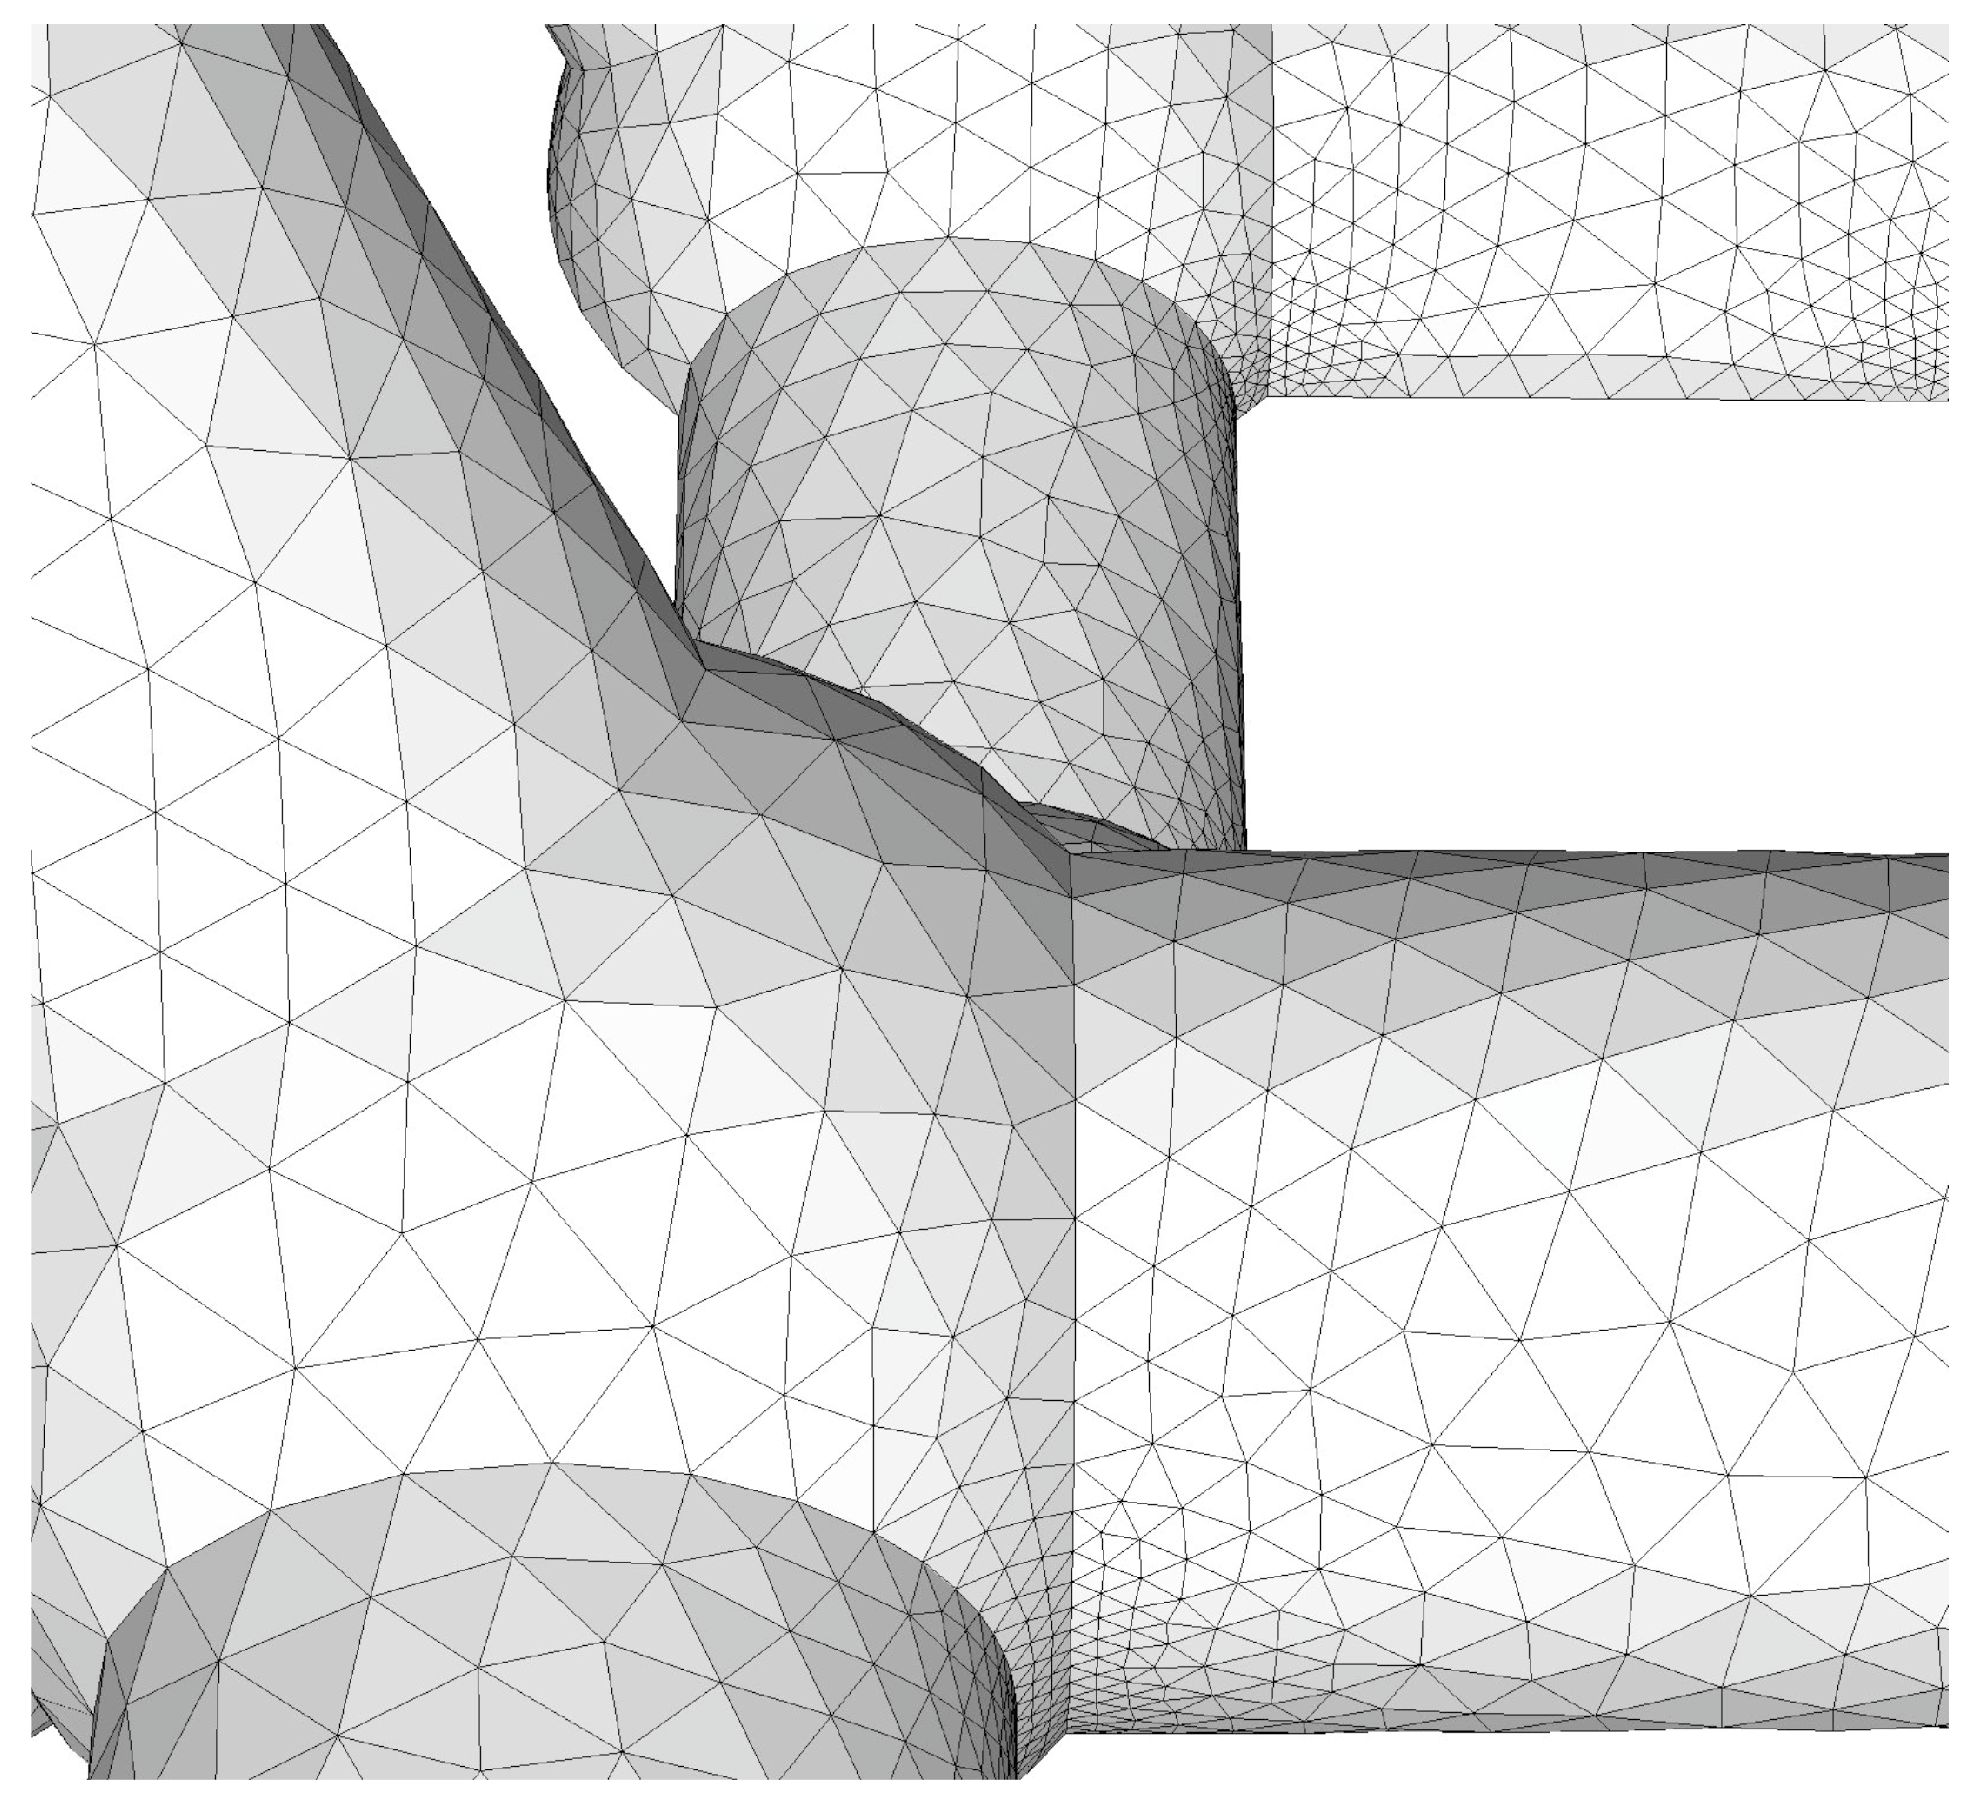
The entire constructed domain was divided into finite elements of triangular shape with sufficient proportions in order to observe specific factors during the study. In the study, the minimum mesh size was determined by the geometry of the catalyst model. The minimum mesh size of 1.0 × 10
−5 m was used in order to place two to five cells on the smallest areas of the surface. Larger cells were placed on larger catalyst surfaces. Performing this, the size of the fibers constituted a limitation. The mesh in the catalyst bed was therefore tested. The analysis results are presented in
Table 1. Testing the mesh was performed based on the parameters of the reaction product yield for an open-cell foam material with
dc = 2.5 mm and
= 0.15 mm.
The final variant of the grid division obtained was 5.0 × 10
−5 m, thickening up to 1.0 × 10
−5 m on small surfaces. In the area of free gas flow, a grid with a mesh size of 1.0 × 10
−4 m was constructed. A sample of the mesh on fibers is shown in
Figure 6.
3. Results and Discussion
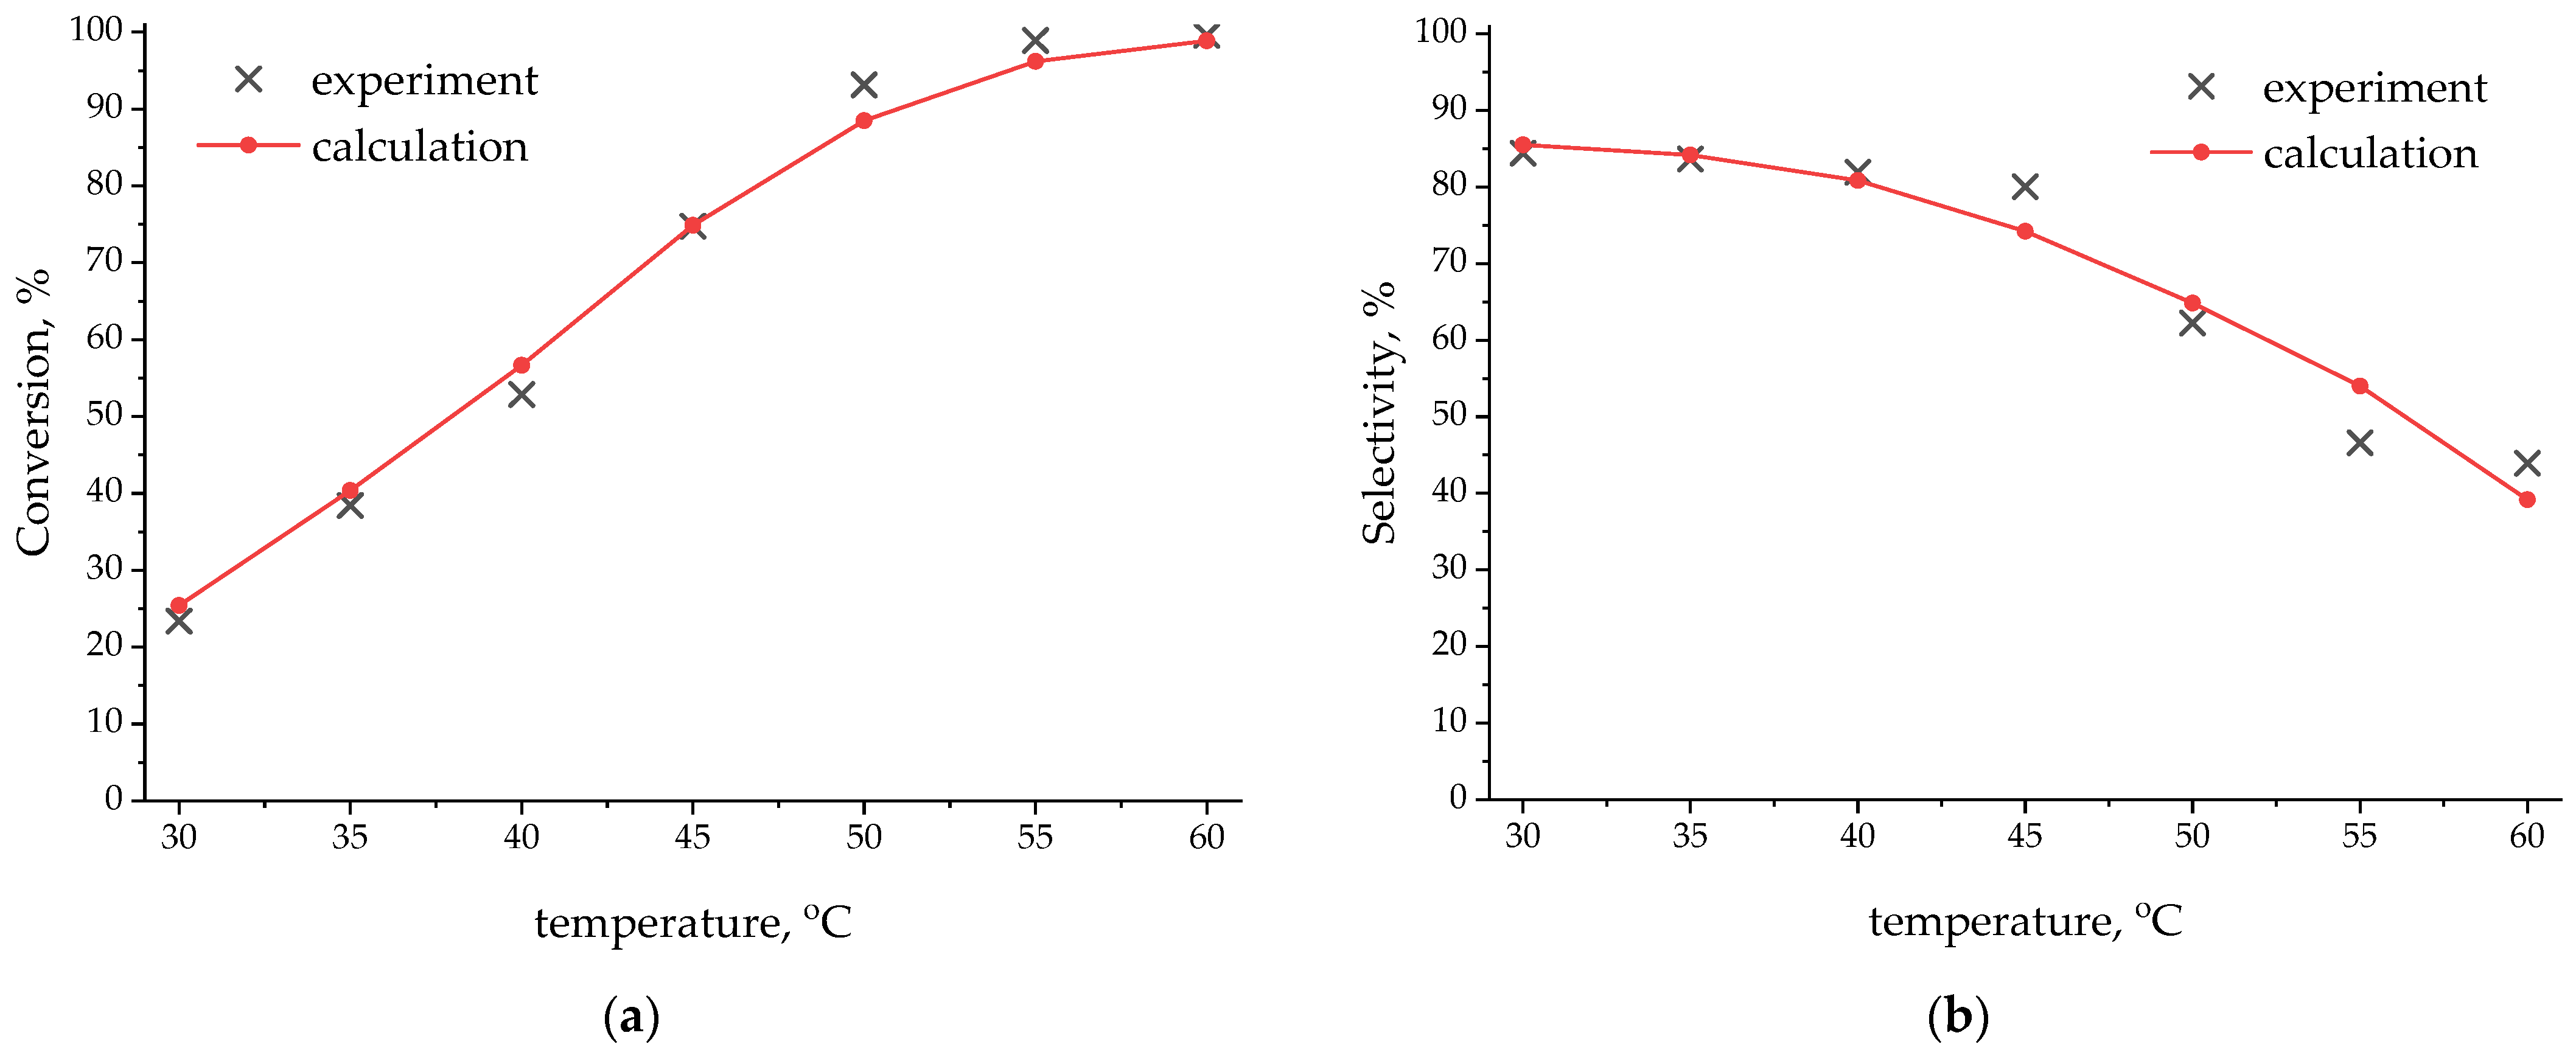
A comparison with the data of experimental studies was conducted to verify the constructed geometric model of the open-cell foam catalyst and the model of the gas mixture flow. For the experimental sample, the average cell size was
= 2.5 mm, and the average fiber diameter was
df = 0.15 mm.
Figure 7 shows graphs for points of experimental studies and curves obtained by numerical simulation. Very good agreements were obtained both in the parameter of catalyst activity, which is determined by the course of the reaction Equation (1), and in the parameter of selectivity, which considers the reaction’s progress Equation (2).
After verifying the constructed models, additional studies of the influence of the geometric parameters of the structure of the porous material on the efficiency of the investigated process of catalytic hydrogenation of acetylene were performed. For this task, the parameters defined were: = 2.0, 2.5, and 3.0 mm; df = 0.05, 0.10, 0.15, 0.20, and 0.25 mm.
Reactions Equations (1) and (2) proceed with the release of energy; therefore, we expected to observe an increase in the gas temperature after passing through the catalyst bed. The largest increase in temperature = 0.0816 °C was observed for the variant dc = 2.0 mm, df = 0.25 mm, and = 60 °C. Such a slight increase in temperature is because the initial content of acetylene in the gas mixture was only 1% of the mass.
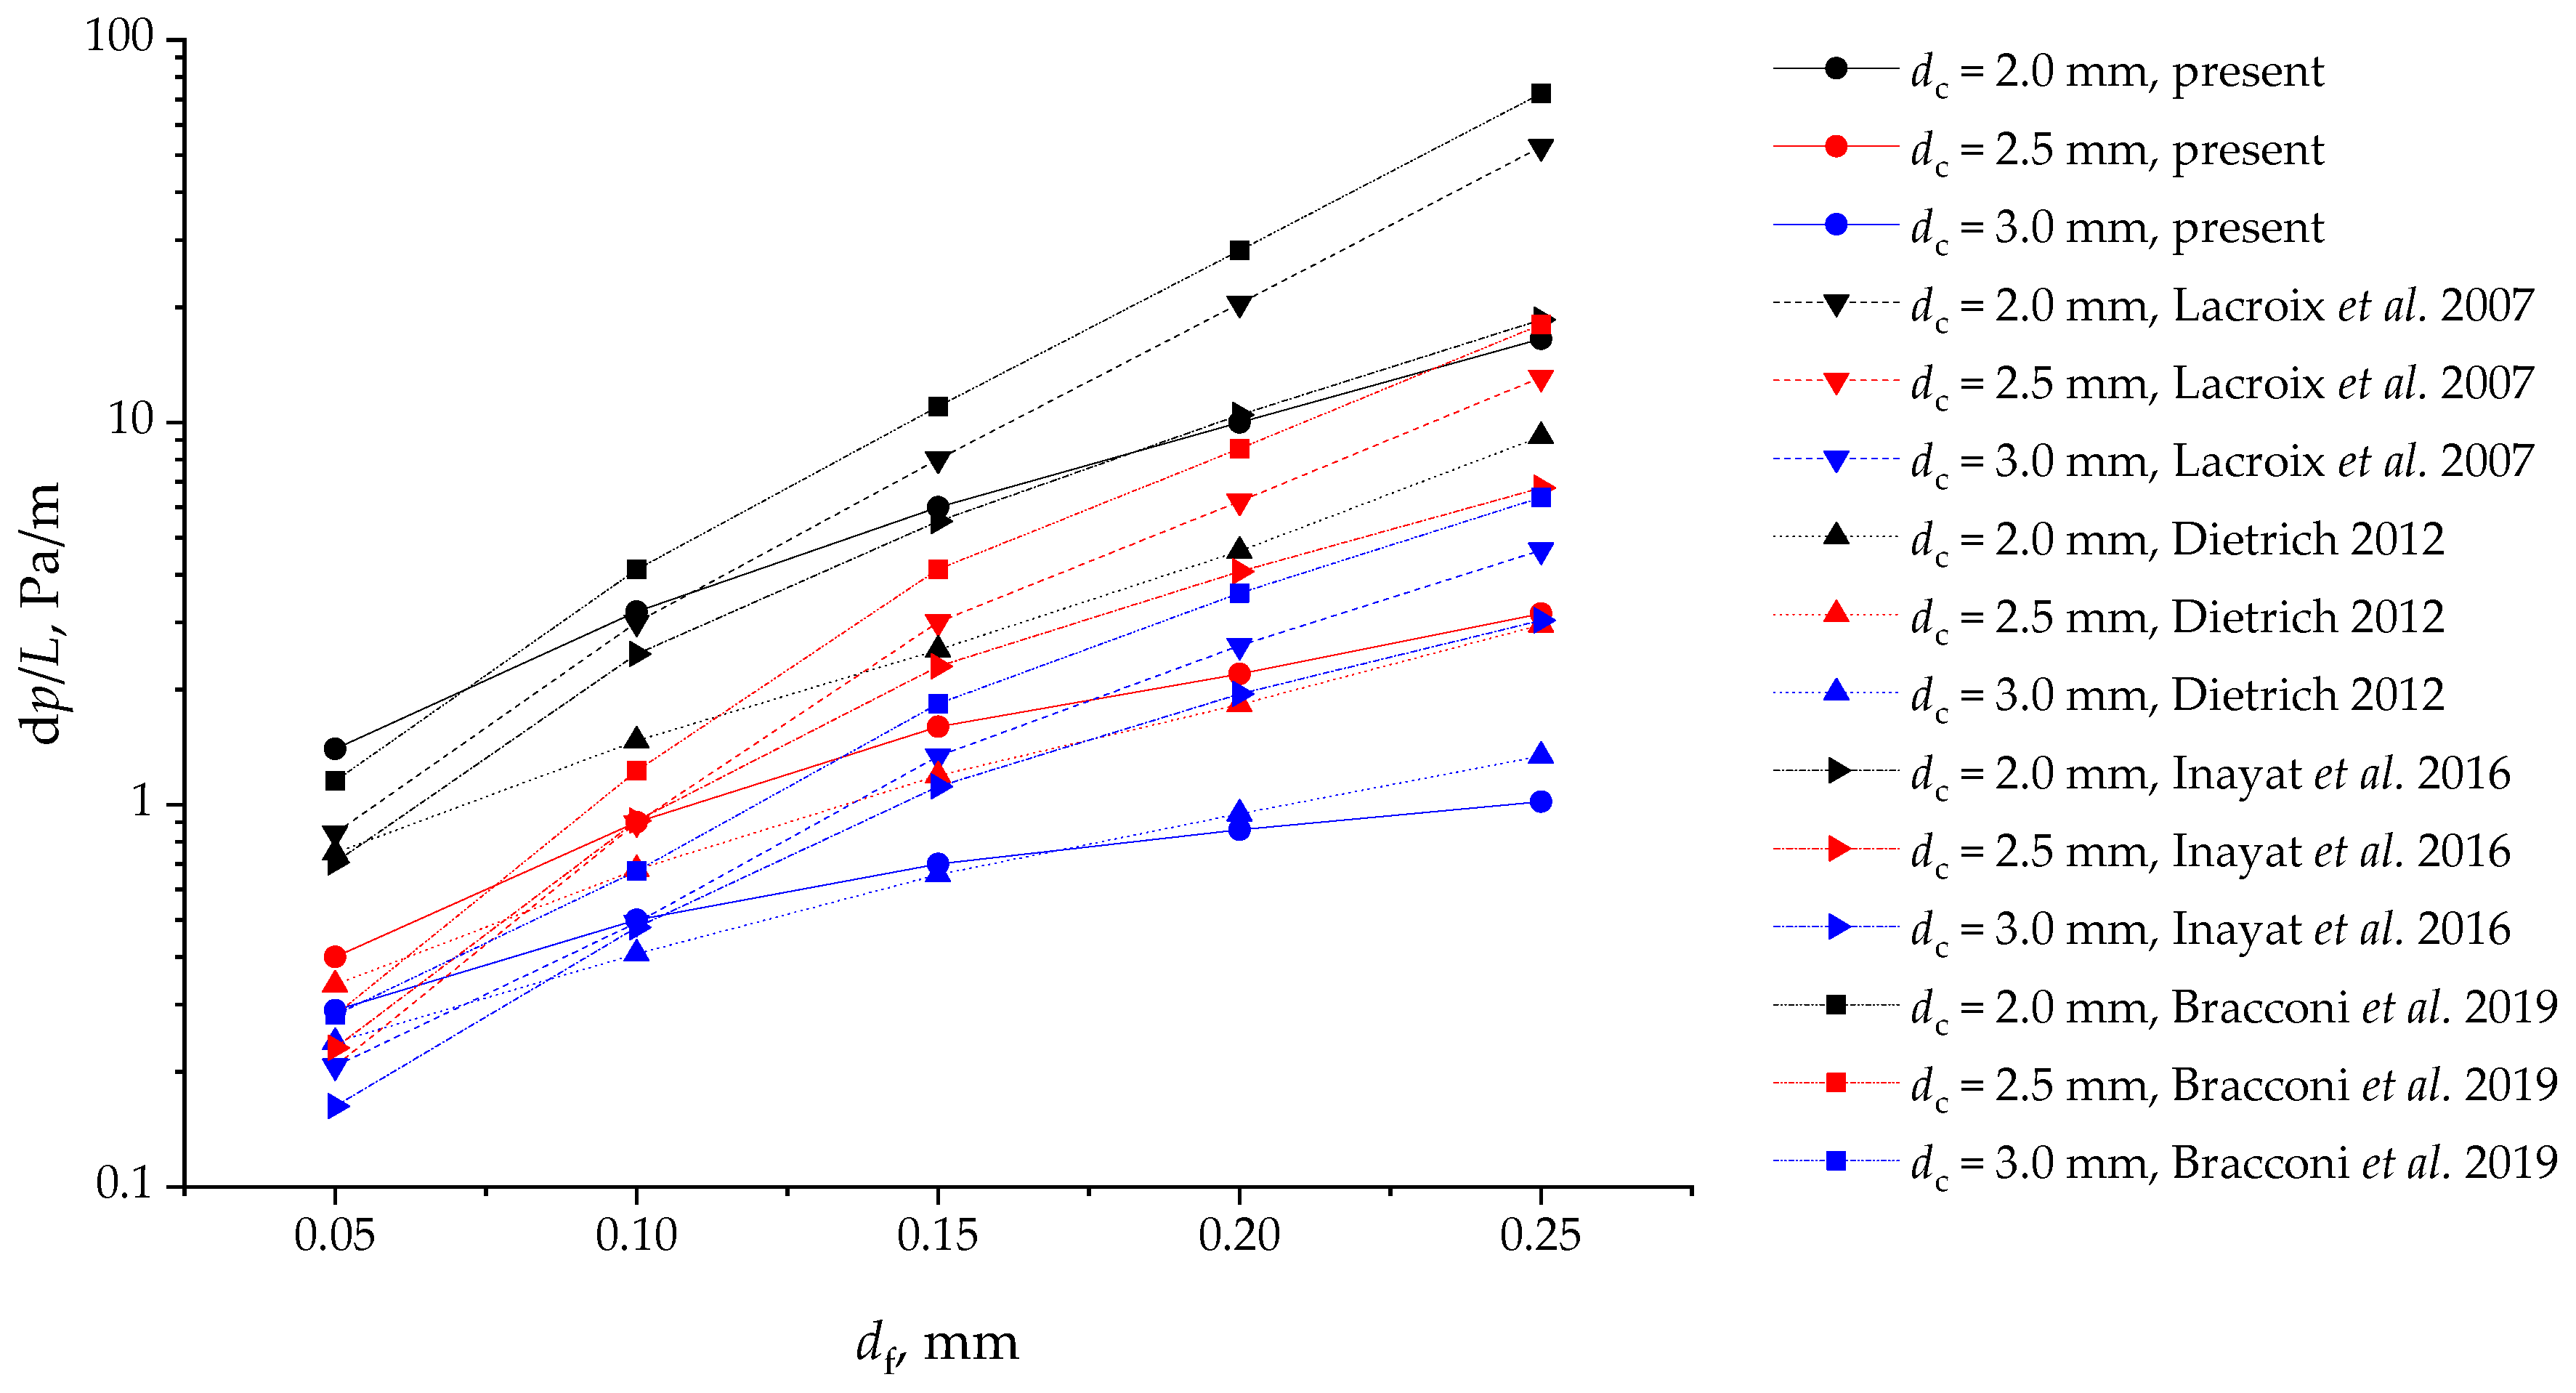
The calculated pressure drop values after passing the porous medium showed small values. The maximum pressure drop was 0.91 Pa. This is due to the low gas velocity = 4.5 × 10⁻³ m/s and the structure of the porous medium, which was constructed of smooth cylinders and spheres.
Let us compare the obtained values of the pressure drop with the correlation expressions of works [
31,
50,
51,
52]. As well as for the correlation expression of the geometric parameters of an open-cell foam material, a large number of dependencies were obtained for the pressure drop value for various cell models. We chose the constraints for the cell models that most closely match our geometry.
The results of calculating the pressure drop related to the length of the open-cell foam material are presented in
Figure 8. Since, in the experiments and in our numerical simulation, studies were carried out only for one value of the velocity
= 4.5 × 10
−3 m/s, the results are presented depending on
df. We see that our results are within the range of results for different correlations of other authors. In this case, for
= 0.05 mm, our results are closer to the results of [
37,
51], and, for
= 0.25 mm, our results are closer to the results of [
51,
52].
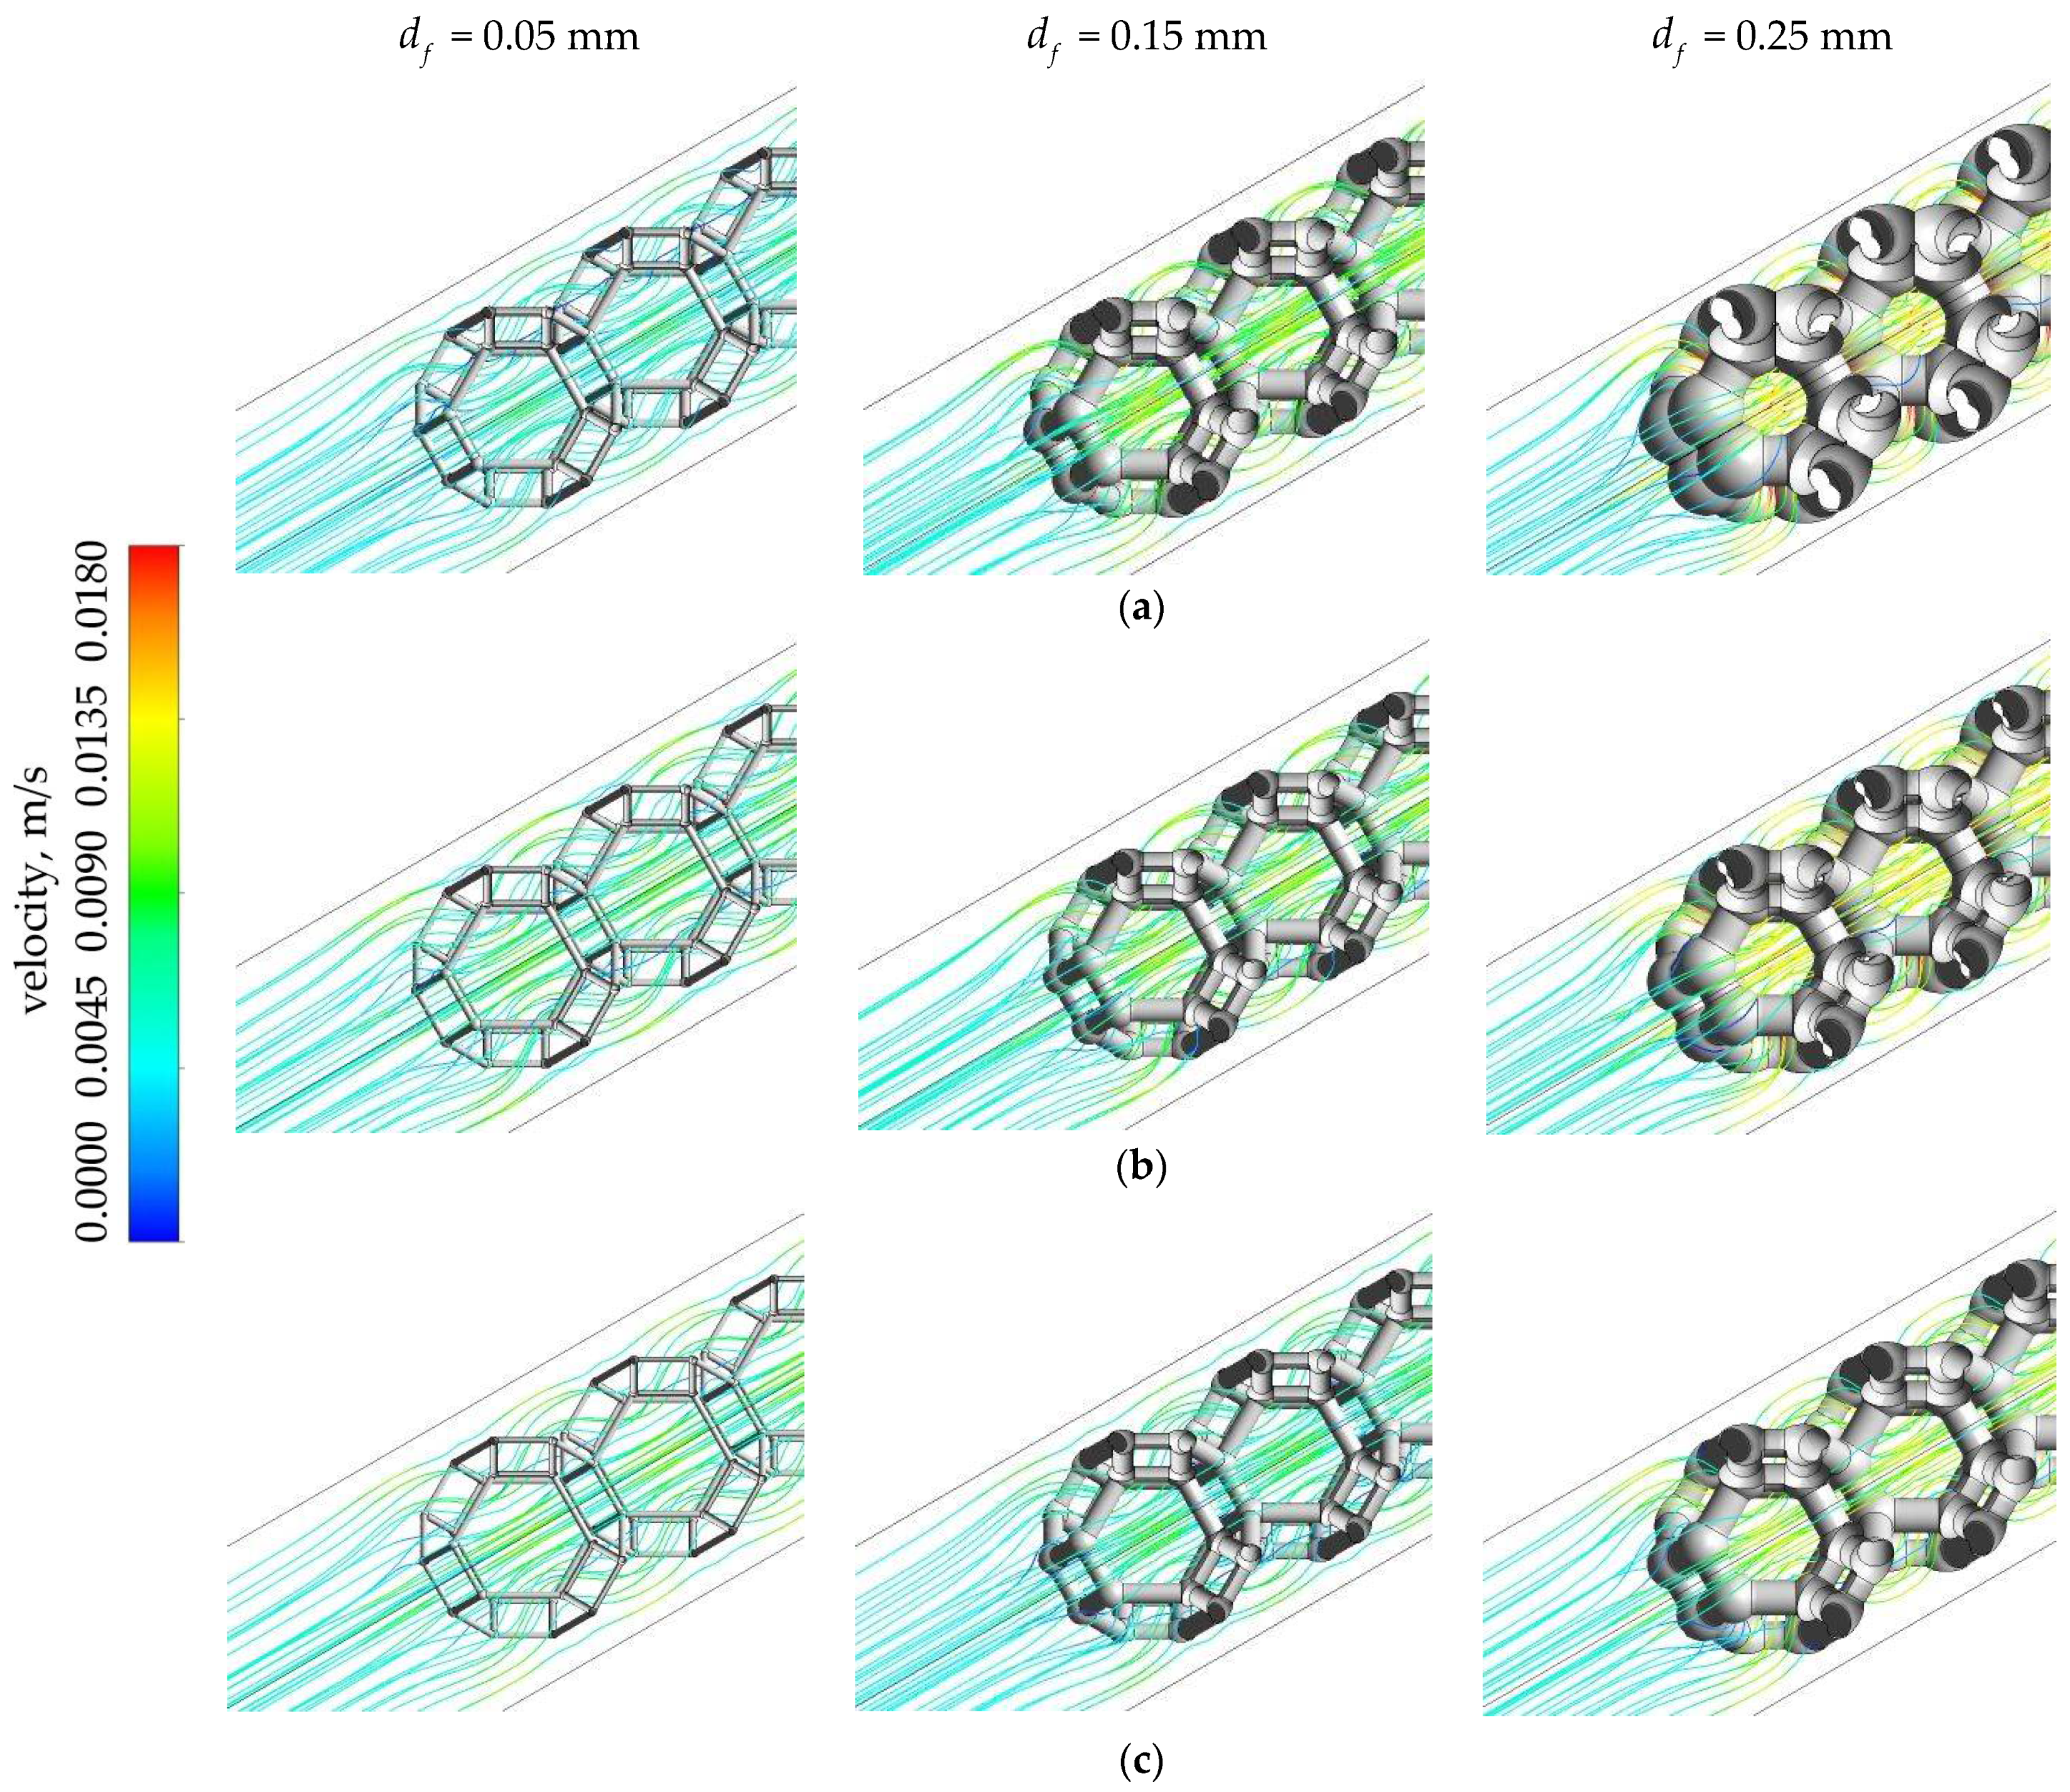
Furthermore, an analysis of the gas flow rate in a porous medium was conducted. The results showed that the presence of fibers reduced the cross-sectional area, inducing an increase in the gas flow rate while maintaining the flow rate.
Figure 9 shows the flow lines of the painted gas on the flow rate scale for different cases
and
df at
Tin = 45 °C. The smallest gas velocity (close to
vin) was observed for
dc = 3.0 mm and
df = 0.05 mm. The highest gas velocity was observed for
dc = 2.0 mm and
df = 0.25 mm.
Figure 10a shows the graph of the average cross-sectional gas flow rate in a porous medium for all considered cases. The gas velocities shown are related to the velocity at the entry into the computational domain
vin. At a value of
df = 0.05 mm for all
dc values, the porosity of the structure tended to 0.99, and the average velocity tended to the value of the velocity at the entrance to the computational domain. As the size
df increased, the average gas velocity in the porous medium began to increase. The highest velocity value was observed in the case of
dc = 2.0 mm and
df = 0.25 mm and was
.
Knowing the average gas velocity in a porous medium, the average contact time of the gas with the catalyst surface can be estimated. Considering a porous medium with length L, few observations have been reported. The gas will first pass through the empty channel at the velocity in time . By increasing the porous region, the gas will pass through it at velocity v in a time .
It was, therefore, necessary to normalize the time
in such a way as to approach 1.0 when the porosity of the medium tends to 1.0. The calculation results are presented in
Figure 10b. Clearly, as the gas velocity increases, the contact time with the catalyst decreases. In fact, it is known that molecules can contact the catalyst surface in an arbitrary manner in a real gas flow. The described technique allows only for preliminary estimation of the average gas contact time with the catalyst surface.
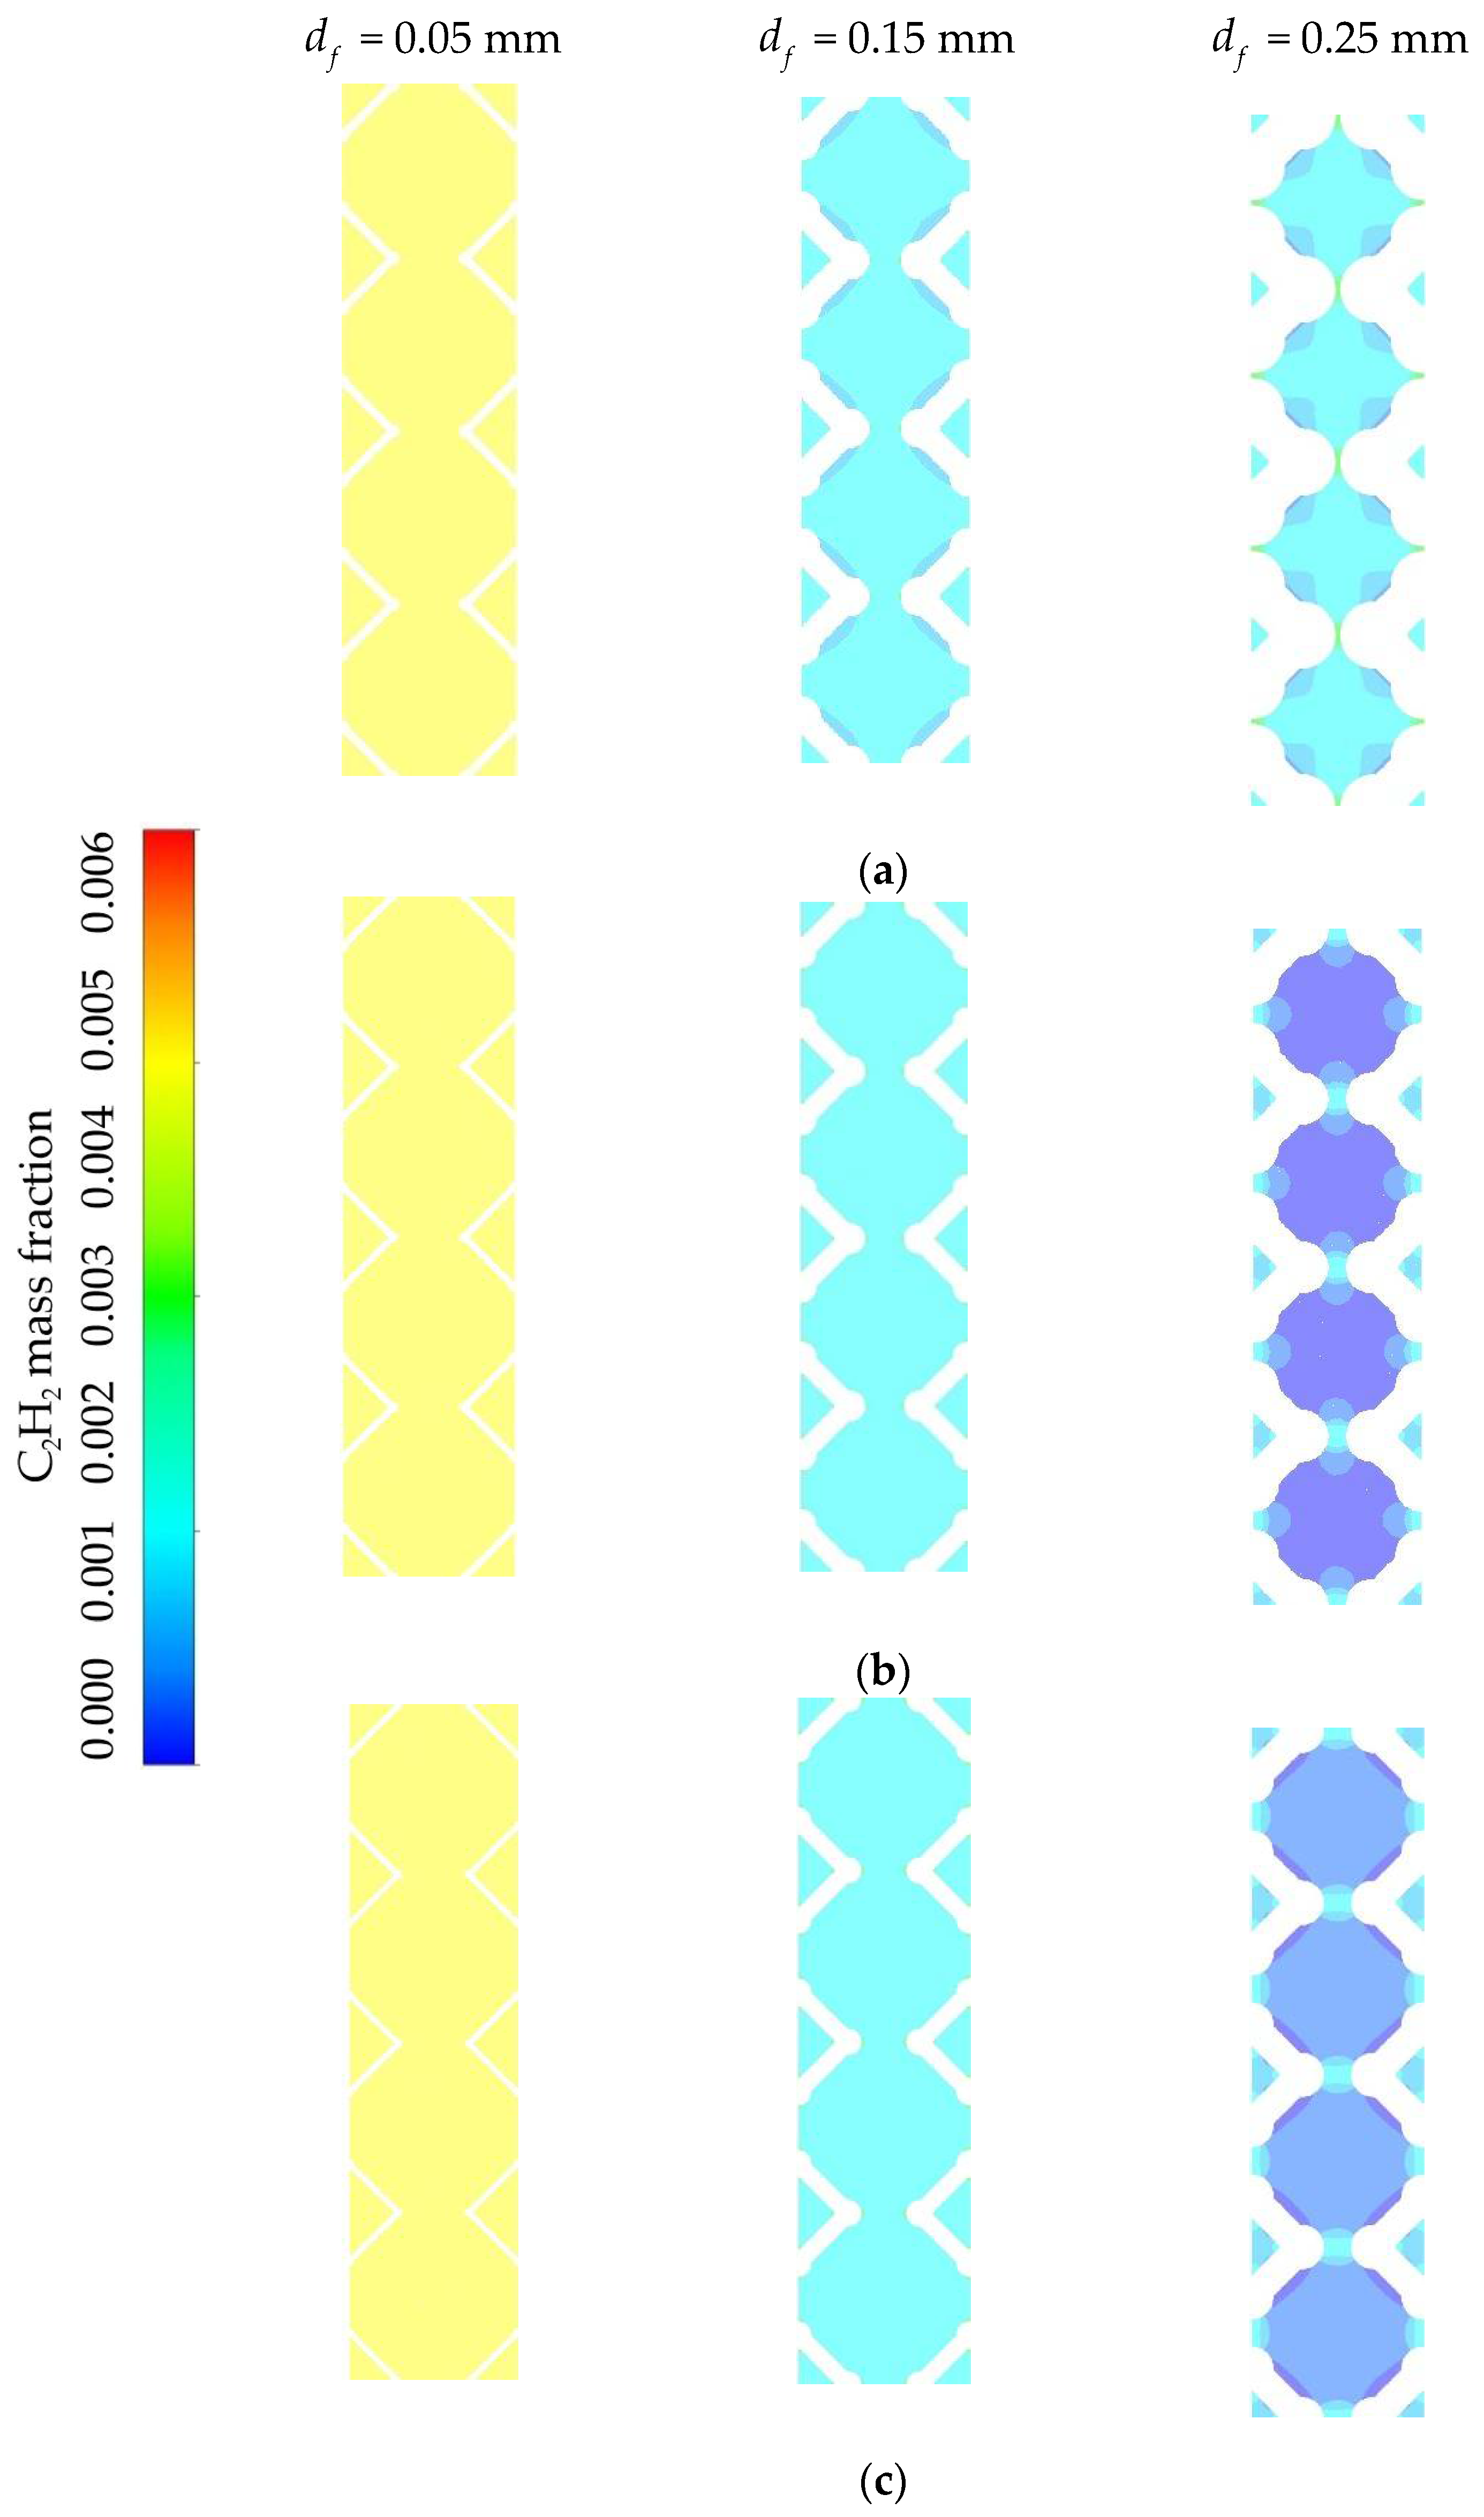
Additionally, the results from calculating the conversion and selectivity parameters were considered.
Figure 11 shows the patterns of the fields of the mass content of acetylene in the longitudinal section of the computational domain for different options
dc and
df at
= 45 °C. Significant differences are seen in the acetylene content with a change in the parameter
df. At the same time, the differences when changing the parameter
dc for the same
df are insignificant.
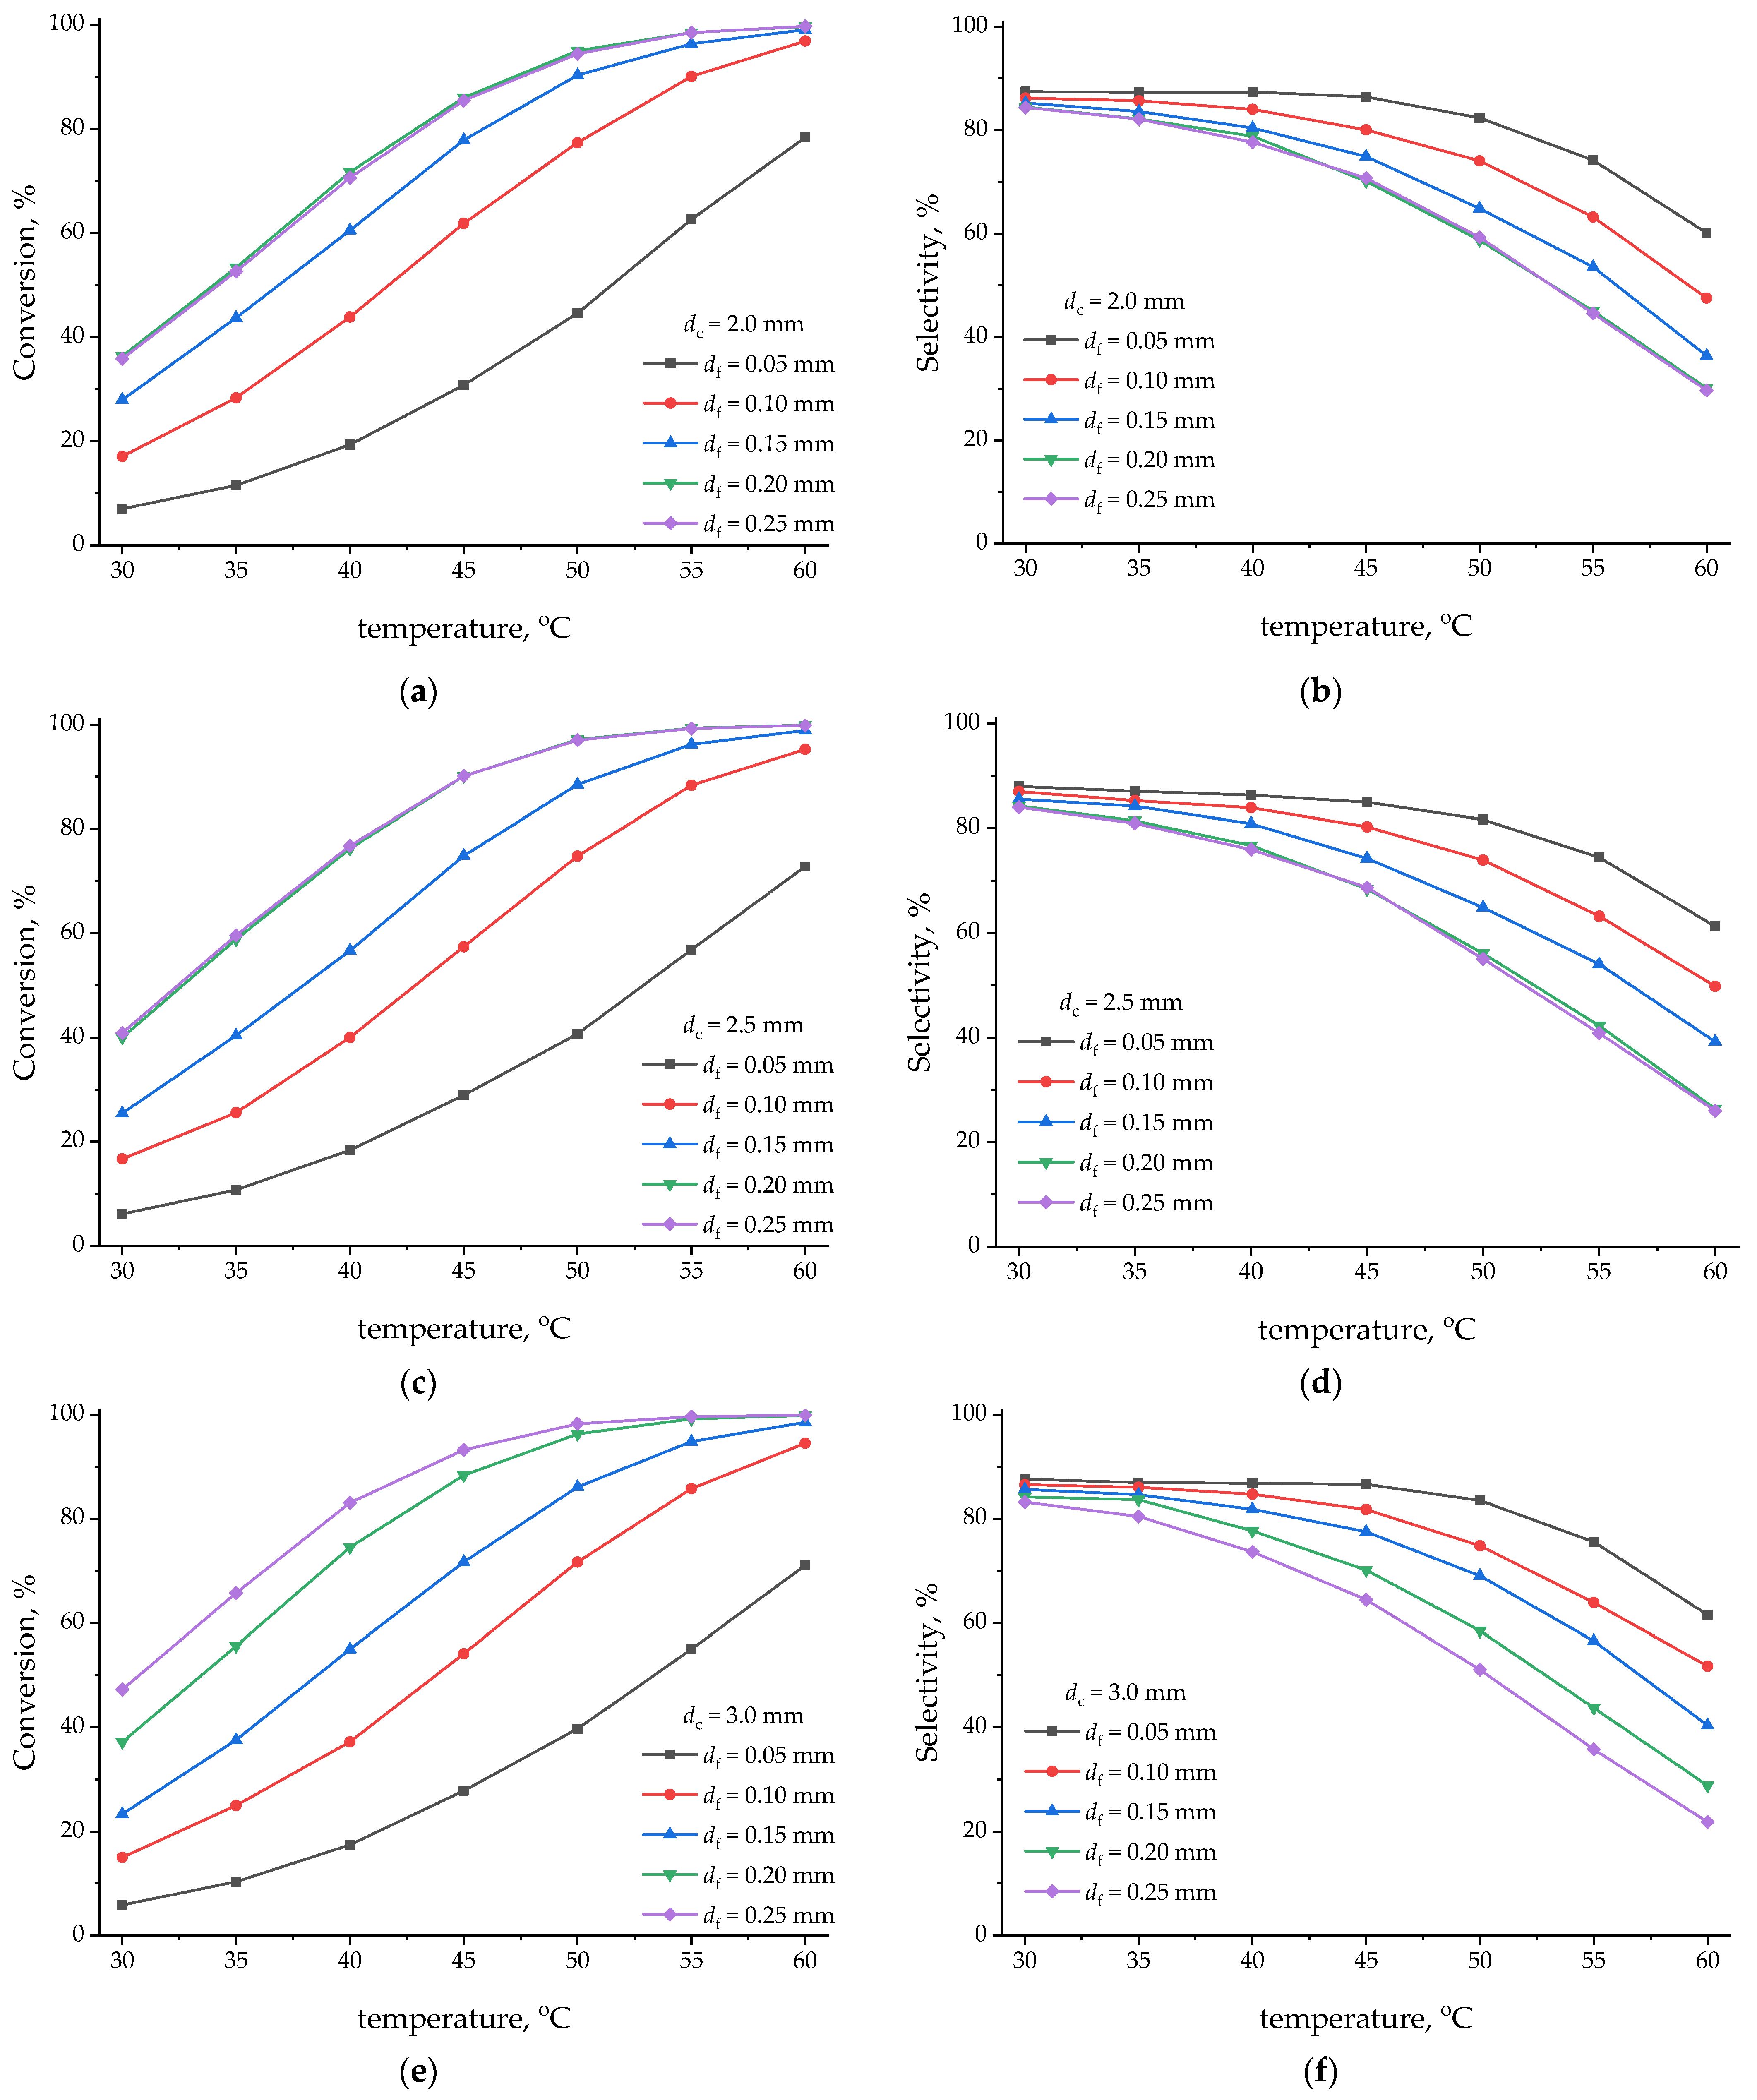
Figure 12 shows the graphs of the calculated conversion (Equation (3)) and selectivity (Equation (4)) for all studied variants of change
,
df, and
. Clearly, an increase in conversion with the increasing temperature was observed. The smallest conversion was achieved for options
= 0.05 mm. In this case, the porous medium had the smallest surface area, and 100% conversion was not achieved even at
= 60 °C. It can be seen from the graphs that, at low temperatures (for example, for
= 30 °C), the conversion for the case
dc = 3.0 mm was greater than for the case
= 2.0 mm.
In this case, for the case of dc = 2.5 mm, the results of calculating the conversion for df = 0.25 mm and df = 0.20 mm do not differ practically. For the case of dc = 2.0 mm, the results of the conversion calculations for = 0.25 mm were slightly smaller than for = 0.20 mm. In case of dc = 3.0 mm, the results of the conversion calculations for df = 0.25 mm were much larger compared to when df = 0.20 mm.
As the temperature increased, the formation of the by-product C
2H
6 increased. This negatively affects the selectivity of the process. From
Figure 12, a decrease in selectivity for all
dc and
with increasing gas temperature can be noticed. Moreover, for the temperature range 30–45 °C, the selectivity curve has a slight slope. For the temperature range 45–60 °C, the drop in selectivity is sharper. The conversion parameter for the process under study for different variants
and
df is considered on the same figure.
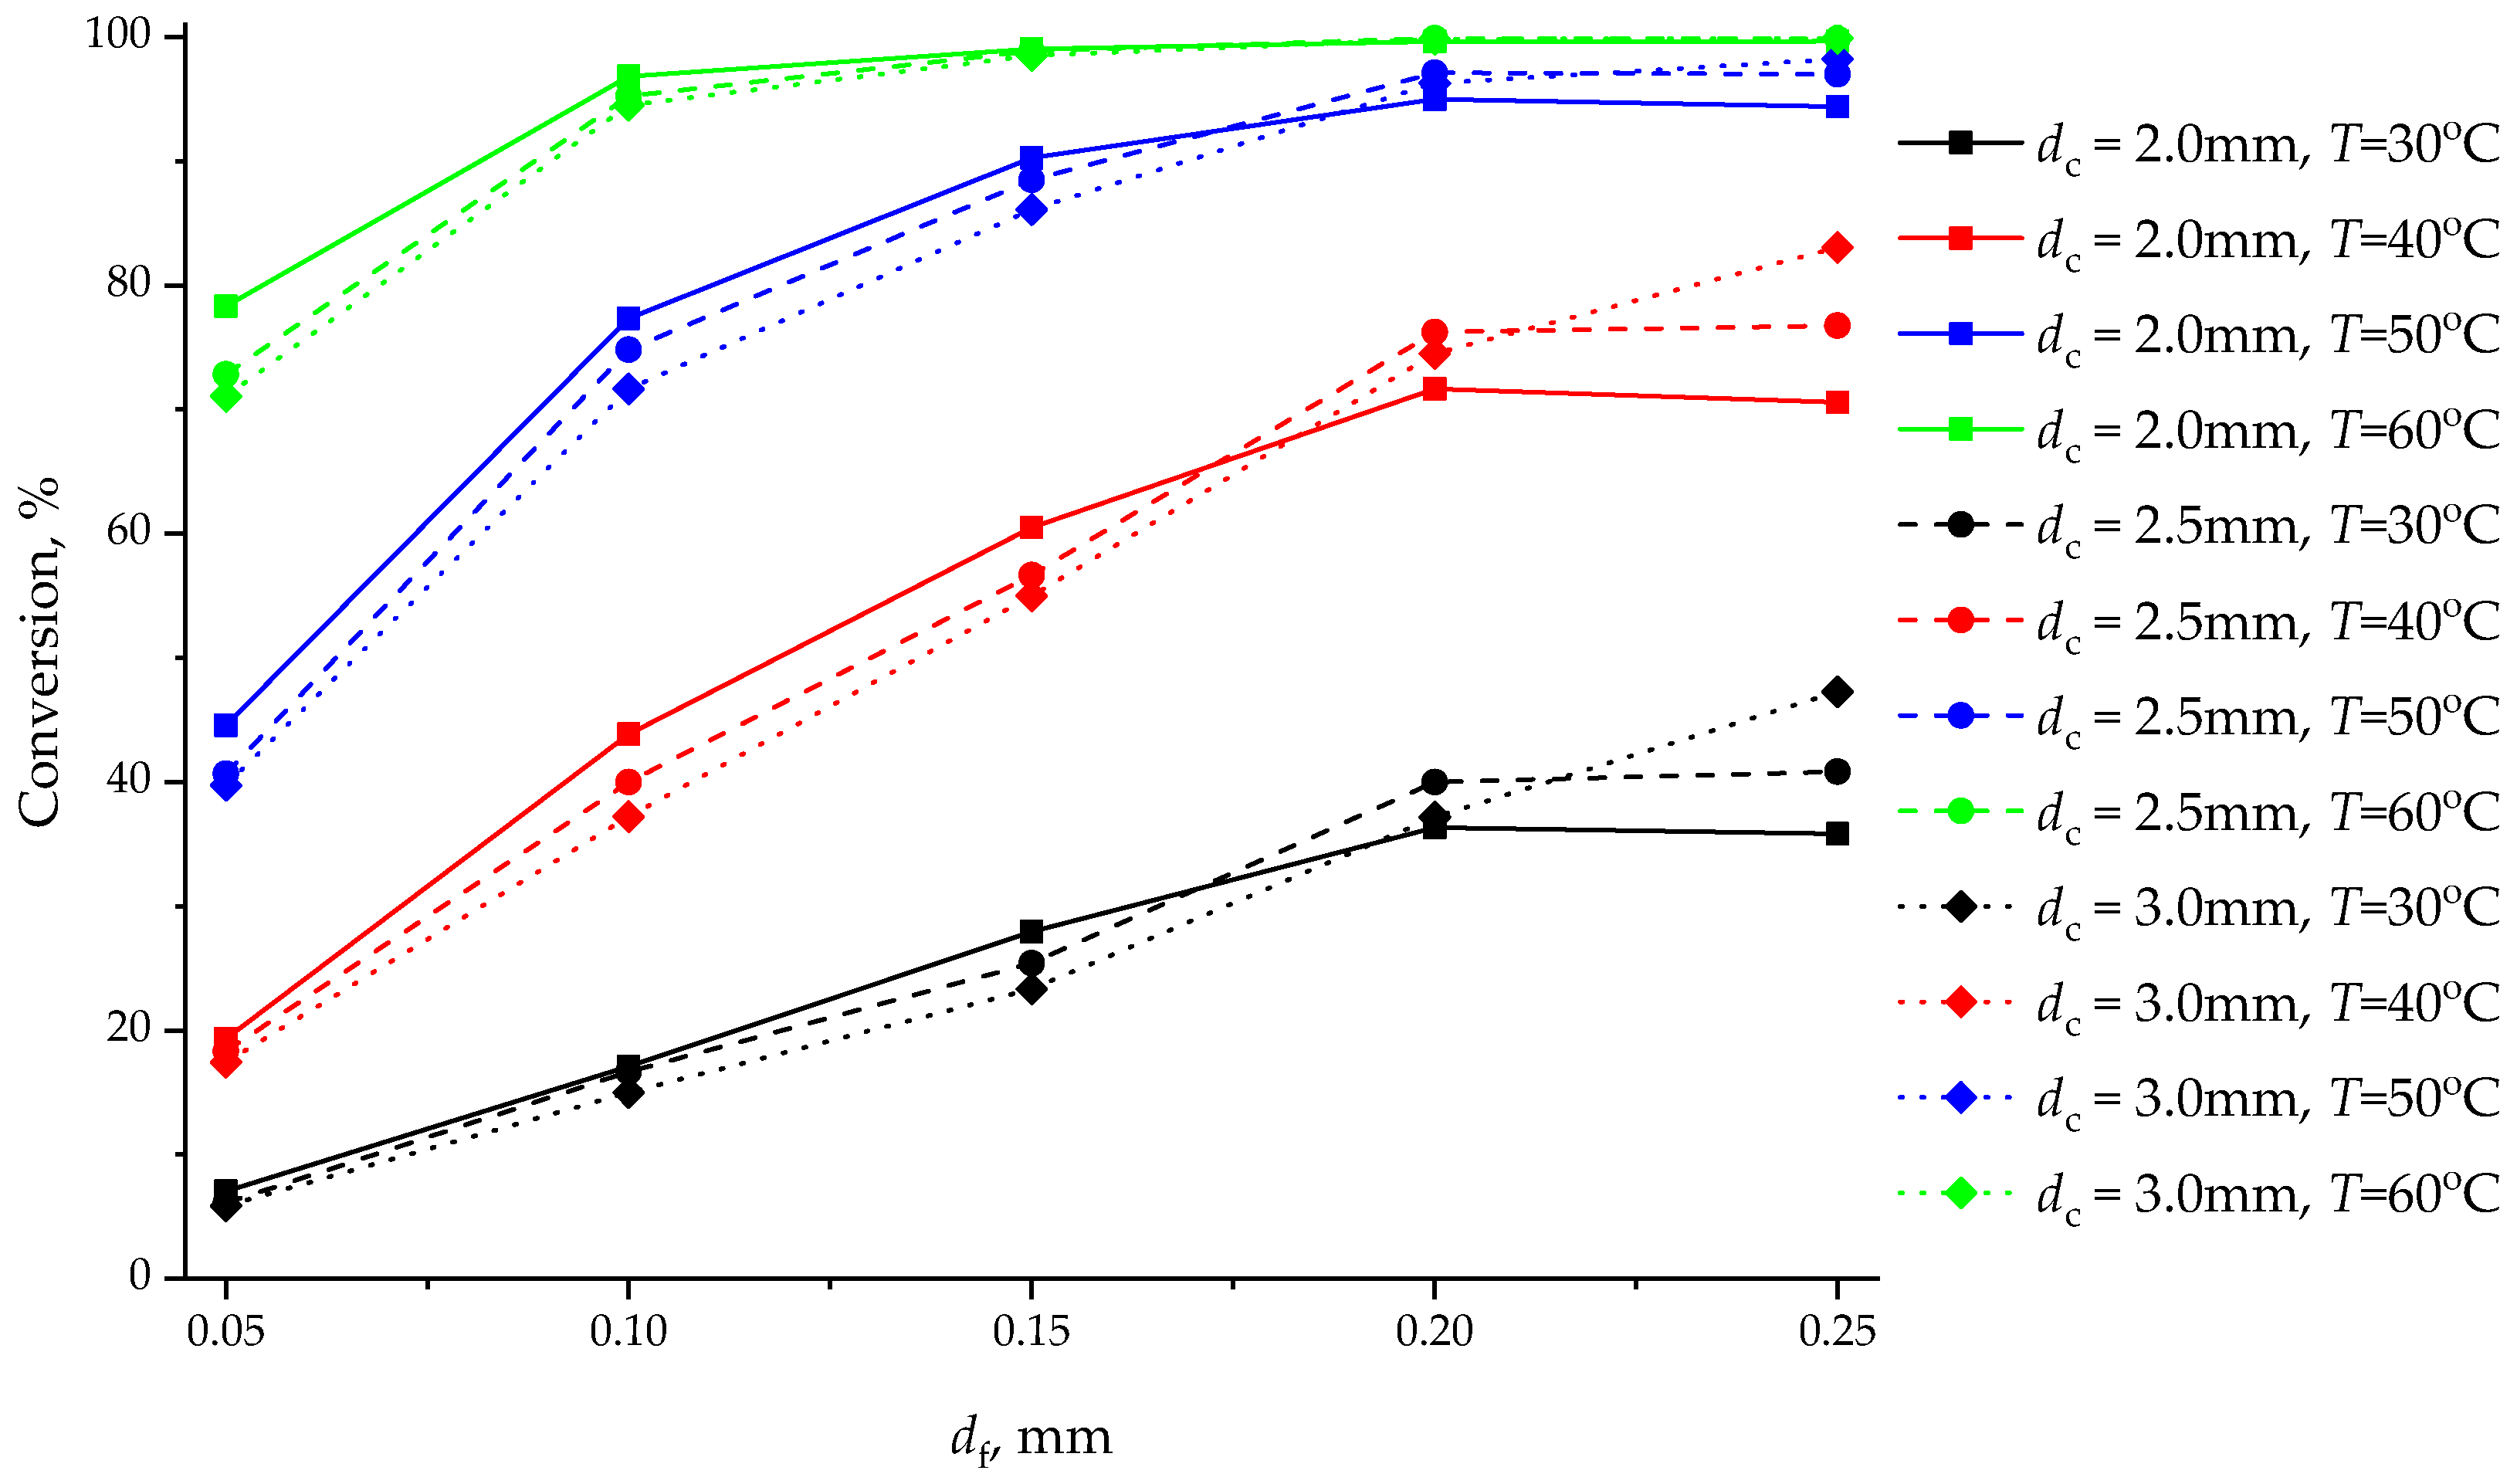
The results when choosing the temperature values 30, 40, 50, and 60 °C are shown in
Figure 13. Significant differences in the nature of the curves can be noticed for gas temperatures of 30, 40, and 50 °C. Similar patterns are observed in the case of
df = 0.05, 0.10, and 0.15 mm. The smallest conversion was observed for cases with
dc = 3.0 mm, and the highest for cases with
dc = 2.0 mm. The results differed significantly for
df = 0.20 and 0.25 mm. For the variant
= 0.25 mm, the smallest conversion was observed for cases with
dc = 2.0 mm, and the highest was for cases with
dc = 3.0 mm.
This can be explained by the fact that the main determining factor for
= 0.05, 0.10, and 0.15 mm was the catalyst surface area, which is larger for
= 2.0 mm (
Figure 4a). With an increase in
df, the gas velocity in the porous medium increased, and, accordingly, the contact time decreased (
Figure 10). For
= 0.20 and 0.25 mm, the main determining factor is the contact time of the gas with the catalyst. That is, under certain conditions, gas dynamics factors prevail over geometric factors.
Thus, in the studied examples for the selective hydrogenation of acetylene, it can be noted that, for small values dc there are restrictions on the size of the fibers df. At a certain value df, a further increase does not lead to an increase in conversion and selectivity, despite an increase in the specific surface area of the catalyst over the entire range of the considered temperature values. At the same time, a decrease in porosity leads to an increase in resistance and additional costs for gas pumping.
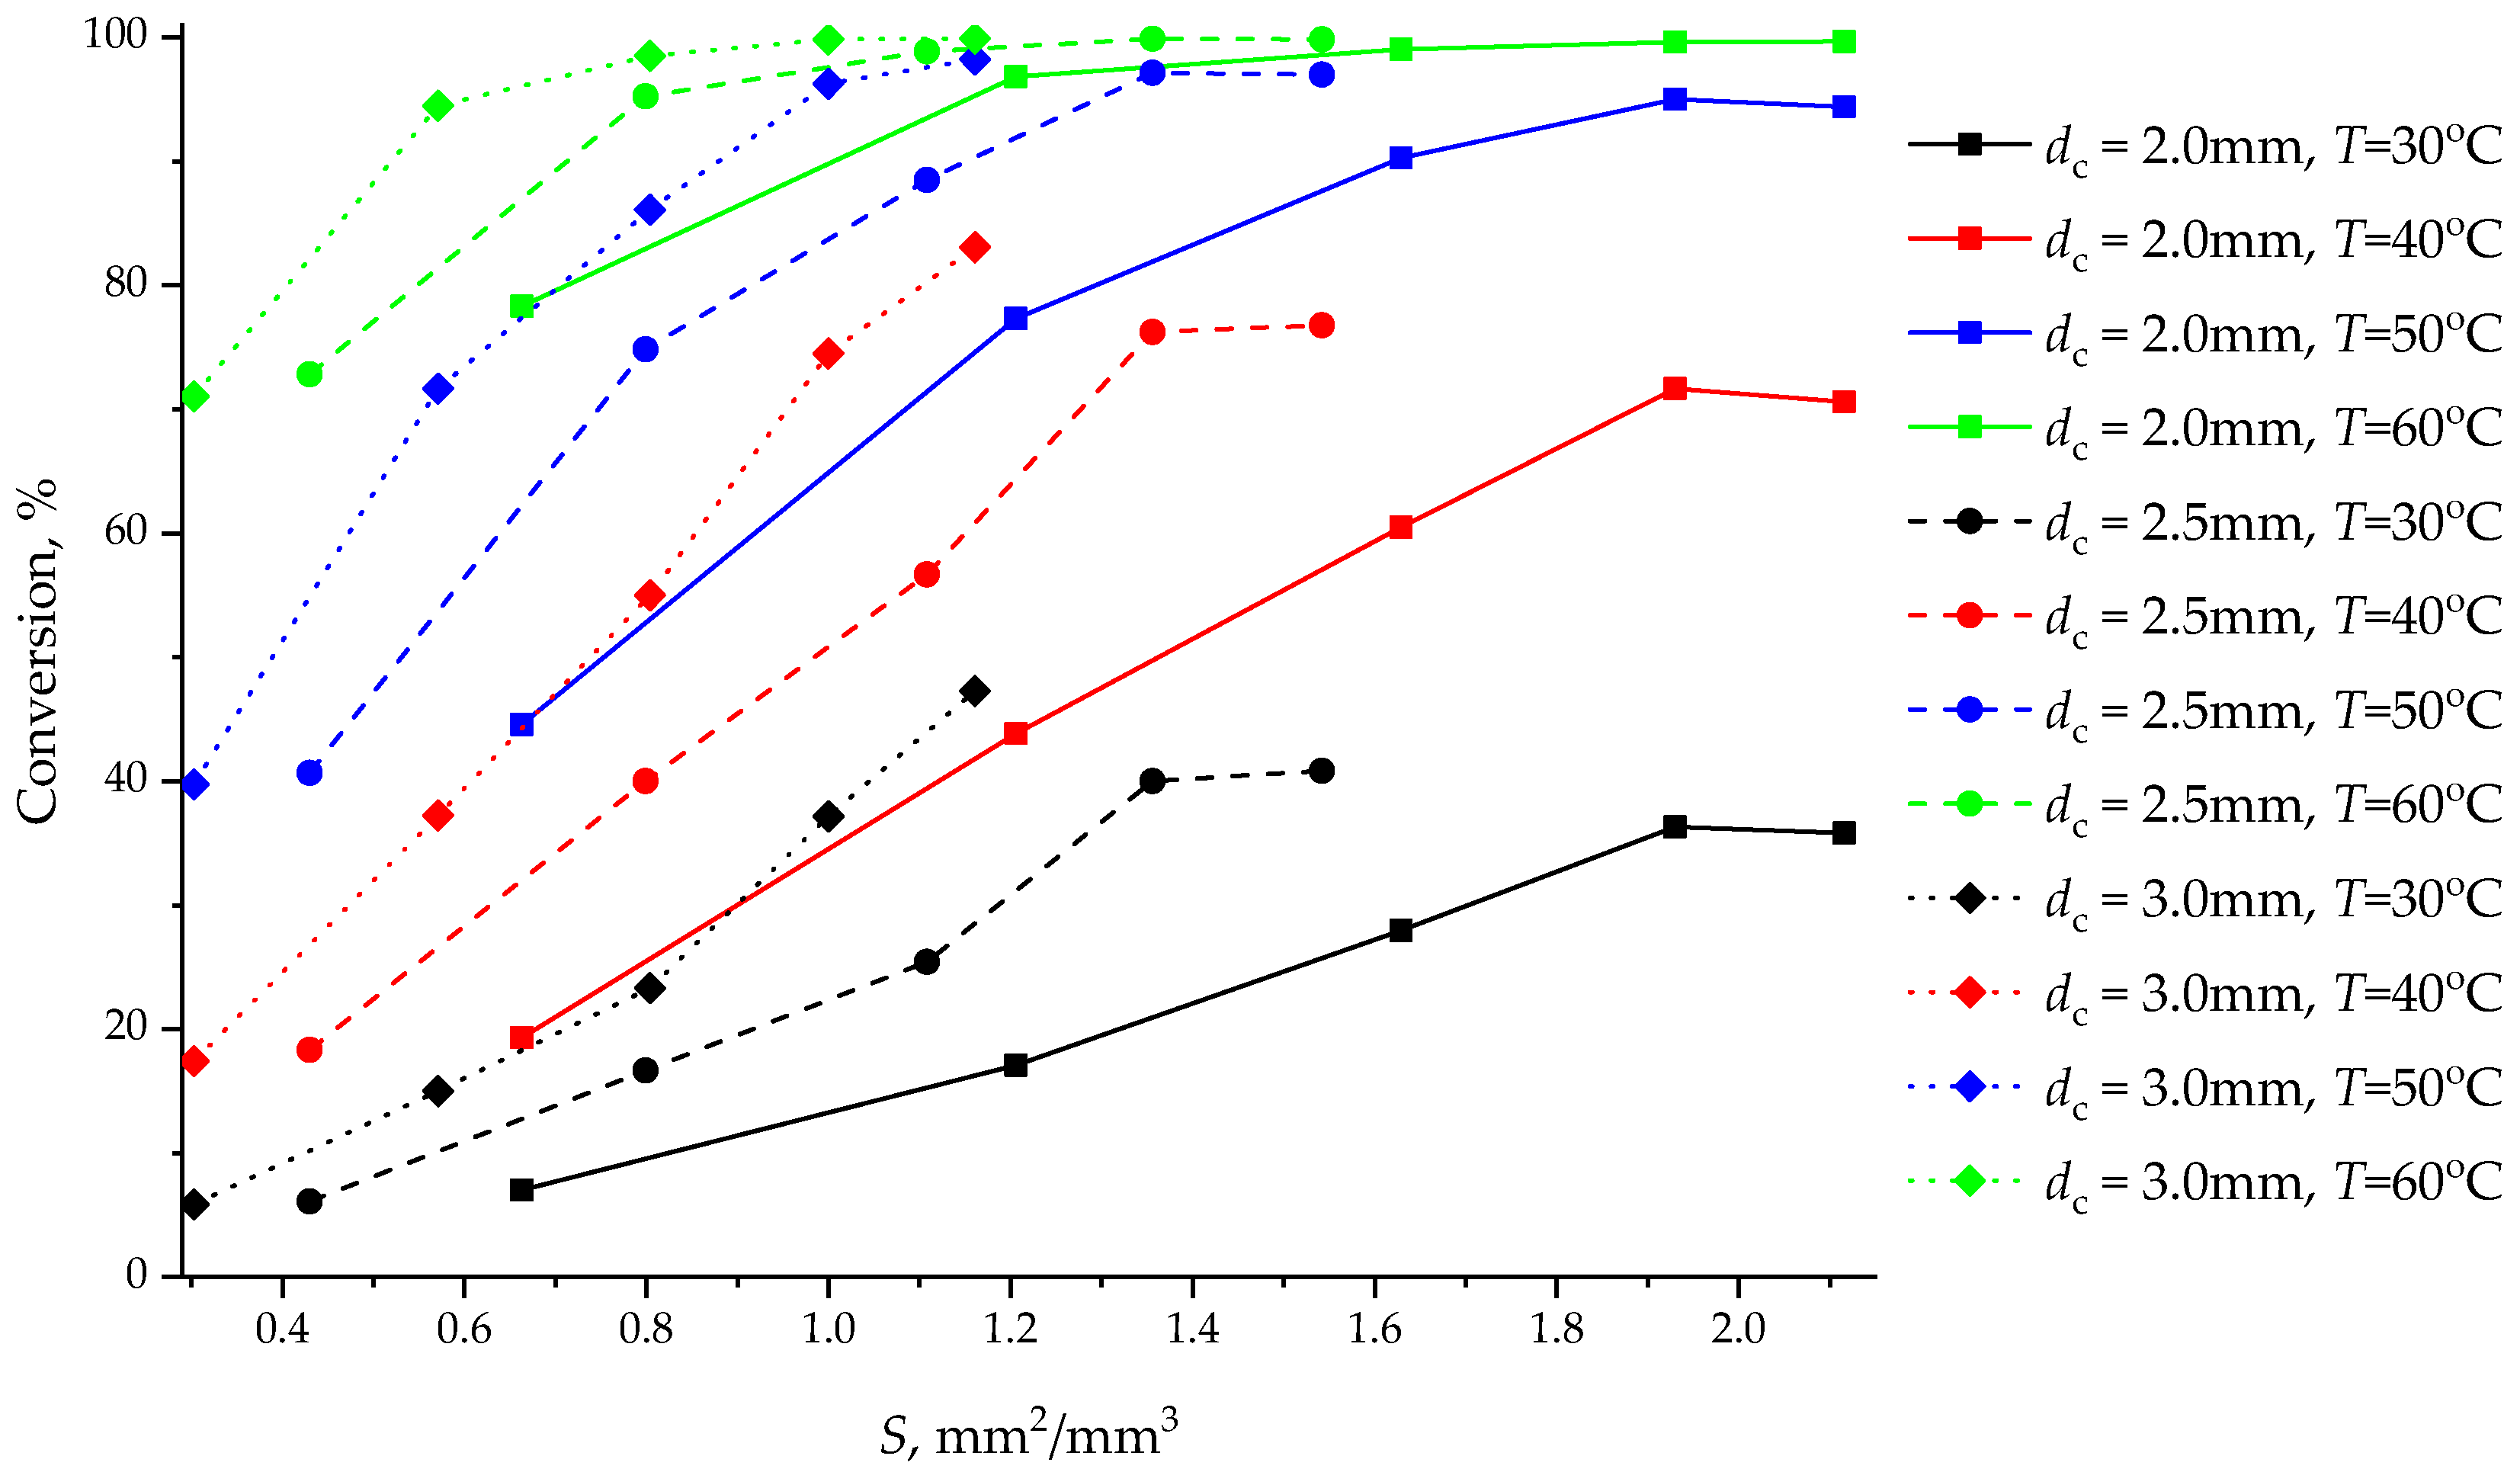
Another important parameter for the research conducted is the dependence of the conversion in the process under study on the amount of catalyst consumed. In the case of the investigated process, the palladium catalyst was deposited on the surface of the finished matrix of open-cell foam material. When considering the same amount of catalyst mass to be spent on each unit of surface area, the mass of the catalyst is directly proportional to the surface area of the porous material.
Combining the data from
Figure 4 and
Figure 13, the results are presented in
Figure 14. The catalyst surface area for case
dc = 3.0 mm was almost half the catalyst surface area for case
dc = 2.0 mm. Thus, the benefits of using small diameter cells are insignificant compared to the cost of catalyst weight. In this case, for
df = 0.25 mm and
dc = 3.0 mm, the conversion was greater than for
dc = 2.0 mm.
Thus, in the examples under study for the selective hydrogenation of acetylene, we determined that, among the examples considered, the most effective was the use of cells with a diameter of = 3.0 mm, despite the smaller specific surface area of the catalyst compared to cells with a smaller diameter.
4. Conclusions
In this work, a detailed study of the process of selective acetylene hydrogenation using open-cell foam catalyst was conducted. The Kelvin cell model was chosen as a model of the porous medium, and the research was performed using CFD methods. The constructed model of the motion of a gas mixture through an open-cell foam catalyst was verified with experimental data in a wide temperature range from 30 to 60 °C.
Furthermore, an investigation of the extent to which the cell size and fiber diameter df of an open-cell foam material affects the activity and selectivity of the catalyst using the example of the acetylene hydrogenation process. Three sizes = 2.0, 2.5, and 3.0 mm, and five sizes = 0.05, 0.10, 0.15, 0.20, and 0.25 mm were chosen. Geometric parameters were estimated for all considered options. The largest surface area referred to the occupied volume possessed by cells with dc = 2.0 mm and = 0.25 mm. Cells with dc = 3.0 mm and df = 0.25 mm had the highest porosity values.
First, let us note the basic points that were obtained with the help of modeling. The calculation results showed an increase in conversion with increasing temperature. The smallest conversion was achieved for options = 0.05 mm. In this case, the porous medium had the smallest surface area, and 100% conversion was not achieved even at = 60 °C. With increasing temperature, the formation of by-products and the decrease in selectivity also increased. For the cases df = 0.05, 0.10, and 0.15 mm, the smallest conversion was observed for cases with dc = 3.0 mm, and the highest for cases with dc = 2.0 mm.
For the variant with = 0.20 mm, the smallest conversion was observed for cases with = 2.0 mm, and the highest for cases with dc = 2.5 mm. For the variant with = 0.25 mm, the smallest conversion was observed for cases with dc = 2.0 mm, and the highest for cases with dc = 3.0 mm. We concluded that, for df = 0.05, 0.10, and 0.15 mm, the main determining factor was the catalyst surface area, which was larger for dc = 2.0 mm. For df = 0.20 and 0.25 mm, the main determining factor was the time of contact of the gas with the catalyst. Therefore, the gas dynamics factors prevailed over geometric factors under certain conditions.
Secondly, we note the non-obvious points that were obtained with the help of modeling. In the studied examples for the selective hydrogenation of acetylene, there were limitations on the size of the fibers df. At a certain value of dc and df, a further increase in the fiber diameter did not lead to an increase in conversion and selectivity, despite an increase in the specific surface area of the catalyst over the entire range of the considered temperature values.
At the same time, a decrease in porosity led to an increase in resistance and additional costs for gas pumping. The estimation of the conversion value’s dependence on the catalyst’s specific surface area was carried out. The best ratio of the conversion value per unit specific area was possessed by cells with a large diameter dc. Thus, in the examples under study for the selective hydrogenation of acetylene, we determined that, among the examples considered, the most effective was the use of cells with a diameter of dc = 3.0 mm, despite the smaller specific surface area of the catalyst compared to cells with a smaller diameter dc.
Note that, in the present study, only one cell model (Kelvin cell) and a small number of variations in the geometric parameters and dynamic parameters of the gas were considered. However, the results obtained determined possible limitations and directions of optimization. The results can help when considering other options for cell models and gas parameters when studying the process of selective hydrogenation of acetylene using open-cell foam.
In this work, the presented results and conclusions refer to a specific process and catalyst geometry. These results may be of interest for the design of new chemical reactors and the optimization of the operation of existing chemical reactors. Significant differences were obtained in the operation of catalysts based on open-cell foam material with different variations of the cell diameter and fiber size. Further research can be directed towards finding the optimal cell and fiber size.


 ,
, 


