Article

Coordination Properties of the Fungal Metabolite Harzianic Acid Toward Toxic Heavy Metals

by
Gaetano De Tommaso
1,
Maria Michela Salvatore
1,
Rosario Nicoletti
2,3,
Marina DellaGreca
1,
Francesco Vinale
4,5,6,
Alessia Staropoli
3,
Francesco Salvatore
1,
Matteo Lorito
3,
Mauro Iuliano
1,* and
Anna Andolfi
1,6,*
1
Department of Chemical Sciences, University of Naples Federico II, 80126 Naples, Italy
2
Council for Agricultural Research and Economics, Research Centre for Olive, Fruit and Citrus Crops, 81100 Caserta, Italy
3
Department of Agricultural Sciences, University of Naples Federico II, 80055 Portici, Italy
4
Department of Veterinary Medicine and Animal Productions, University of Naples Federico II, 80137 Naples, Italy
5
Institute for Sustainable Plant Protection, National Research Council, 80055 Portici, Italy
6
BAT Center—Interuniversity Center for Studies on Bioinspired Agro-Environmental Technology, University of Naples Federico II, 80055 Portici, Italy
*
Authors to whom correspondence should be addressed.
Toxics 2021, 9(2), 19; https://doi.org/10.3390/toxics9020019
Submission received: 30 November 2020 / Revised: 15 January 2021 / Accepted: 18 January 2021 / Published: 20 January 2021

Abstract

:
Some Trichoderma strains are known for their capacity to produce harzianic acid, a metabolite belonging to the tetramic acid derivatives. Harzianic acid has interesting biological properties, such as antimicrobial activities against phytopathogenic fungi and promotion of plant growth. It also possesses remarkable chemical properties, including the chelating properties toward essential transition metals, which might be related to the biological activities. Increasing knowledge on chelating properties might be relevant for understanding the various beneficial effects of harzianic acid in the interaction between the producer fungi and plants. In this work, the coordination capacity of harzianic acid was studied to evaluate the formation and stability of complexes formed with toxic heavy metals (i.e., Cd2+, Co2+, Ni2+, and Pb2+), which might have a crucial role in the tolerance of plants growing in metal-contaminated soils and in abiotic stress.

1. Introduction

Heavy metals are present in different concentrations in many rocks and soils, but the major sources of these elements are anthropogenic activities, including industrial emissions and agricultural treatments [1]. Some heavy metals are essential elements for physiological functions, e.g., iron (Fe), copper (Cu), zinc (Zn), and manganese (Mn), while many of them are commonly considered as toxic elements to plants and humans, e.g., lead (Pb), cobalt (Co), cadmium (Cd), nickel (Ni), chromium (Cr), mercury (Hg) [2]. There is ample literature on the acute and/or chronic toxic effects of these heavy metals for plants and animals [3,4,5]. For instance, in humans, nickel can have an impact on the immune, respiratory, nervous, and reproductive systems [6]; cobalt is mainly responsible for neurological, cardiovascular, and endocrine deficits [7]. Cadmium intoxication can lead to kidney, bone, and pulmonary damages [8]. Finally, lead exposure can cause an increase of oxidative stress, producing various deleterious effects on the hematopoietic, renal, reproductive, and central nervous systems [9].
Rapid industrialization and urbanization have caused environmental contamination and pollution by toxic heavy metals, and their concentrations above threshold levels (which are defined by national guidelines) can have negative effects on the ecological health and fertility of soils due to their bioaccumulation [10]. Bioavailability of heavy metals is mainly affected by their total content in soil and by the presence of microbial and plant species [11]. In this respect, fungi can contribute to increase the tolerance of plants growing in metal-contaminated soils, and the production of metal-chelating compounds has been demonstrated in some fungi, such as Pleurotus ostreatus [12], Beauveria caledonica [13], and Aspergillus niger [14]. In fact, organic acids may affect potentially toxic metals desorption, solubility, and mobility through the formation of complexes [15,16]. The most frequent fungal organic acids involved in the complexation of heavy metals in soils are oxalic, succinic, tartaric, and citric acids, which have the valuable capacity to remove heavy metals without destroying the soil matrix [17,18]. Moreover, several fungal genera (e.g., Saccharomyces, Aspergillus, and Penicillium [19]) produce a wide range of siderophores, which have strong affinity for ferric ion, but despite their preference for iron, they can chelate numerous metals (e.g., aluminum, cadmium, cobalt, silver, copper) with diverse affinity, having an impact on the transport and tolerance of these metal ions [20,21]. Hence, the heavy metals chelation by organic acids may represent an important detoxification mechanism, both by the fungi and plants [22], but it is dependent upon metals, ligands, and environmental conditions [23].
Beneficial microbes belonging to the genus Trichoderma are model organisms to study plant-microbe interactions, and some selected strains are present as active ingredients in bioformulations for agriculture [24,25]. Methods for remediating polluted soils or water, and for removing toxic substances using Trichoderma spp. in plant-microbes systems have been proposed [26]. These microbes are known to control plant pathogens and improve plant growth, also due to the production of a remarkable range of secondary metabolites showing different biological activities [25,26,27,28,29,30,31,32,33].
One of these effector metabolites is harzianic acid, a natural compound with notable biological activities and interesting chemical properties, including affinity to ferric iron, antimicrobial activity (e.g., Staphylococcus pseudintermedius, Pythium irregulare, Sclerotinia sclerotiorum, and Rhizoctonia solani) and promotion of plant growth (e.g., tomato) [34,35,36,37]. It has been recently obtained by total synthesis [38], and classified in the subgroup of the dienoyl tetramic acids [39].
In this work, the capacity of harzianic acid, obtained from cultures of a marine-derived strain of Trichoderma pleuroticola [40], to complex some dipositive toxic heavy metals (i.e., Cd2+, Co2+, Ni2+ and Pb2+), was studied. Several techniques have been used (i.e., mass spectrometry (MS), circular dichroism (CD) spectrometry, nuclear magnetic resonance (NMR), Fourier transform-infrared spectroscopy (FT-IR)) either to demonstrate qualitatively the capacity of harzianic acid to complex the targeted cations or to obtain clues on the coordination mode, although the stoichiometry and formation constants of complex species, in a CH3OH/0.1 M NaClO4 (50:50 w/w) mixed solvent at 25 °C, were ultimately obtained from UV-VIS spectrophotometric data collected in a wide pH and spectral range.

2. Materials and Methods

2.1. Reagents and Their Analysis

Analytical grade products Pb(ClO4)2, Cd(ClO4)2, CoCl2, and NiCl2 Merck (Darmstadt, Germany) were used to prepare stock aqueous solutions of metals whose concentrations were determined by complexometric titration with a standard solution of EDTA. Solutions of perchloric acid were prepared from analytical grade products and standardized potentiometrically (glass electrode) against tris(hydroxymethyl)amino methane (Sigma-Aldrich, Saint Louis, MO, USA). The results agreed to within 0.1% or better. Carbonate-free NaOH and NaClO4 solutions were prepared as previously described [40].
Harzianic acid was isolated as product of Trichoderma pleuroticola L1 recovered from a specimen of the mollusc Melarhaphe neritoides (Gastropoda, Littorinidae) collected along the coastline of the isle of Procida, Bay of Naples, Italy. The isolation and identification of this compound were previously explained in details [40]. Briefly, culture filtrate of T. pleuroticola was exhaustively extracted in acid conditions with ethyl acetate. The residue obtained was dissolved in chloroform and extracted with a saturated solution of NaHCO3. The aqueous phase was acidified and extracted with ethyl acetate to obtain a residue identified as harzianic acid, comparing the NMR data with previous reports [38].

2.2. Preparation of Test Solutions, Potentiometric, UV-VIS, CD, NMR, and IR Measurements

Test Solutions (TS), for CD and UV-VIS spectrometry, were prepared in an air-bath thermostat kept at (25.00 ± 0.05) °C by the procedure described in Section 3.
Potential of cell RE / TS / GE + , which serves to evaluate the pH (=−log[H+]) of Test Solutions for UV-VIS and CD spectrometric measurements, was measured at 25.0 °C with a precision of ±0.01 mV using a Keithley 642 type Digital Electrometer (Tektronix Inc., Beaverton, OR, USA). The pH indicator glass electrodes (GE) were Metrohm (Herisau, Switzerland) of 60102-100 type and an Ag/AgCl(s)/0.1 M NaCl/(0.1 M NaClO4/CH3OH, 50/50 w/w) electrode was utilized as reference (RE).
UV-VIS spectra were recorded by Cary model 5000 Spectrophotometer by Varian C. (Palo Alto, CA, USA), from 200 to 600 nm (optical path 0.2 cm) at 25.0 °C, under a constant flow of nitrogen.
The far UV-CD spectra were recorded with a JASCO CD spectrometer model J-715 (Tokyo, Japan), from 200 to 600 nm (optical path 0.2 cm) at 25.0 ° C, under a constant flow of nitrogen.
NMR spectra were recorded at 400 MHz in CD3OD/D2O 1:1 (w/w) on a Bruker spectrometer (AscendTM400) (Bremen, Germany). The solvent was used as internal standard.
FT-IR spectra were recorded in modality attenuated total reflectance (ATR) with model Nicolet 5700 by Thermo Electric Corporation (Waltham, MA, USA). The measuring cell consisted of a mono crystal of zinc selenide. The blank was recorded using air as reference. The solid compounds, metal-harzianic acid, were prepared by mixing and evaporating equimolar solutions of the individual components.

2.3. HPLC-MS Analyses

HPLC-MS analyses were done with the methods described by [40] on an Agilent high performance liquid chromatograph (HPLC) 1260 Infinity Series (Agilent Technologies, Santa Clara, CA, USA) coupled to a quadrupole-time of flight (Q-TOF) mass spectrometer model G6540B (Agilent Technologies) with a Dual ESI source (Agilent Technologies). Briefly, 500 μL of a 2 mM solution (in water) of each metal (Cd(ClO4)2, CoCl2, NiCl2 and Pb(ClO4)2) were mixed with 500 μL of harzianic acid (solubilized in methanol, 1 mg·mL−1) and directly infused into the LC-MS system (7 μL injection volumes, eluted with 0.1% formic acid in acetonitrile at a flow rate of 0.3 mL·min−1 to the mass spectrometer). The system was operated in positive ion mode and a standard solution of purine and hexakis(1H,1H,3H-tetrafluoropentoxy)-phosphazene was infused to obtain the real-time lock mass correction. All parameters and acquisitions were set using the Agilent MassHunter Data Acquisition Software, rev. B.05.01 (Agilent Technologies).

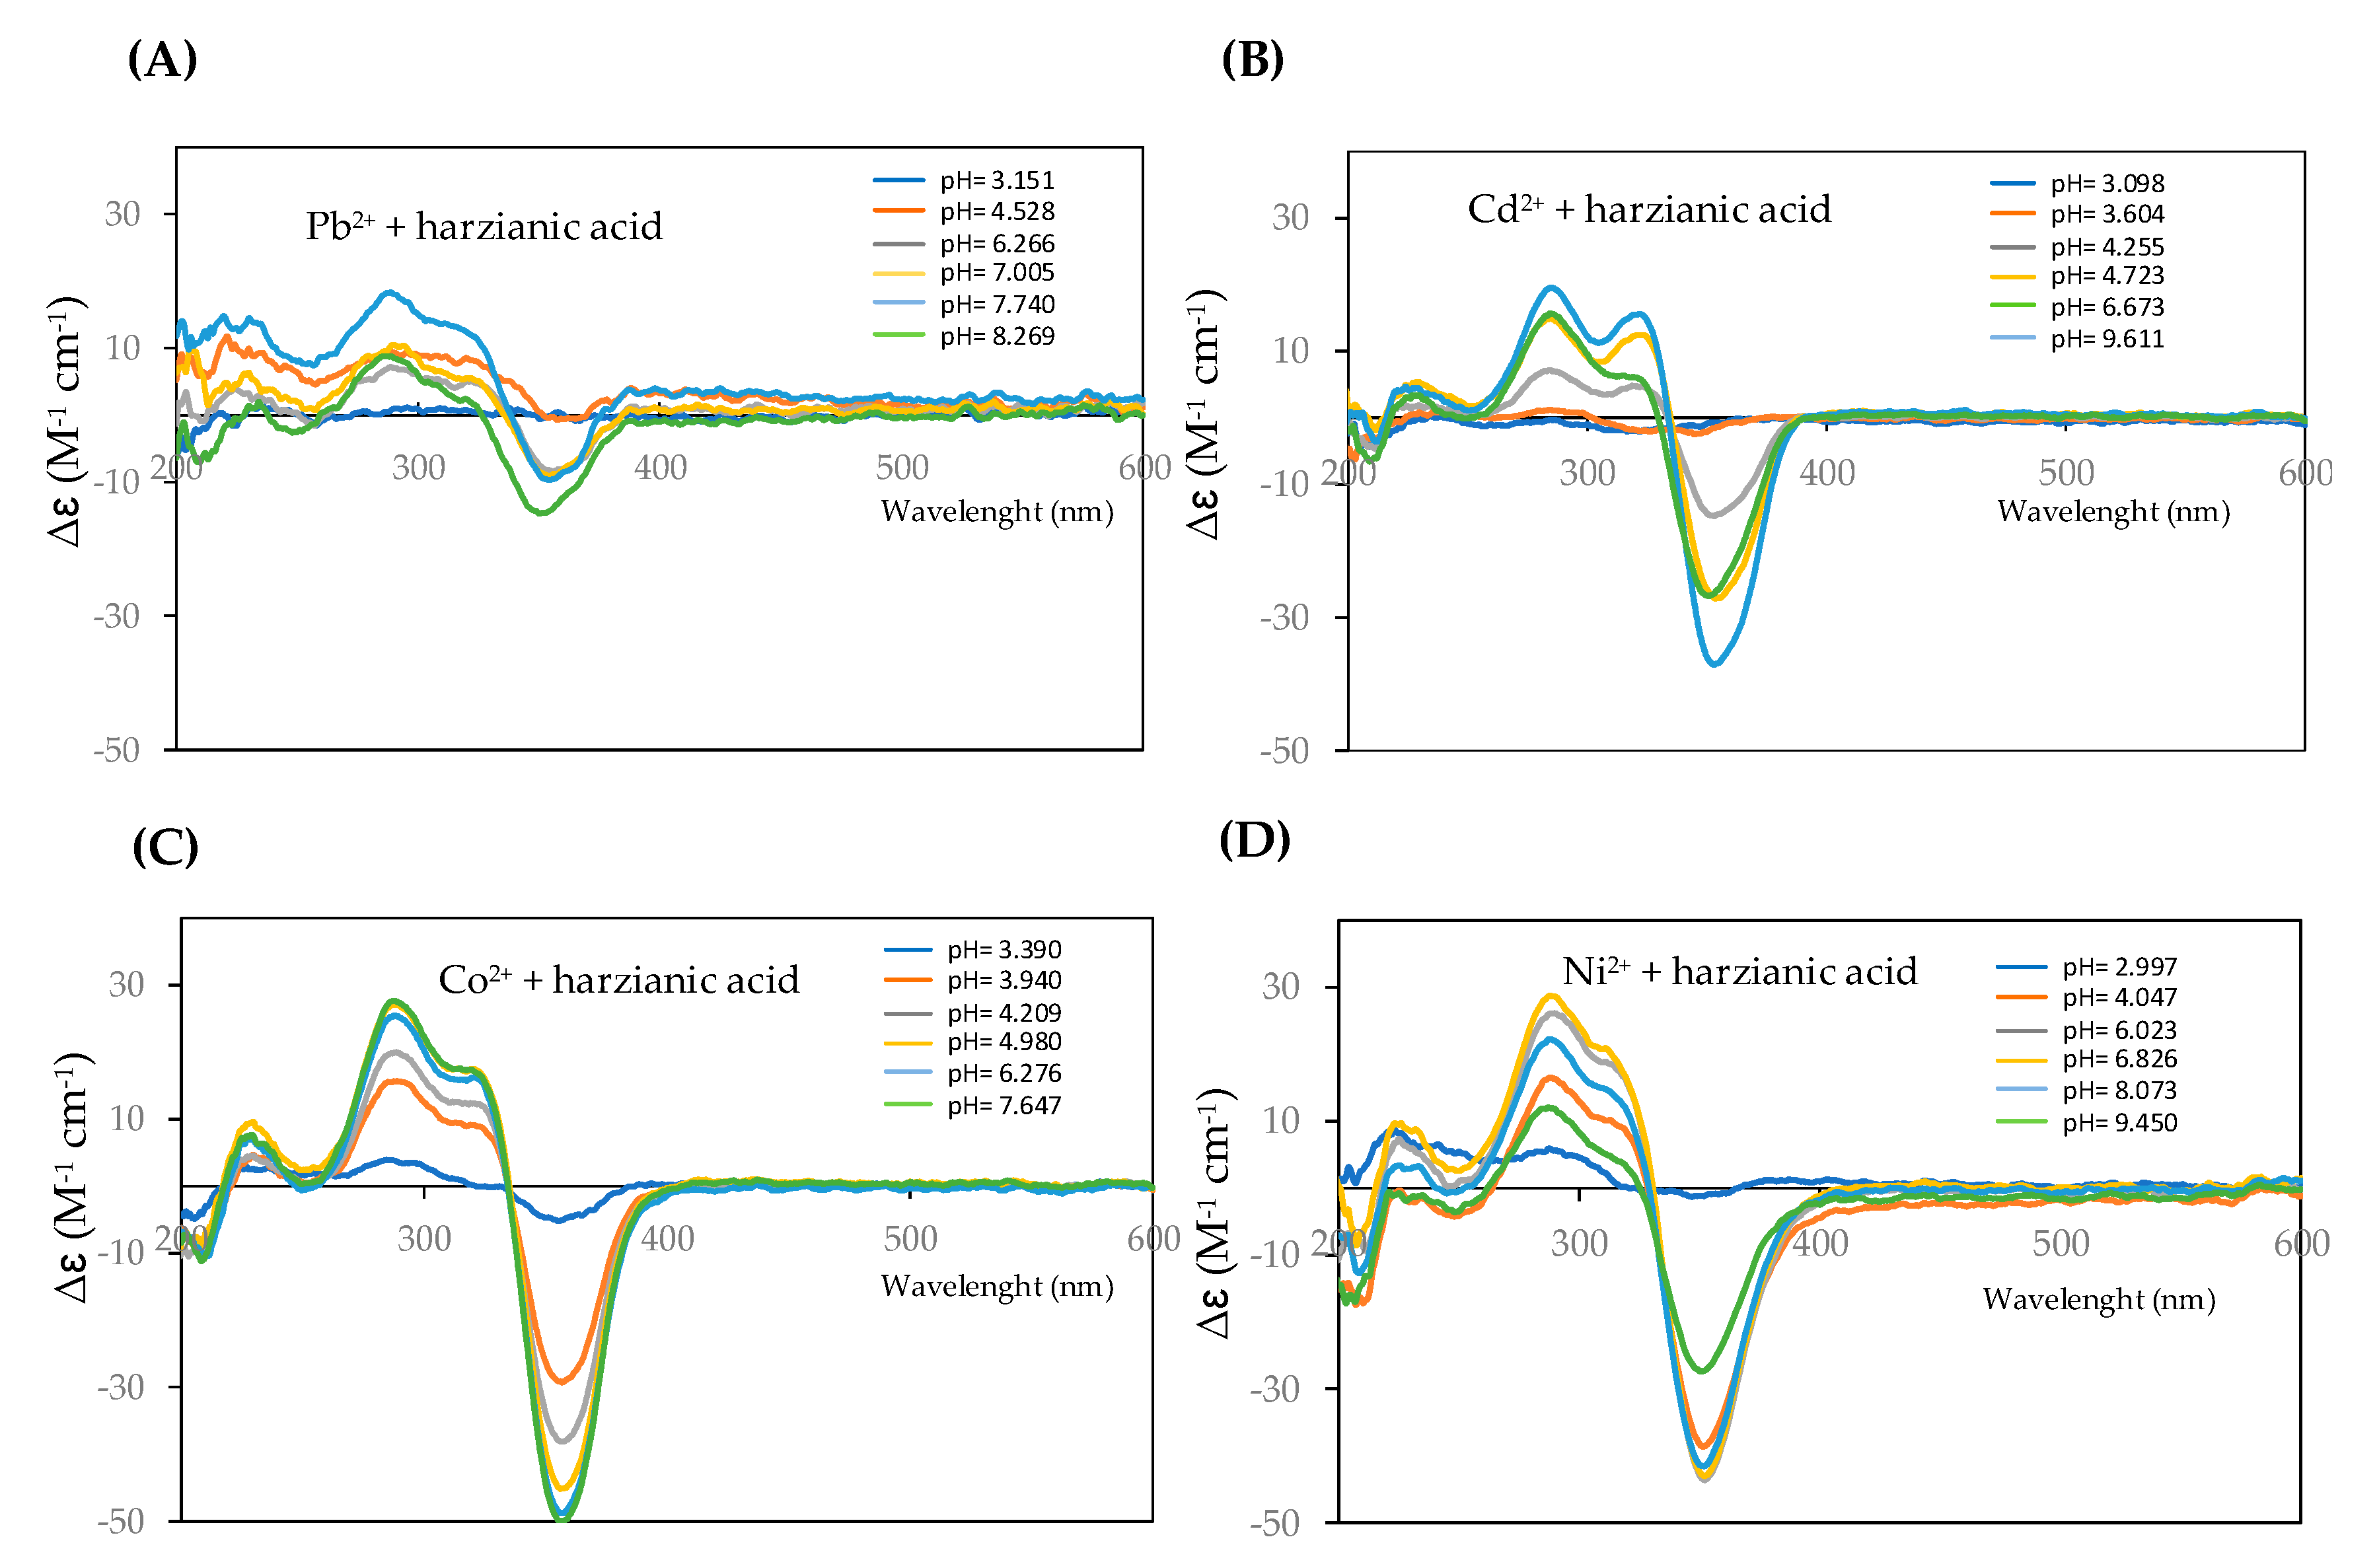
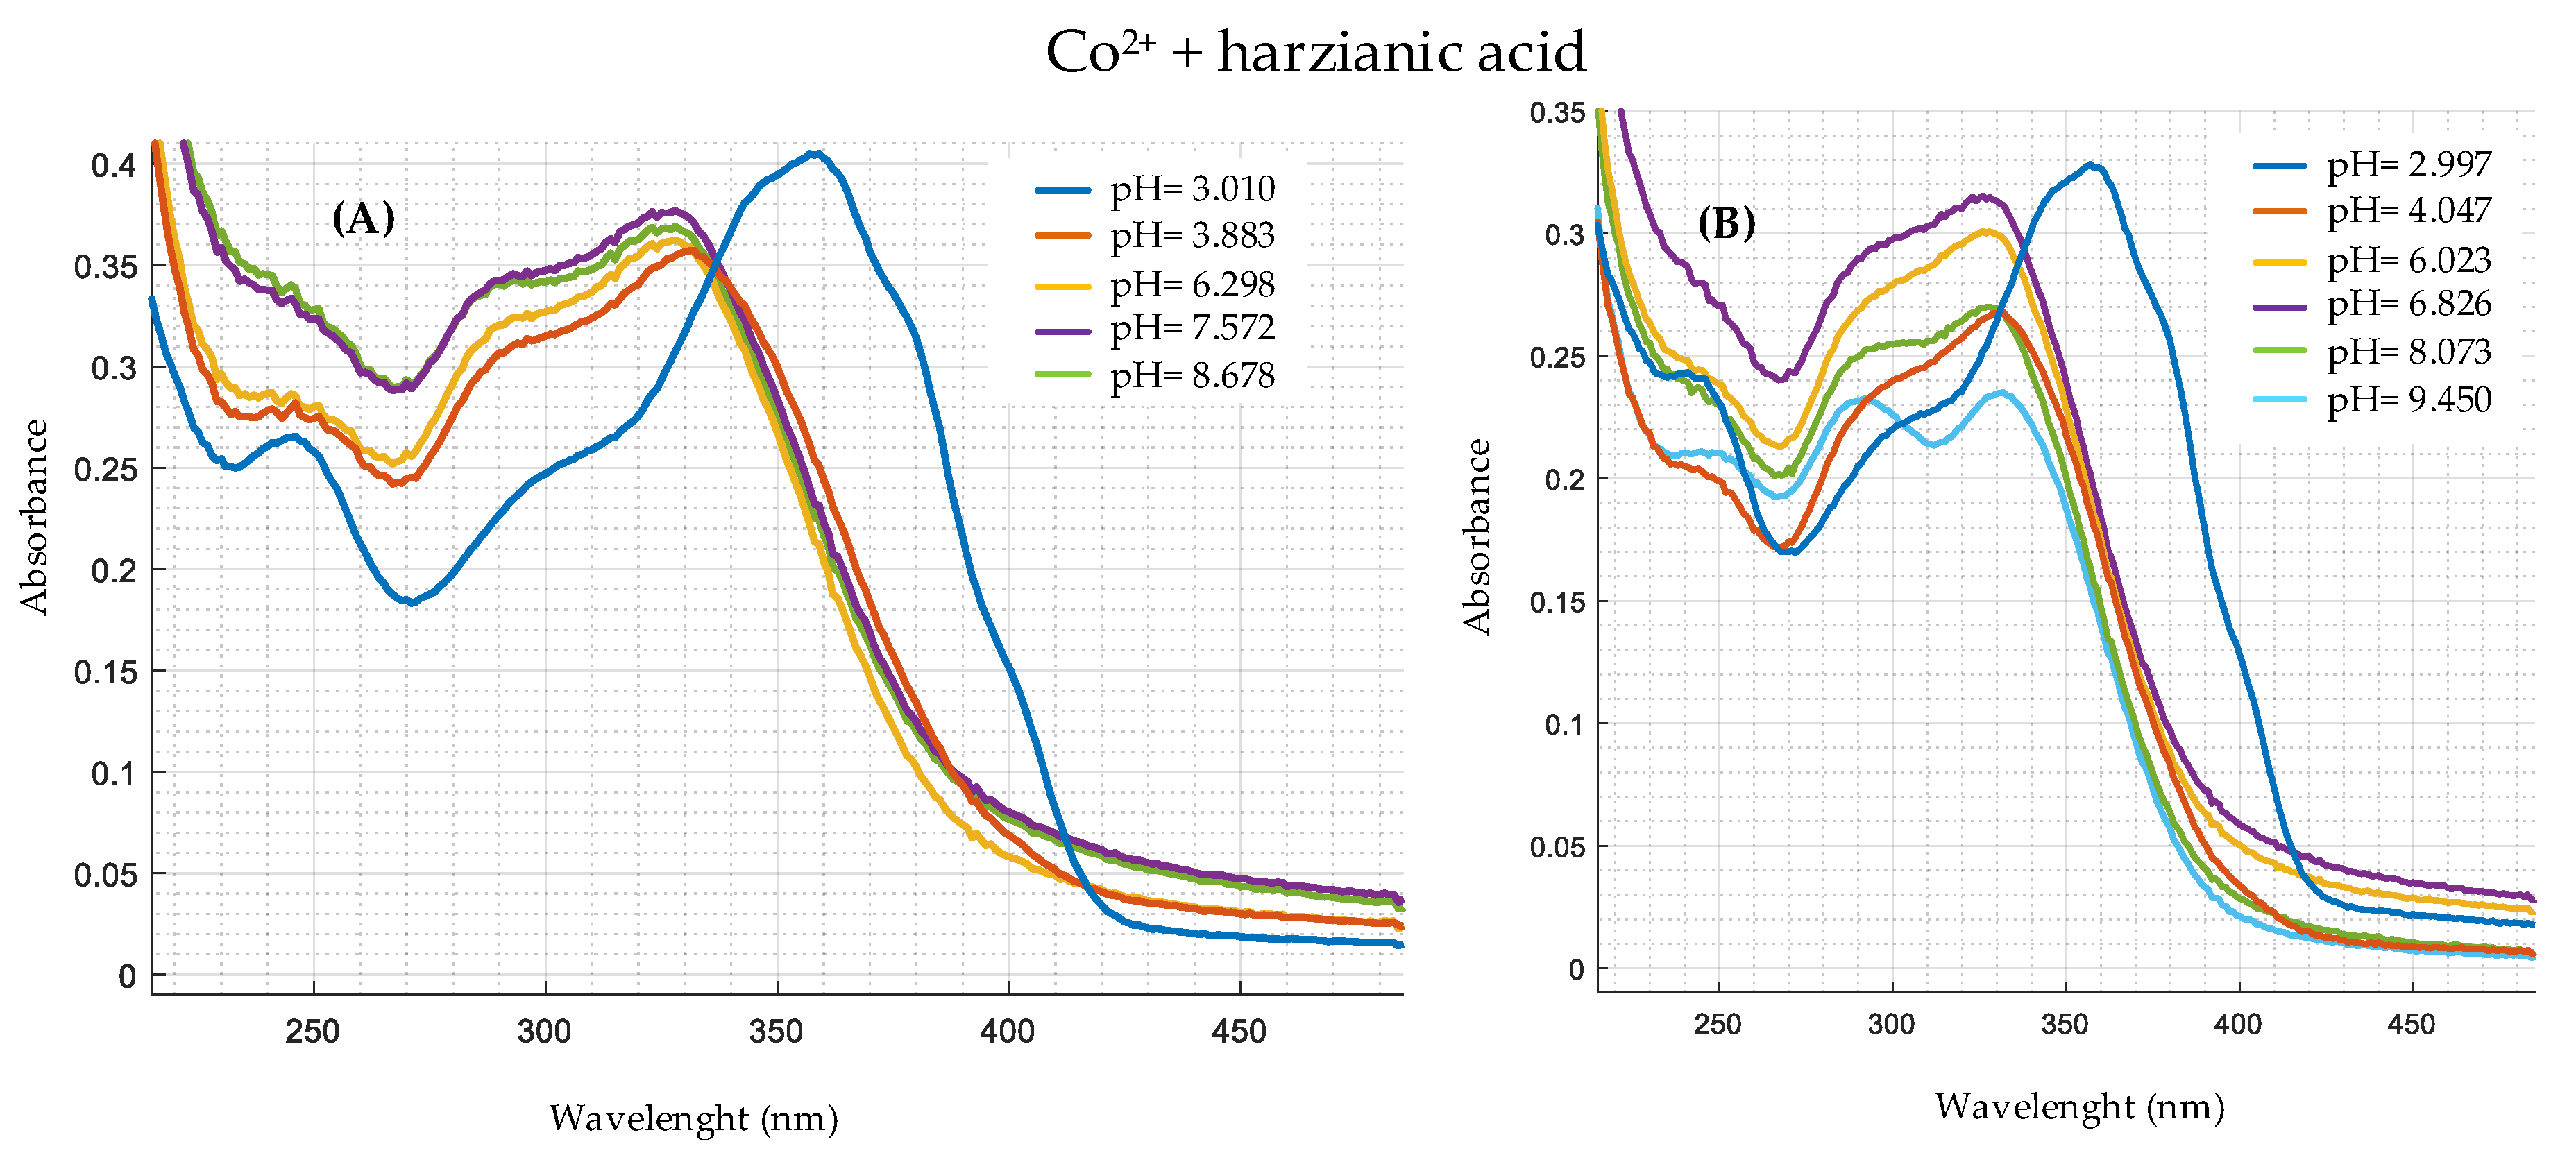
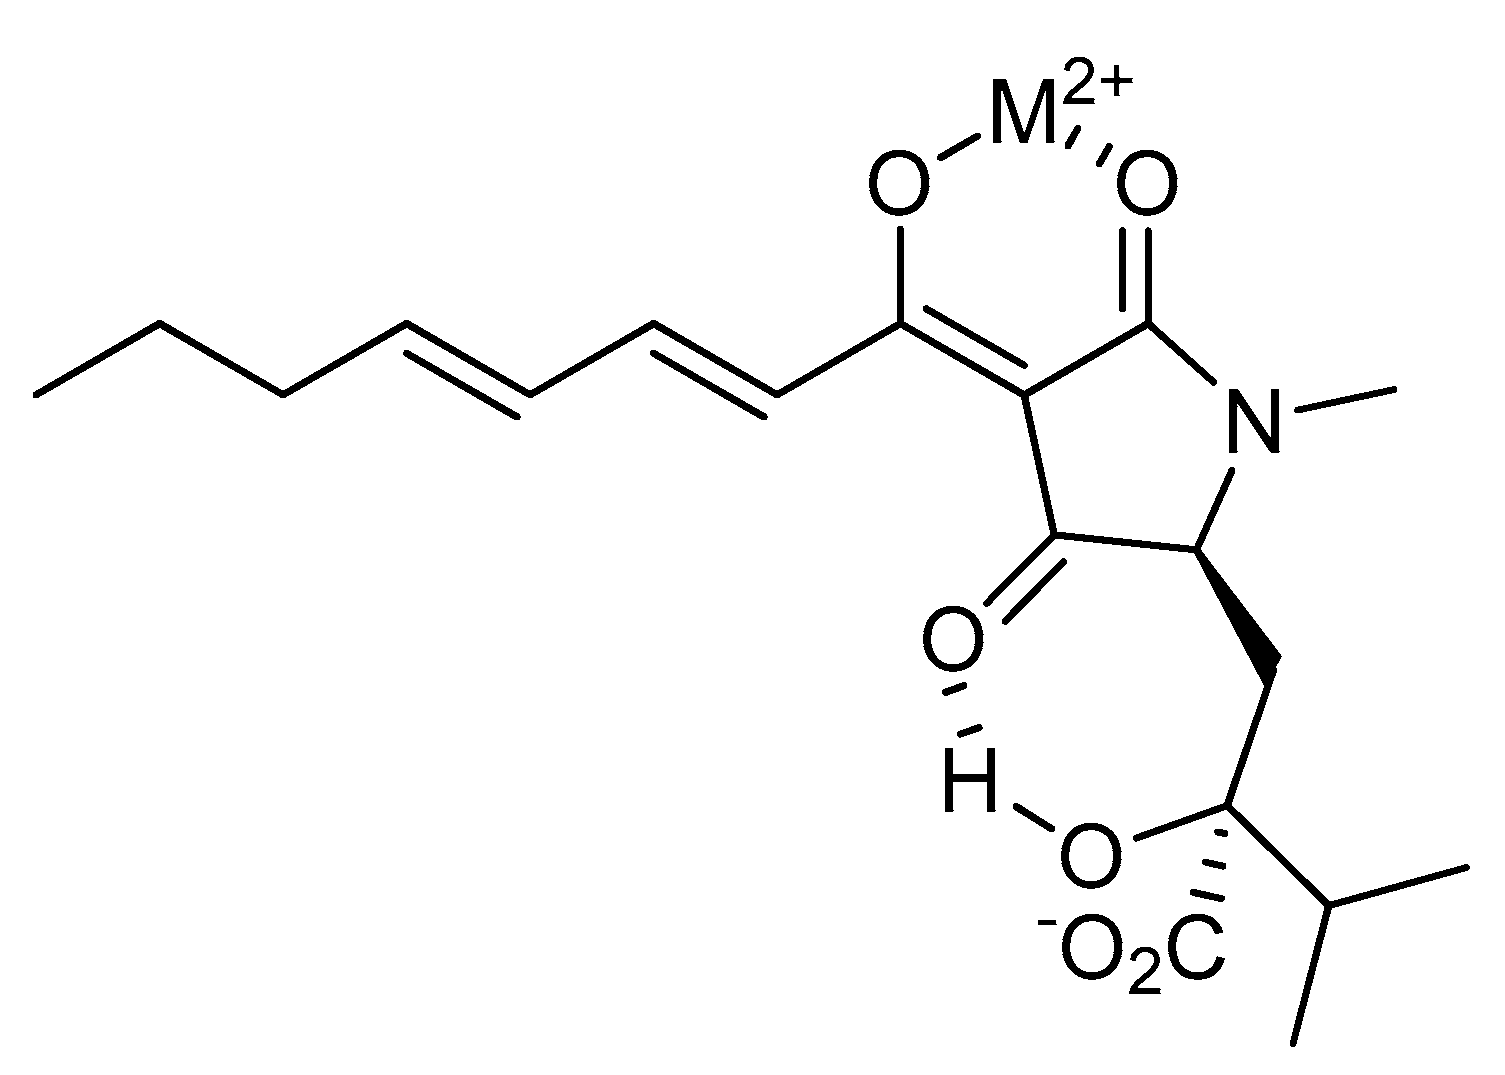
3. Results and Discussion

Since harzianic acid is a diprotic acid, in the following text we use the abbreviation H2L, which represents the fully protonated species. Dissociation of protons by H2L produces in sequence HL and L2−, according to the dissociation constants exposed in Figure 1 [40]. In addition, when appropriate, the symbol M2+ will be used to generically represent the dipositive metal cations investigated in this study, i.e., Cd2+, Co2+, Ni2+, and Pb2+.
A rather unconventional approach has been used in this study to investigate the capacity of harzianic acid to complex bivalent heavy metal cations, M2+. In fact, in order to obtain clues on the formation and stoichiometry of complexes eventually present in solutions of the metal cations and harzianic acid, we first collected LC-ESI-HRMS of solutions of harzianic acid in the presence, respectively, of Cd2+, Co2+, Ni2+, and Pb2+.
To this aim, solutions of each M2+ cation and harzianic acid were prepared by mixing 500 μL of 2 mM solution of each metal cation in water (prepared by dissolving Cd(ClO4)2, CoCl2, NiCl2, and Pb(ClO4)2, respectively) with 500 μL of 1 mg·mL−1 harzianic acid in methanol. Finally, 7 μL of each solution were directly infused into the LC-MS system operated in the positive ion mode.
The most abundant ions in MS of each solution (Figures S1–S4) are reported in Table 1. From Table 1, it can be seen that, in the collected MS, a well-developed MS peak can be detected whose accurate mass corresponds to the composition [H3L2 + Metal]+. Furthermore, in the case of Pb2+, a complex ion of composition [HL + Pb]+ was also detected.
Based on our experience, MS data in Table 1 represent a conspicuous indication that complex species of the same or different stoichiometry may exist in solution.
In order to provide evidence for complex formation taking place in solution between targeted M2+ cations and harzianic acid, and to eventually ascertain their stoichiometry and evaluate their formation constants, circular dichroism (CD) and UV-VIS spectra of solutions of the M2+ cations and harzianic acid were acquired in a wide pH and spectral range.
Because of the low solubility of harzianic acid in water, CH3OH/0.1 M NaClO4 (50:50 w/w) was employed as solvent. The constant concentration of NaClO4 in the solvent is high enough, with respect to the reagent concentrations employed in this study, to provide a constant ionic strength in all of the investigated solutions. So much so that activity coefficients of reagents and products of complex formation reactions can be considered constant, and equilibrium constants can be expressed using concentrations in place of activities. In this context, the standard symbol pH merely indicates the molar concentration of solvated protons into the tested solutions (i.e., briefly, pH = −log[H+]).
Preparation of test solutions (TS), of accurately known pH and analytical composition, of each metal cation and harzianic acid, was performed at 25.0 °C, in a potentiometric multi-neck titration cell equipped with an Ag/AgCl(s)/0.1 M NaCl/(0.1 M NaClO4-CH3OH, 50/50 w/w) double junction reference electrode (RE) and a pH indicator glass electrode (GE) (Scheme 1).
Because of the large concentration of NaClO4 in the salt bridge of the double junction reference electrode and in the test solution, TS, the potential of cell (G) can be expressed, at 25 °C, by the simple Equation (1), in which E G 0 (volt) is a constant that was determined before each experiment by ad hoc potentiometric measurements.
E G   =   E G 0   +   0.05916 · log [ H + ]
In fact, in order to assess the value of E G 0 , each experiment started with a measured volume of pure solvent (i.e., CH3OH/0.1 M NaClO4 (50:50 w/w)) in the titration vessel. The potential, EG (volt) of cell (G) was measured after stepwise addition of measured volumes of a standard solution of HClO4 in the same solvent, and the collected data were employed to evaluate   E G 0 . After this initial glass electrode calibration procedure, pH (= −log[H+]) of any test solution in the potentiometric vessel can be evaluated from the measured potential, EG (volt) of cell (G), at 25.0 °C, using the simple Equation (2):
pH = log [ H + ] =   E G 0 E G 0.05916
Subsequently, to the acidic solution in the titration vessel of cell (G), measured volumes of stock solutions of the metal cation and of harzianic acid were added so that the solution in the potentiometric vessel assumed the general composition specified by the analytical array (3).
{ C H 2 L 0   M   H 2 L +   C M 0   M   M ( ClO 4 ) 2 +   C H 0   M   HClO 4 }
Then, the resulting solution (whose pH was accurately known), was sampled by withdrawing an accurately measured volume, which was transferred to the spectrometer cuvette (0.2 cm optical path) and processed at 25 °C.
After this, the pH of the solution in the titration vessel of cell (G) was systematically modified by successive additions of small volumes of a standard solution of NaOH, in the solvent CH3OH/0.1 M NaClO4, so that it assumed the general analytical composition specified by the analytical array (4), which could be accurately calculated from the preparation data.
{ C H 2 L   M   H 2 L +   C M   M   M ( ClO 4 ) 2 +   C H   M   HClO 4 +   C NaOH   M   NaOH   }
After each addition of NaOH, samples of the solution, whose pH could be obtained from Equation (2), were withdrawn from the titration vessel, transferred to the spectrometer cuvette and processed at 25 °C.
Obviously, all of the successive solutions prepared by this procedure share the same ligand to metal ratio, which keeps equal to the initial ratio C H 2 L 0 / C M 0 , while the metal cation and harzianic acid concentrations, C H 2 L and CM, respectively, in the withdrawn samples, decrease as their pH increases.
The acquired CD spectra are exposed in Figure 2.
Inspection of CD spectra shows the presence of two peaks whose intensity increases by increasing pH. One positive peak at 285 nm (Cotton effect) is attributed to transitions involving the diene system orbitals, and the second negative peak at 350 nm is associated to transitions that involve the non-bonding electrons of oxygen in C4’ position of harzianic acid [40].
Qualitatively, similar effects are also observed in solutions of only harzianic acid, but the dependence of CD spectra on the specific metal cation undoubtedly points toward specific interactions between M2+ cations and the ligand.
Next, UV-VIS spectrophotometric data, used for the evaluation of the stoichiometry of complexes and of their formation constants, were collected.
For each metal, two spectrophotometric datasets were acquired, by fine-tuning the initial addition of the harzianic acid and metal cation stock solutions, to the acidified solvent in cell (G), so that C H 2 L 0 = 2.0 × 10⁻⁴ M and C M 0 = 2.0 × 10⁻⁴ M (i.e., 1:1 ligand to metal ratio) or C H 2 L 0 = 2.0 × 10⁻⁴ M and C M 0 = 4.0 × 10⁻⁴ (i.e., 1:2 ligand to metal ratio).
The full set of spectrophotometric data collected is shown in Figure 3 (M2+ = Cd2+), Figure 4 (M2+ = Co2+), Figure 5 (M2+ = Ni2+) and Figure 6 (M2+ = Pb2+), and represents the basis of successive evaluations.
By inspecting the UV-VIS spectra reported above, it is clear that complex species are formed in the M2+/harzianic acid solutions. This can be deduced from the fact that UV-VIS spectra not only are substantially different at different pH, but they considerably depend on the ligand to metal ratio and, even more, from the nature of the M2+ cation present in the solution [41].
Finally, in order to evaluate the stoichiometry and formation constants of complex species responsible for the observed trend of UV-VIS spectra as a function of pH, and of the ligand to metal ratio, the collected spectrophotometric data, for each metal cation, were processed by the Hyperquad program [42].
This well-known program for the interpretation of equilibrium data fits the experimental data by systematically modifying the equilibrium constants of an assumed set of species to minimize the sum of squared weighted residuals (U).
In Equation (5), AiK is the absorbance measured at the k-th wavelength for the i-th solution, (AiK)c represents the absorbance calculated for a fixed set of equilibrium constants, and wk are the weights assigned to each measurement. In the present work, we have assumed w k   =   1 .
U   =   Σ i Σ k w k ( A ik ( A ik ) c ) 2
The acid dissociation constants of harzianic acid, which were determined separately and are reported in Figure 1, and the value K w =   10 14.5 , for the ionic product of water [43], were separately introduced in the model and kept constant throughout.
Obviously, in whatever solution containing a metal cation and water, side reactions of hydroxo complexes formation may take place and their effect on the experimental data must be considered.
Providentially, the hydrolysis of the M2+ cations investigated in this study, in water and in a number of mixed solvents, is well known [44,45,46]. All four hydrated M2+ ions of interest here are weak acids, which dissociate producing a number of mononuclear hydroxo complexes, M ( OH ) n 2 n (n from 1 to 3 for Pb2+; n from 1 to 4 for Cd2+, Co2+, Ni2+) and a few polynuclear species, M m ( OH ) n 2 m n whose stoichiometry may depend on the nature of the M2+ cation. This state of affair, when observed on a wide pH range, gives rise to a rather complex equilibrium scenario.
For instance, Figure 7 represents what would happen when an aqueous solution, containing 10−4 M Pb2+, is submitted to a virtual pH scan.
Even a superficial inspection of Figure 7 shows that, at the concentration of metal considered, polynuclear species account only for a small fraction of lead in the solution, so that most of the effect of the side reactions of the hydroxo complexes formation could be accounted for by introducing, in the model, only the conventional Pb ( OH ) n 2 n species. However, above pH~8 significant concentrations of Pb 3 ( OH ) 4 2 + are produced. Finally, we hypothesize that, in the mixed (0.1 M NaClO4/CH3OH, 50/50 w/w) solvent used in this study, the situation is not much different from that described in Figure 7. On this basis, we introduced in the model used to fit the spectrophotometric data for lead the hydrolysis species PbOH + , Pb ( OH ) 2 , Pb ( OH ) 3 , and Pb 3 ( OH ) 4 2 + , whose formation constants were refined by Hyperquad during the process of minimization of the sum of squared residuals (5) (starting from their values at zero ionic strength taken from reference [46]).
From the point of view of the formation of hydroxo complexes, Pb2+ represents the most severe case, since Cd2+, Co2+, Ni2+ are weaker acids, and only the mononuclear M ( OH ) n 2 n complexes have been considered (since no species M 3 ( OH ) 4 2 + is described and the M 2 OH + and M 4 ( OH ) 4 4 + polynuclear complexes are clearly irrelevant at the metal concentrations investigated in this study).
Results of Hyperquad processing of spectrophotometric data in Figure 3, Figure 4, Figure 5 and Figure 6 are summarized in Table 2.
Obviously, in order to calculate ( A ik ) c in Equation (5), besides refining values of the formation constant for each assumed species, in the process of minimizing the sum of squared residuals, U , Hyperquad also assigns and refines, for each species, a value of the molar extinction coefficient, ε λ (M−1cm−1) at each measured wavelength. By consequence, as a result of data processing by Hyperquad, the ε λ finally assigned to the complex species are obtained.
For instance, the molar extinction coefficients calculated by Hyperquad for all absorbing species in solutions of Co2+/harzianic acid and Ni2+/harzianic acid are presented in Figure 8.
From Figure 8, it can be seen that the bis-complex M(HL)L is a very efficient UV absorber, which presumably is responsible for most of the spectral variations in the recorded spectra in Figure 3, Figure 4, Figure 5 and Figure 6.
From data in Table 2, distribution diagrams, showing the fraction of the total metal concentration present in the form of each species, as a function of pH, can easily be drawn for whatever assumed concentration of the metal cation and harzianic acid.
For instance, distribution diagrams for M2+ = Cd2+ and M2+ = Co2+ are presented in Figure 9 and Figure 10, respectively, from which it can be seen that the bis-complex M(HL)L is, under the conditions assumed to draw the diagrams, the prevailing species at pH around 6 which is close to the pH of natural ecosystems. However, at the highest pH investigated, M(HL)L is converted to the 1:1 ML complex, which is the prevailing species at the highest pH investigated. Ni2+ represents an exception to this general pattern, since the NiL complex is not formed in the pH range investigated.
Because of differences in stoichiometry of complexes (and, hence, in dimensions of formation constants) and in solvents employed, a direct comparison between the formation constants of M2+ complexes with harzianic exposed above and reported apparent affinity constants for other natural chelators is not generally possible or, at best, very uncertain. However, to characterize the efficiency of a ligand, it has been suggested the use of a parameter termed “pM” [47]. Here, we intend pM to represent the minus logarithm (anti-logarithm) of the concentration of the free (solvated) metal cation (i.e., briefly, pM = −log [M2+]) in a reference solution of pH = 7.4 containing 1 mM of the ligand and 1 μM total metal concentration. By consequence, a larger pM value corresponds to a lower concentration of the free metal ion in solution at equilibrium and, in principle, to a higher affinity of the relevant ligand for the M2+ cation.
For instance, from the above reported formation constants we calculate: pPb = 8.5, pCd = 7.2, pCo = 9.7, pNi = 9.6 when the ligand is harzianic acid. For comparison, pPb = 18.1 is obtained, when the ligand is EDTA in water at zero ionic strength.
Obviously, although in the reference solution, less than 1% of the total metal in solution is found non-bonded to harzianic acid (except for cadmium, for which the metal fraction non-bonded to harzianic acid is about 7%), harzianic acid is a much less efficient chelator than EDTA toward the investigated dipositive metal cations.
This is not unexpected, since based on its structure and previous reports, harzianic acid may, at best, be a bidentate chelator toward M2+ cations, as are many synthetic products and naturally occurring molecules exposing the 3-acetyl-pyrrolidine-2,4-dione heterocycle. Generally, it is assumed that chelation takes place by the formation of a six membered ring, which includes the metal cation, the amide carbonyl and hydroxyl group on C1. In the case of harzianic acid, this would correspond to the sketch in Scheme 2:
In order to further explore the mode harzianic acid coordinates to M2+ cations, 1H NMR spectra of harzianic acid in presence of Cd2+ and Pb2+ were acquired (Figure S5).
In 1H NMR spectra particularly interesting are the changes in proton chemical shifts of the hexadienoyl residue and of the pyrrolidine ring in presence and absence of the metal cations.
1H NMR spectrum of harzianic acid recorded in presence of CdCl2 in CD3OD/D2O (1:1 w/w) showed up-field shifts for H3 (Δδ 0.06) resonating as multiplet at δ 7.52, H4/5 (Δδ 0.05) resonating at δ 7.40 as multiplet, and H5′(Δδ 0.06) resonating as doublet at δ 3.78 (d, J = 9.8 Hz). In the same spectrum, a downfield shift was observed for H2 (Δδ 0.15) resonating as doublet at δ 7.22 (d, J = 16.8 Hz). A similar behavior can be seen in the 1H NMR spectrum of harzianic acid recorded in presence of Pb2+ ion (Figure S5).
The observed differences on the chemical shifts, obtained by comparison between NMR data of harzianic acid and its metal complexes, confirm the involvement in the coordination complexes of the C = O group of the amide and the external carbonyl groups of the ligand. The 2-carboxy-2-hydroxy-3-methylbutyl group in C5′ seems not to be involved in the coordination because there are no significant differences in the chemical shifts of its protons, and may also be due to the formation of hydrogen bond between the hydroxyl group in C7′ and the carbonyl group in C4′ [48] (Scheme 2). This is in accordance with what was previously reported for tetramic acids, such as tenuazonic acid and analogues [49]. This hypothesis could be also confirmed by the solid-state FT-IR data concerning the complexation between the toxic metals and harzianic acid. In fact, by analysis of the spectra (Figures S6–S10), it is evident a shift of the frequency of the stretching band of the CO and of the C = C towards lower wavenumbers compared to the free ligand, as reported in similar compounds [50].
Our findings show that harzianic acid forms stable chelating complexes with a range of metal ions. Natural ligands containing hydroxyl, carboxylic, and carbonyl groups are structurally suitable to form coordination complexes. In fact, studies conducted on kojic acid [51] and dehydroacetic acid [52] show the formation of complex species with high stability in mixed solvents.
Despite the considerable interest in relation to numerous potential use and applications of chelating compounds, including decontamination of soils, few studies evaluate chelating properties of fungal compounds to find promising candidates for practical applications in biotechnologies. In fact, the contamination of soils with heavy metals represents a challenge because many synthetic chelating agents destroy the soil matrix and remove nutrients. On the contrary, natural compounds might have the capacity to remove heavy metals without deteriorating the soil properties [17]. Furthermore, the possible interest of natural chelating compounds is not exclusively related to the agriculture field, but also in many sections of medicine and biology [21,53].

4. Conclusions

In this study, the investigations conducted on the chelating properties of harzianic acid toward some toxic heavy metals show the capacity of this fungal metabolite to form stable neutral or negatively charged coordination complexes in metal/harzianic acid ratio 1:1 or 1:2 depending on the pH conditions. In fact, as can be seen from the distribution diagrams (e.g., Figure 9 and Figure 10), although both species are present, the neutral or charged coordination complexes predominate at different pH ranges.
It seems likely that the biological activities of harzianic acid are related to its complexing ability. In particular, the capacity to form complexes with toxic heavy metals might be important for the decontamination of soils with high heavy metal contents.

Supplementary Materials

The following are available online at https://www.mdpi.com/2305-6304/9/2/19/s1, Figure S1: Mass spectrum ESIMS QTOF obtained by LC-MS analysis in ESI positive mode of a solution 1.0 × 10⁻³ M of harzianic acid and 1.0 × 10⁻³ M of Cd(ClO4)2 in MeOH/H2O 50:50 (w/w), Figure S2: Mass spectrum ESIMS QTOF obtained by LC-MS analysis in ESI positive mode of a solution 1.0 × 10⁻³ M of harzianic acid and 1.0 × 10⁻³ M of CoCl2 in MeOH/H2O 50:50 (w/w), Figure S3: Mass spectrum ESIMS QTOF obtained by LC-MS analysis in ESI positive mode of a solution 1.0 × 10⁻³ M of harzianic acid and 1.0 × 10⁻³ M of NiCl2 in MeOH/H2O 50:50 (w/w), Figure S4. Mass spectrum ESIMS QTOF obtained by LC-MS analysis in ESI positive mode of a solution 1.0 × 10⁻³ M of harzianic acid and 1.0 × 10⁻³ M of Pb(ClO4)2 in MeOH/H2O 50:50 (w/w), Figure S5. 1H NMR spectra of harzianic acid (HA) (down), Cd(ClO4)2: HA (middle) and Pb(ClO4)2: HA (up) recorded in CD3OD/D2O (50:50 w/w) at 400 MHz. Solvent peaks are removed, Figure S6. Solid-state FT-IR spectrum of harzianic acid, Figure S7. Solid-state FT-IR spectrum of Cd (II)/harzianic acid complex, Figure S8. Solid-state FT-IR spectrum of Co (II)/harzianic acid complex, Figure S9. Solid-state FT-IR spectrum of Ni (II)/harzianic acid complex, Figure S10. Solid-state FT-IR spectrum of Pb (II)/harzianic acid complex.

Author Contributions

Conceptualization, F.V., M.I. and A.A.; methodology, G.D.T., M.D., F.V., M.I., A.A.; investigation, G.D.T., M.M.S., A.S., R.N. and A.A.; data curation, G.D.T., M.M.S., M.D., M.L., F.S., M.I. and A.A.; writing—original draft preparation, G.D.T., M.M.S.; writing—review and editing, R.N., M.D., F.V., F.S., M.I. and A.A.; supervision M.I. and A.A.; project administration, F.V., M.I., and A.A.; funding acquisition, F.V., M.L. and A.A. All authors have read and agreed to the published version of the manuscript.

Funding

F.V., M.L., and A.S.: MIURPON (Grant number Linfa 03PE_00026_1; grant number Marea 03PE_00106); POR FESR CAMPANIA 2014/2020-O.S. 1.1 (grant number Bioagro 559); MISE CRESO (Grant number Protection n. F/050421/01-03/X32); PSR Veneto 16.1.1 (grant number Divine n. 3589659); PSR Campania 2014/2020 Misura 16—Tipologia di intervento 16.1—Azione 2 ‘Sostegno ai Progetti Operativi di Innovazione (POI)’—Progetto ‘DI.O.N.I.S.O.’, C.U.P. B98H19005010009.

Data Availability Statement

All the data are reported in the manuscript in the Supporting Materials.

Conflicts of Interest

The authors declare no conflict of interest.

References

  1. Ali, H.; Khan, E.; Ilahi, I. Environmental chemistry and ecotoxicology of hazardous heavy metals: Environmental persistence, toxicity, and bioaccumulation. J. Chem. 2019. [Google Scholar] [CrossRef] [Green Version]
  2. Singh, J.; Kalamdhad, A.S. Effects of heavy metals on soil, plants, human health and aquatic life making bricks using variety of solid waste view project anaerobic digestion. Int. J. Res. Chem. Environ. 2011, 1, 15–21. [Google Scholar]
  3. Jaishankar, M.; Tseten, T.; Anbalagan, N.; Mathew, B.B.; Beeregowda, K.N. Toxicity, mechanism and health effects of some heavy metals. Interdiscip. Toxicology 2014, 7, 60–72. [Google Scholar]
  4. Nagajyoti, P.C.; Lee, K.D.; Sreekanth, T.V.M. Heavy metals, occurrence and toxicity for plants: A review. Environ. Chem. Lett. 2010, 8, 199–216. [Google Scholar] [CrossRef]
  5. Pandey, G.; Madhuri, S. Heavy metals causing toxicity in humans, animals and environment. Res. J. Anim. Vet. Fish. Sci. 2014, 2, 17–23. [Google Scholar]
  6. Das, K.K.; Reddy, R.C.; Bagoji, I.B.; Das, S.; Bagali, S.; Mullur, L.; Khodnapur, J.P.; Biradar, M.S. Primary concept of nickel toxicity—An overview. J. Basic Clin. Physiol. Pharmacol. 2019, 30, 141–152. [Google Scholar] [CrossRef] [Green Version]
  7. Leyssens, L.; Vinck, B.; Van Der Straeten, C.; Wuyts, F.; Maes, L. Cobalt toxicity in humans—A review of the potential sources and systemic health effects. Toxicology 2017, 387, 43–56. [Google Scholar] [CrossRef]
  8. Godt, J.; Scheidig, F.; Grosse-Siestrup, C.; Esche, V.; Brandenburg, P.; Reich, A.; Groneberg, D.A. The toxicity of cadmium and resulting hazards for human health. J. Occup. Med. Toxicol. 2006, 1, 1–6. [Google Scholar] [CrossRef] [Green Version]
  9. Flora, G.; Gupta, D.; Tiwari, A. Toxicity of lead: A review with recent updates. Interdiscip. Toxicology 2012, 5, 47–58. [Google Scholar]
  10. Tóth, G.; Hermann, T.; Da Silva, M.R.; Montanarella, L. Heavy metals in agricultural soils of the European Union with implications for food safety. Environ. Int. 2016, 88, 299–309. [Google Scholar] [CrossRef]
  11. Zhang, G.P.; Yao, H.G.; Wu, W.; Xu, M. Genotypic and environmental variation in cadmium, chromium, arsenic, nickel, and lead concentrations in rice grains. J. Zhejiang Univ. Sci. B. 2006, 7, 565–571. [Google Scholar] [CrossRef] [PubMed] [Green Version]
  12. Wang, Y.; Yi, B.; Sun, X.; Yu, L.; Wu, L.; Liu, W.; Wang, D.; Li, Y.; Jia, R.; Yu, H.; et al. Removal and tolerance mechanism of Pb by a filamentous fungus: A case study. Chemosphere 2019, 225, 200–208. [Google Scholar] [CrossRef] [PubMed]
  13. Fomina, M.; Hillier, S.; Charnock, J.M.; Melville, K.; Alexander, I.J.; Gadd, G.M. Role of oxalic acid overexcretion in transformations of toxic metal minerals by Beauveria caledonica. Appl. Environ. Microbiol. 2005, 71, 371–381. [Google Scholar] [CrossRef] [PubMed] [Green Version]
  14. Arwidsson, Z.; Johansson, E.; Von Kronhelm, T.; Allard, B.; Van Hees, P. Remediation of metal contaminated soil by organic metabolites from fungi i-production of organic acids. Water Air Soil Pollut. 2010, 205, 215–226. [Google Scholar] [CrossRef]
  15. Machuca, A.; Pereira, G.; Aguiar, A.; Milagres, A.M.F. Metal-chelating compounds produced by ectomycorrhizal fungi collected from pine plantations. Lett. Appl. Microbiol. 2007, 44, 7–12. [Google Scholar] [CrossRef]
  16. Renella, G.; Landi, L.; Nannipieri, P. Degradation of low molecular weight organic acids complexed with heavy metals in soil. Geoderma 2004, 122, 311–315. [Google Scholar] [CrossRef]
  17. Ousmanova, D.; Parker, W. Fungal generation of organic acids for removal of lead from contaminated soil. Water Air Soil Pollut. 2007, 179, 365–380. [Google Scholar] [CrossRef]
  18. Salvatore, M.M.; Nicoletti, R.; Salvatore, F.; Naviglio, D.; Andolfi, A. GC–MS approaches for the screening of metabolites produced by marine-derived Aspergillus. Mar. Chem. 2018, 206, 19–33. [Google Scholar] [CrossRef]
  19. Das, A.; Prasad, R.; Srivastava, A.; Giang, P.H.; Bhatnagar, K.; Varma, A. Fungal siderophores: Structure, functions and regolation. In Microbial Siderophores; Springer: Berlin/Heidelberg, Germany, 2007; pp. 1–42. ISBN 978-3-540-71159-9. [Google Scholar]
  20. Schalk, I.J.; Hannauer, M.; Braud, A. New roles for bacterial siderophores in metal transport and tolerance. Environ. Microbiol. 2011, 13, 2844–2854. [Google Scholar] [CrossRef]
  21. Ahmed, E.; Holmström, S.J.M. Siderophores in environmental research: Roles and applications. Microb. Biotechnol. 2014, 7, 196–208. [Google Scholar] [CrossRef]
  22. Khan, A.G.; Kuek, C.; Chaudhry, T.M.; Khoo, C.S.; Hayes, W.J. Role of plants, mycorrhizae and phytochelators in heavy metal contaminated land remediation. Chemosphere 2000, 41, 197–207. [Google Scholar] [CrossRef]
  23. Schwab, A.P.; Zhu, D.S.; Banks, M.K. Influence of organic acids on the transport of heavy metals in soil. Chemosphere 2008, 72, 986–994. [Google Scholar] [CrossRef]
  24. Woo, S.L.; Pepe, O. Microbial consortia: Promising probiotics as plant biostimulants for sustainable agriculture. Front. Plant Sci. 2018, 9, 7–12. [Google Scholar] [CrossRef]
  25. Vinale, F.; Sivasithamparam, K.; Ghisalberti, E.L.; Marra, R.; Woo, S.L.; Lorito, M. Trichoderma-plant-pathogen interactions. Soil Biol. Biochem. 2008, 40, 1–10. [Google Scholar] [CrossRef]
  26. Harman, G.E.; Howell, C.R.; Viterbo, A.; Chet, I.; Lorito, M. Trichoderma species—Opportunistic, avirulent plant symbionts. Nat. Rev. Microbiol. 2004, 2, 43–56. [Google Scholar] [CrossRef]
  27. Kredics, L.; Hatvani, L.; Naeimi, S.; Körmöczi, P.; Manczinger, L.; Vágvölgyi, C.; Druzhinina, I. Biodiversity of the Genus Hypocrea/Trichoderma in Different Habitats; Gupta, V.K., Schmoll, M., Herrera-Estrella, A., Upadhyay, R.S., Druzhinina, I., Tuohy, M.G., Eds.; Elsevier: Oxford, UK, 2014; pp. 3–24. ISBN 978-0-444-59576-8. [Google Scholar]
  28. Nicoletti, R.; Vinale, F. Bioactive compounds from marine-derived Aspergillus, Penicillium, Talaromyces and Trichoderma Species. Mar. Drugs 2018, 16, 408. [Google Scholar] [CrossRef] [Green Version]
  29. Marra, R.; Nicoletti, R.; Pagano, E.; DellaGreca, M.; Salvatore, M.M.M.M.; Borrelli, F.; Lombardi, N.; Vinale, F.; Woo, S.L.S.L.; Andolfi, A. Inhibitory effect of trichodermanone C, a sorbicillinoid produced by Trichoderma citrinoviride associated to the green alga Cladophora sp., on nitrite production in LPS-stimulated macrophages. Nat. Prod. Res. 2019, 33, 3389–3397. [Google Scholar] [CrossRef]
  30. Salvatore, M.M.; Nicoletti, R.; DellaGreca, M.; Andolfi, A. Occurrence and properties of thiosilvatins. Mar. Drugs 2019, 17, 664. [Google Scholar] [CrossRef] [Green Version]
  31. Vinale, F.; Sivasithamparam, K.; Ghisalberti, E.L.; Ruocco, M.; Woo, S.; Lorito, M. Trichoderma secondary metabolites that affect plant metabolism. Nat. Prod. Commun. 2012, 7, 1545–1550. [Google Scholar] [CrossRef] [Green Version]
  32. Vinale, F.; Sivasithamparam, K. Beneficial effects of Trichoderma secondary metabolites on crops. Phyther. Res. 2020, 2835–2842. [Google Scholar] [CrossRef]
  33. Vinale, F.; Nicoletti, R.; Borrelli, F.; Mangoni, A.; Parisi, O.A.; Marra, R.; Lombardi, N.; Lacatena, F.; Grauso, L.; Finizio, S.; et al. Co-culture of plant beneficial microbes as source of bioactive metabolites. Sci. Rep. 2017, 7, 1–12. [Google Scholar] [CrossRef] [Green Version]
  34. Vinale, F.; Nigro, M.; Sivasithamparam, K.; Flematti, G.; Ghisalberti, E.L.; Ruocco, M.; Varlese, R.; Marra, R.; Lanzuise, S.; Eid, A.; et al. Harzianic acid: A novel siderophore from Trichoderma harzianum. FEMS Microbiol. Lett. 2013, 347, 123–129. [Google Scholar] [CrossRef] [PubMed] [Green Version]
  35. Vinale, F.; Flematti, G.; Sivasithamparam, K.; Lorito, M.; Marra, R.; Skelton, B.W.; Ghisalberti, E.L. Harzianic acid, an antifungal and plant growth promoting metabolite from Trichoderma harzianum. J. Nat. Prod. 2009, 72, 2032–2035. [Google Scholar] [CrossRef] [PubMed]
  36. Manganiello, G.; Sacco, A.; Ercolano, M.R.; Vinale, F.; Lanzuise, S.; Pascale, A.; Napolitano, M.; Lombardi, N.; Lorito, M.; Woo, S.L. Modulation of tomato response to rhizoctonia solani by Trichoderma harzianum and its secondary metabolite harzianic acid. Front. Microbiol. 2018, 9, 1966. [Google Scholar] [CrossRef] [PubMed]
  37. De Filippis, A.; Nocera, F.P.; Tafuri, S.; Ciani, F.; Staropoli, A.; Comite, E.; Bottiglieri, A.; Gioia, L.; Lorito, M.; Woo, S.L.; et al. Antimicrobial activity of harzianic acid against Staphylococcus pseudintermedius. Nat. Prod. Res. 2020, 1–6. [Google Scholar] [CrossRef] [PubMed]
  38. Healy, A.R.; Vinale, F.; Lorito, M.; Westwood, N.J. Total synthesis and biological evaluation of the tetramic acid based natural product harzianic acid and its stereoisomers. Org. Lett. 2015, 17, 692–695. [Google Scholar] [CrossRef] [PubMed] [Green Version]
  39. Mo, X.; Li, Q.; Ju, J. Naturally occurring tetramic acid products: Isolation, structure elucidation and biological activity. RSC Adv. 2014, 4, 50566–50593. [Google Scholar] [CrossRef]
  40. De Tommaso, G.; Salvatore, M.M.; Nicoletti, R.; DellaGreca, M.; Vinale, F.; Bottiglieri, A.; Staropoli, A.; Salvatore, F.; Lorito, M.; Iuliano, M.; et al. Bivalent metal-chelating properties of harzianic acid produced by Trichoderma pleuroticola associated to the gastropod Melarhaphe neritoides. Molecules 2020, 25, 2147. [Google Scholar] [CrossRef]
  41. Meloun, M.; Havel, J.; Högfeldt, E. Computation of Solution Equilibria a Guide to Methods in Potentiometry, Extraction and Spectrophotometry; John Wiley & Sons: New York, NY, USA, 1988; ISBN 0-470-20975-5. [Google Scholar]
  42. Gans, P.; Sabatini, A.; Vacca, A. Investigation of equilibria in solution. Determination of equilibrium constants with the HYPERQUAD suite of programs. Talanta 1996, 43, 1739–1753. [Google Scholar] [CrossRef]
  43. Ohtaki, H.; Tanaka, N. Ionic equilibria in mixed solvents. VI. Dissociation constants of aliphatic diamines in water-methanol solutions. J. Phys. Chem. 1971, 75, 90–92. [Google Scholar] [CrossRef]
  44. Matsui, H.; Ohtaki, H. Ionic equilibria in mixed solvents. XII. Hydrolysis of cadmium (II) ion in dioxane–water and methanol–water mixtures. Bull. Chem. Soc. Jpn. 1977, 50. [Google Scholar] [CrossRef] [Green Version]
  45. Baes, C.F.; Mesmer, R.S. The hydrolysis of cations. In Berichte der Bunsengesellschaft für Physikalische Chemie; John Wiley & Sons: New York, NY, USA, 1977; pp. 245–246. [Google Scholar]
  46. Martell, A..; Smith, R.M. Critical Stability Constants; Springer: New York, NY, USA, 1989; ISBN 978-1-4615-6766-0. [Google Scholar]
  47. Kaufmann, G.F.; Sartorio, R.; Lee, S.H.; Rogers, C.J.; Meijler, M.M.; Moss, J.A.; Clapham, B.; Brogan, A.P.; Dickerson, T.J.; Janda, K.D. Revisiting quorum sensing: Discovery of additional chemical and biological functions for 3-oxo-N-acylhomoserine lactones. Proc. Natl. Acad. Sci. USA 2005, 102, 309–314. [Google Scholar] [CrossRef] [PubMed] [Green Version]
  48. Zaghouani, M.; Nay, B. 3-Acylated tetramic and tetronic acids as natural metal binders: Myth or reality? Nat. Prod. Rep. 2016, 33, 540–548. [Google Scholar] [CrossRef] [PubMed]
  49. Markopoulou, O.; Markopoulos, J.; Nicholls, D. Synthesis of 3-butanoyl- and 3-benzoyl-4-hydroxy-3-pyrrolin-2-ones and their complexes with metal ions. J. Inorg. Biochem. 1990, 39, 307–316. [Google Scholar] [CrossRef]
  50. Heaton, B.T.; Jacob, C.; Sampanthar, J.T. Rhodium carbonyl complexes containing pyridine; crystal structure of an unusual octahedral rhodium(I) complex [Rh2(μ-CO)3Cl2(py)4]. J. Chem. Soc. Dalt. Trans. 1998, 2, 1403–1410. [Google Scholar] [CrossRef]
  51. Burgess, J.; Rangel, M. Hydroxypyranones, hydroxypyridinones, and their complexes. In Advances in Inorganic Chemistry; Accademic Press: London, UK, 2008; pp. 167–243. ISBN 978-0-12-373977-3. [Google Scholar]
  52. Al Alousi, A.S.; Shehata, M.R.; Shoukry, M.M.; Hassan, S.A.; Mahmoud, N. Coordination properties of dehydroacetic acid—Binary and ternary complexes. J. Coord. Chem. 2008, 61, 1906–1916. [Google Scholar] [CrossRef]
  53. Pinto, I.S.S.; Neto, I.F.F.; Soares, H.M.V.M. Biodegradable chelating agents for industrial, domestic, and agricultural applications—A review. Environ. Sci. Pollut. Res. 2014, 21, 11893–11906. [Google Scholar] [CrossRef]
Figure 1. Structures of harzianic acid (H2L) and its acid dissociation products (HL and L2−). Reported dissociation constants of harzianic acid have been separately determined at 25 °C in the mixed solvent CH3OH/0.1 M NaClO4 (50:50 w/w), which is the solvent employed in this study.
Toxics 09 00019 g001
Scheme 1. Sketch of the potentiometric apparatus employed to prepare test solutions, TS, of accurately known pH and analytical composition. RE represents the double junction Ag/AgCl(s)/0.1 M NaCl/(0.1 M NaClO4-CH3OH, 50/50 w/w) reference electrode and GE a pH indicator glass electrode.
Toxics 09 00019 sch001
Figure 2. Far–UV circular dichroism (CD) spectra (optical path 0.2 cm) in CH3OH/0.1 M NaClO4 (50:50 w/w) at different pH values: (A)   C Pb 0 = 5.4 × 10⁻⁵ M Pb(ClO4)2 and C H 2 L 0 = 1.1 × 10⁻⁴ M; (B)   C Cd 0 = 1.4 × 10⁻⁴ M Cd(ClO4)2 and C H 2 L 0 = 2.6 × 10⁻⁴ M; (C) C Co 0 = 6.9 × 10⁻⁵ M CoCl2 and C H 2 L 0 = 1.4 × 10⁻⁴ M; (D) C Ni 0 = 1.1·10−4 M NiCl2 and C H 2 L 0 = 2.1 × 10⁻⁴ M. H2L = harzianic acid.
Toxics 09 00019 g002
Figure 3. UV-VIS spectra in CH3OH/0.1 M NaClO4 (50:50 w/w) at different pH of: (A) C H 2 L 0 = 2.0 × 10⁻⁴ M and C Cd 0 = 2.0 × 10⁻⁴ Cd(ClO4)2 (ligand to metal ratio 1:1); (B) C H 2 L 0 = 2.0 × 10⁻⁴ M and C Cd 0 = 4.0 × 10⁻⁴ Cd(ClO4)2 (ligand to metal ratio 1:2).
Toxics 09 00019 g003
Figure 4. UV-VIS spectra in CH3OH/0.1 M NaClO4 (50:50 w/w) at different pH of: (A) C H 2 L 0 = 2.0 × 10⁻⁴ M and C Co 0 = 2.0 × 10⁻⁴ CoCl2 (ligand to metal ratio 1:1); (B) C H 2 L 0 = 2.0 × 10⁻⁴ M and C Co 0 = 4.0 × 10⁻⁴ CoCl2 (ligand to metal ratio 1:2).
Toxics 09 00019 g004
Figure 5. UV-VIS spectra in CH3OH/0.1 M NaClO4 (50:50 w/w) at different pH of: (A) C H 2 L 0 = 2.0 × 10⁻⁴ M and C Ni 0 = 2.0 × 10⁻⁴ NiCl2 (ligand to metal ratio 1:1); (B) C H 2 L 0 = 2.0 × 10⁻⁴ M and C Ni 0 = 4.0 × 10⁻⁴ NiCl2 (ligand to metal ratio 1:2).
Toxics 09 00019 g005
Figure 6. UV-VIS spectra in CH3OH/0.1 M NaClO4 (50:50 w/w) at different pH of: (A) C H 2 L 0 = 2.0 × 10⁻⁴ M and C Pb 0 = 2.0 × 10⁻⁴ Pb(ClO4)2 (ligand to metal ratio 1:1); (B) C H 2 L 0 = 2.0 × 10⁻⁴ M and C Pb 0 = 4.0 × 10⁻⁴Pb(ClO4)2 (ligand to metal ratio 1:2).
Toxics 09 00019 g006
Figure 7. pH scan of a 10−4 M aqueous solution of Pb2+ based on stoichiometry and formation constants of Pb m ( OH ) n 2 m n hydroxo complexes gathered from literature [45,46].
Toxics 09 00019 g007
Figure 8. Molar extinction coefficients, ε λ (M−1 cm−1), of the absorbing species calculated by Hyperquad for the systems: (A) Co2+-harzianic acid; (B) Ni2+-harzianic acid.
Toxics 09 00019 g008
Figure 9. Distribution diagram of species in Cd2+-harzianic acid system in CH3OH/0.1 M NaClO4 (50:50 w/w) calculated from formation constants in Table 2 assuming a C Cd = 1.0 × 10⁻³ M and C H 2 L = 2.0 × 10⁻³ M (H2L = harzianic acid). The symbol Cd* is used to represent all species in the solution that contain the metal cation, but do not contain harzianic acid.
Toxics 09 00019 g009
Figure 10. Distribution diagram of species in Co2+-harzianic acid system in CH3OH/0.1 M NaClO4 (50:50 w/w) calculated from formation constants in Table 2 assuming C Co = 1.0 × 10⁻³ M and C H 2 L = 2.0 × 10⁻³ M (H2L = harzianic acid). The symbol Co* is used to represent all species in the solution that contain the metal cation, but do not contain harzianic acid.
Toxics 09 00019 g010
Scheme 2. Chelation of metal cations, M2+, by harzianic acid.
Toxics 09 00019 sch002
Table 1. Characterization of M2+-harzianic acid complexes by LC-MS. H2L represents the full protonated harzianic acid molecule, C19H27NO6.
IonExperimental Mass FormulaExact Mass
Harzianic Acid + Cd(ClO4)2
[H2L + H]+366.1915C19H28NO6366.1917
[H2L + Cd + ClO4]+578.0335C19H27NO10CdCl578.0331
[2H2L − H + Cd]+843.2624C38H53N2O12Cd843.2632
Harzianic Acid + CoCl2
[H2L + H]+366.1913C19H28NO6366.1917
[H2L + Na]+388.1721C19H27NO6Na388.1736
[2H2L − H + Co]+788.2910C38H53N2O12Co788.2931
Harzianic Acid + NiCl2
[H2L + H]+366.1910C19H28NO6366.1917
[H2L + Na]+388.1762C19H27NO6Na388.1736
[2H2L − H + Ni]+787.2938C38H53N2O12Ni787.2952
Harzianic acid + Pb(ClO4)2
[H2L + H]+366.1912C19H28NO6366.1917
[H2L − H + Pb]+572.1507C19H26NO6Pb572.1526
[2H2L − H + Pb]+937.3326C38H53N2O12Pb937.3365
Table 2. Summary of M2+/harzianic acid (H2L) stability constants. σ denotes the estimated standard deviation.
M2+ReactionLog (Formation Constant) ± 3σ
Cd2+Cd2+ + L2 ⇌ CdL3.82 ± 0.19
Cd2+ + HL + L2 ⇌ Cd(HL)L9.13 ± 0.23
Co2+Co2+ + L2 ⇌ CoL4.70 ± 0.12
Co2+ + HL + L2⇌ Co(HL)L11.93 ± 0.06
Ni2+Ni2+ + HL + L2 ⇌ Ni(HL)L11.85 ± 0.12
Pb2+Pb2+ + L2 ⇌ PbL4.25 ± 0.5
Pb2+ + HL + L2 ⇌ Pb(HL)L10.77 ± 0.3
Publisher’s Note: MDPI stays neutral with regard to jurisdictional claims in published maps and institutional affiliations.

