Bird Feces as Indicators of Metal Pollution: Pitfalls and Solutions

 ,
, 
 , and
, and
Abstract

1. Introduction
2. Materials and Methods
2.1. Study Area and Study Species
2.2. Sampling
2.3. Trace Element Analyses
2.4. Statistics
3. Results
3.1. Levels of Variation (Dataset 1): Among Plots, among Broods, within Broods and within Individuals
3.2. Levels in Feces and Urate (Dataset 2)
4. Discussion
5. Conclusions
Supplementary Materials
Author Contributions
Funding
Acknowledgments
Conflicts of Interest
References
- Dauwe, T.; Bervoets, L.; Blust, R.; Pinxten, R.; Eens, M. Can Excrement and Feathers of Nestling Songbirds Be Used as Biomonitors for Heavy Metal Pollution? Arch. Environ. Contam. Toxicol. 2000, 39, 541–546. [Google Scholar] [CrossRef] [PubMed]
- Coeurdassier, M.; Fritsch, C.; Faivre, B.; Crini, N.; Scheifler, R. Partitioning of Cd and Pb in the blood of European blackbirds (Turdus merula) from a smelter contaminated site and use for biomonitoring. Chemosphere 2012, 87, 1368–1373. [Google Scholar] [CrossRef] [PubMed]
- Espín, S.; García-Fernández, A.J.; Herzke, D.; Shore, R.F.; Van Hattum, B.; Martínez-López, E.; Coeurdassier, M.; Eulaers, I.; Fritsch, C.; Gómez-Ramírez, P.; et al. Tracking pan-continental trends in environmental contamination using sentinel raptors—What types of samples should we use? Ecotoxicology 2016, 25, 777–801. [Google Scholar] [CrossRef] [PubMed]
- Sadeghi, M.; Ghasempouri, S.M.; Bahramifar, N. Xenobiotic and essential metals biomonitoring by feathers: Molting pattern and feather regrowth sequence in four dominant waterfowl. Int. J. Environ. Sci. Technol. 2017, 16, 125–134. [Google Scholar] [CrossRef]
- Clapp, J.B.; Bevan, R.M.; Singleton, I. Avian Urine: Its Potential as a Non-Invasive Biomonitor of Environmental Metal Exposure in Birds. Water Air Soil Pollut. 2012, 223, 3923–3938. [Google Scholar] [CrossRef]
- Martínez-Haro, M.; Taggart, M.A.; Lefranc, H.; Martin-Doimeadios, R.C.; Green, A.J.; Mateo, R. Monitoring of Pb exposure in waterfowl ten years after a mine spill through the use of noninvasive sampling. PLoS ONE 2013, 8, e57295. [Google Scholar] [CrossRef]
- Lifshitz, N.; Clair, C.C.S. Coloured ornamental traits could be effective and non-invasive indicators of pollution exposure for wildlife. Conserv. Physiol. 2016, 4, cow028. [Google Scholar] [CrossRef]
- Belskii, E.A.; Bezel, V.S.; Lyakhov, A.G. Characteristics of the reproductive indices of birds nesting in tree hollows under conditions of technogenic pollution. Russ. J. Ecol. 1995, 26, 126–131. [Google Scholar]
- Janssens, E.; Dauwe, T.; Van Duyse, E.; Beernaert, J.; Pinxten, R.; Eens, M. Effects of Heavy Metal Exposure on Aggressive Behavior in a Small Territorial Songbird. Arch. Environ. Contam. Toxicol. 2003, 45, 121–127. [Google Scholar] [CrossRef]
- Costa, R.; Eeva, T.; Eira, C.; Vaqueiro, J.; Medina, P.; Vingada, J. Great tits breeding performance and mercury contamination from the paper and pulp industry in the west coast of Portugal. Chem. Ecol. 2014, 30, 206–215. [Google Scholar] [CrossRef]
- Berglund, Å.M.M.; Rainio, M.J.; Eeva, T. Temporal Trends in Metal Pollution: Using Bird Excrement as Indicator. PLoS ONE 2015, 10, e0117071. [Google Scholar] [CrossRef] [PubMed]
- Nyholm, N.E.I. Heavy Metal Tissue Levels, Impact on Breeding and Nestling Development in Natural Populations of Pied Flycatchers (Aves) in the Pollution Gradient from a Smelter; Donker, M., Eijsackers, H., Heimback, F., Eds.; Lewis Publishers: Chelsee, AL, USA, 1994; pp. 373–382. [Google Scholar]
- Dauwe, T.; Janssens, E.; Bervoets, L.; Blust, R.; Eens, M. Relationships between metal concentrations in great tit nestlings and their environment and food. Environ. Pollut. 2004, 131, 373–380. [Google Scholar] [CrossRef] [PubMed]
- Carere, C.; Groothuis, T.G.G.; Möstl, E.; Daan, S.; Koolhaas, J.M. Fecal corticosteroids in a territorial bird selected for different personalities: Daily rhythm and the response to social stress. Horm. Behav. 2003, 43, 540–548. [Google Scholar] [CrossRef]
- Cook, N.J. Review: Minimally invasive sampling media and the measurement of corticosteroids as biomarkers of stress in animals. Can. J. Anim. Sci. 2012, 92, 227–259. [Google Scholar] [CrossRef]
- Joo, S.; Park, S. Identification of bird species and their prey using DNA barcode on feces from Korean traditional village groves and forests (maeulsoop). Anim. Cells Syst. 2012, 16, 488–497. [Google Scholar] [CrossRef]
- Rytkönen, S.; Vesterinen, E.J.; Westerduin, C.; Leviäkangas, T.; Vatka, E.; Mutanen, M.; Välimäki, P.; Hukkanen, M.; Suokas, M.; Orell, M. From feces to data: A metabarcoding method for analyzing consumed and available prey in a bird-insect food web. Ecol. Evol. 2019, 9, 631–639. [Google Scholar] [CrossRef]
- Song, S.J.; Sanders, J.G.; Delsuc, F.; Metcalf, J.; Amato, K.; Taylor, M.W.; Mazel, F.; Lutz, H.L.; Winker, K.; Graves, G.R.; et al. Comparative Analyses of Vertebrate Gut Microbiomes Reveal Convergence between Birds and Bats. mBio 2020, 11, 2901. [Google Scholar] [CrossRef]
- Berglund, Å.M. Evaluating blood and excrement as bioindicators for metal accumulation in birds. Environ. Pollut. 2018, 233, 1198–1206. [Google Scholar] [CrossRef]
- Nam, D.-H.; Lee, D.-P. Monitoring for Pb and Cd pollution using feral pigeons in rural, urban, and industrial environments of Korea. Sci. Total Environ. 2006, 357, 288–295. [Google Scholar] [CrossRef]
- Smith, P.N.; Cobb, G.P.; Godard-Codding, C.A.; Hoff, D.; McMurry, S.T.; Rainwater, T.R.; Reynolds, K.D. Contaminant exposure in terrestrial vertebrates. Environ. Pollut. 2007, 150, 41–64. [Google Scholar] [CrossRef]
- Sanderfoot, O.V.; Holloway, T. Air pollution impacts on avian species via inhalation exposure and associated outcomes. Environ. Res. Lett. 2017, 12, 083002. [Google Scholar] [CrossRef]
- Peakall, D.; Burger, J. Methodologies for assessing exposure to metals: Speciation, bioavailability of metals, and ecological host factors. Ecotoxicol. Environ. Saf. 2003, 56, 110–121. [Google Scholar] [CrossRef]
- Bervoets, L.; Snoeijs, T.; Dauwe, T.; Eens, M.; Blust, R. Calcium availability influences lead accumulation in a passerine bird. Anim. Biol. 2006, 56, 289–298. [Google Scholar] [CrossRef]
- Elder, A.; Nordberg, G.F.; Kleinman, M. Chapter 3—Routes of Exposure, Dose, and Toxicokinetics of Metals, Handbook on the Toxicology of Metals, 4th ed.; Elsevier B.V.: Amsterdam, The Netherlands, 2015; pp. 45–74. [Google Scholar]
- Berglund, Å.M.M.; Koivula, M.; Eeva, T. Species- and age-related variation in metal exposure and accumulation of two passerine bird species. Environ. Pollut. 2011, 159, 2368–2374. [Google Scholar] [CrossRef]
- Nordberg, G.; Fowler, B.A.; Nordberg, M. Handbook on the Toxicology of Metals; Academic Press: London, UK, 2015. [Google Scholar]
- Kalisínska, E. Mammals and Birds as Bioindicators of Trace Element Contaminations in Terrestrial Environments: An Ecotoxicological Assessment of the Northern Hemisphere; Springer International Publishing: Berlin/Heidelberg, Germany, 2019. [Google Scholar]
- Davis, R.E. The nitrogenous constituents of hen urine. J. Biol. Chem. 1927, 74, 509–515. [Google Scholar]
- Crouch, N.M.A.; Lynch, V.M.; Clarke, J.A. A re-evaluation of the chemical composition of avian urinary excreta. J. Ornithol. 2019, 161, 17–24. [Google Scholar] [CrossRef]
- Casotti, G.; Braun, E.J. Protein location and elemental composition of urine spheres in different avian species. J. Exp. Zool. 2004, 301, 579–587. [Google Scholar] [CrossRef] [PubMed]
- Ishihara, N.; Matsushiro, T. Biliary and Urinary Excretion of Metals in Humans. Arch. Environ. Health Int. J. 1986, 41, 324–330. [Google Scholar] [CrossRef]
- Belskii, E.A.; Bezel, V.S.; Polents, E.A. Early stages of the nesting period of hollow-nesting birds under conditions of industrial pollution. Russ. J. Ecol. 1995, 26, 38–43. [Google Scholar]
- Costa, R.; Eeva, T.; Eira, C.; Vaqueiro, J.; Vingada, J. Trace Elements in Faeces of Great Tit Nestlings in Relation to Breeding Performance in Coastal Areas in Central Portugal. Arch. Environ. Contam. Toxicol. 2012, 63, 594–600. [Google Scholar] [CrossRef]
- Kiikkilä, O. Heavy-metal pollution and remediation of forest soil around the Harjavalta Cu-Ni smelter, in SW Finland. Silva Fenn. 2003, 37, 399–415. [Google Scholar] [CrossRef]
- Kozlov, M.G.; Zvereva, E.; Zverev, V. Impacts of Point Polluters on Terrestrial Biota; Springer Science and Business Media LLC: Dordrecht, The Netherlands; Springer Science and Business Media LLC: Berlin/Heidelberg, Germany; Springer Science and Business Media LLC: London, UK; Springer Science and Business Media LLC: New York, NY, USA, 2009. [Google Scholar]
- Eeva, T.; Holmström, H.; Espín, S.; Sánchez-Virosta, P.; Klemola, T. Leaves, berries and herbivorous larvae of bilberry Vaccinium myrtillus as sources of metals in food chains at a Cu-Ni smelter site. Chemosphere 2018, 210, 859–866. [Google Scholar] [CrossRef] [PubMed]
- Eeva, T.; Espín, S.; Ruiz, S.; Sánchez-Virosta, P.; Koivula, M.J. Polluted environment does not speed up age-related change in reproductive performance of the Pied Flycatcher. J. Ornithol. 2017, 159, 173–182. [Google Scholar] [CrossRef]
- Berglund, Å.M.M.; Koivula, M.J.; Eeva, T. Decreased metal accumulation in passerines as a result of reduced emissions. Environ. Toxicol. Chem. 2012, 31, 1317–1323. [Google Scholar] [CrossRef]
- Lambrechts, M.M.; Adriaensen, F.; Ardia, D.R.; Artemyev, A.V.; Atiénzar, F.; Bańbura, J.; Barba, E.; Bouvier, J.-C.; Camprodon, J.; Cooper, C.B.; et al. The Design of Artificial Nestboxes for the Study of Secondary Hole-Nesting Birds: A Review of Methodological Inconsistencies and Potential Biases. Acta Ornithol. 2010, 45, 1–26. [Google Scholar] [CrossRef]
- Eeva, T.; Lehikoinen, E.; Sunell, C. The quality of pied flycatcher (Ficedula hypoleuca) and great tit (Parus major) females in an air pollution gradient. Ann. Zool. Fenn. 1997, 34, 61–71. [Google Scholar]
- Cramp, S.; Perrins, C.M. The Birds of the Western Palearctic VII; Oxford University Press: Oxford, UK, 1993. [Google Scholar]
- Eeva, T.; Ryömä, M.; Riihimäki, J. Pollution-related changes in diets of two insectivorous passerines. Oecologia 2005, 145, 629–639. [Google Scholar] [CrossRef]
- SAS Institute Inc. Base SAS 9.4 Procedures Guide: Statistical Procedures; SAS Institute Inc.: Cary, NC, USA, 2013. [Google Scholar]
- EPA. Guidance for Data Quality Assessment: Practical Methods for Data Analysis; EPA QA/G9: QA00; Update: July 2000; EPA: Washington, DC, USA, 2000. [Google Scholar]
- Sánchez-Virosta, P.; Espín, S.; Ruiz, S.; Stauffer, J.; Kanerva, M.; García-Fernández, A.J.; Eeva, T. Effects of calcium supplementation on oxidative status and oxidative damage in great tit nestlings inhabiting a metal-polluted area. Environ. Res. 2019, 171, 484–492. [Google Scholar] [CrossRef]
- Saulnier, A.; Bleu, J.; Boos, A.; El Masoudi, I.; Ronot, P.; Zahn, S.; Del Nero, M.; Massemin, S. Consequences of trace metal cocktail exposure in zebra finch (Taeniopygia guttata) and effect of calcium supplementation. Ecotoxicol. Environ. Saf. 2020, 193, 110357. [Google Scholar] [CrossRef]
- Lessells, C.M.; Boag, P.T. Unrepeatable Repeatabilities: A Common Mistake. Auk 1987, 104, 116–121. [Google Scholar] [CrossRef]
- Harper, D.G. Some comments on the repeatability of measurements. Ringing Migr. 1994, 15, 84–90. [Google Scholar] [CrossRef]
- Afik, D.; Karasov, W.H. The Trade-Offs Between Digestion Rate and Efficiency in Warblers and Their Ecological Implications. Ecology 1995, 76, 2247–2257. [Google Scholar] [CrossRef]
- Michalski, M.; Nadolski, J.; Marciniak, B.; Loga, B.; Banbura, J. Faecal analysis as a method of nestling diet determination in insectivorous birds: A case study in Blue Tits Cyanistes caeruleus and Great Tits Parus major. Acta Ornithol. 2011, 46, 164–172. [Google Scholar] [CrossRef]
- Belskii, E.; Belskaya, E. Diet composition as a cause of different contaminant exposure in two sympatric passerines in the Middle Urals, Russia. Ecotoxicol. Environ. Saf. 2013, 97, 67–72. [Google Scholar] [CrossRef]
- Graveland, J. Decline of snail abundance on acidified soils causes poor reproduction in forest passerines. J. Ornithol. 1994, 135, 528. [Google Scholar]
- Eeva, T.; Rainio, K.; Suominen, O. Effects of pollution on land snail abundance, size and diversity as resources for pied flycatcher, Ficedula hypoleuca. Sci. Total Environ. 2010, 408, 4165–4169. [Google Scholar] [CrossRef]
- Louis, V.L.S.; Breebaart, L. Calcium Supplements in the Diet of Nestling Tree Swallows near Acid Sensitive Lakes. Condor 1991, 93, 286–294. [Google Scholar] [CrossRef]
- Wilkin, T.A.; Gosler, A.G.; Garant, D.; Reynolds, S.J.; Sheldon, B.C. Calcium effects on life-history traits in a wild population of the great tit (Parus major): Analysis of long-term data at several spatial scales. Oecologia 2009, 159, 463–472. [Google Scholar] [CrossRef]
- Pounds, J.G. Effect of lead intoxication on calcium homeostasis and calcium-mediated cell function: A review. NeuroToxicology 1984, 5, 295–331. [Google Scholar]
- Eeva, T.; Lehikoinen, E. Rich calcium availability diminishes heavy metal toxicity in Pied Flycatcher. Funct. Ecol. 2004, 18, 548–553. [Google Scholar] [CrossRef]
- Migula, P.; Glowacka, E.; Nuorteva, S.-L.; Nuorteva, P.; Tulisalo, E. Time-related effects of intoxication with cadmium and mercury in the red wood ant. Ecotoxicology 1997, 6, 307–320. [Google Scholar] [CrossRef]
- Silverin, B.; Andersson, G. Föda hos svartvita flugsnappare Ficedula hypoleuca: En jämförelse mellan vuxna fåglar och boungar. Vår Fågelvärld 1984, 43, 517–524. [Google Scholar]
- Schmitz, A. Respiration in spiders (Araneae). J. Comp. Physiol. B 2016, 186, 403–415. [Google Scholar] [CrossRef] [PubMed]
- Custer, C.M.; Yang, C.; Crock, J.G.; Shearn-Bochsler, V.; Smith, K.S.; Hageman, P.L. Exposure of insects and insectivorous birds to metals and other elements from abandoned mine tailings in three Summit County drainages, Colorado. Environ. Monit. Assess. 2008, 153, 161–177. [Google Scholar] [CrossRef]
- Wasserman, R.H. Strontium as a Tracer for Calcium in Biological and Clinical Research. Clin. Chem. 1998, 44, 437–439. [Google Scholar] [CrossRef]
- Blum, J.D.; Taliaferro, E.H.; Holmes, R.T. Determining the sources of calcium for migratory songbirds using stable strontium isotopes. Oecologia 2001, 126, 569–574. [Google Scholar] [CrossRef]
- Qiu, R.; Qiu, R.; Tang, Y.; Wang, S. Cadmium–zinc exchange and their binary relationship in the structure of Zn-related proteins: A mini review. Metallomics 2014, 6, 1313–1323. [Google Scholar] [CrossRef]
- Boyer, J.L. Bile Formation and Secretion. Compr. Physiol. 2013, 3, 1035–1078. [Google Scholar] [CrossRef]
- Gregus, Z. Disposition of metals in rats: A comparative study of fecal, urinary, and biliary excretion and tissue distribution of eighteen metals. Toxicol. Appl. Pharmacol. 1986, 85, 24–38. [Google Scholar] [CrossRef]
- Csanaky, I.; Gregus, Z. Species variations in the biliary and urinary excretion of arsenate, arsenite and their metabolites. Comp. Biochem. Physiol. Part C Toxicol. Pharmacol. 2002, 131, 355–365. [Google Scholar] [CrossRef]
- Pain, D.J.; Mateo, R.; Green, R.E. Effects of lead from ammunition on birds and other wildlife: A review and update. Ambio 2019, 48, 935–953. [Google Scholar] [CrossRef] [PubMed]


| Mean (CL) | As | Ca | Cd | Co | Cu | Ni | Pb | ||||||||
|---|---|---|---|---|---|---|---|---|---|---|---|---|---|---|---|
| 4.08 (3.48–4.80) | 1932 (1652–2258) | 5.51 (5.10–5.95) | 3.19 (2.92–3.49) | 248 (229–265) | 50.4 (46.2–54.8) | 5.83 (5.31–6.41) | |||||||||
| df | F | p | F | p | F | p | F | p | F | p | F | p | F | p | |
| Plot | 5 | 1.81 | 0.14 | 2.92 | 0.028 | 0.54 | 0.75 | 2.42 | 0.057 | 1.75 | 0.15 | 3.39 | 0.014 | 3.09 | 0.022 |
| Brood (plot) | 32 | 5.11 | <0.0001 | 1.78 | 0.011 | 2.44 | 0.0001 | 4.24 | <0.0001 | 2.61 | <0.0001 | 4.25 | <0.0001 | 2.42 | 0.0002 |
| Nestling (brood) | 170 | 1.17 | 0.15 | 0.80 | 0.93 | 1.16 | 0.16 | 1.68 | 0.0003 | 1.56 | 0.0016 | 1.53 | 0.0024 | 1.53 | 0.0024 |
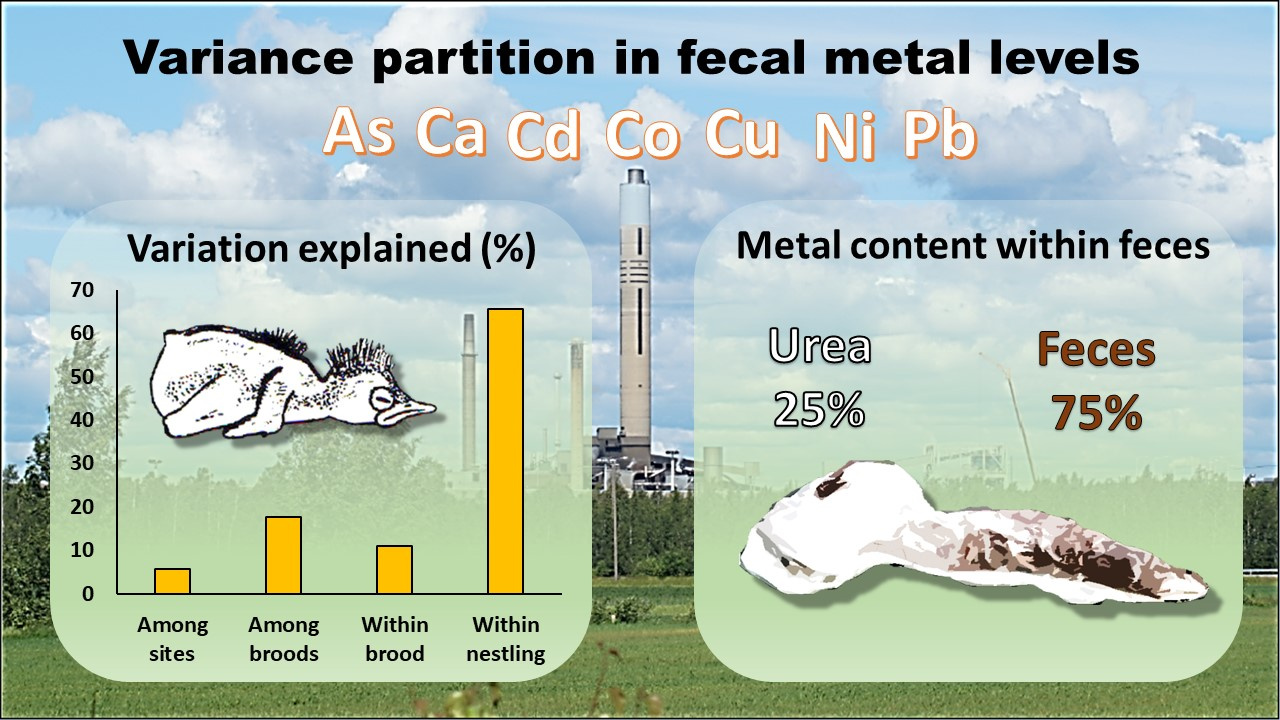
| Source of Variation | df | As | Ca | Cd | Co | Cu | Ni | Pb | |
|---|---|---|---|---|---|---|---|---|---|
| Plot | 5 | 5.7 | 4.0 | 0.0 | 7.9 | 3.1 | 12.4 | 7.7 | 5.8 |
| Brood (plot) | 32 | 27.7 | 5.5 | 13.0 | 25.7 | 15.3 | 24.0 | 12.9 | 17.7 |
| Nestling (brood) | 170 | 1.58 | 0.0 | 7.0 | 17.7 | 18.9 | 14.1 | 17.6 | 11.0 |
| Time (nestling) | 183 | 65.0 | 90.5 | 80.0 | 48.7 | 62.8 | 49.6 | 61.8 | 65.5 |
| Total | 390 | 100 | 100 | 100 | 100 | 100 | 100 | 100 |
| n | As | Ca | Cd | Co | Cu | Ni | Pb | ||
|---|---|---|---|---|---|---|---|---|---|
| Correlation | r | 183 | 0.35 | 0.0074 | 0.16 | 0.36 | 0.35 | 0.35 | 0.32 |
| p | <0.0001 | 0.92 | 0.0028 | <0.0001 | <0.0001 | <0.0001 | <0.0001 | ||
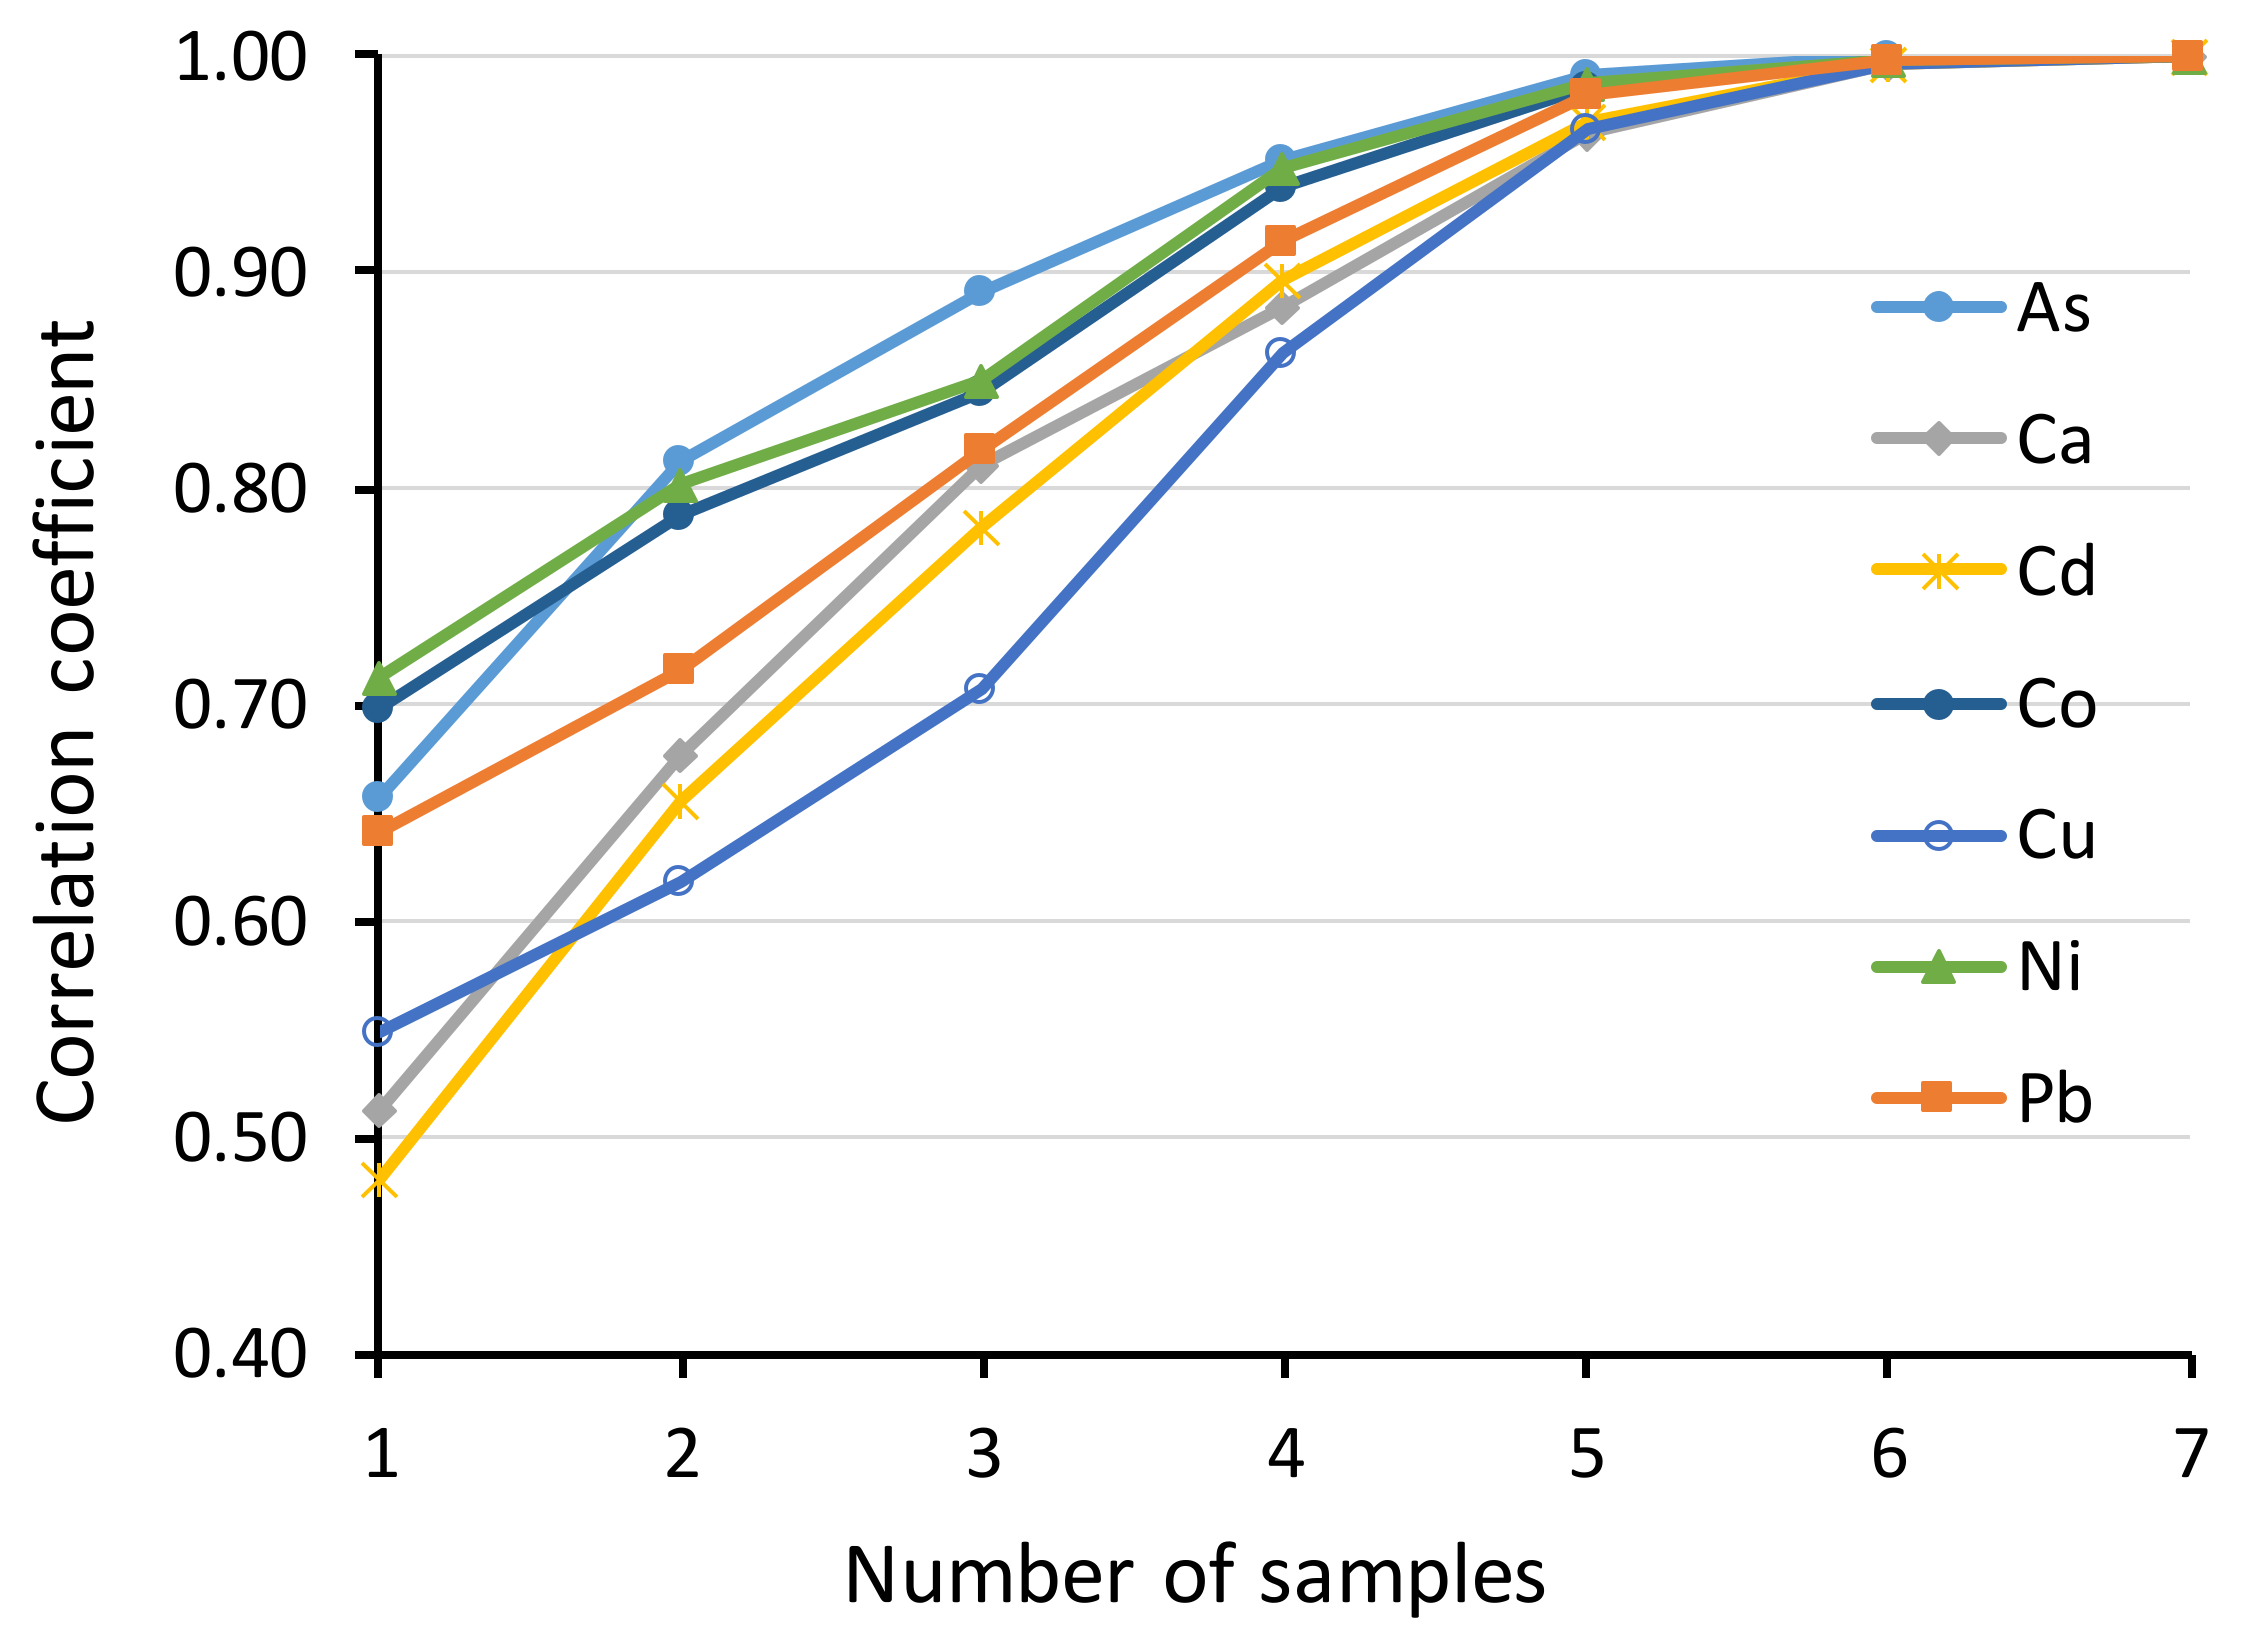
| Repeatability, individual level | 366 | 0.36 | 0.0018 | 0.18 | 0.48 | 0.38 | 0.49 | 0.41 | |
| Repeatability, brood level | 76 | 0.64 | 0.15 | 0.39 | 0.79 | 0.71 | 0.78 | 0.70 | |
| Repeatability, plot level | 6 | 0.77 | 0.42 | 0.23 | 0.79 | 0.69 | 0.92 | 0.76 | |
| Matrix | Mean Mass Proportion (% ± SD) | As | Cd | Co | Cu | Ni | Pb |
|---|---|---|---|---|---|---|---|
| Urate | 39 ± 17% | 3.31 | 1.26 | 2.53 | 186 | 33.9 | 5.66 |
| (2.64–4.16) | (1.03–1.54) | (1.96–3.27) | (152–228) | (26.2–43.8) | (4.36–7.34) | ||
| n = 39 | n = 39 | n = 39 | n = 38 | n = 39 | n = 39 | ||
| Feces | 61 ± 17% | 6.87 | 2.86 | 5.82 | 382 | 84.2 | 12.7 |
| (5.39–8.77) | (2.32–3.53) | (4.75–7.12) | (326–448) | (67.2–105) | (10.1–16.0) | ||
| n = 40 | n = 40 | n = 40 | n = 40 | n = 40 | n = 40 | ||
| Combined sample a | 5.63 | 2.27 | 4.60 | 308 | 64.9 | 10.2 | |
| (4.38–7.24) | (1.86–2.77) | (3.70–5.72) | (261–228) | (51.7–81.5) | (8.10–12.8) | ||
| n = 39 | n = 39 | n = 39 | n = 38 | n = 39 | n = 39 | ||
| Mean (±SD) proportion (%) of metal in the fecal part a | 73.3 ± 15 | 74.5 ± 15 | 74.9 ± 15 | 73.4 ± 16 | 76.3 ± 15 | 74.7 ± 14 | |
| Proportion of variation (R2) explained by relative mass of the fecal part b | 9.3 | 0.0 | 5.6 | 5.4 | 1.0 | 3.2 | |
| Pearson correlation between urine and feces (p-value) | 0.84 | 0.50 | 0.71 | 0.60 | 0.74 | 0.65 | |
| p < 0.0001 | p = 0.0011 | p < 0.0001 | p < 0.0001 | p < 0.0001 | p < 0.0001 | ||
Publisher’s Note: MDPI stays neutral with regard to jurisdictional claims in published maps and institutional affiliations. |
© 2020 by the authors. Licensee MDPI, Basel, Switzerland. This article is an open access article distributed under the terms and conditions of the Creative Commons Attribution (CC BY) license (http://creativecommons.org/licenses/by/4.0/).
Share and Cite
Eeva, T.; Raivikko, N.; Espín, S.; Sánchez-Virosta, P.; Ruuskanen, S.; Sorvari, J.; Rainio, M. Bird Feces as Indicators of Metal Pollution: Pitfalls and Solutions. Toxics 2020, 8, 124. https://doi.org/10.3390/toxics8040124
Eeva T, Raivikko N, Espín S, Sánchez-Virosta P, Ruuskanen S, Sorvari J, Rainio M. Bird Feces as Indicators of Metal Pollution: Pitfalls and Solutions. Toxics. 2020; 8(4):124. https://doi.org/10.3390/toxics8040124
Chicago/Turabian StyleEeva, Tapio, Nelli Raivikko, Silvia Espín, Pablo Sánchez-Virosta, Suvi Ruuskanen, Jouni Sorvari, and Miia Rainio. 2020. "Bird Feces as Indicators of Metal Pollution: Pitfalls and Solutions" Toxics 8, no. 4: 124. https://doi.org/10.3390/toxics8040124
APA StyleEeva, T., Raivikko, N., Espín, S., Sánchez-Virosta, P., Ruuskanen, S., Sorvari, J., & Rainio, M. (2020). Bird Feces as Indicators of Metal Pollution: Pitfalls and Solutions. Toxics, 8(4), 124. https://doi.org/10.3390/toxics8040124