1. Introduction
India’s shipbuilding industry reflects a legacy of heritage, materials, and technology, from the Wadia family-owned maritime contributions [
1] and teak’s enduring role [
2] to the Parsi cultural narratives [
3]. Today, technological innovations are reshaping the sector to enhance efficiency and reliability [
4]. Despite this legacy, the industry faces substantial challenges. It competes with global leaders such as China, Japan, South Korea, and the United States [
5], as well as emerging players such as Bangladesh, Indonesia, and Brazil [
6]. Progress is hindered by inefficiencies, skill erosion from de-industrialisation [
7], and poor infrastructure [
8]. Although several studies have examined the sector’s development and global connections [
9], few have investigated its systemic barriers.
Globally, the shipbuilding industry is shaped by state-led industrial strategies. Asian nations dominate through subsidies, labour cost advantages, and conglomerate structures [
10,
11]. European shipyards, though technologically advanced, face pressure to diversify into ship repairs and offshore wind energy [
11]. Several authors [
12] highlight environmental sustainability as an emerging priority, while other authors [
13,
14] emphasise the sector’s strategic and economic significance.
In the Indian context, policy and technology studies offer partial insights. Authors Abdel-Khalek et al. [
15] discuss defence-driven self-reliance, while [
16] links earnings persistence to high-value orders and government support; Stanić et al. [
17] introduce Shipbuilding 4.0 as a transformative force; Aghion et al. [
18] examine the impact of liberalisation on industrial growth; and Wada et al. [
19] propose forecasting models to optimise capacity. These contributions highlight sectoral relevance but lack an integrated framework for diagnosing and prioritising development barriers.
Despite this breadth of scholarship, few studies have systematically identified the interrelated barriers hindering India’s shipbuilding growth. The existing literature is fragmented across historical, comparative, and policy domains, with limited methodological depth in causal analysis. This study addresses this gap by applying the Delphi method to elicit expert consensus, employing the DEMATEL (Decision-making Trial and Evaluation Laboratory) technique to map causal relationships among barriers, and integrating both approaches to inform targeted policy recommendations. Existing India-focused studies [
1,
4,
8] examine competitiveness, defence self-reliance, or supply chain surplus independently; there remains limited evidence on how structural, financial, institutional, capability, and demand constraints interact causally. This study addresses this gap by providing a system-level causal mapping of barriers to inform policy prioritisation. To this end, the study poses three research questions:
RQ1: Which barriers hinder India’s shipbuilding growth?
RQ2: How do these barriers interact causally?
RQ3: Which policy levers address root causes most effectively?
The study employs a mixed-methods approach, combining expert judgement and causal analysis. To address the first question, it applies the Delphi method to construct a validated list of barriers; to address the second, it employs the DEMATEL model to analyse causal relationships among barriers; and to address the third, it derives policy recommendations informed by these findings. DEMATEL has been successfully applied in maritime studies to identify influences and dependencies among factors, thereby helping to diagnose systemic constraints in shipbuilding [
20,
21].
This research makes several original contributions. It offers the first in-depth, empirically grounded analysis of systemic barriers in Indian shipbuilding; integrates expert insights with causal mapping to provide a robust framework for policy intervention; and extends its implications beyond India, offering valuable lessons for other developing economies seeking to strengthen their strategic industries.
2. Literature Review
This section reviews the literature relevant to shipbuilding development and the identification of systemic barriers. The review is organised into three subsections. The first synthesises global trajectories and competitive models in shipbuilding. The second focuses on structural and policy challenges within the Indian sector. The third discusses analytical approaches for examining interdependent barriers in complex industrial systems, with particular emphasis on the Delphi and DEMATEL methods.
2.1. Global Shipbuilding Industry
The global shipbuilding industry has experienced a pronounced shift from Western economies to East Asia, with China, South Korea, and Japan emerging as dominant producers. This transition has been driven by lower labour costs, advanced industrial infrastructure, coordinated industrial policies, and declining capacity in Western shipyards, creating opportunities for emerging economies such as India [
22]. The industry remains highly capital-intensive, with sustained government support, long-term finance, and political stability playing a central role in maintaining competitiveness and growth. Comparative studies indicate that shipbuilding success depends less on firm-level efficiency and more on systemic alignment between industrial policy, domestic demand, and upstream industries such as steel and marine equipment [
23,
24].
China’s dominance reflects comprehensive capabilities across a wide range of vessel types and strong state backing that enables rapid capacity expansion and market penetration [
25]. South Korea and Japan, despite higher labour costs, have remained competitive by specialising in technologically advanced vessels and continuous process innovation, including green shipbuilding technologies [
25]. China’s leadership is further reinforced by its ability to source the majority of shipbuilding inputs domestically, reducing exposure to price volatility and supply chain disruptions [
26].
Recent empirical research shows that long-term competitiveness in China and South Korea has been achieved through aggressive state-led industrial strategies rather than market-driven adjustment alone. These strategies include production and investment subsidies, preferential credit from state-owned banks, and coordinated policies supporting technological upgrading and export expansion [
27,
28]. In South Korea, close collaboration between government and large conglomerates transformed individual shipyards into interconnected industrial clusters with strong innovation linkages [
29]. China similarly designated shipbuilding as a strategic industry, using targeted interventions to stimulate domestic investment and rapidly increase its global market share [
27]. Developing economies with fragmented or short-term policy frameworks have found it difficult to replicate these outcomes.
2.2. Shipbuilding in India
The shipbuilding sector supports upstream industries such as steel and heavy engineering and contributes to broader industrial development. Despite recent expansion, India’s share of the global shipbuilding market remains limited at around one per cent, reflecting persistent structural constraints including high capital and working capital requirements, outdated production technologies, fragmented supply chains, and shortages of specialised skilled labour [
26]. India’s share of global shipbuilding output has remained below 0.1% in recent years, compared with China (over 50%), South Korea (around 30%), and Japan (approximately 15%) [
24,
25].
Policy initiatives such as the Shipbuilding Financial Assistance Policy have sought to strengthen domestic capabilities. However, domestic demand for Indian-built ships remains weak due to competition from established shipbuilding nations such as South Korea and China. The sector’s strong orientation towards naval and defence shipbuilding further constrains diversification into commercial segments, complicating the achievement of objectives outlined in the Maritime India Vision 2030 [
30] and the Maritime Amrit Kaal Vision 2047 [
31], both of which emphasise commercial shipbuilding expansion. These policy frameworks aim to increase India’s share in global shipbuilding, develop world-class shipyard infrastructure, strengthen domestic marine equipment manufacturing, and position India among the leading shipbuilding nations by 2030 and beyond [
22,
25].
Industry assessments project rapid growth in India’s shipbuilding sector, estimating an increase from approximately USD 90 million in 2022 to USD 8120 million by 2033 [
32]. Government support through financial assistance schemes and incentives for specialised and environmentally friendly vessels is expected to facilitate this expansion [
33,
34]. The academic literature, however, adopts a more cautious view, noting that sustained growth in leading shipbuilding nations has depended on coordinated supply chain management, stable demand creation, and long-term policy commitment rather than short-duration incentives [
9].
Heavy reliance on imported raw materials and equipment exposes Indian shipyards to cost escalation and logistical risks, undermining price competitiveness. Technological integration is widely recognised as critical for productivity gains, with evidence showing that adoption of artificial intelligence and the Industrial Internet of Things can significantly improve operational efficiency in Indian shipbuilding contexts [
4]. Broader infrastructure constraints, including heavy reliance on road-based freight transport, further limit maritime industrial development [
35]. The dominance of defence-oriented shipbuilding adds complexity: although defence orders support learning and capacity creation, their spillovers to commercial competitiveness are uneven [
9,
13], and self-reliance initiatives alone are insufficient without parallel demand-side and regulatory reforms [
36,
37].
2.3. Delphi and DEMATEL Methods
For clarity, barriers from previous studies have been categorised into input and supply chain constraints, financial and capital-structure issues, institutional and regulatory challenges, capability-related limitations, and demand-side conditions [
38]. Research on policy and operational barriers increasingly uses methods that combine expert judgement with structured analytical tools, especially in situations characterised by interdependence and uncertainty. The Delphi method and DEMATEL technique are commonly employed in studies on infrastructure planning, technology adoption, sustainability transitions, and governance reform. Delphi helps achieve expert consensus through iterative rounds of anonymised feedback, reducing bias and enhancing the reliability of identified factors [
38]. Convergence was measured as the percentage agreement among panellists, and the stability of responses from Round 1 to Round 2 indicated sufficient consensus.
Once expert consensus is established, DEMATEL provides a structured approach to analysing causal relationships in complex systems. After converting qualitative judgements into quantitative matrices, the method distinguishes between influencing and influenced factors and clarifies cause-and-effect pathways [
39]. Visual tools such as Impact Relation Maps further support interpretation by illustrating directional relationships among variables [
38]. Since its development by Fontela and Gabus in 1976 [
39], DEMATEL has been applied across performance analysis, sustainability assessment, and strategic planning [
31].
Recent research highlights that the combined use of Delphi and DEMATEL is well-suited to examining interdependent policy and operational barriers, as it integrates expert judgement with explicit causal mapping [
38]. Applications in maritime and industrial settings show that this approach can reveal critical driving factors that are often overlooked by traditional ranking or regression-based techniques [
40,
41]. Despite the growing application of Delphi–DEMATEL in maritime research, no study has systematically mapped the interdependent barriers constraining Indian shipbuilding within an integrated industrial policy framework. This gap provides the rationale for the present analysis.
The studies summarised in
Table 1 [
21,
42,
43,
44,
45,
46] further demonstrate DEMATEL’s effectiveness in identifying directional relationships among barriers, while Delphi contributes a reliable and validated factor base. Despite this growing body of evidence, integrated Delphi–DEMATEL applications in shipbuilding remain limited, particularly in developing economic contexts. This gap provides a clear justification for the present study and its focus on diagnosing systemic constraints to inform policy and institutional interventions. Compared with hierarchical approaches such as ISM or weight-based methods such as AHP, fuzzy DEMATEL captures both the intensity and direction of interdependencies [
21], making it particularly suitable for analysing systemic industrial constraints under limited quantitative data.
3. Methods
This study adopts a two-stage mixed-methods approach to identify and analyse systemic barriers affecting the development of the shipbuilding industry in India. In the first stage, expert judgement is elicited through the Delphi method to identify and refine a set of critical barriers. In the second stage, the fuzzy DEMATEL technique is applied to examine the causal relationships among the selected barriers. This integrated framework is well-suited to policy and industry contexts characterised by interdependent constraints and limited availability of reliable quantitative data.
3.1. Research Design and Framework
The research design integrated the Delphi technique with the fuzzy DEMATEL approach to combine expert consensus building with causal relationship analysis. An initial list of 21 barriers (
Table 2) was developed through a review of the academic literature, policy documents, and industry reports on shipbuilding and maritime industrial development. These barriers were evaluated by a panel of twenty experts drawn from academia, government agencies, shipbuilding and ship repair, ports and terminal operations, logistics, procurement, and maritime consultancy. All panel members had at least 10 years of professional experience and held senior decision-making or advisory roles. Verbal informed consent was obtained from each panel member prior to participation.
The Delphi process was conducted over two rounds. In the first round, experts assessed the relevance and significance of the identified barriers. In the second round, participants received anonymized group feedback, enabling them to revise their assessments. Applying a 75% agreement threshold, 10 barriers demonstrating convergence were retained for DEMATEL analysis. This process ensured stability of expert judgement while reducing individual bias.
In the second stage, fuzzy DEMATEL was employed to analyse causal interactions among the final set of barriers. Experts conducted pairwise evaluations to indicate the degree to which one barrier influences another, using a predefined linguistic scale ranging from no influence to a very strong influence. These assessments were converted into triangular fuzzy numbers to capture uncertainty in expert judgement. The analysis followed a seven-step procedure: construction of the fuzzy direct-relation matrix, defuzzification, normalisation, computation of the total-relation matrix, and calculation of prominence and relation indices. The sum of rows represents the influence exerted by each barrier, while the sum of columns reflects the influence received. The difference between these values was used to classify barriers into cause-and-effect groups. Detailed computational steps are provided in
Appendix A, and the pairwise evaluation questionnaire is presented in
Appendix B.
To assess robustness, a sensitivity analysis (SA) was conducted by varying the weights assigned to experts from different professional backgrounds. This enabled examination of the stability of barrier rankings and causal classifications under alternative weighting scenarios.
3.2. Delphi Method
The Delphi method is a structured empirical technique for eliciting consensus among experts on complex issues [
47,
48]. It was selected for this study due to its iterative design, anonymity of responses, and capacity to synthesise diverse viewpoints while minimising the influence of dominant individuals [
49]. Experts participated in multiple questionnaire rounds, with anonymised summaries of group responses provided after each round to facilitate convergence of opinion. Compared with conventional survey methods, Delphi enables deeper exploration of critical factors and is particularly suitable when empirical data are limited and expert knowledge is central [
48,
49].
3.3. Fuzzy DEMATEL Method
Fuzzy set theory provides an effective means of modelling ambiguous and imprecise information using linguistic variables. In this study, triangular fuzzy numbers, as shown in
Table 3, were employed due to their simplicity and computational efficiency [
50,
51]. Linguistic evaluations were transformed into quantitative values suitable for DEMATEL analysis. The fuzzy DEMATEL technique enables a systematic examination of interdependencies among barriers by distinguishing between influencing and influenced factors, thereby revealing the system’s underlying causal structure.
4. Data Collection
Our study utilised the Delphi method in three distinct phases: expert panel selection, barrier identification, and two iterative rounds of discussion to prioritise critical barriers. We followed the structured process described by [
52] to formulate our queries. This approach aligns with recent maritime research methodologies, such as those employed by [
52] in their study of Arctic shipping challenges. The research aimed to encompass multiple domains in the Indian maritime sector, reflecting the sector’s complexity, as highlighted by Notteboom et al. [
53] in their comprehensive review of port research.
A total of 20 expert participants from diverse industry backgrounds contributed to the feedback process. These experts represented stakeholders from academia, the government, maritime consultancy and research, port and terminal operations, procurement and supply chain management, shipbuilding and ship repair, and shipping and logistics. Participation criteria required a minimum of 10 years of professional experience to ensure a high level of expertise. The selected experts held decision-making roles in their respective fields. The study incorporated insights from professionals across these sectors, including academicians and consultants from leading shipping and maritime trade firms. The distribution of the Delphi participants’ industry backgrounds is presented in
Table 4.
Additional details about the participants are provided in
Appendix C. In line with participant requests, the names of their affiliations have been kept confidential.
An initial draft of shipbuilding barriers was constructed through a comprehensive literature review [
11,
26,
27]. Given the distinct economic contexts of previous studies, the identified barriers were adapted to the Indian context. A Delphi study established a final list of 21 barriers through expert consensus. The authors identified the ten most critical barriers, presented in
Table 5, based on a convergence score analysis across two Delphi rounds. These ten barriers described below form the foundation for the subsequent DEMATEL analysis.
Time-consuming Process for Obtaining Clearances (B1): The process of obtaining clearances is lengthy and time-consuming due to multiple agencies, including, but not limited to, environmental clearances, land acquisition, coastal regulation zone (CRZ) clearances, power, water supply, etc. This poses a barrier for the shipbuilding industry, as time delays affect both project cost and implementation.
Inadequate Policy Support (B2): The shipbuilding industry in India lacks adequate policy support, unlike the global leaders. These leading global shipbuilding countries, such as Japan, South Korea, and China, have received substantial government incentives, including capital investments, loan deferments, easy financing, trade incentives, and research and development incentives, which are absent in India.
Complex Regulatory Framework (B3): The shipbuilding industry is governed by various regulations, including the CRZ regulations, environmental regulations, taxation regulations, safety standards, etc. These issues mentioned create compliance burdens and procedural delays, which act as a barrier to the shipbuilding industry.
High Working Capital Requirement (B4): The shipbuilding industry requires heavy working capital, which constitutes around 25% to 30% of the overall ship cost. In India, although human resources are relatively less expensive than their global counterparts, the import of raw materials and equipment, as well as the high cost of finance, increases working capital requirements, creating a barrier to the Indian shipbuilding industry.
Low Demand in Commercial Shipbuilding (B5): The fluctuating global demand for shipbuilding, high operating costs, and competition from major shipbuilding countries such as Japan, South Korea, and China have affected the demand for the shipbuilding industry in India. As defence orders dominate, they attempt to limit diversification.
High Raw Material Costs (B6): The raw materials used by the shipbuilding industry which are sourced domestically are limited. As a result, critical components such as equipment, machinery, steel, etc. are imported from foreign countries. The high costs of transportation and logistics further raise prices. Rising raw material costs negatively affect the profitability of the shipbuilding industry, reducing its competitiveness globally.
Lack of Private Participation (B7): The limited incentives for private investment, limited competition, lack of infrastructure facilities, higher working capital, access to funding, etc. limit the private sector from venturing into the shipbuilding industry.
Limited Capacity of Private-Sector Shipyards (B8): The Indian shipbuilding sector faces a lack of infrastructure, a lack of research and development for optimising the production processes, a lack of skilled labour, etc. These factors limit the output of Indian shipyards, thereby decreasing their global competitiveness.
Limited Availability of Skilled Labour (B9): The Indian shipbuilding sector faces a shortage of skilled labour due to limited institutions providing specialised training and education in shipbuilding and marine engineering. The industry’s specific skills are also less developed than those of global leaders in the shipbuilding sector. Research and development in the shipbuilding sector is also limited in India.
Inefficiencies in Ship Design and Process Engineering (B10): The inefficiencies are due to the fragmentation of the design process and a lack of research and development in the sector, leading to outdated designs and methodologies. The shortage of skilled engineers and designers in the shipbuilding industry also contributes to inefficiencies in ship design and development.
After selecting the ten most critical barriers to the shipbuilding industry, the panel was asked to perform pairwise comparisons among the barriers (see
Table 6).
5. Results and Sensitivity Analysis
5.1. Calculations
According to the definitions of triangular fuzzy numbers (TFNs) outlined in
Table 4, and using formulas in
Appendix A, the expert panel’s linguistic assessments were converted into fuzzy values (
Table 7). This process resulted in the development of 30 individual fuzzy assessment matrices. Defuzzification (Step 3 of the fuzzy DEMATEL methodology) was employed to construct the average initial direct-relation matrix and transform the fuzzy numbers into crisp values. The resulting average fuzzy initial direct-relation matrix for shipbuilding development barriers in India is presented in
Table 8.
Subsequently, formulas (Equations (A3) and (A4)) were utilised to establish a fuzzy normalised direct-relation matrix for the barriers (
Table 9). This matrix represents the average fuzzy normalised initial direct-relation matrix. Formula (A5) was then applied to determine the total direct-relation matrix displayed in
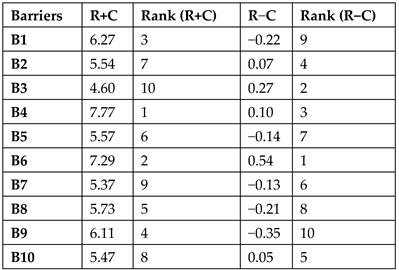
Table 10. Next, formulas (Equations (A6) and (A7)) were used to calculate the row sum (R) and column sum (C), respectively. These values offer insights into the cause-and-effect relationships between India’s barriers to shipbuilding development.
Subsequently, the datasets (R+C) and (R−C) were computed and presented in
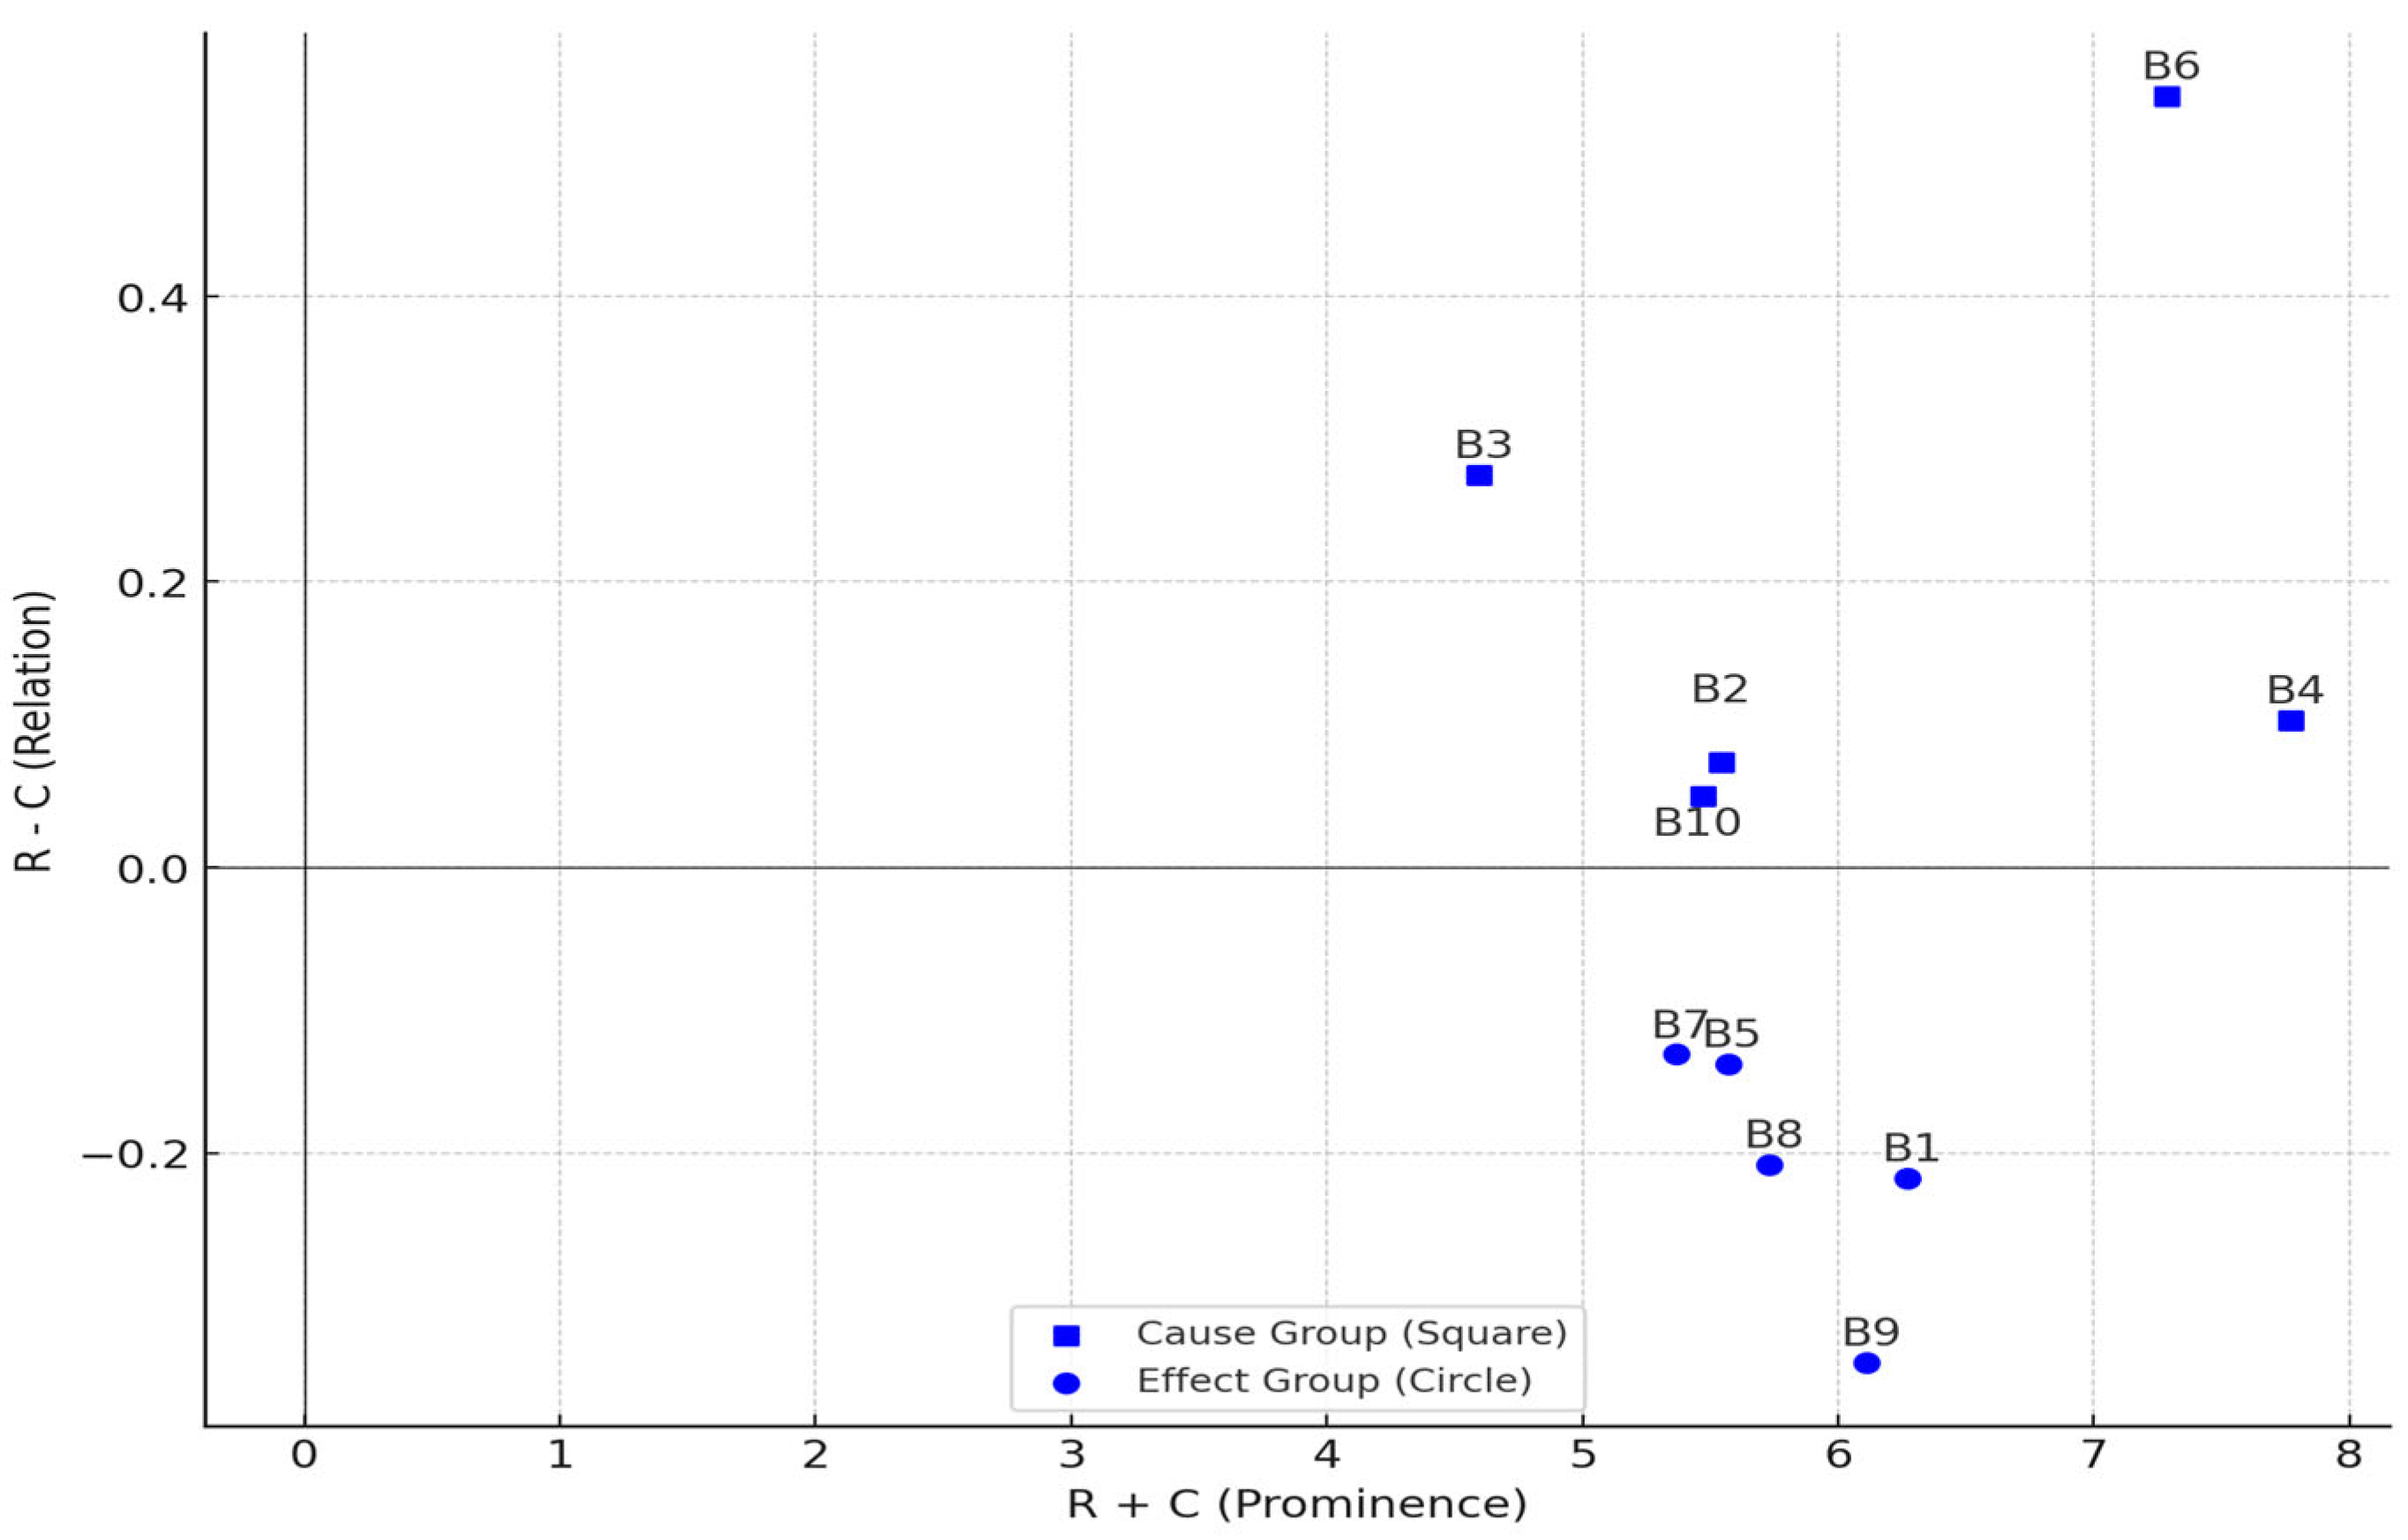
Table 11. The data from (R+C) and (R−C) were used to construct the cause-and-effect diagram in
Figure 1, which visually represents the causal relationships identified in the barriers.
The DEMATEL analysis reveals a clear distinction between causal and effect barriers in the Indian shipbuilding system. High raw material costs (B6) emerge as the most dominant causal factor, exerting a strong influence on multiple downstream constraints, including working capital stress, private-sector participation, and capacity utilisation. The total-relation matrix indicates that elevated raw material costs (B6) intensify working capital pressures (B4) and reduce incentives for private participation (B7), thereby constraining shipyard capacity expansion (B8). This transmission pathway highlights the upstream cost structure as a systemic driver. Policy responses to B6 may include incentives for domestic marine-grade steel production, tariff rationalisation, logistics cost reduction, and procurement aggregation mechanisms. High working capital requirements (B4), complex regulatory frameworks (B3), and inadequate policy support (B2) also fall in the causal group, indicating that cost, finance, and institutional design constitute the core structural drivers shaping sectoral performance. In contrast, barriers such as delays in obtaining clearances (B1), limited availability of skilled labour (B9), and constrained private shipyard capacity (B8) are primarily effect-type barriers, reflecting outcomes of upstream systemic weaknesses rather than independent sources of underperformance. This pattern suggests that policy interventions targeting surface-level operational issues are unlikely to yield sustained improvements unless underlying cost, financing, and regulatory drivers are addressed.
5.2. Sensitivity Analysis
Sensitivity analysis (SA) is essential as it tests whether model results remain stable under varying assumptions or expert weights, ensuring the robustness of MCDM outcomes. Studies applying fuzzy DEMATEL demonstrate that sensitivity checks strengthen the reliability of causal structures and minimise methodological bias [
13,
43,
44].
A sensitivity analysis was performed to assess the robustness of the results obtained from the preceding analysis. This involved evaluating variations in cause-and-effect relationships resulting from assigning different weights to industry experts. The primary objective was to examine the consistency of the decision-making process and detect any potential biases that may have influenced the outcomes. Sensitivity analysis confirms that the relative ranking and causal classification of barriers remain stable across alternative expert weighting scenarios, indicating the robustness of the findings.
Given the impracticality of conducting sensitivity runs for all possible weight combinations, arising from assigning two distinct weights to each expert, a more efficient approach was adopted. One expert from each participant domain (Experts 1–5) was assigned a higher weight, while the remaining experts were given equal weights. The specific weight allocations for each expert in each scenario are presented in
Table 12. The weighting scenarios represent stress tests simulating stakeholder dominance rather than probabilistic weights. The stability of rankings across runs indicates structural robustness.
6. Discussion and Policy Implications
This section interprets the results of the fuzzy DEMATEL analysis and translates the identified causal relationships into policy-relevant insights for the Indian shipbuilding sector. The discussion is anchored in the cause-and-effect structure derived from the DEMATEL model, with robustness confirmed through sensitivity analysis.
Figure 1 presents the cause-and-effect diagram of barriers to shipbuilding development in India, constructed using the R−C values derived from the total-relation matrix. The figure distinguishes between causal (influencing) barriers and effect (influenced) barriers, with barriers positioned on the positive side of the horizontal axis exerting a net influence on the system and those on the negative side largely shaped by upstream conditions. Also, as shown in
Figure 1, high raw material costs (B6) emerge as the most dominant causal barrier, exerting a strong influence across the system. This indicates that cost-related disadvantages are structural, affecting working capital availability, private-sector participation, and overall capacity utilisation. High working capital requirements (B4), complex regulatory frameworks (B3), and inadequate policy support (B2) also fall in the causal group, underscoring the central role of financial structure and institutional design in shaping sectoral outcomes.
In contrast, barriers such as delays in obtaining clearances (B1), limited availability of skilled labour (B9), and constrained private-sector shipyard capacity (B8) are placed in the effect group. Their location in the cause-and-effect diagram suggests that these challenges are largely outcomes of upstream cost, finance, and policy constraints rather than independent drivers of underperformance. This distinction is important for policy design, as it implies that interventions focused solely on administrative streamlining or workforce development are unlikely to yield sustained improvements unless foundational causal barriers are addressed simultaneously.
The causal structure revealed in
Figure 1 has direct implications for policy intervention. The dominance of high raw material costs (B6) points to the need for targeted measures to address the input cost disadvantages faced by Indian shipyards. International experience from leading shipbuilding nations such as China and South Korea shows that competitiveness has been supported through domestic sourcing of marine-grade steel, long-term procurement arrangements, and close integration between shipyards and upstream industries. In the Indian context, incentives for domestic production of shipbuilding inputs, preferential pricing mechanisms for shipyards, and improved logistics connectivity represent feasible short- to medium-term interventions.
High working capital requirements (B4) reflect financial vulnerability arising from long construction cycles and milestone-based payment structures. In established shipbuilding economies, similar constraints have been mitigated through state-backed credit facilities, export financing instruments, and risk-sharing mechanisms. Adapting these instruments to India would require shipbuilding-specific credit guarantee schemes, structured milestone financing, and greater involvement of public financial institutions. Such measures are institutionally feasible and can be implemented over a medium-term horizon.
Institutional constraints, represented by complex regulatory frameworks (B3) and inadequate policy support (B2), further inhibit long-term investment and capacity planning. Fragmented approval processes and time-bound incentive schemes generate uncertainty and discourage private participation. By contrast, the sustained competitiveness of China and South Korea has been underpinned by stable, long-term shipbuilding policies and coordinated industrial strategies. For India, regulatory simplification through a single-window clearance mechanism and articulation of a long-term shipbuilding roadmap aligned with national maritime and industrial visions would address these institutional frictions and improve investor confidence.
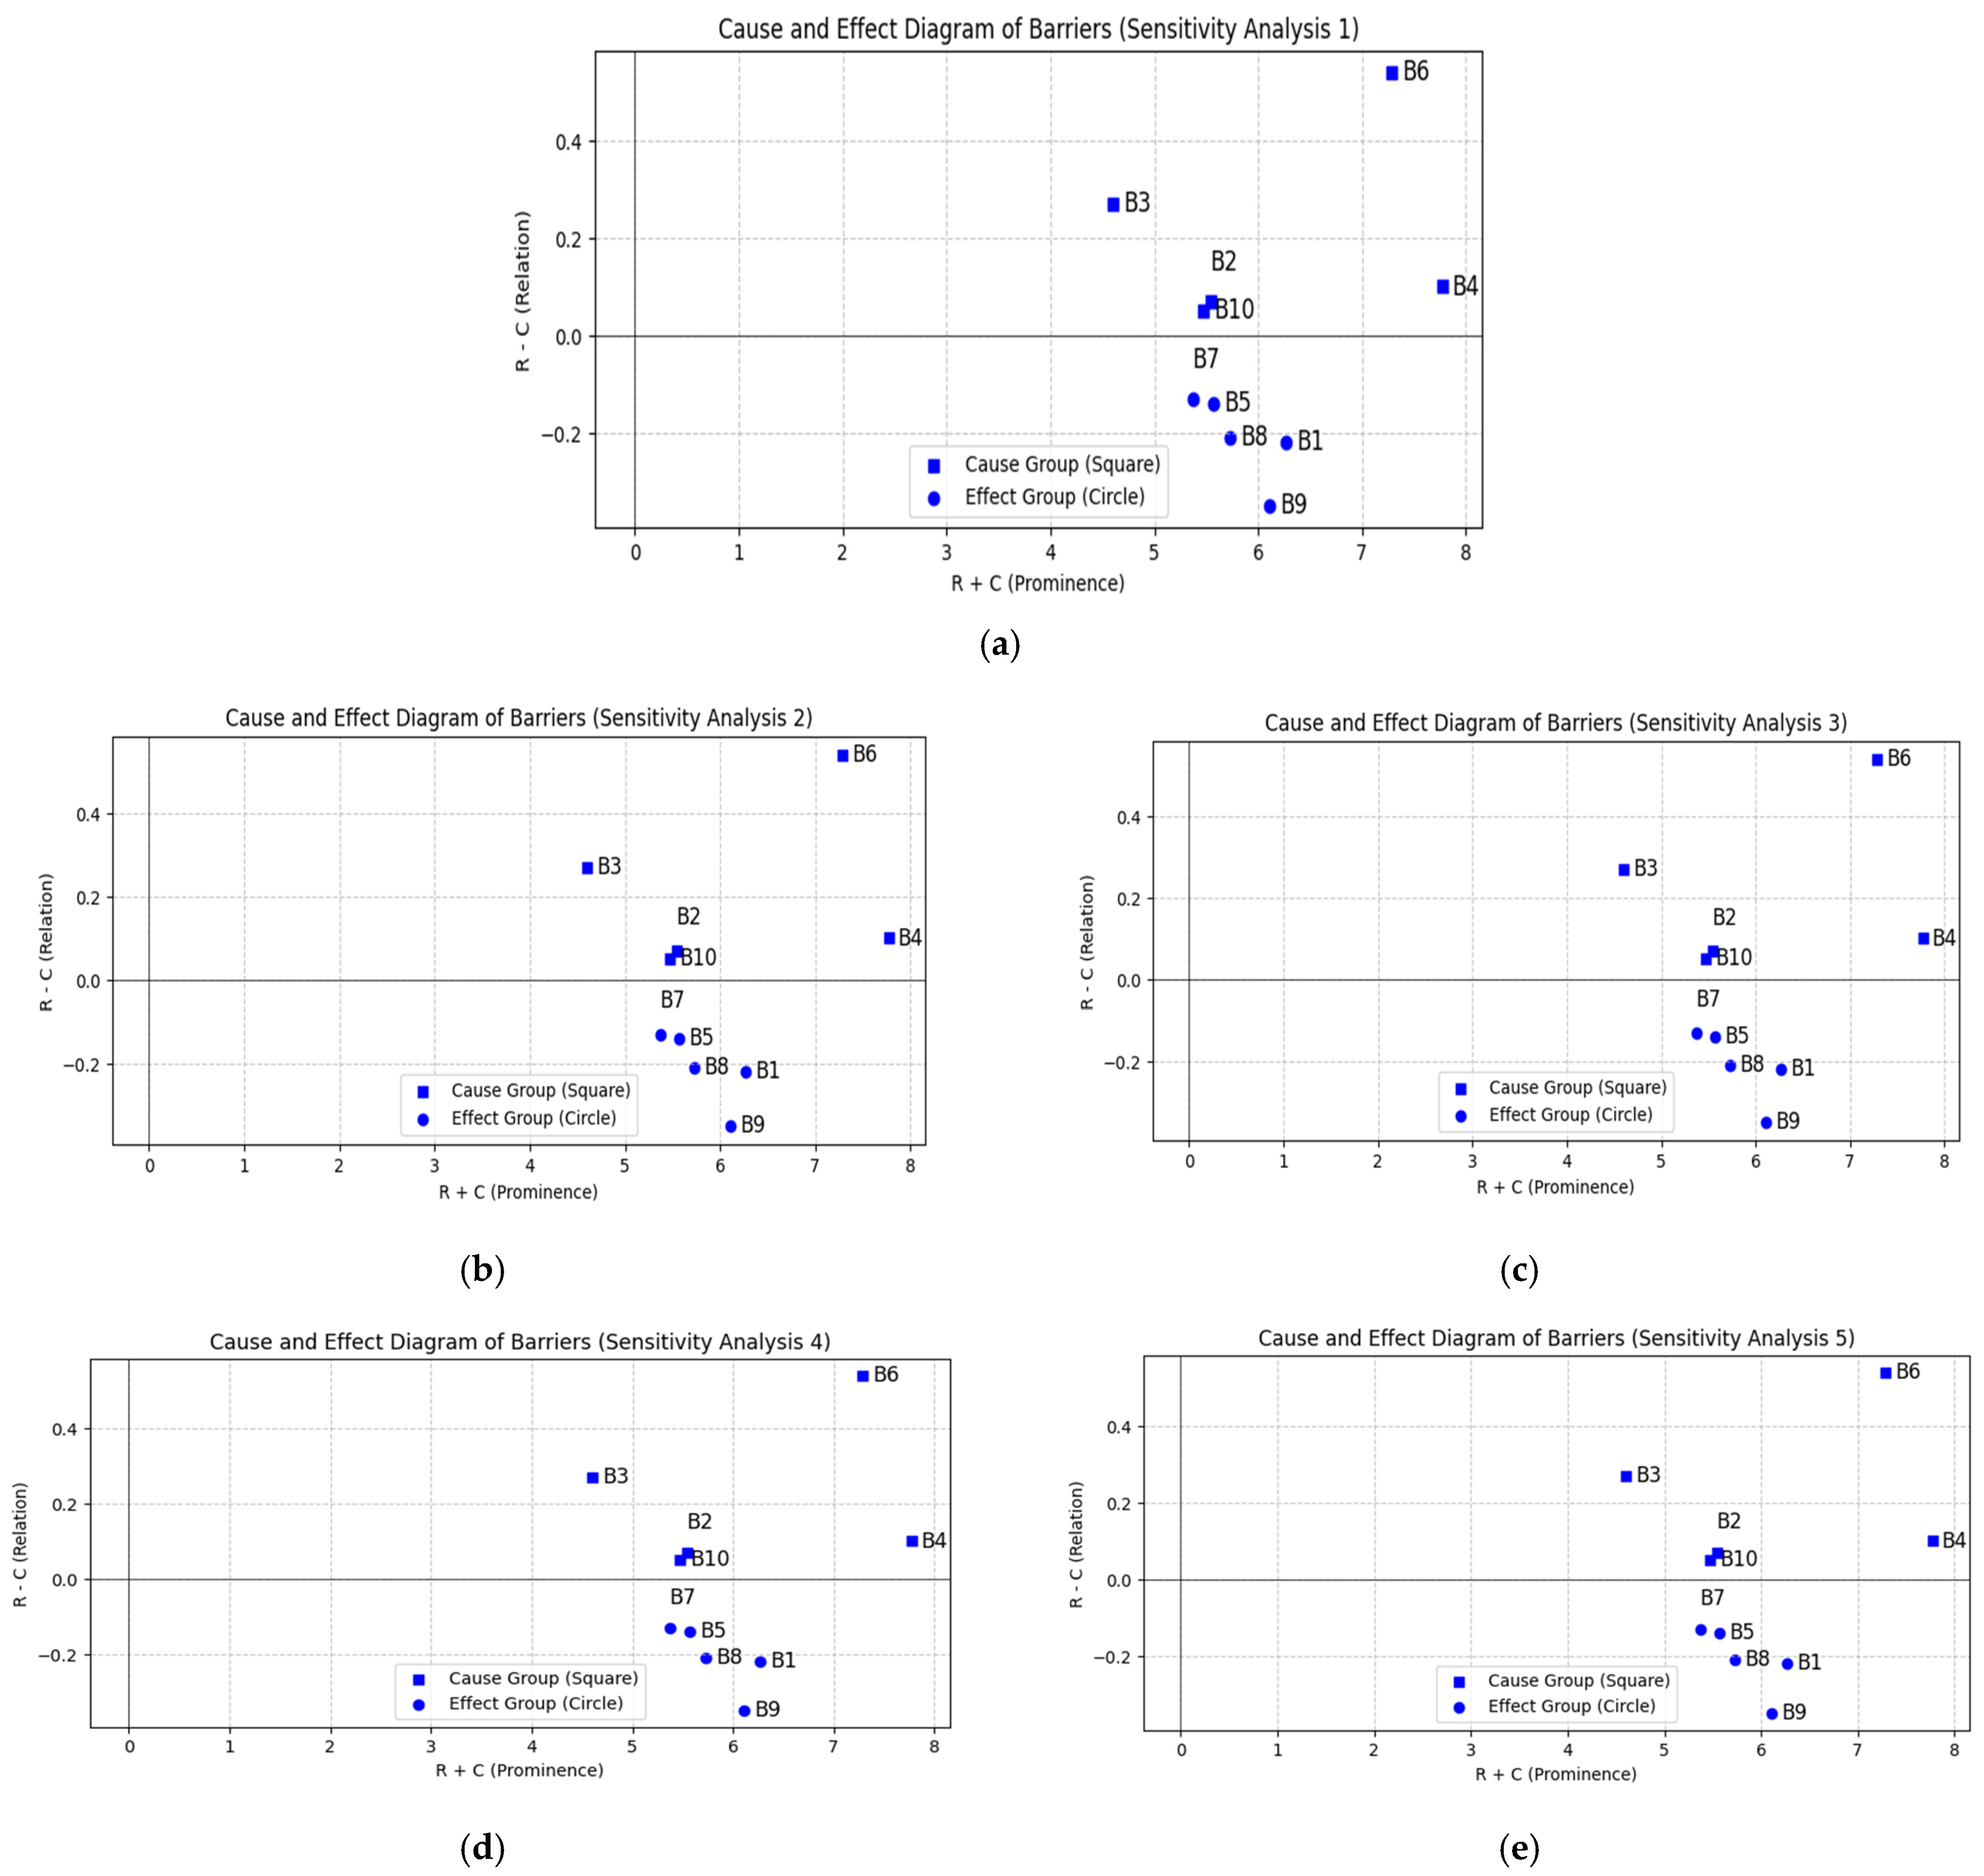
The robustness of the identified causal structure is assessed through sensitivity analysis.
Figure 2a–e present the results of multiple sensitivity runs conducted under alternative expert weighting scenarios. Across all sensitivity runs, the relative ranking and causal classification of barriers remain stable, with high raw material costs (B6) and high working capital requirements (B4) consistently identified as dominant causal drivers. This stability confirms that the results are not sensitive to variations in expert weighting and reinforces confidence in the policy relevance of the findings.
The integrated interpretation of
Figure 1 and
Figure 2 indicates that an effective shipbuilding policy in India requires a sequenced, coordinated approach. Short-term priorities should focus on regulatory clarity and targeted cost mitigation. Medium-term measures should strengthen access to finance and integrate supply chains, while longer-term strategies should concentrate on capacity expansion, skill development, and technological upgrading. By aligning policy interventions with the causal structure identified in
Figure 1 and supported by the robustness analysis in
Figure 2a–e, policymakers can move beyond fragmented initiatives and address the root causes of underperformance, thereby supporting sustained development of the Indian shipbuilding industry. The findings have implications beyond India for emerging shipbuilding economies facing similar cost structures and institutional constraints. The causal sequencing logic may inform policy prioritisation in comparable industrial contexts.
7. Conclusions
This study provides the first empirically grounded causal analysis of barriers to shipbuilding development in India by integrating expert consensus from the Delphi method with fuzzy DEMATEL-based causal mapping. Rather than treating constraints as isolated or independent factors, the analysis demonstrates that the performance of the Indian shipbuilding sector is shaped by a clearly defined causal structure. The findings indicate that a small set of upstream structural and institutional barriers exerts a disproportionate influence on sectoral outcomes. In particular, high raw material costs, inadequate policy support, and complex regulatory frameworks emerge as dominant causal drivers. At the same time, challenges such as skill shortages, inefficiencies in ship design and process engineering, and weak commercial demand are largely downstream effects. This distinction is critical, as it suggests that many commonly cited operational bottlenecks are symptoms of deeper systemic constraints rather than primary causes of underperformance.
From a policy perspective, the results point to the importance of prioritising interventions that address these upstream drivers. Reducing input cost disadvantages through incentives for domestic production of shipbuilding materials, improving access to finance by mitigating working capital constraints, and simplifying regulatory processes through coordinated and predictable approval mechanisms offer the most significant leverage for systemic improvement. Measures such as strengthening training institutions, promoting digitalisation in ship design and production processes, and expanding shipyard capacity remain necessary components of sectoral development. However, the analysis indicates that their effectiveness is contingent on progress in resolving foundational cost, financial, and institutional barriers. Taken together, the findings reinforce international evidence that Industry 4.0 technologies and productivity-enhancing innovations deliver meaningful gains only when embedded in coherent policy and institutional frameworks that reduce uncertainty and support long-term investment.
The study is subject to certain limitations that should be acknowledged. The analysis relies primarily on expert judgement collected through Delphi rounds, which, despite careful panel selection and convergence checks, may reflect subjective perceptions. Future studies may incorporate sector-based weighting or alternative defuzzification techniques for further robustness testing. In addition, the study does not include longitudinal performance data or quantitative benchmarking against leading global shipbuilding nations, limiting the ability to empirically validate the identified causal pathways. The focus on the Indian context also constrains the generalisability of the findings to other developing economies with different industrial and institutional characteristics.
Future research could address these limitations in several ways. Comparative applications of the Delphi–DEMATEL framework across emerging shipbuilding economies, including other BRICS countries, would help test the robustness of the causal structure identified in this study. Integrating econometric modelling or firm-level performance data could further strengthen causal inference by triangulating expert-based insights with quantitative evidence. Methodological extensions combining fuzzy DEMATEL with complementary techniques such as ISM or EDAS may also provide deeper insight into hierarchical relationships among barriers. Finally, as global shipbuilding increasingly aligns with sustainability transitions, future studies should explore how digitalisation, decarbonisation, and green shipbuilding practices interact with institutional and cost-related constraints to reshape competitiveness over time.
Author Contributions
Conceptualisation, R.K. and S.K.; methodology, R.K. and S.K.; software, R.K.; validation, R.K. and S.K.; formal analysis, R.K.; investigation, R.K.; resources, R.K. and S.K.; data curation, R.K.; writing—original draft preparation, R.K.; writing—review and editing, S.K.; visualisation, R.K. and S.K.; supervision, S.K.; project administration, R.K.; funding acquisition, S.K. All authors have read and agreed to the published version of the manuscript.
Funding
This research received no external funding.
Institutional Review Board Statement
Ethical review and approval were waived for this study by the Institution Committee due to the ICMR National Ethical Guidelines for Biomedical and Health Research Involving Human Participants (2017).
Informed Consent Statement
Verbal informed consent was obtained from all subjects involved in the study.
Data Availability Statement
The raw data supporting the conclusions of this article will be made available by the authors on request.
Acknowledgments
The authors acknowledge with gratitude the contributions of the 20 experts who participated in the Delphi rounds. During the preparation of this manuscript, the authors used Grammarly for the purposes of proofreading and grammar corrections. The authors have reviewed and edited the output and take full responsibility for the content of this publication.
Conflicts of Interest
The authors declare no conflicts of interest.
Abbreviations
The following abbreviations are used in this manuscript:
| ANP | Analytic Network Process |
| CAGR | Compound Annual Growth Rate |
| CRZ | Coastal Regulation Zone |
| DEMATEL | Decision Trial and Evaluation Laboratory |
| GT | Gross Tonnage |
| IRM | Impact Relation Map |
| ISM | Interpretive Structural Modelling |
| IVHF | Interval-Valued Hesitant Fuzzy |
| TFN | Triangular Fuzzy Number |
| USD | United States Dollar |
| SA | Sensitivity Analysis |
Appendix A
Computational Steps for Fuzzy DEMATEL
Step 1: Defining the Expert Panel and Assessment Criteria
Expert opinions are collected, and assessment criteria (barriers) are identified through the Delphi study to evaluate the Indian shipbuilding sector. A panel of experts is formed to evaluate the causal interdependencies between the finalised list of ten critical barriers.
Step 2: Constructing a Pairwise Fuzzy Comparison Matrix
A pairwise comparison is conducted to develop the initial direct-relation matrix using a linguistic scale. Scores are assigned based on expert opinions: 0 = No influence, 1 = Very low influence, 2 = Low influence, 3 = High influence, and 4 = Very high influence. These judgments are converted into triangular fuzzy numbers (TFNs) (
Table 3), denoted as
, to capture uncertainty.
Step 3: Obtaining the Fuzzy Initial Direct-Relation Matrix ()
The average fuzzy evaluation from the
experts is calculated to form the group fuzzy evaluation matrix:
To proceed with matrix operations, these values are defuzzified into crisp values (
) using the weighted average method:
Step 4: Normalising the Initial Direct-Relation Matrix ()
The crisp matrix
is normalised using factor (
) to ensure the system is bounded:
The normalised matrix is then computed as
Step 5: Constructing the Total-Relation Matrix ()
The total-relation matrix (
) accounts for both direct and indirect continuous influences among barriers and is computed using the identity matrix (
):
Step 6: Calculating the Sum of Rows () and Columns ()
The values of
and
offer insights into the causal relationships.
represents the total influence exerted by barrier
on other barriers, while
reflects the total influence received by barrier
:
Step 7: Interpreting Prominence and Relation (;
)
The final datasets provide the causal structure of the shipbuilding system. The
Prominence (): Indicates the overall significance of the barrier; high values suggest a core systemic constraint.
Relation (): If the value is positive, the barrier is a cause; if negative, it is an effect.
Table 11 presents the application of (R+C) and (R−C).
Appendix B
Instructions for Experts
You have received the list of 21 barriers (
Table 2) and are now requested to assess how strongly one barrier influences another barrier based on your professional experience and knowledge of the Indian shipbuilding sector. Please indicate the degree of influence using the following scale:
| Score | Interpretation |
| 0 | No influence |
| 1 | Very low influence |
| 2 | Low influence |
| 3 | High influence |
| 4 | Very high influence |
As the next step, from the selected 10 barriers (as at
Table 5), please assess the influence of each barrier (row) on the others (column) (
Table A1). Diagonal elements (same barrier) should be marked 0.
Table A1.
Pairwise influence evaluation matrix.
Table A1.
Pairwise influence evaluation matrix.
| From\To | B1 | B2 | B3 | B4 | B5 | B6 | B7 | B8 | B9 | B10 |
|---|
| B1 | 0 | | | | | | | | | |
| B2 | | 0 | | | | | | | | |
| B3 | | | 0 | | | | | | | |
| B4 | | | | 0 | | | | | | |
| B5 | | | | | 0 | | | | | |
| B6 | | | | | | 0 | | | | |
| B7 | | | | | | | 0 | | | |
| B8 | | | | | | | | 0 | | |
| B9 | | | | | | | | | 0 | |
| B10 | | | | | | | | | | 0 |
Your expert input is essential for identifying root causes and dependent barriers in India’s shipbuilding industry.
Thank you for your valuable time and contribution.
Appendix C
Table A2.
Details of participants’ profiles.
Table A2.
Details of participants’ profiles.
| Serial No. | Affiliation/Expertise | Designation/Position # | Years of Experience |
|---|
| 1 | Academia | Professor of Maritime Economy | 25 |
| 2 | Academia | Professor of Logistics and Supply Chain | 23 |
| 3 | Government | Senior Port Planner (Major Port) | 13 |
| 4 | Government | Chief Port Planner (Major Port) | 13 |
| 5 | Maritime Consultancy & Research | Senior Port Planner (Management Consulting) | 11 |
| 6 | Maritime Consultancy & Research | Senior Maritime Consultant | 22 |
| 7 | Port & Terminal Operations | Port Officer | 14 |
| 8 | Port & Terminal Operations | Port Operations Manager | 12 |
| 9 | Procurement & Supply Chain | Procurement Head | 15 |
| 10 | Procurement & Supply Chain | Chief Procurement Officer | 18 |
| 11 | Procurement & Supply Chain | Vice President—Procurement | 14 |
| 12 | Shipbuilding & Ship Repair | Head of Shipyard Operations | 19 |
| 13 | Shipbuilding & Ship Repair | Director (Shipbuilding) | 15 |
| 14 | Shipbuilding & Ship Repair | Marine Engineer | 15 |
| 15 | Shipbuilding & Ship Repair | Naval Architect | 17 |
| 16 | Shipbuilding & Ship Repair | Head of Ship Repair Division | 10 |
| 17 | Shipping & Logistics | General Manager, Corporate Affairs | 13 |
| 18 | Shipping & Logistics | Head of Maritime Logistics | 17 |
| 19 | Shipping & Logistics | Chief Executive Officer | 20 |
| 20 | Shipping & Logistics | Director of Transportation | 16 |
References
- Agarwala, N. Shipbuilding legacy in India under the Wadia family. Aust. J. Marit. Ocean Aff. 2023, 15, 69–88. [Google Scholar] [CrossRef] [Scilit]
- Tripati, S.; Shukla, S.R.; Shashikala, S.; Sardar, A. Teak (Tectona grandis L.F.): A preferred timber for shipbuilding in India, as evidenced from shipwrecks. Curr. Sci. 2016, 110, 2160–2165. [Google Scholar] [CrossRef] [Scilit]
- Sataravala, S. Parsi identity: Myth and collective memories. South Asia Res. 2022, 43, 34–48. [Google Scholar] [CrossRef] [Scilit]
- Rao, P.S.; Jayasree, P. Evaluation of IIOT-based Pd-MaaS using CNN with ensemble subspace discriminate—For Indian ship building in maritime industry. Int. J. Electr. Electron. Res. 2023, 11, 103–111. [Google Scholar] [CrossRef] [Scilit]
- Para-González, L.; Mascaraque-Ramírez, C. The six dimensions of CSR as a driver of key results in the shipbuilding industry. Corp. Soc. Responsib. Environ. Manag. 2020, 27, 576–584. [Google Scholar] [CrossRef] [Scilit]
- Hossain, K.A. Analysis of important steering factors which give success to global shipbuilding leaders. Recent Adv. Petrochem. Sci. 2018, 4, 555650. [Google Scholar] [CrossRef] [Scilit]
- Lawson, G. The rise of modern international order. In The Globalization of World Politics; Oxford University Press: Oxford, UK, 2016. [Google Scholar]
- Garg, A. Comparison of demographic changes in shipbuilding industry in India & China. Glob. J. Eng. Sci. 2020, 5, 000609. [Google Scholar] [CrossRef] [Scilit]
- Jaison, M. Towards greater shipbuilding supply chain surplus in India—A review. Ind. Eng. J. 2021, 14, 5–14. [Google Scholar]
- Al Amri, F.S. Study of technologies and processes in shipbuilding industry. Int. J. Multidiscip. Curr. Res. 2018, 6, 101–102. [Google Scholar] [CrossRef] [Scilit]
- Kamola-Cieslik, M. Changes in the global shipbuilding industry on the examples of selected states worldwide in the 21st century. Eur. Res. Stud. J. 2021, 24, 98–112. [Google Scholar] [CrossRef] [Scilit]
- Hadžić, N.; Kozmar, H.; Tomić, M. Feasibility of investment in renewable energy systems for shipyards. Brodogradnja 2018, 69, 1–16. [Google Scholar] [CrossRef] [Scilit]
- Gavalas, D.; Syriopoulos, T.; Tsatsaronis, M. Assessing key performance indicators in the shipbuilding industry: An MCDM approach. Marit. Policy Manag. 2022, 49, 463–491. [Google Scholar] [CrossRef] [Scilit]
- Hossain, K.A.; Zakaria, N.M.G. A study on global shipbuilding growth, trend and future forecast. Procedia Eng. 2017, 194, 247–253. [Google Scholar] [CrossRef] [Scilit]
- Abdel-Khalek, G.; Mazloum, M.G.; El Zeiny, M.R.M. Military expenditure and economic growth: The case of India. Rev. Econ. Political Sci. 2020, 5, 116–135. [Google Scholar] [CrossRef] [Scilit]
- An, Y. Effect of abnormal earnings on earnings persistence: The case of shipping and shipbuilding industry. KMI Int. J. Marit. Aff. Fish. 2022, 14, 77–90. [Google Scholar] [CrossRef] [Scilit]
- Stanić, V.; Hadjina, M.; Fafandjel, N.; Matulja, T. Toward Shipbuilding 4.0—An Industry 4.0 changing the face of the shipbuilding industry. Brodogradnja 2018, 69, 111–128. [Google Scholar] [CrossRef] [Scilit]
- Aghion, P.; Burgess, R.; Redding, S.; Zilibotti, F. The Unequal Effects of Liberalisation: Evidence from Dismantling the License Raj in India; NBER Working Paper No. 12031; National Bureau of Economic Research: Cambridge, MA, USA, 2006. [Google Scholar] [CrossRef] [Scilit]
- Wada, Y.; Hamada, K.; Hirata, N. Shipbuilding capacity optimization using shipbuilding demand forecasting model. J. Mar. Sci. Technol. 2022, 27, 522–540. [Google Scholar] [CrossRef] [Scilit]
- Arıcan, O.H.; Toprakçı, O.; Ünal, A.U.; Özbağ, G.K. Analyzing Carbon Regulation Impacts on Maritime Sector Using Fuzzy Delphi–DEMATEL–ISM Approach. Systems 2025, 13, 955. [Google Scholar] [CrossRef] [Scilit]
- Jalali, M.; Feng, B.; Feng, J. An Analysis of Barriers to Sustainable Supply Chain Management Implementation: The Fuzzy DEMATEL Approach. Sustainability 2022, 14, 13622. [Google Scholar] [CrossRef] [Scilit]
- 22. Ministry of Ports, Shipping and Waterways (MoPSW). Statistics of India’s Ship Building and Ship Repairing Industry; Government of India: New Delhi, India, 2025. [Google Scholar]
- Organisation for Economic Co-operation and Development (OECD). The Role of Shipbuilding in Maritime Decarbonisation; OECD Publishing: Paris, France, 2025. [Google Scholar] [CrossRef] [Scilit]
- United Nations Conference on Trade and Development (UNCTAD). Review of Maritime Transport 2024; United Nations: Geneva, Switzerland, 2024. [Google Scholar] [CrossRef] [Scilit]
- Zaostrovskikh, E.A. Global shipbuilding market: Trends and development prospects. Russ. J. Water Transp. 2023, 76, 132–140. [Google Scholar] [CrossRef] [Scilit]
- Thangam, K.M.; Sureshkumar, D. Competitiveness of Indian ship building industry. Int. J. Innov. Res. Dev. 2015, 4, 18–25. [Google Scholar]
- Barwick, P.J.; Kalouptsidi, M.; Bin Zahur, N. Industrial policy implementation: Empirical evidence from China’s shipbuilding industry. Rev. Econ. Stud. 2025, 92, 3611–3648. [Google Scholar] [CrossRef] [Scilit]
- Tan, S.K. State Support and Competitiveness of Industry: Case of Shipbuilding Industry in Korea. Int. J. East Asian Stud. 2020, 9, 48–60. [Google Scholar] [CrossRef] [Scilit]
- Hassink, R.; Shin, D. South Korea’s Shipbuilding Industry: From a Couple of Cathedrals in the Desert to an Innovative Cluster. Asian J. Technol. Innov. 2005, 13, 133–155. [Google Scholar] [CrossRef] [Scilit]
- Ministry of Ports, Shipping and Waterways. Maritime India Vision 2030; Government of India: New Delhi, India, 2021. Available online: https://shipmin.gov.in/sites/default/files/MIV%202030%20Report.pdf (accessed on 1 January 2026).
- Ministry of Ports, Shipping and Waterways (MoPSW). Maritime Amrit Kaal Vision 2047; Government of India: New Delhi, India, 2023. [Google Scholar]
- Finextra. The Indian Shipbuilding Market—Top Player Analysis and Future Outlook. Finextra Research 2024. Available online: https://www.finextra.com/blogposting/26207/the-indian-shipbuilding-market--top-player-analysis-and-future-outlook (accessed on 3 January 2026).
- Gourdon, K.; Steidl, C. Global Value Chains and the Shipbuilding Industry. OECD Trade Policy Papers 2019. Available online: https://www.oecd.org/officialdocuments/publicdisplaydocumentpdf/?cote=TAD/TC/WP(2018)15/FINAL&docLanguage=En (accessed on 3 January 2026).
- Centre for Maritime Economy and Connectivity (CMEC); Research and Information System for Developing Countries (RIS). Uniting Oceans, One Maritime Vision: India’s Maritime Strides (India Maritime Report 2025-26); RIS: New Delhi, India, 2025; Available online: https://ris.org.in/sites/default/files/Publication/CMEC_Maritime_Report.pdf (accessed on 4 January 2026).
- Kumbar, V.; Hiremath, S.M. Envisioning the Future of Indian Logistics. Int. J. Multidiscip. Res. 2023, 5. [Google Scholar] [CrossRef]
- Dixit, V.; Tiwari, M.K. Learning Curve Based Integrated Procurement and Project Scheduling of Multiple Sister Ships Project. Comput. Ind. Eng. 2021, 162, 107691. [Google Scholar] [CrossRef] [Scilit]
- Jacob, G.; Bhatta, N.M.K. Factors Influencing Self-Reliance in Defence Capabilities of India: A Systematic Literature Review. J. Manag. Entrep. 2024, 18, 9–25. [Google Scholar] [CrossRef] [Scilit]
- Si, S.-L.; You, X.-Y.; Liu, H.-C.; Zhang, P. DEMATEL Technique: A Systematic Review of the State-of-the-Art Literature on Methodologies and Applications. Math. Probl. Eng. 2018, 2018, 3696457. [Google Scholar] [CrossRef] [Scilit]
- Fontela, E.; Gabus, A. The DEMATEL Method: A New Approach to Analyze and Solve Complex Problems; Battelle Memorial Institute, Geneva Research Centre: Geneva, Switzerland, 1976. [Google Scholar]
- Quiñones, R.S.; Caladcad, J.A.A.; Himang, C.M.; Quiñones, H.G.; Castro, C.J.; Caballes, S.A.A.; Abellana, D.P.M.; Jabilles, E.M.Y.; Ocampo, L.A. Using Delphi and Fuzzy DEMATEL for Analyzing the Intertwined Relationships of the Barriers of University Technology Transfer: Evidence from a Developing Economy. Int. J. Innov. Stud. 2020, 4, 85–104. [Google Scholar] [CrossRef] [Scilit]
- Seker, S.; Recal, F.; Basligil, H. A Combined DEMATEL and Grey System Theory Approach for Analyzing Occupational Risks: A Case Study in Turkish Shipbuilding Industry. Hum. Ecol. Risk Assess. 2017, 23, 1340–1372. [Google Scholar] [CrossRef] [Scilit]
- Demirci, S.E.; Canımoğlu, R.; Elçiçek, H. Analysis of causal relations of marine accidents during ship navigation under pilotage: A DEMATEL approach. Proc. Inst. Mech. Eng. Part M J. Eng. Marit. Environ. 2023, 237, 308–321. [Google Scholar] [CrossRef] [Scilit]
- Wan, Z.; Nie, A.; Chen, J.; Ge, J.; Zhang, C.; Zhang, Q. Key barriers to the commercial use of the Northern Sea Route: View from China with a fuzzy DEMATEL approach. Ocean Coast. Manag. 2021, 208, 105630. [Google Scholar] [CrossRef] [Scilit]
- U-Dominic, C.M.; Orji, I.J.; Okwu, M. Analyzing the barriers to reverse logistics (RL) implementation: A hybrid model based on IF-DEMATEL-EDAS. Sustainability 2021, 13, 10876. [Google Scholar] [CrossRef] [Scilit]
- Rajak, S.; Parthiban, P.; Dhanalakshmi, R. Analysing barriers of sustainable transportation systems in India using Grey-DEMATEL approach: A supply chain perspective. Int. J. Sustain. Eng. 2021, 14, 419–432. [Google Scholar] [CrossRef] [Scilit]
- Srivastava, S.K.; Narkhede, B.E.; Raut, R.D.; Mishra, N.K. Examination of adoption barriers of digitalization of maritime logistics: A DEMATEL approach. J. Model. Manag. 2025. Online ahead of print. [CrossRef] [Scilit]
- Grisham, T. The Delphi technique: A method for testing complex and multifaceted topics. Int. J. Manag. Proj. Bus. 2009, 2, 112–130. [Google Scholar] [CrossRef] [Scilit]
- Avella, J.R. Delphi panels: Research design, procedures, advantages, and challenges. Int. J. Dr. Stud. 2016, 11, 305–321. [Google Scholar] [CrossRef] [Scilit]
- Thakkar, J.J. Decision-Making Trial and Evaluation Laboratory (DEMATEL). In Multi-Criteria Decision-Making Models for Supply Chain Excellence; Springer: Singapore, 2021; pp. 139–159. [Google Scholar] [CrossRef] [Scilit]
- Buckley, J.J. Fuzzy hierarchical analysis. Fuzzy Sets Syst. 1985, 17, 233–247. [Google Scholar] [CrossRef] [Scilit]
- Zadeh, L.A. Fuzzy sets. Inf. Control 1965, 8, 338–353. [Google Scholar] [CrossRef] [Scilit]
- Lam, J.S.L.; Bai, X. A quality function deployment approach to improve maritime supply chain resilience. Transp. Res. Part E Logist. Transp. Rev. 2016, 92, 16–27. [Google Scholar] [CrossRef] [Scilit]
- Notteboom, T.; Pallis, A.; Rodrigue, J.-P. Port Economics, Management and Policy; Routledge: London, UK, 2021. [Google Scholar]
| Disclaimer/Publisher’s Note: The statements, opinions and data contained in all publications are solely those of the individual author(s) and contributor(s) and not of MDPI and/or the editor(s). MDPI and/or the editor(s) disclaim responsibility for any injury to people or property resulting from any ideas, methods, instructions or products referred to in the content. |