1. Introduction
Foreign trade constitutes a fundamental component of economic activity in developing countries, providing not only a mechanism for the exchange of goods but also a significant source of fiscal revenue through import-related taxation [
1,
2]. In Ecuador, this relevance is reflected in the scale of import activity: during 2023–2024, non-oil imports exceeded USD 22 billion, representing a substantial share of trade flows and a key base for customs revenue collection [
3,
4]. In this context, customs systems play a central role in public finance, as import duties and associated taxes are typically calculated on the basis of the customs value (CIF), which incorporates the cost of goods, freight, and insurance. Consequently, variations in logistics costs directly affect the taxable base and, therefore, government revenue collection [
5,
6].
Beyond its fiscal function, foreign trade also supports productive processes and facilitates the integration of firms into global value chains. However, recent research highlights that global trade systems are increasingly shaped by logistics performance and supply chain structures, where transportation efficiency, infrastructure quality, and connectivity significantly influence trade outcomes [
7,
8]. In this sense, logistics is not merely an operational activity but a strategic determinant of both economic competitiveness and fiscal performance.
Despite this relevance, revenue generated by import operations is not uniform. Logistical and operational factors significantly influence customs valuation and, therefore, the tax base on which duties and related taxes are assessed and collected. Under international standards, customs valuation is primarily based on the CIF principle, which incorporates the cost of goods, transport, and insurance up to the point of importation [
9,
10]. Empirical evidence indicates that international transport and insurance costs represent, on average, around 4–5% of the CIF value of imports, highlighting their non-negligible impact on customs valuation and fiscal outcomes [
10]. Moreover, transport costs depend on structural factors such as distance, infrastructure quality, trade volumes, and logistics efficiency [
5,
11], which significantly influence both trade patterns and cost. Since these costs vary systematically across maritime, air, and land transport, differences in transport mode generate structural variations in customs value and, consequently, in the level of revenue collected.
From a broader perspective, international trade systems exhibit significant levels of concentration across transport modes, routes, and logistics nodes. Global evidence shows that transport and logistics costs are unevenly distributed across regions and trade corridors, reflecting structural asymmetries in infrastructure, connectivity, and accessibility [
10]. This uneven distribution reinforces the concentration of trade flows in specific modes and nodes, which has been widely associated with increased systemic vulnerability in supply chains [
12,
13]. In highly concentrated systems, dependence on a limited number of logistics channels amplifies exposure to disruptions, as shocks affecting critical nodes can propagate rapidly through interconnected supply chains [
14].
In this context, the relationship between logistics structure and fiscal performance becomes particularly relevant. The mode of transport not only determines transit times and logistics costs but also shapes the composition of the customs value, influencing the amount of taxes collected. Because customs valuation directly incorporates transport-related costs, any structural dependency on specific logistics configurations translates into fiscal sensitivity. In highly centralized systems, disruptions affecting dominant modes or nodes may therefore generate disproportionate impacts on both trade operations and revenue collection [
14,
15].
During 2023–2024, Ecuador’s international trade experienced significant variation linked to external demand, transport costs, the availability of logistics routes, and changes in domestic regulations. These dynamics are consistent with global evidence showing that international transport and insurance costs fluctuate significantly over time, particularly in response to major disruptions in global supply chains [
10]. Such variability reinforces the need to examine, comparatively, how different transport modes influence the structure of customs value and import-related tax performance.
This issue is also regionally relevant, as Ecuador is part of strategic trade corridors along the Pacific coast, where transport efficiency and logistics configuration directly influence business competitiveness and the State’s capacity to capture fiscal revenues. In such contexts, trade costs—closely linked to logistics performance and customs processes—play a decisive role in shaping both economic outcomes and fiscal capacity [
11,
15,
16,
17], particularly in developing economies, where trade taxation remains a relevant component of fiscal capacity [
18].
Trade costs—closely linked to logistics performance and customs processes—play a decisive role in shaping both economic outcomes and fiscal capacity.
Despite the growing body of research on logistics performance, trade costs, and supply chain resilience, these dimensions are typically examined in isolation. Existing approaches tend to analyze physical trade flows, transport costs, or fiscal outcomes separately, without capturing how their interaction shapes structural dependence and system-level vulnerability. As a result, conventional trade statistics and logistics indicators provide only a partial view of import systems, failing to reveal how reliance on specific transport modes and nodes translates into concentrated fiscal exposure under conditions of disruption.
To address this limitation, this study proposes using customs revenue—disaggregated by transport mode and customs district—as an operational–fiscal proxy that integrates logistics costs, routing decisions, and territorial concentration within a single analytical framework. Unlike traditional indicators, this approach captures the joint effect of logistics structure and fiscal outcomes, enabling the identification of critical nodes and structural dependencies that remain hidden in standard trade or transport analyses. In this sense, the study advances a novel perspective for assessing disruption exposure in import-dependent economies.
Accordingly, this study provides a structural and diagnostic assessment of Ecuador’s import logistics system by analyzing customs revenue as an operational–fiscal proxy. Specifically, it aims to (i) identify the relative contribution of logistics components to import value, (ii) characterize customs valuation structures associated with each transport mode, and (iii) analyze differences in the collection of import-related taxes, with a focus on concentration patterns and disruption exposure.
This study does not aim to model long-term dynamics or estimate causal relationships. Instead, it adopts an exploratory approach to identify structural patterns of concentration and potential exposure to disruption using recent administrative data.
To outline, this paper consists of six sections.
Section 2 presents the theoretical framework, discussing the relationships among logistics systems, concentration, and disruption exposure, as well as the roles of customs valuation and transport modes in shaping fiscal performance.
Section 3 describes the data, analytical design, and methodological approach, including the use of the Herfindahl–Hirschman Index (HHI) and the scenario-based stress-testing framework.
Section 4 presents the empirical results, including the analysis of customs revenue by district and transport mode, concentration patterns, and scenario outcomes.
Section 5 discusses the findings in relation to the literature, highlighting their implications for logistics resilience and fiscal vulnerability, as well as the study’s limitations. Finally,
Section 6 concludes the paper by summarizing the main findings, outlining policy implications, and suggesting directions for future research.
3. Materials and Methods
3.1. Data and Analytical Design
The study is based on official administrative data from the National Customs Service of Ecuador (SENAE) [
28], covering the full census of import-for-consumption declarations (Regime 10) for 2023–2024. The dataset represents the complete universe of recorded import operations, corresponding to national import flows exceeding USD 22 billion during the study period.
The revenue analyzed corresponds to amounts effectively liquidated in customs declarations, thereby incorporating the effects of tariff preferences, exemptions, and applicable regulatory conditions. Accordingly, the analysis focuses on effective revenue rather than potential or counterfactual estimates.
The unit of analysis is customs revenue (USD), aggregated by transport mode (maritime, air, and land) and by customs district. The analytical approach is descriptive and comparative, focusing on the distribution of customs revenue across modes and districts. Data processing involved (i) aggregation of revenue by transport mode and customs district, (ii) calculation of relative shares within each mode, and (iii) identification of structural concentration patterns. This design allows a consistent characterization of logistics dependence and its implications for disruption exposure.
All calculations—including revenue aggregation, share estimation, Herfindahl–Hirschman Index (HHI) computation, and scenario-based indicators (total loss, absolute and relative change, and concentration variation)—were performed using standard spreadsheet-based analytical procedures. Given the deterministic and accounting-based nature of the analysis, the results are fully replicable using equivalent implementations in common analytical environments.
3.2. Analytical Framework: Concentration and Disruption Exposure
To operationalize disruption exposure comparably, the analysis focuses on concentration patterns rather than on causal inference. Concentration metrics are well-suited for resilience-oriented diagnostics because they capture single-point dependencies and the degree of diversification within a system. Accordingly, the study quantifies the extent to which customs revenue is dominated by specific districts within each transport mode, enabling an assessment of whether the logistics system exhibits redundancy (more distributed revenue shares) or fragility (dominance by one or a few districts).
Within this research, the HHI is interpreted functionally as an indicator of structural vulnerability. Higher HHI values imply that customs revenue is concentrated in a limited number of districts, indicating stronger dependence on specific logistics gateways and, therefore, greater sensitivity to disruptions affecting those nodes (e.g., congestion, infrastructure failures, extreme weather events, security incidents, or regulatory interruptions). Conversely, lower HHI values reflect a more distributed structure, suggesting greater territorial diversification and potential resilience through alternative routing and operational flexibility.
3.3. Measurement of Concentration: Herfindahl–Hirschman Index (HHI)
To assess the degree of concentration of customs revenue by district within each mode of transport, the Herfindahl–Hirschman Index (HHI) is used, as it is widely applied as a synthetic measure of structural concentration. This indicator enables identification of a system’s dependence on a limited number of agents or territorial units and is applicable not only to markets but also to the analysis of concentration in economic and logistics flows [
29]. For this purpose, the unit of analysis and data structure were defined as follows:
Unit: pair (mode m—district d) by year (t = 2023, 2024).
Base variable: effective revenue (USD) aggregated by district and mode (and optionally by type of tax), consistent with the use of amounts effectively liquidated in declarations.
The calculation procedure is defined as follows
- 2.
The district share within each mode is then determined as
- 3.
And the HHI by mode and year is computed as
The use of the Herfindahl–Hirschman Index (HHI) as a standard concentration metric based on shares is consistent with its widespread application in economic and logistics analyses, where it serves as a synthetic indicator of how activity is distributed across units. As a summary measure, the HHI captures the degree of concentration by aggregating the squared shares of each unit, providing a parsimonious representation of structural dependence within a system [
30].
3.4. Scope, Assumptions, and Limitations of the Concentration Analysis
The Herfindahl–Hirschman Index (HHI) is used in this study as a static measure of concentration to characterize the distribution of customs revenue across transport modes and districts. As a summary indicator, it captures structural dependence at a given point in time but does not account for temporal dynamics, behavioral responses, or structural adjustments.
The analysis focuses on the 2023–2024 period, which provides a recent snapshot of the logistics system. While this short time horizon does not allow the identification of long-term trends, it is suitable for detecting current concentration patterns and potential single-point vulnerabilities.
In addition, the analysis is based on aggregated administrative data, which does not allow explicit modeling of underlying determinants such as infrastructure capacity, trade flows, or logistics performance. Therefore, the results should be interpreted as a structural and diagnostic assessment rather than as evidence of causal relationships.
Under this framework, higher HHI values indicate greater concentration and potential vulnerability to node-specific disruptions, whereas lower values reflect a more distributed structure and greater potential resilience.
3.5. Scenario Design: Stress-Testing Approach
To complement the concentration diagnostics, the study includes static, accounting-based scenario simulations used as simplified stress tests. These scenarios do not model firms’ or carriers’ behavioral responses, nor do they estimate causal effects. Instead, they examine how fiscal outcomes and concentration profiles could change under hypothetical disruption-like conditions and controlled assumptions [
21]. In this sense, their purpose is illustrative rather than predictive, providing a transparent way to assess the system’s sensitivity to modal shifts or proportional shocks when detailed micro-level data are unavailable. This approach is consistent with the literature that uses modal reallocation scenarios as an analytical tool to explore the potential implications of logistics policies when full structural models require additional information [
31].
Specifically, the exercise evaluates how total revenue and its territorial/modal distribution would change under: (i) modal redistribution between maritime, air, and land transport and/or (ii) a proportional shock applied to the revenue base associated with a mode or a district, as an approximation of aggregated logistics impacts.
3.6. Scenario Specification and Implementation
The base scenario (B) is defined as the observed values (by year), which serve as the comparison baseline.
Scenario A: Modal redistribution (accounting shift)
A vector of changes by mode is defined as
such that
Example: , , .
- 4.
For implementation, total national revenue in year t is computed as
- 5.
The new total by mode is then
- 6.
District-level reallocation within each mode, keeping the territorial structure constant (constant shares), is computed as
- 7.
Outputs: (if applicable), changes by mode and by district, and concentration comparison (recompute ).
- 8.
Scenario B: Proportional logistics shock by mode or district
A shock factor
is defined and applied to a mode (or district). For example, an increase in costs or a disruption reducing effective revenue for a mode:
for maritime transport.
This enables fiscal stress scenarios to be constructed and assessed in terms of
The coefficients used in Scenarios A and B are defined as controlled proportional parameters intended to simulate plausible adjustments in the logistics system under simplified conditions. In Scenario A, the magnitude of modal redistribution (e.g., 2–5%) was intentionally chosen to represent moderate, policy-relevant shifts in transport allocation, thereby avoiding extreme or unrealistic changes that could distort the structural interpretation of the results. In Scenario B, the shock factors (e.g., −10%) are specified as stylized disturbances applied to dominant modes or districts, serving as illustrative approximations of aggregate disruption impacts.
These coefficients are not empirically estimated parameters and do not reflect the behavioral responses of firms or carriers. Instead, they serve as analytical inputs within an accounting-based stress-testing framework, enabling a transparent and comparable evaluation of how concentration patterns translate into fiscal sensitivity under controlled assumptions. This approach prioritizes interpretability and diagnostic value over predictive accuracy, consistent with the exploratory nature of the study.
3.7. Impact Evaluation Metrics
For each scenario k:
3.8. Integrated Analytical Strategy
Overall, the methodological strategy combines (i) descriptive and comparative analysis of observed customs revenue by mode and district, (ii) concentration measurement through the Herfindahl–Hirschman Index (HHI) to diagnose structural dependence patterns, and (iii) static scenario-based stress testing to examine how modal shifts or proportional shocks may affect total revenue, its territorial distribution, and concentration levels. As a widely used summary indicator, the HHI provides a parsimonious representation of how activity is distributed across units, making it particularly suitable for identifying structural concentration patterns.
This integrated approach is intentionally parsimonious, exploratory, and diagnostic, consistent with the use of aggregated administrative data. Rather than estimating causal relationships, the analysis focuses on identifying structural configurations of the logistics system and their implications for exposure to disruption. In this sense, the methodology provides actionable evidence to identify critical nodes, prioritize resilience interventions, and inform contingency planning in import logistics networks, while acknowledging that concentration patterns reflect underlying factors not explicitly modeled.
4. Results
The results are presented below according to each analytical component of the study. The analysis is presented as a cross-sectional structural assessment of the 2023–2024 period, without inferring long-term trends.
4.1. Comparative Analysis of Customs Revenue by Customs District
Table 1 presents the comparative distribution of customs revenue by district for Ecuador’s import-for-consumption operations in 2023 and 2024. This comparison reveals not only heterogeneous interannual changes, but also a highly asymmetric territorial structure in customs tax collection.
As shown in
Table 1, total customs revenue increased from USD 3.39 billion in 2023 to USD 3.46 billion in 2024, representing an overall increase of approximately 2.2%. However, this growth was not evenly distributed across districts. On the contrary, it was driven primarily by the performance of a single customs district. Guayaquil–Maritime increased its revenue by nearly USD 190 million and accounted for approximately 68% of total national customs revenue in 2024, thereby consolidating its role as Ecuador’s dominant logistics and fiscal hub.
Again, as evidenced in
Table 1, the contribution of the second-tier districts is markedly lower. Quito, the country’s main air customs district, represented roughly 11% of total revenue in 2024, while Manta accounted for a much smaller share and experienced a significant decline relative to the previous year. Tulcán also recorded positive growth, but its participation remained limited in national terms. This confirms that customs revenue is territorially concentrated in a very small number of districts.
The interannual comparison reported in
Table 1 also shows a pattern of divergent territorial dynamics. While Guayaquil–Maritime, Quito, Tulcán, and Cuenca recorded positive changes, other districts registered substantial contractions. Manta showed a marked decline, Esmeraldas experienced an almost complete reduction in revenue collection, and CEBAF San Miguel also fell sharply. These variations suggest that the observed national increase did not result from generalized growth across the customs system, but rather from a redistribution of revenue toward the already dominant nodes.
Taken together, the evidence summarized in
Table 1 indicates that Ecuador’s customs revenue structure is not only unevenly distributed, but also increasingly dependent on a reduced number of territorial gateways. From a structural perspective, this pattern suggests limited redundancy and greater exposure to localized disruptions, since a large proportion of customs revenue is concentrated in a single district. In this sense, the district-level comparison provides not only a descriptive overview of collection performance, but also an initial indication of territorial dependence, which is examined more formally through concentration metrics in the following sections.
The concentration of customs revenue is not only evident qualitatively but also quantitatively significant. In 2024, the Guayaquil–Maritime district alone accounted for approximately 67.8% of total national customs revenue (USD 2.347 billion out of USD 3.461 billion), confirming an extreme territorial concentration of fiscal flows. This level of dominance indicates that more than two-thirds of the country’s import-related tax revenue depends on a single logistics node, revealing a critical structural dependency within Ecuador’s import system. This implies that more than two-thirds of national customs revenue is concentrated in a single district.
4.2. Comparative Analysis of Customs Revenue by Mode of Transport (2023–2024)
Table 2 presents the distribution of customs revenue by mode of transport and customs district for 2023 and 2024. This comparison allows identification of modal dynamics, territorial concentration within each mode, and their contribution to the overall structure of Ecuador’s import system.
As shown in
Table 2, maritime transport clearly dominates Ecuador’s customs revenue structure in both years, despite a slight contraction at the aggregate level (−0.8%). In 2024, maritime transport accounted for approximately 78.4% of total customs revenue, that is, nearly four-fifths of national revenue, confirming its role as the central axis of the country’s import system. Within this mode, Guayaquil–Maritime increased its revenue from USD 2.16 billion to USD 2.35 billion and alone represented approximately 67.8% of total national customs revenue, reinforcing its position as the primary national logistics gateway and intensifying territorial concentration within the maritime system.
In contrast, other maritime districts experienced significant declines. Manta recorded a reduction of approximately 21.9%, while Esmeraldas showed an almost complete collapse in revenue (from USD 79.5 million to less than USD 1 million). Smaller maritime nodes also exhibited contraction, indicating a redistribution of flows toward the dominant port. This pattern suggests that maritime activity is not only dominant but also increasingly centralized in a single node, where more than two-thirds of maritime revenue is concentrated.
Air transport, while representing a smaller share of total revenue, showed consistent growth. Total air-related revenue increased from USD 496.8 million in 2023 to USD 539.9 million in 2024, representing an increase of approximately 8.7%. In 2024, air transport accounted for approximately 15.6% of total customs revenue. Within this mode, Quito accounted for USD 391.5 million, equivalent to roughly 72.5% of air-related revenue, consolidating its role as the country’s main air logistics hub. Guayaquil–Air and Cuenca also registered moderate increases, although their contributions remain comparatively limited. This pattern reflects the sustained role of air transport in high-value or time-sensitive imports, characterized by higher revenue intensity per unit.
Land transport exhibited the highest relative growth among the three modes, increasing from USD 172.8 million in 2023 to USD 208.4 million in 2024 (an increase of approximately 20.6%). In 2024, it accounted for approximately 6.0% of total customs revenue. This expansion is largely attributable to the performance of the Tulcán district, which alone reached USD 168.5 million, accounting for approximately 80.8% of land-based revenue. However, despite this growth, land transport continues to represent a relatively small share of total customs revenue, limiting its capacity to offset concentration in other modes.
Overall, the modal structure of customs revenue remains highly concentrated. Maritime transport accounts for nearly four-fifths of total revenue, while air and land transport represent approximately 15.6% and 6.0%, respectively. This implies that Ecuador’s import system is overwhelmingly dependent on maritime logistics, with alternative modes serving a secondary, complementary role.
Although moderate diversification is observed—particularly through the growth of air and land transport—its magnitude remains insufficient to significantly alter the structural dependence on maritime flows. Therefore, the modal comparison not only highlights differences in growth patterns across transport modes but also confirms the persistence of a structurally concentrated system, characterized by high dependence on a single mode and a limited number of logistics nodes. These distribution patterns are consistent with the high concentration levels captured by the HHI.
4.3. Percentage Share of Revenue by Mode of Transport and Type of Tax
The distribution of customs revenue by mode of transport across different tax categories provides a more detailed view of structural concentration and modal specialization within Ecuador’s import system.
Table 3,
Table 4,
Table 5 and
Table 6 report the percentage shares of revenue by mode for the main import-related taxes in 2023 and 2024.
As shown in
Table 3,
Table 4,
Table 5 and
Table 6, maritime transport consistently dominates all tax categories, confirming its structural role in Ecuador’s import system. In both years, maritime shares exceed 75% across all taxes and reach levels above 85% in the case of ad valorem and specific tariffs. This indicates that not only total revenue, but also the composition of tax collection, is heavily dependent on maritime logistics.
However, the degree of concentration varies across tax types. As reported in
Table 3, the ad valorem tariff shows a very high and stable maritime dominance (above 85%), with only marginal increases in air and land participation. A similar pattern is observed in
Table 4 for the specific tariff, although the shift toward air transport is slightly more pronounced (+1.95 percentage points), suggesting a modest increase in the relevance of higher-value imports.
A more differentiated pattern emerges in the case of the excise tax (ICE). As shown in
Table 5, maritime participation declines more substantially (−6.85 percentage points), while both air and land transport increase their shares. This represents the most significant intermodal redistribution observed in the analysis and suggests that ICE-taxed goods are more sensitive to changes in logistics configuration and modal choice.
VAT revenue, presented in
Table 6, exhibits a comparatively more balanced distribution. Although maritime transport remains predominant (around 75%), air and land modes have a more visible participation, particularly land transport, which reaches nearly 8% in 2024. This reflects the broader tax base of VAT and its closer linkage to overall import activity, including cross-border trade.
From a comparative perspective, these results indicate that modal concentration is not uniform across taxes, but depends on the interaction between logistics costs, type of goods, and tax structure. Taxes more directly linked to customs valuation (e.g., ad valorem tariffs) tend to be more concentrated in maritime transport, while taxes associated with specific consumption patterns (e.g., ICE) are more sensitive to modal diversification.
Despite these differences, the overall structure remains highly concentrated. Even in the most diversified case (VAT), maritime transport continues to account for approximately three-quarters of total revenue. Therefore, the observed interannual changes should be interpreted as marginal adjustments within a structurally stable system, rather than as evidence of a substantive transformation in the modal configuration of Ecuador’s import logistics.
In this sense, while small increases in air and land participation may signal incipient diversification, their magnitude remains insufficient to significantly alter the underlying dependence on maritime transport. This reinforces the interpretation of Ecuador’s import system as structurally concentrated, both in aggregate terms and across individual tax categories.
4.4. Comparison of Cost Structures by Mode of Transport and Their Impact on the Taxable Base
The taxable base for import-related taxes is directly shaped by the cost structure associated with each mode of transport, particularly through the components of customs value defined under the transaction value method (CIF), which includes the value of goods, international freight, insurance, and related logistics services.
From a structural perspective, differences in the composition of logistics costs across transport modes provide a key explanation for the patterns of revenue distribution observed in previous sections.
Table 7 summarizes the main cost components, structural characteristics, and their effects on the taxable base for each mode of transport.
As shown in
Table 7, maritime transport is characterized by relatively low unit freight costs combined with multiple surcharges associated with large-scale operations. This structure facilitates the movement of high volumes of goods, which translates into a large aggregate taxable base. However, the taxable value generated per unit tends to be lower compared to other modes, indicating that maritime revenue is primarily volume-driven.
In contrast, air transport exhibits a cost structure dominated by high freight rates, higher insurance costs, and specialized logistics services associated with speed and security. These characteristics significantly increase the CIF value per shipment. As a result, although air transport handles a smaller share of total import volume, it generates a disproportionately higher taxable base per unit, particularly for ad valorem taxes and VAT.
Land transport presents an intermediate cost structure, with freight and logistics costs that vary according to distance, cargo type, and border conditions. Additional factors such as storage, customs procedures, and waiting times further influence the customs value. While its contribution to total revenue remains relatively limited, its growing participation—especially in VAT and excise taxes—suggests an increasing role in cross-border and intraregional trade.
From a comparative standpoint, these differences explain why modal participation in tax revenue is not solely determined by trade volume, but also by the interaction between logistics costs and tax structure. Modes with higher cost intensity per shipment (air) generate greater taxable value per unit, while modes with lower costs but higher volumes (maritime) dominate in aggregate terms.
Overall, Ecuador’s customs revenue system reflects two complementary patterns: revenue driven by the scale and frequency of maritime operations, and revenue driven by higher value and cost intensity in air transport, with land transport occupying an intermediate position. This structural configuration reinforces the role of logistics cost composition as a key determinant of the taxable base and helps explain the persistence of revenue concentration despite moderate modal diversification.
4.4.1. Revenue Intensity and Structural Concentration
Although the study does not explicitly compute tax-efficiency indicators per economic unit, the available evidence allows for a consistent analytical approximation of relative revenue intensity across transport modes, based on their contribution to total revenue and the structural patterns identified in previous sections.
The results indicate that maritime transport concentrates the largest absolute share of tax revenue—above 75% across all taxes analyzed—primarily due to the scale and frequency of operations rather than a high taxable base per unit. This reflects a predominantly volume-driven pattern, where large aggregate flows generate high total revenue.
In contrast, air transport, despite representing a smaller share of total import volume, contributes disproportionately to taxes such as the ad valorem tariff and VAT, with shares close to 13% and 17%, respectively. This indicates that, per unit of imported value, air transport generates significantly higher tax revenue, reflecting a higher revenue intensity associated with high-value goods and elevated logistics costs embedded in the customs value.
Land transport occupies an intermediate position. While its share in total revenue remains limited, it shows visible interannual growth, particularly in VAT and excise taxes (ICE), suggesting moderate revenue intensity linked to cross-border trade dynamics and increasing formalization.
Overall, Ecuador’s customs revenue structure reflects a dual pattern: revenue driven by scale in maritime transport and revenue driven by higher value intensity in air transport, with land transport occupying an intermediate role. Although direct indicators such as taxes per dollar imported are not calculated, the observed modal and tax distribution provides a robust approximation for comparing revenue intensity across transport modes and highlights an important analytical dimension for future research.
4.4.2. Concentration Analysis: Herfindahl–Hirschman Index (HHI)
To quantify the structural concentration identified in the descriptive analysis, the Herfindahl–Hirschman Index (HHI) was calculated for each transport mode.
Table 8 reports the HHI values for 2023 and 2024.
As shown in
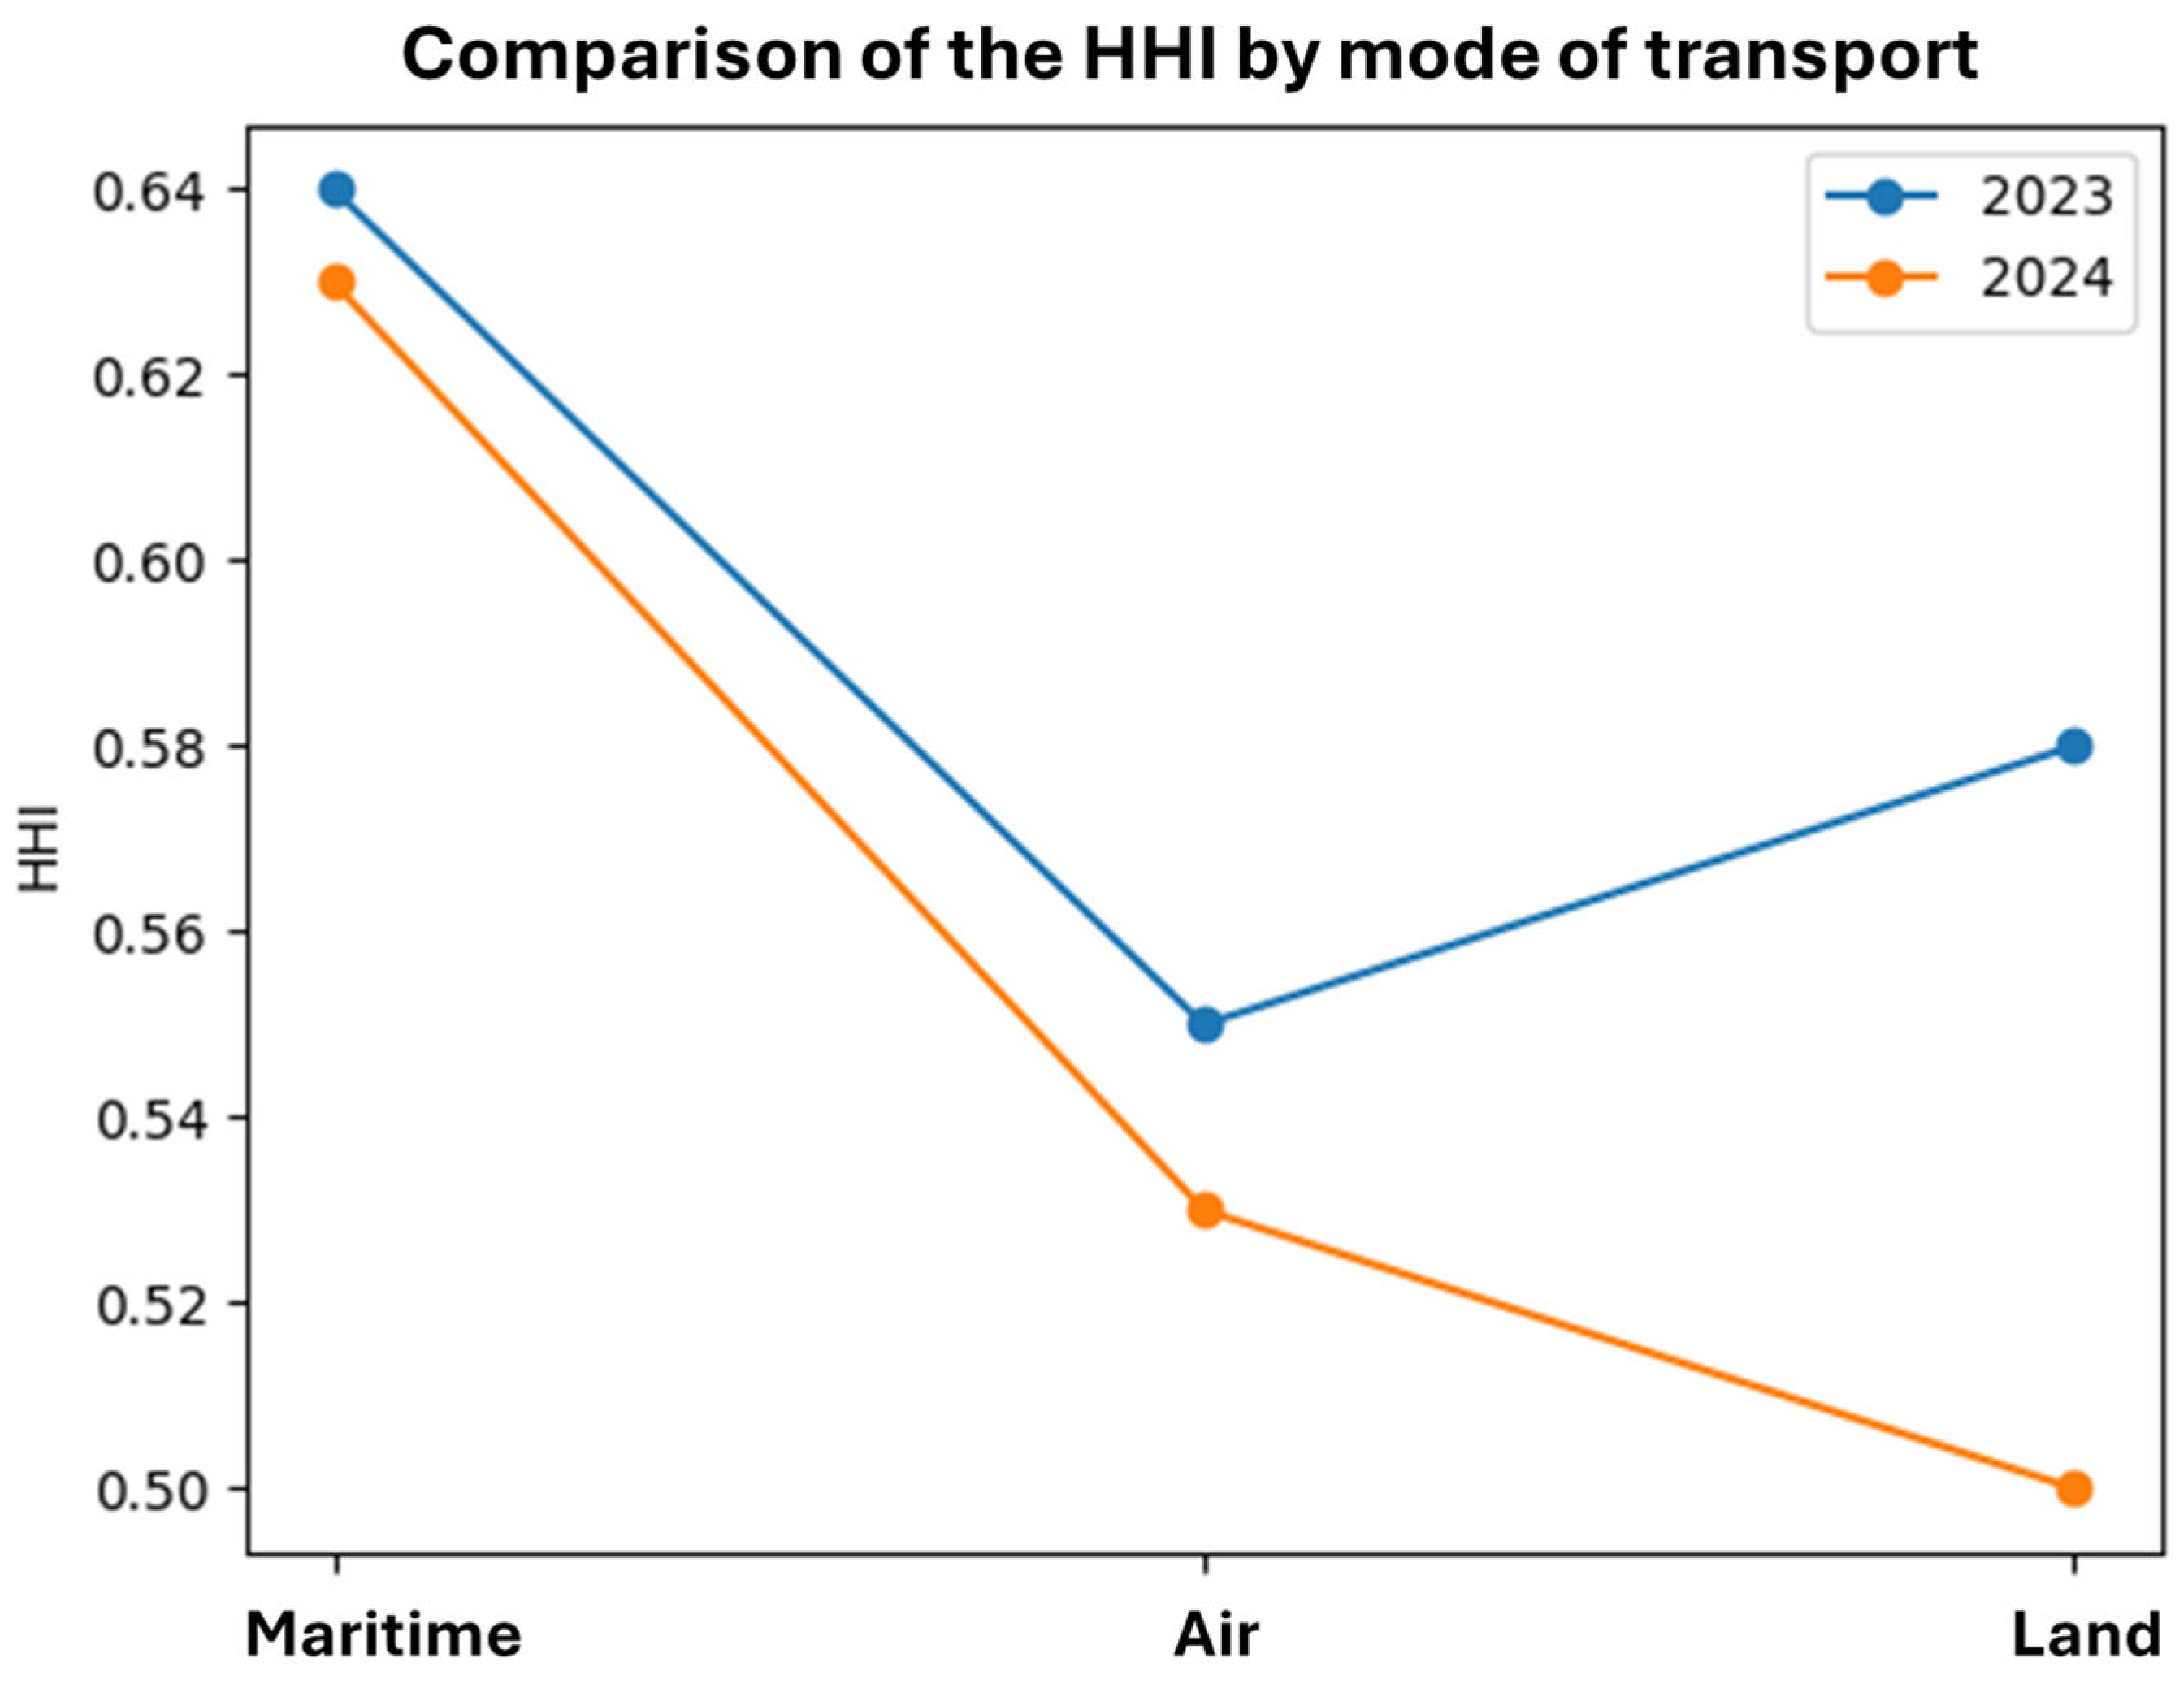
Table 8, maritime transport exhibits the highest level of concentration in both years, with HHI values of 0.64 in 2023 and 0.63 in 2024—well within the range typically associated with highly concentrated structures. These values indicate a near single-node dominance configuration within the maritime system. This reflects a strong dependence on a single district, as approximately 79% of maritime revenue is concentrated in Guayaquil–Maritime. Although a slight reduction is observed in 2024 (−0.01), the overall structure remains highly centralized, with concentration levels still exceeding the threshold commonly associated with high vulnerability.
Air transport shows moderately high concentration levels, with HHI values decreasing from 0.55 to 0.53 (−0.02). In 2024, this mode remains strongly dominated by the Quito district, which accounts for approximately 72.5% of air-related revenue. The marginal decline in the HHI suggests only a limited degree of territorial diversification, insufficient to significantly alter the underlying concentration pattern.
Land transport presents comparatively lower concentration levels and the most pronounced reduction in the index (from 0.58 to 0.50, a decrease of −0.08). This change reflects a relatively more distributed structure across border districts. However, despite this improvement, concentration remains moderate, as a single district (Tulcán) still accounts for approximately 80.8% of land-based revenue, indicating that diversification remains partial.
Taken together, these results confirm that Ecuador’s import logistics system exhibits persistent structural concentration across all transport modes. Maritime transport operates under a highly concentrated regime, while air and land transport remain moderately concentrated, with limited diversification. Although slight reductions in HHI values suggest incipient structural adjustments, their magnitude remains insufficient to substantially alter the overall concentration pattern or reduce systemic dependence on dominant nodes.
4.4.3. Compound Concentration and Structural Vulnerability
The combined evidence from modal and territorial analysis reveals a compound concentration structure within Ecuador’s import system. High modal concentration—reflected in maritime dominance above 75% of total revenue—is reinforced by high territorial concentration, where a single district accounts for more than 65% of national customs revenue.
This dual concentration pattern implies a structural dependency in which both logistics flows and fiscal outcomes are simultaneously linked to a limited number of modes and nodes. As a result, disruptions affecting the dominant mode (maritime transport) or the primary node (Guayaquil–Maritime) may generate amplified effects, impacting not only trade operations but also national revenue collection.
From a systemic perspective, this configuration reduces redundancy and limits the capacity of the system to redistribute flows under stress conditions. Consequently, vulnerability is not only a function of concentration at a single level, but of the interaction between modal and territorial dependence, which increases the potential for cascading effects. This interaction between modal and territorial concentration is further illustrated in
Figure 1, which highlights the relative intensity of concentration across transport modes.
4.4.4. Scenario Analysis and System Sensitivity
The scenario analysis further clarifies the practical implications of the concentration patterns identified above by examining how controlled modal reallocations or disruption-like shocks may affect revenue distribution and fiscal vulnerability under simplified assumptions. Rather than predicting actual outcomes, these exercises function as transparent stress tests of the extent to which Ecuador’s customs revenue structure depends on a dominant mode and a limited number of territorial nodes.
Scenario A (modal redistribution) simulates a reallocation of 5% of maritime revenue toward land (+3%) and air (+2%) transport. The results indicate a reduction in concentration levels (HHI) and a redistribution of revenue shares toward secondary modes, without affecting total revenue. This suggests that even limited diversification—on the order of 2–5%—could improve systemic resilience by reducing dependence on the dominant mode and node.
By contrast, Scenario B (a negative shock to maritime transport) indicates that a 10% decline in maritime revenue would lead to a substantial fiscal contraction, with more than 75% of the losses concentrated in a single district. Given that maritime transport accounts for approximately 78.4% of total revenue, even moderate shocks to the dominant mode can generate disproportionate fiscal effects at the national level. This finding underscores the asymmetric risk structure of the system, in which vulnerability is strongly linked to the concentration of flows in a single mode and node.
Overall, the scenario results reinforce the interpretation that Ecuador’s import system is not only highly concentrated but also structurally sensitive to localized disruptions, with limited buffering capacity absent greater modal diversification. Even with controlled, moderate adjustments, the system remains heavily dependent on maritime transport and the Guayaquil–Maritime district.
5. Discussion
The study’s results deepen understanding of the tax performance of Ecuador’s imports during 2023–2024, showing that customs revenue responds not only to the volume and value of import operations but also to the underlying logistics and territorial structure [
7,
15,
19,
27]. In particular, the comparison across transport modes confirms that tax performance is strongly conditioned by the concentration of operations in specific logistics nodes, introducing an additional analytical dimension related to fiscal vulnerability [
13,
14].
The predominance of maritime transport as the primary source of customs revenue is consistent with evidence from regional and multilateral studies, which identify this mode as the structural backbone of foreign trade in open Latin American economies [
32,
33]. However, the present findings show that this centrality is expressed not only in percentage shares but also in a high degree of territorial concentration, especially in the Guayaquil–Maritime district. This configuration implies that Ecuador’s customs tax system depends critically on a limited number of entry points, increasing its exposure to logistics, operational, or regulatory disruptions [
23,
34].
The estimation of the Herfindahl–Hirschman Index (HHI) reinforces this interpretation by revealing high levels of concentration in maritime transport and, to a lesser extent, in air transport. These findings are consistent with previous applications of the HHI in logistics and port systems, where the concentration of flows in a limited number of nodes has been associated with increased exposure to disruptions and reduced system resilience [
30,
35]. In this sense, the present study extends the use of the HHI to the domain of customs taxation, demonstrating its value as a descriptive tool for identifying structural vulnerabilities in fiscal outcomes linked to logistics configurations [
29].
Importantly, unlike prior studies that examine concentration primarily in terms of physical flows or port throughput, the present results show that concentration in customs revenue introduces an additional fiscal dimension of vulnerability. This perspective extends the conventional scope of logistics and supply chain analysis by linking operational concentration directly to public revenue exposure [
6,
15].
From a resilience perspective, concentration reflects a trade-off between efficiency and robustness [
20,
36]. Highly concentrated systems may benefit from economies of scale and cost efficiencies under stable conditions, but they also exhibit greater sensitivity to localized shocks, as disruptions affecting dominant nodes can propagate rapidly through interconnected logistics networks [
14,
21,
22]. This interpretation is consistent with recent evidence showing that greater diversification of flows or supply sources tends to reduce exposure to systemic risks, while concentration amplifies vulnerability to supply chain disruptions [
21,
34].
While this trade-off has been widely discussed in the supply chain resilience literature, the present findings suggest that its implications extend beyond operational performance to include fiscal stability, a dimension that has received comparatively limited attention in previous research [
6,
34].
However, while the HHI provides a useful measure of structural concentration, it should not be interpreted as a comprehensive explanation of the underlying drivers of logistics or fiscal outcomes. As a summary indicator based on the distribution of shares, the HHI captures the observable configuration of the system but does not account for the multiple economic, infrastructural, and operational factors that jointly shape these patterns [
9,
10]. Therefore, the results should be interpreted as indicative of structural configurations and potential risk exposure, rather than as evidence of causal relationships.
Air transport, while representing a smaller share of total import volume, shows a relevant contribution to the collection of taxes such as the ad valorem tariff and VAT. This result aligns with the literature emphasizing the value-intensive nature of air operations, in which higher logistics costs and the high unit value of goods increase the taxable base [
32,
37,
38]. Nevertheless, the concentration of air-related revenue in the Quito district suggests that this mode also exhibits moderate vulnerability, although with more scope for diversification than maritime transport [
26,
33].
Land transport, in turn, displays a less concentrated revenue structure and an incipient trend toward territorial diversification, particularly linked to the dynamism of cross-border trade along the country’s northern axis. This behavior may be interpreted as a signal of greater relative resilience, consistent with studies highlighting the role of intraregional and border trade in reducing excessive logistics dependencies [
11,
39]. However, its contribution to total revenue remains limited, which constrains its ability to offset significant declines in other modes.
The accounting-based scenario simulations provide a complementary lens for these results. The modal redistribution scenario suggests that greater diversification of import flows across modes could reduce aggregate fiscal vulnerability even without increasing total revenue. This finding is consistent with logistics policy approaches that promote modal diversification as a strategy to strengthen the resilience of the transport and foreign-trade system [
31]. By contrast, the negative shock scenario for maritime transport highlights the customs tax system’s limited buffering capacity against disruptions affecting its main logistics mode, with most losses concentrated in a single district. This asymmetric response highlights that system vulnerability is not linear but structurally amplified under concentration, as shocks affecting dominant nodes generate disproportionate fiscal effects [
23].
From a public policy perspective, these results suggest that optimizing tax performance does not depend exclusively on tariff adjustments or stronger fiscal control, but also on strategic decisions regarding infrastructure, logistics diversification, and risk management. Strengthening alternative nodes, improving land and air connectivity, and promoting a more balanced distribution of trade flows could help reduce the country’s fiscal exposure to external shocks without undermining foreign-trade competitiveness [
39,
40]. This implies that logistics concentration should be addressed not only as an operational-efficiency issue but also as a strategic fiscal risk, requiring coordinated policy responses across the domains of trade, infrastructure, and public finance [
34].
It is important to emphasize that the results should not be interpreted as evidence of long-term structural trends in Ecuador’s import logistics system. The analysis is based on a short-term dataset (2023–2024) and is therefore limited in its ability to capture the current configuration of concentration and modal distribution [
9,
34].
An additional limitation of the present analysis is its static nature, which does not account for the dynamic behavioral responses of logistics operators, carriers, or importers under conditions of disruption [
12]. In practice, economic agents may adjust routing decisions, shift between transport modes, or reallocate flows across alternative nodes in response to shocks. As a result, the vulnerability patterns identified in this study may represent an upper-bound approximation of actual system exposure, as adaptive responses could partially mitigate the observed concentration effects.
Moreover, the analysis is based on a short-term dataset (2023–2024), which limits the ability to distinguish between structural trends and temporary fluctuations. The observed increases in the participation of air and land transport may therefore reflect short-term adjustments rather than sustained diversification processes. Longer time series would be required to determine whether these patterns correspond to stable structural changes or transitory dynamics.
In this sense, the Herfindahl–Hirschman Index (HHI) is used as a static indicator of concentration, which reflects the distribution of shares at a given point in time rather than temporal dynamics. As widely recognized in the literature, the HHI is a summary measure of concentration based on the distribution of shares, and its primary function is diagnostic rather than longitudinal [
29].
Accordingly, the findings should be interpreted as an exploratory assessment of structural dependence and potential vulnerability, not as evidence of persistent trends or structural evolution. Future research incorporating longer time series would be necessary to confirm whether the observed patterns represent stable dynamics or short-term fluctuations.
Finally, the results should be interpreted in light of the study’s design limitations. The analysis relies on administrative census-type information for a short time horizon (2023–2024) and adopts a descriptive and comparative approach, without estimating causal relationships or elasticities. Accordingly, the simulated scenarios are not predictions or estimates of real impacts, but exploratory exercises intended to illustrate the potential structural implications of logistics concentration [
31]. Future research could extend the time horizon, incorporate explicit logistics cost variables, and apply econometric methods or dynamic simulation models to further examine the relationship between logistics, revenue collection, and fiscal resilience.
Despite these limitations, the value of the analysis lies in its ability to provide a current structural snapshot of system dependence, which is particularly relevant in logistics environments characterized by high volatility and frequent disruptions [
14]. In such contexts, recent configurations may offer more actionable insights for decision-making than long historical averages, especially when infrastructure constraints, trade routes, or regulatory conditions are rapidly evolving. Therefore, rather than reducing the study’s relevance, the short-term focus enhances its usefulness as a diagnostic tool for identifying current vulnerabilities and informing immediate resilience-oriented interventions.
In addition, the use of simplified scenario simulations should be interpreted as a transparent stress-testing mechanism rather than as an attempt to replicate real-world dynamics. By isolating structural relationships under controlled assumptions, these scenarios help to reveal the system’s sensitivity to modal shifts and localized shocks, providing an intuitive understanding of potential risk propagation mechanisms [
21,
34]. This complements the concentration analysis and reinforces the interpretation of results from a resilience perspective.
6. Conclusions
This study provides an exploratory structural assessment of Ecuador’s import logistics system, showing how customs revenue distribution reflects underlying patterns of modal and territorial concentration, with direct implications for fiscal vulnerability.
First, Ecuador’s customs revenue structure suggests a clear predominance of maritime transport, both in absolute terms and in its relative share across the main foreign-trade taxes. This indicates that tax performance is closely associated with the operational continuity of maritime logistics, which concentrates most import flows and fiscal revenue.
Second, the concentration analysis based on the Herfindahl–Hirschman Index (HHI) indicates that this dependence is not only modal but also territorial, with a marked concentration in specific customs districts. This highlights a structural dimension of tax performance in which the spatial configuration of logistics operations may influence revenue stability. This suggests that reducing excessive dependence on dominant logistics nodes may be relevant for strengthening both supply chain resilience and fiscal stability.
Third, although air and land transport account for a smaller share of total revenue, they appear to play a complementary role in the tax structure. Air transport exhibits higher revenue intensity per economic unit, while land transport shows signs of increasing territorial diversification, particularly linked to formal cross-border trade.
The scenario analysis suggests that greater modal diversification could reduce fiscal exposure to logistics disruptions without necessarily increasing total revenue. Conversely, the high dependence on maritime transport may limit the system’s capacity to absorb shocks concentrated in that mode, highlighting the relevance of logistics structure in shaping fiscal outcomes.
From a policy perspective, these findings suggest the relevance of promoting multimodal logistics, strengthening secondary nodes, and improving connectivity as potential strategies to reduce systemic exposure to disruption and fiscal risk.
From a methodological perspective, the study shows that combining descriptive analysis, concentration metrics, and accounting-based scenario simulations provides a coherent and replicable approach for examining customs revenue using aggregated administrative data, particularly in contexts where causal estimation is not feasible.
These conclusions should be interpreted within the exploratory scope of the study and the assumptions underlying its analytical design. The analysis is based on a short-term observation window (2023–2024) and relies on static concentration measures, which limit the ability to capture temporal dynamics or behavioral adjustments. Accordingly, the results should be understood as exploratory and diagnostic, offering a structural snapshot of current concentration patterns and exposure to disruption rather than evidence of long-term trends.
Future research could extend the temporal scope, incorporate additional levels of disaggregation (e.g., by product type or logistics cost variables), and apply dynamic or econometric approaches to further examine the relationship among logistics systems, revenue collection, and fiscal resilience.
Overall, the study provides exploratory empirical evidence that may support policy discussions aimed at strengthening customs management and logistics planning in Ecuador, contributing to a more integrated understanding of tax performance and its structural characteristics.
In this sense, the main contribution of the study lies in providing a replicable, policy-relevant diagnostic framework that links logistics structure to fiscal outcomes, offering a novel perspective on assessing systemic vulnerability in import-dependent economies.






 ,
,