Does High Voltage Electrical Discharge Treatment Induce Changes in Tannin and Fiber Properties of Cocoa Shell?

 ,
,  , , ,
, , ,  ,
,  ,
,
Abstract
1. Introduction
2. Materials and Methods
2.1. Preparation of Cocoa Shell
2.2. HVED Treatment
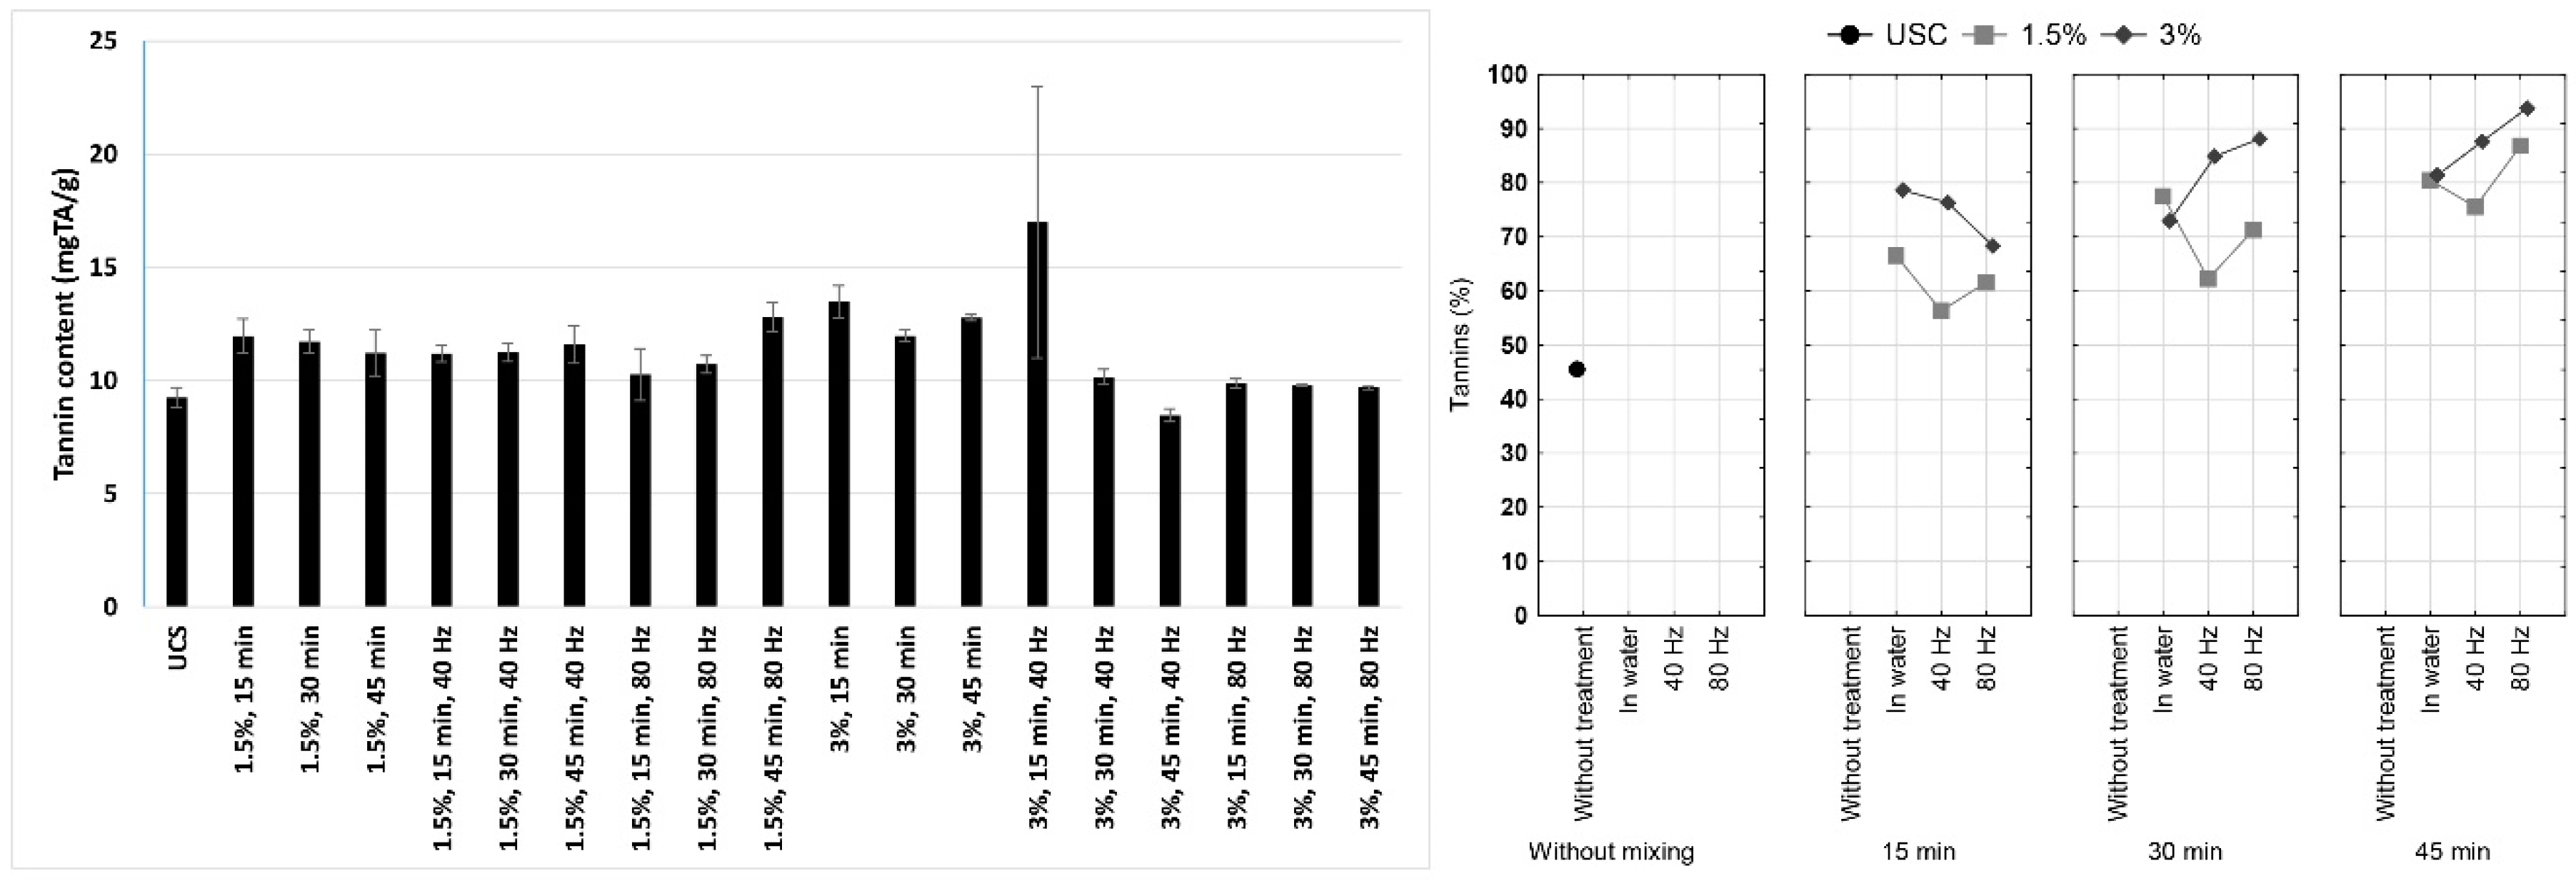
2.3. Tannin Content
2.3.1. Extraction
2.3.2. Spectrophotometric Analysis
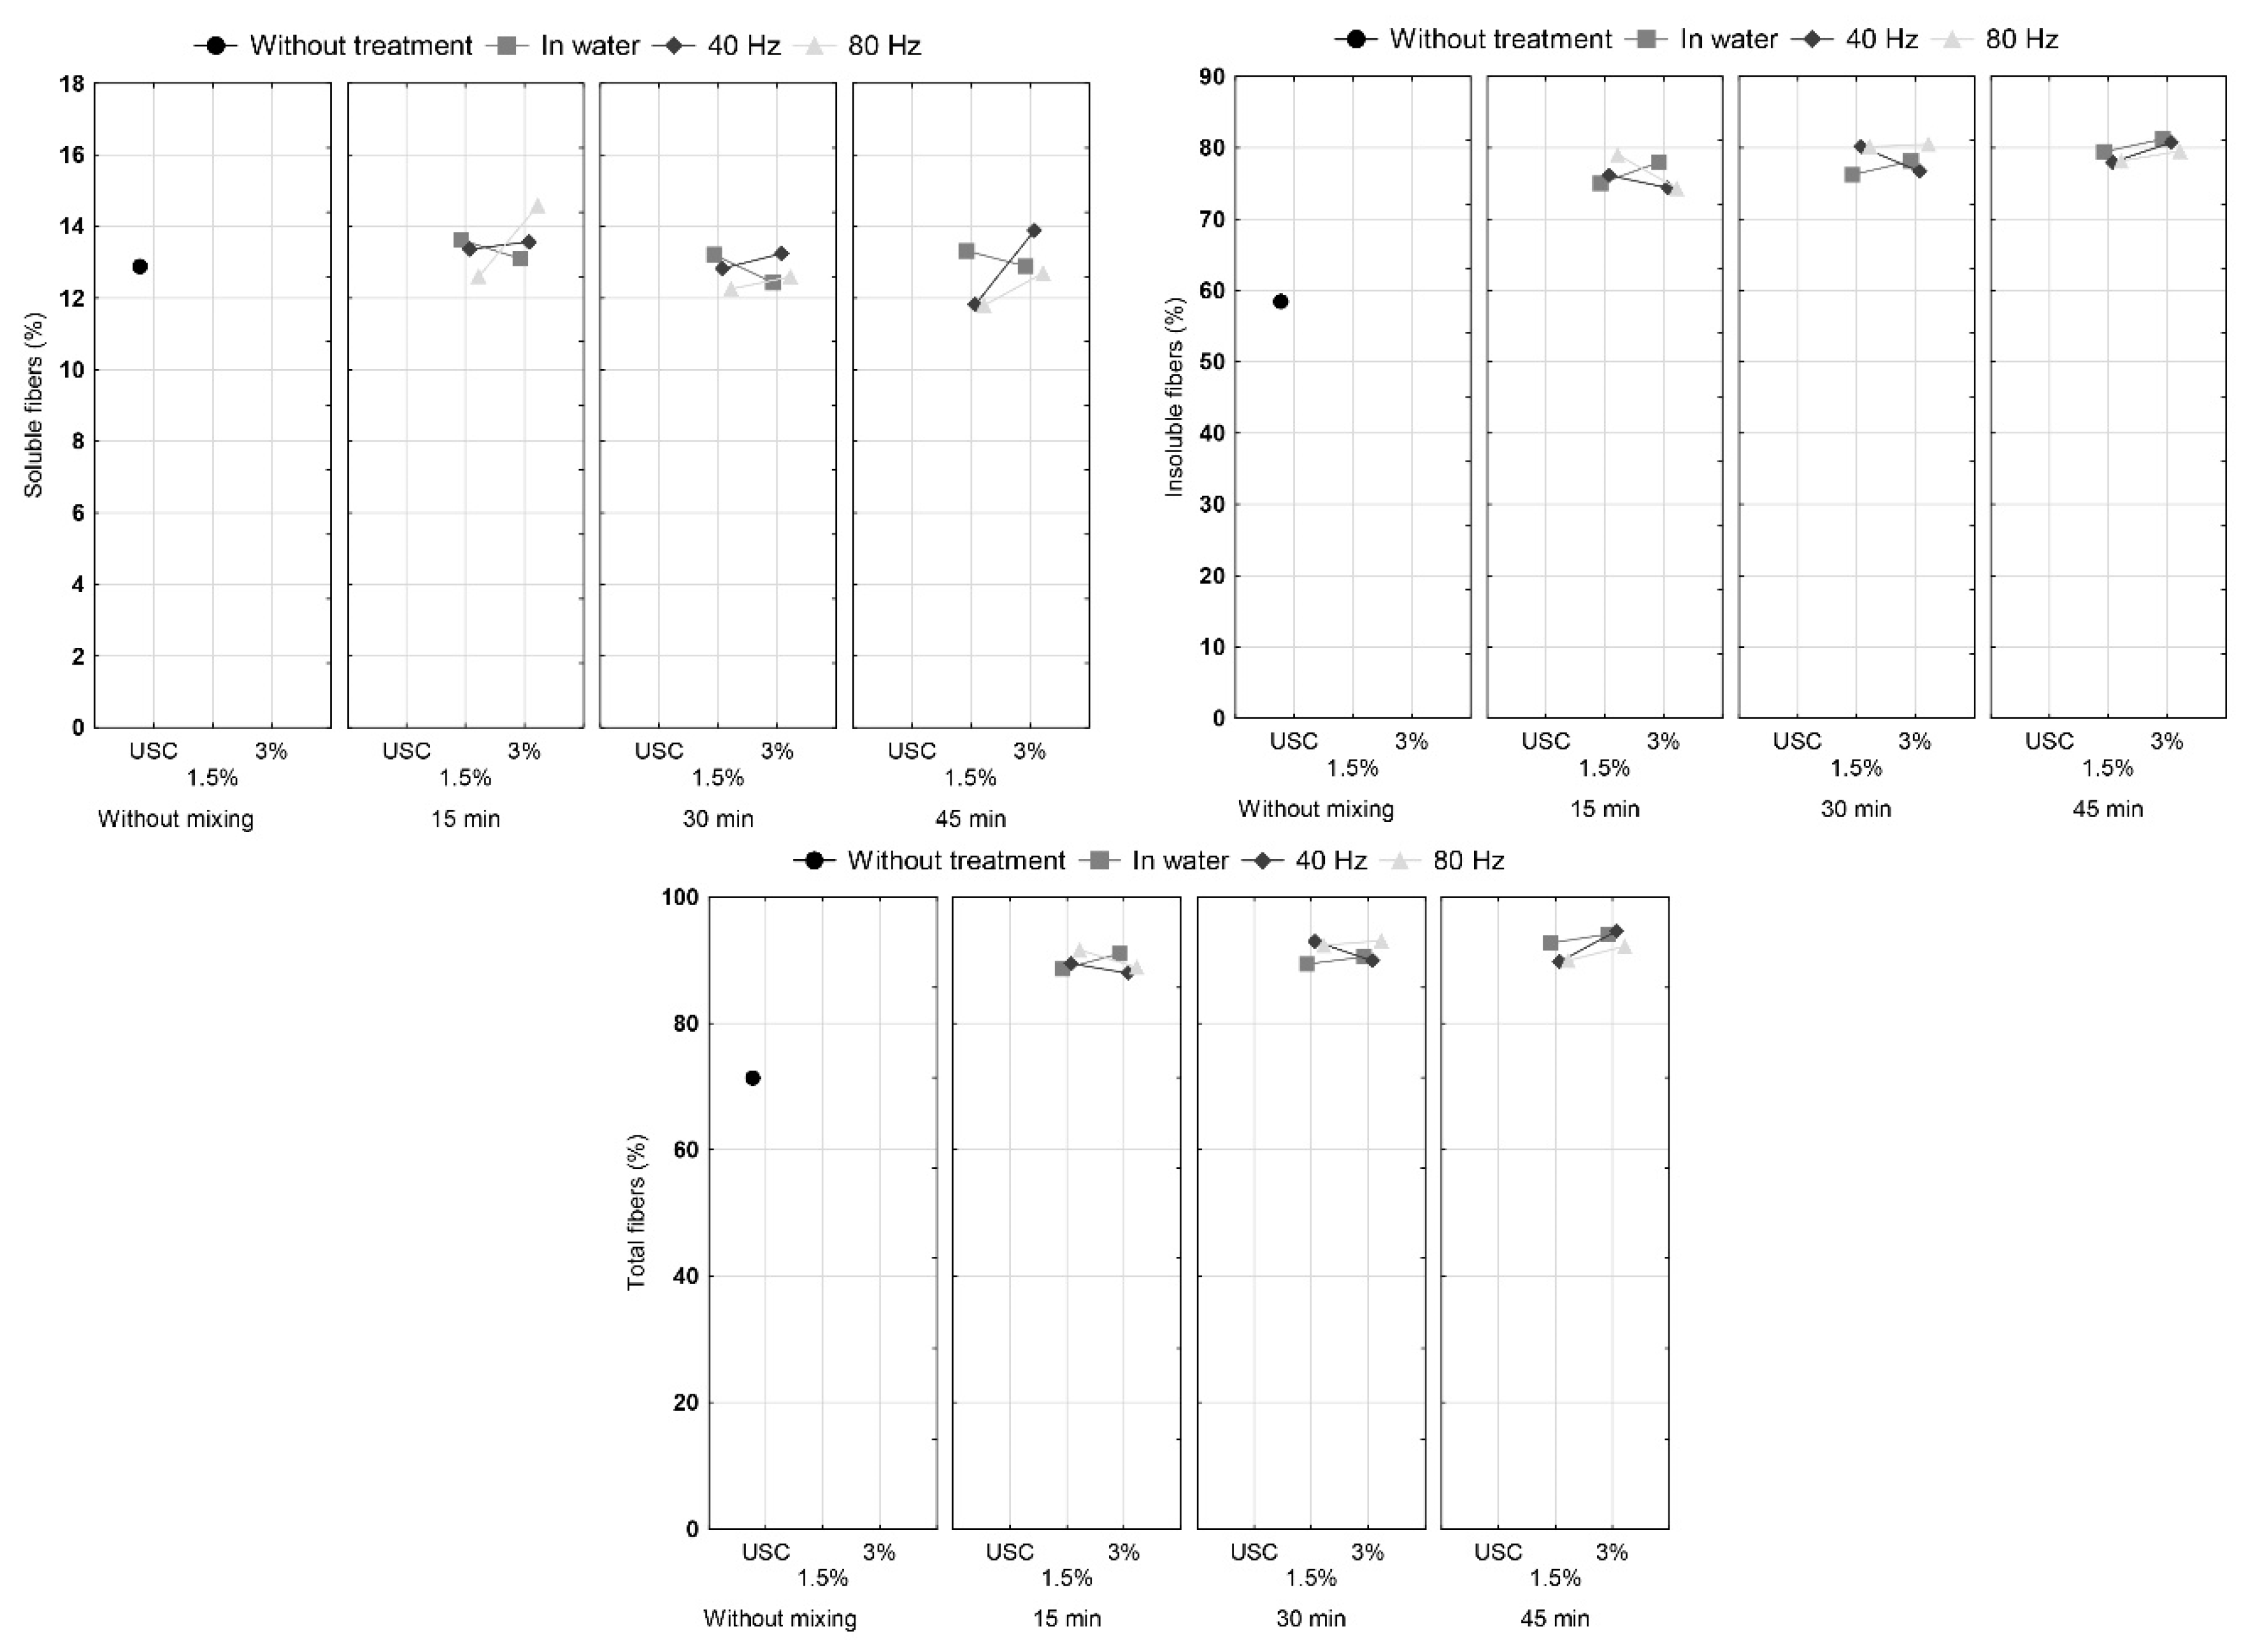
2.4. Determination of Dietary Fibers
2.5. Grindability of Cocoa Shell
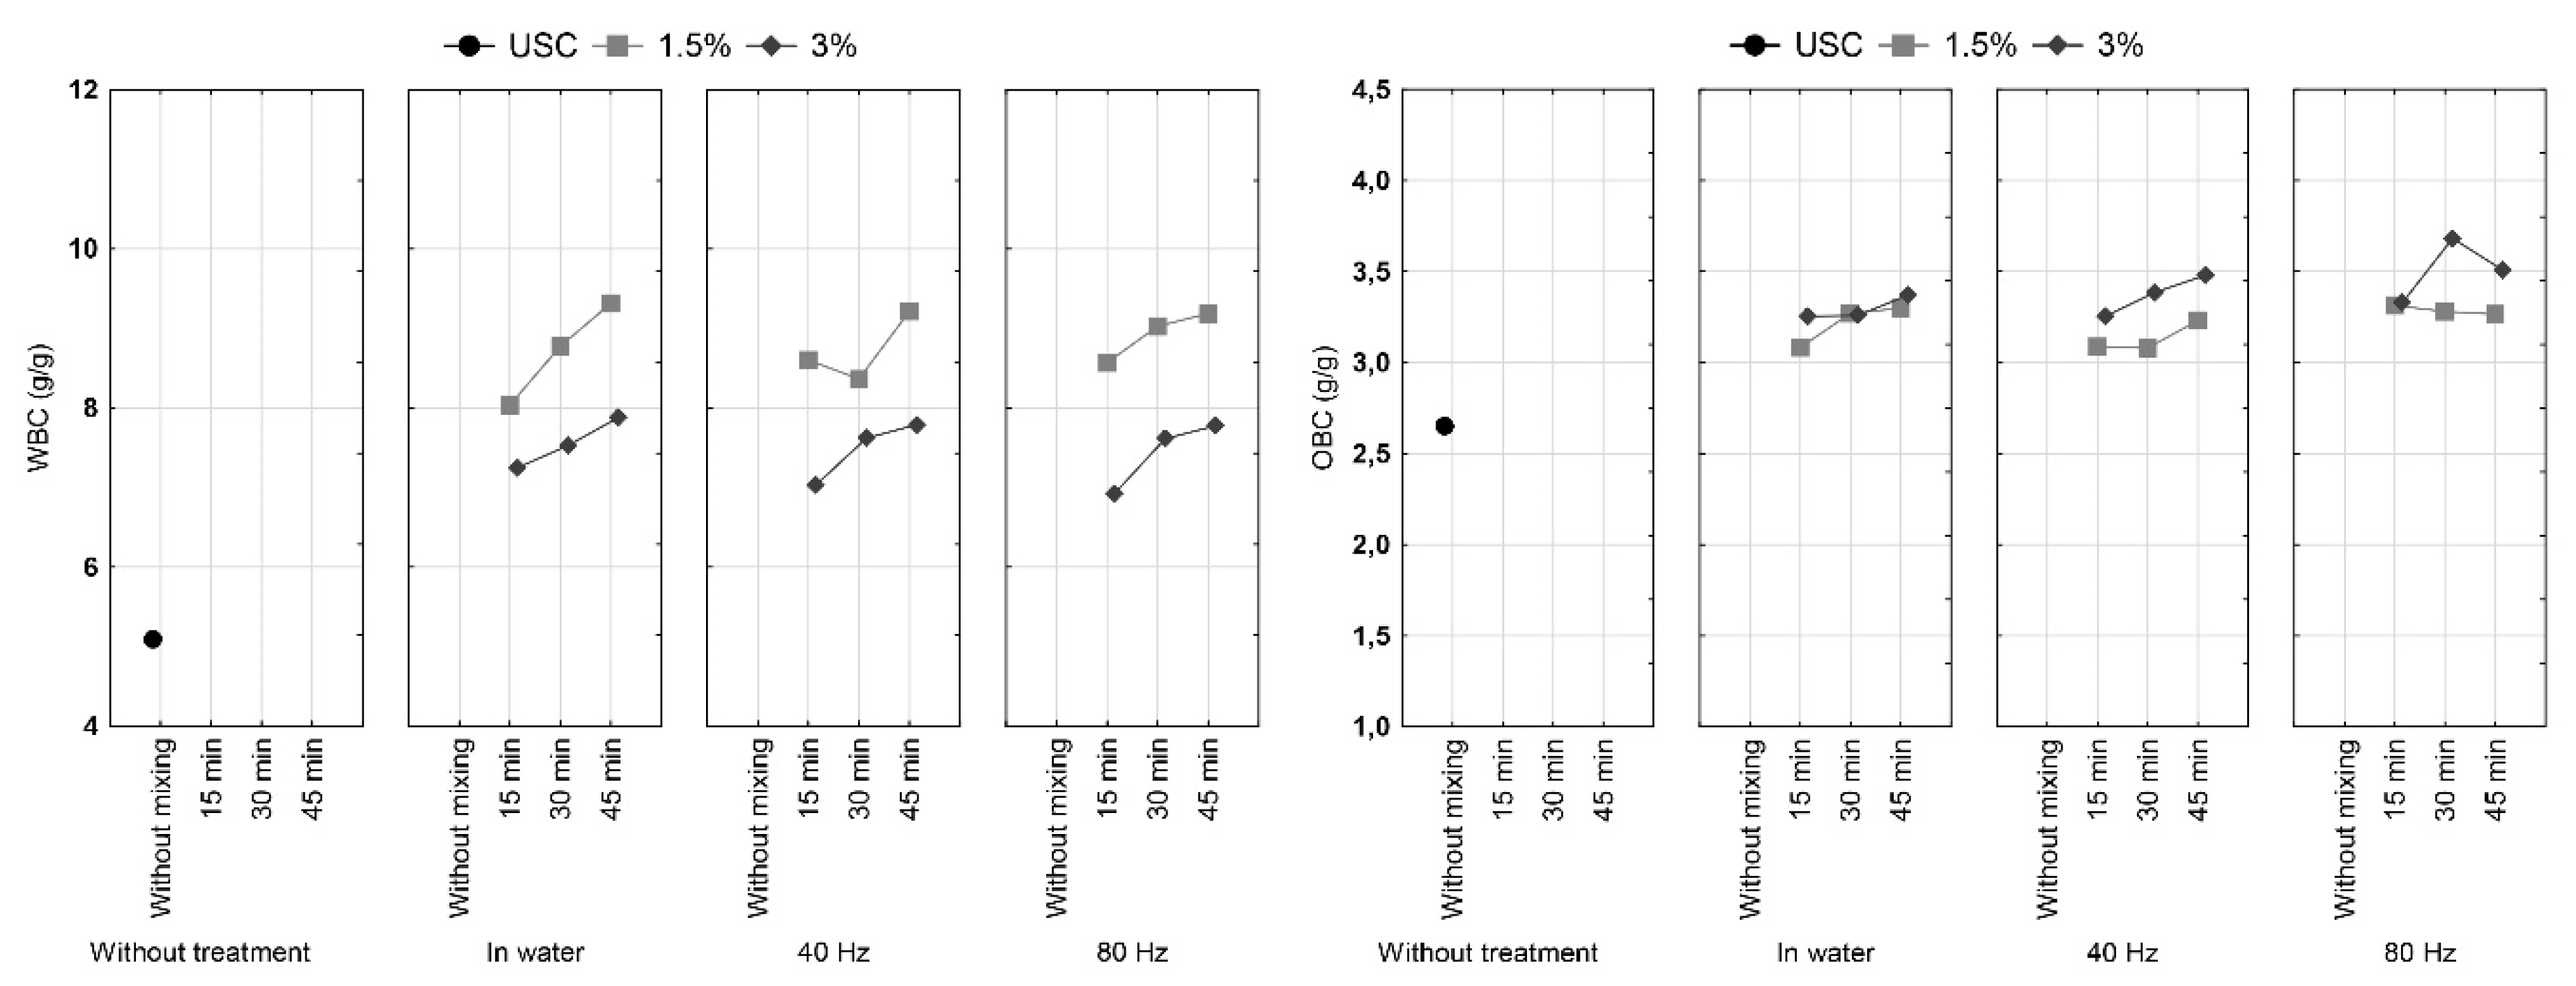
2.6. Water Binding Capacity (WBC) and Oil Binding Capacity (OBC)
2.7. Fourier Transform Infrared Spectroscopy with Attenuated Total Reflection (FTIR-ATR) Analysis
2.8. Statistical Analysis
3. Results and Discussion
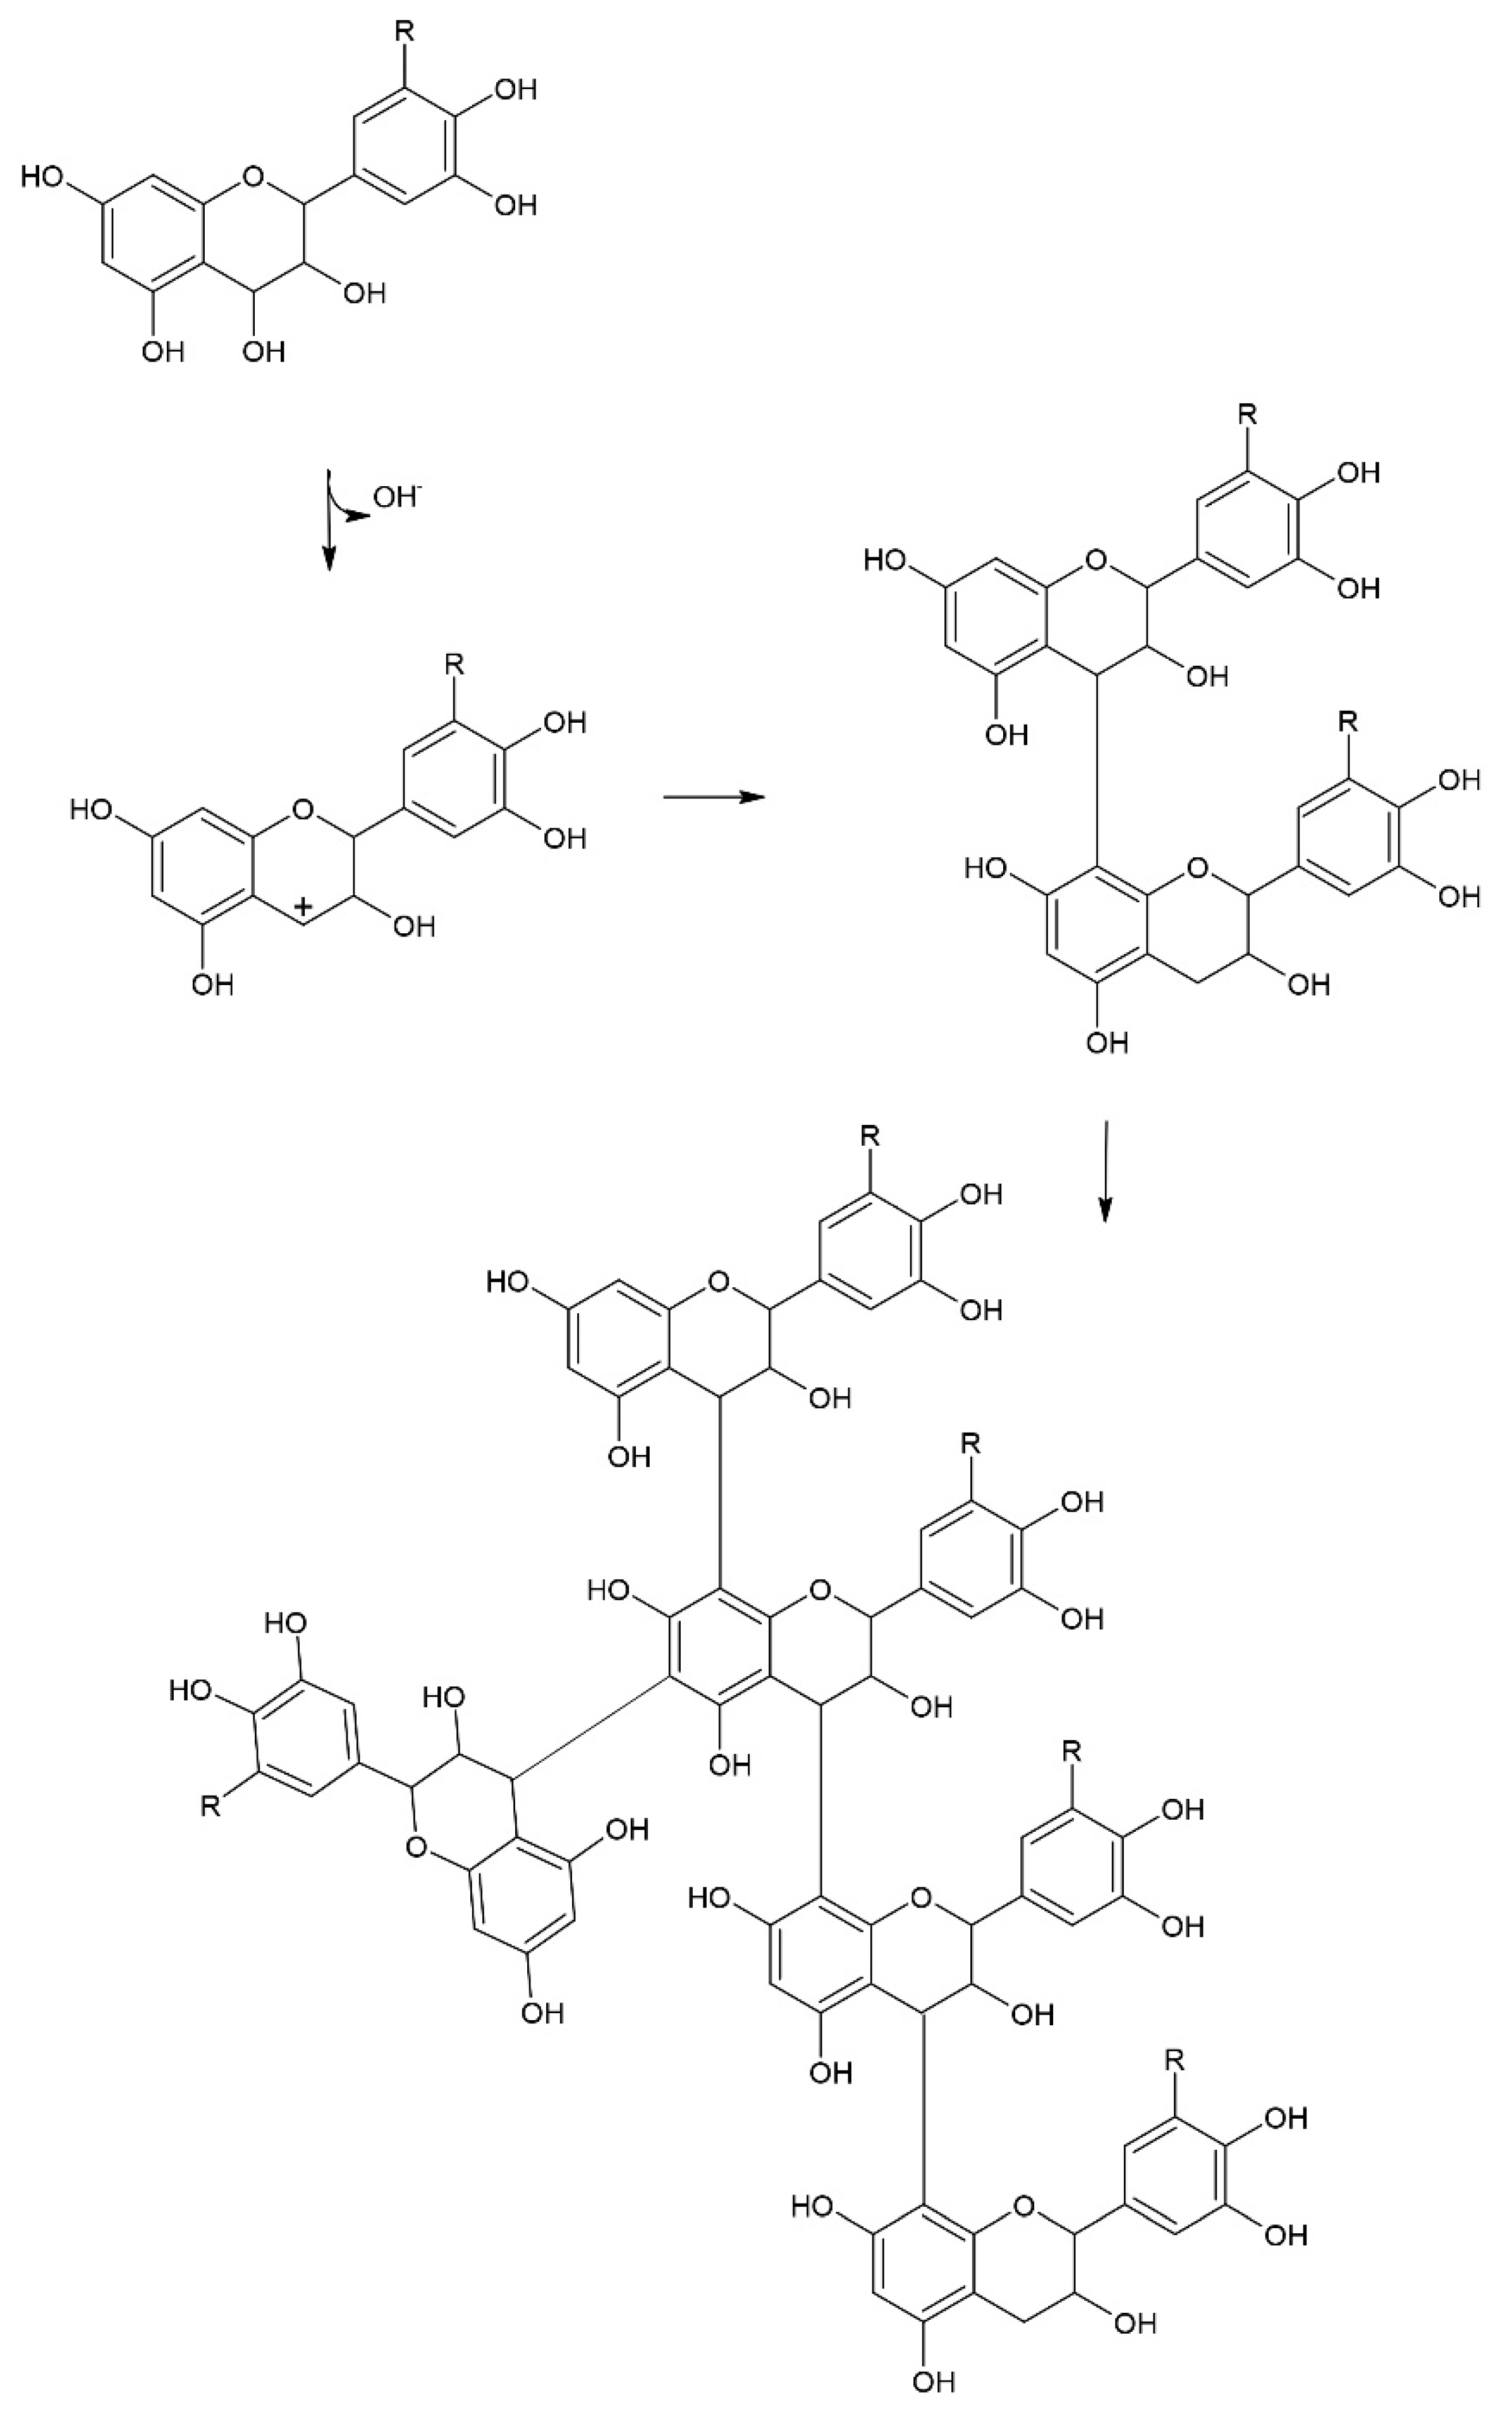
3.1. Tannin Content
3.2. Dietary Fibers
3.3. Grindability of Cocoa Shell
3.4. Water and Oil Binding Capacity
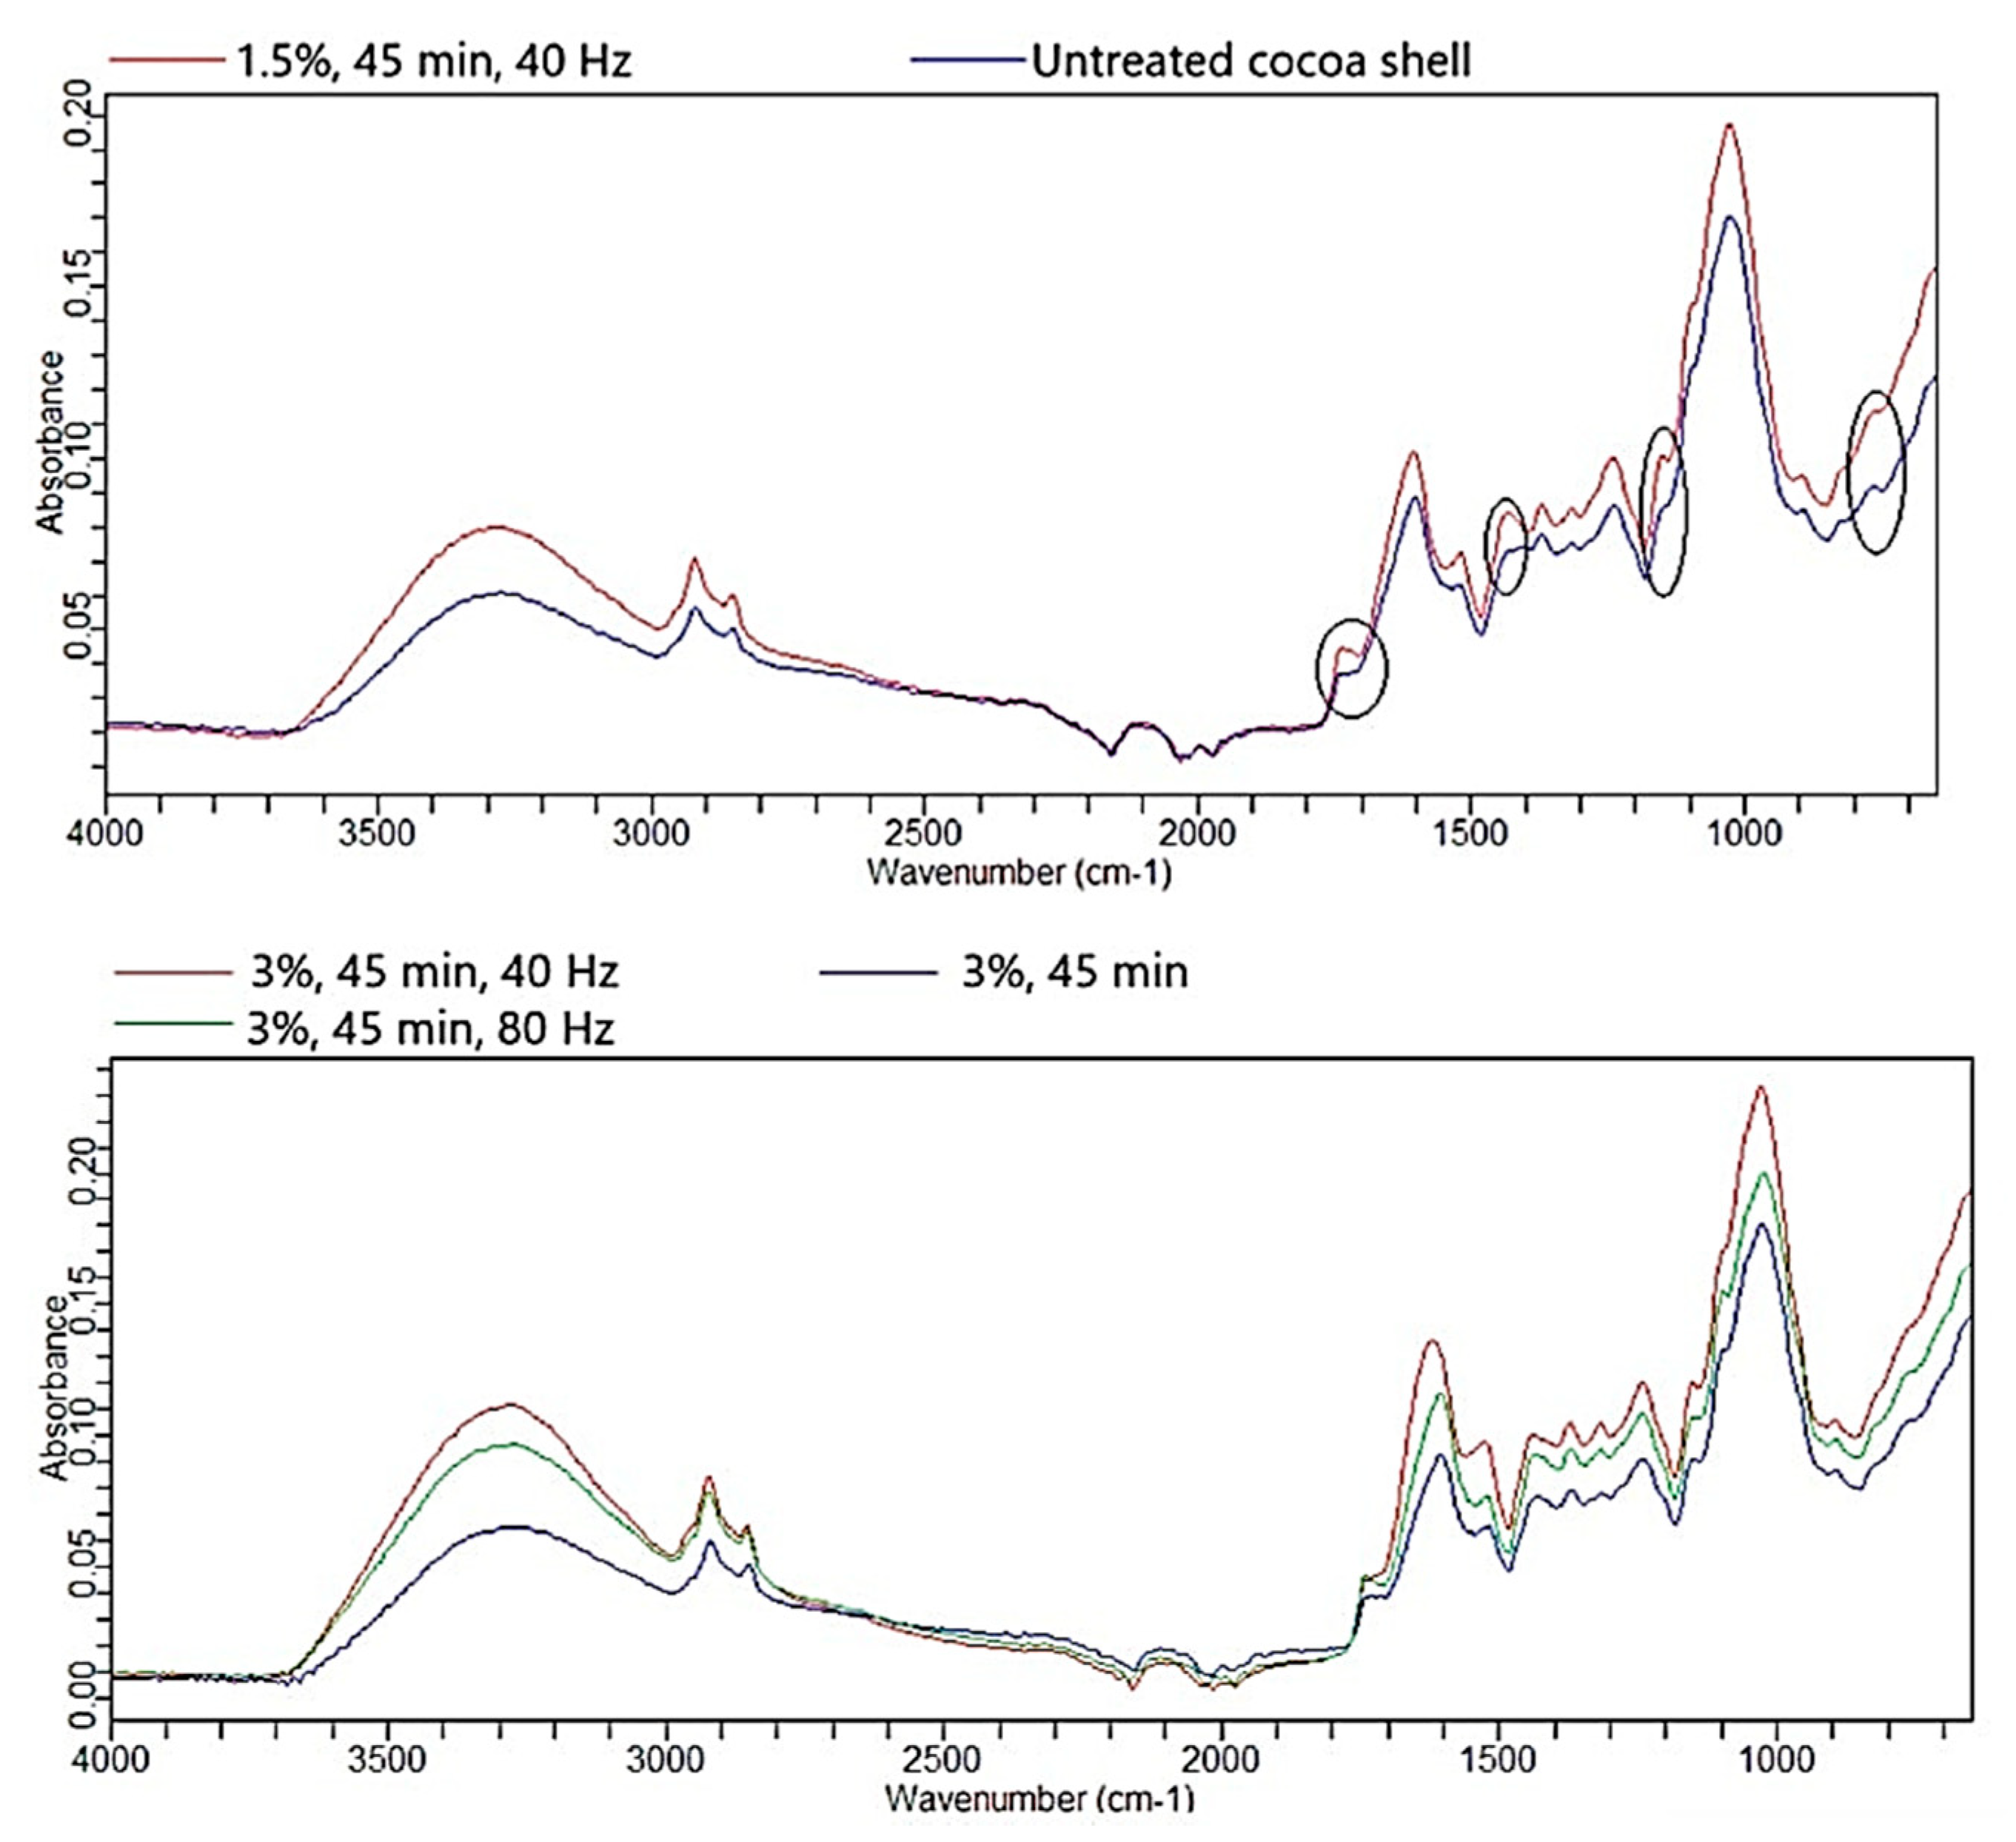
3.5. FTIR-ATR
4. Conclusions
Author Contributions
Funding
Conflicts of Interest
References
- Arlorio, M.; Coisson, J.D.; Travaglia, F.; Varsaldi, F.; Miglio, G.; Lombardi, G.; Martelli, A. Antioxidant and biological activity of phenolic pigments from Theobroma cacao hulls extracted with supercritical CO2. Food Res. Int. 2005, 38, 1009–1014. [Google Scholar] [CrossRef]
- Martin-Cabrejas, M.A.; Valiente, C.; Esteban, R.M.; Molla, E. Cocoa hull: A potential source of dietary fibre. J. Sci. Food Agric. 1994, 66, 307–311. [Google Scholar] [CrossRef]
- Redgwell, R.; Trovatoa, V.; Merinat, S.; Curti, D.; Hedigera, S.; Manez, A. Dietary fibre in cocoa shell: Characterisation of component polysaccharides. Food Chem. 2003, 81, 103–112. [Google Scholar] [CrossRef]
- Hernández-Hernández, C.; Viera-Alcaide, I.; Morales-Sillero, A.M.; Fernández-Bolaños, J.; Rodríguez-Gutiérrez, G. Bioactive compounds in Mexican genotypes of cocoa cotyledon and husk. Food Chem. 2017, 240, 831–839. [Google Scholar] [CrossRef] [PubMed]
- Chun, K.S.; Husseinsyah, S.; Osman, H. Utilization of cocoa pod husk as filler in polypropylene biocomposites: Effect of maleated polypropylene. J. Compos. Mater. 2015, 28, 1507–1521. [Google Scholar] [CrossRef]
- Panak Balentić, J.; Ačkar, Đ.; Jokić, S.; Jozinović, A.; Babić, J.; Miličević, B.; Šubarić, D.; Pavlović, N. Cocoa shell: A by-product with great potential for wide application. Molecules 2018, 23, 1404. [Google Scholar] [CrossRef] [PubMed]
- Boussetta, N.; Turk, M.; De Taeye, C.; Larondelle, Y.; Lanoisellé, J.L.; Vorobiev, E. Effect of high voltage electrical discharges, heating and ethanol concentration on the extraction of total polyphenols and lignans from flaxseed cake. Ind. Crop. Prod. 2013, 49, 690–696. [Google Scholar] [CrossRef]
- Yan, L.-G.; Deng, Y.; Ju, T.; Wu, K.; Xi, J. Continuous high voltage electrical discharge extraction of flavonoids from peanut shells based on “annular gap type” treatment chamber. Food Chem. 2018, 256, 350–357. [Google Scholar] [CrossRef]
- Li, Z.; Fan, Y.; Xi, J. Recent advances in high voltage electric discharge extraction of bioactive ingredients from plant materials. Food Chem. 2019, 277, 246–260. [Google Scholar] [CrossRef]
- Boussetta, N.; Vorobiev, E. Extraction of valuable biocompounds assisted by high voltage electrical discharges: A review. C. R. Chim. 2014, 17, 197–203. [Google Scholar] [CrossRef]
- Barišić, V.; Jozinović, A.; Flanjak, I.; Šubarić, D.; Babić, J.; Miličević, B.; Doko, K.; Ačkar, Đ. Difficulties with Use of Cocoa Bean Shell in Food Production and High Voltage Electrical Discharge as a Possible Solution. Sustainability 2020, 12, 3981. [Google Scholar] [CrossRef]
- Amorim, E.L.C.; Nascimento, J.E.; Monteiro, J.M.; Sobrinho, T.J.S.P.; Araújo, T.A.S.; Albuquerque, U.P. A simple and accurate procedure for the determination of tannin and flavonoid levels and some applications in ethnobotany and ethnopharmacology. Funct. Ecosyst. Communities 2008, 21, 88–94. [Google Scholar]
- Singleton, V.L.; Orthofer, R.; Lamuela-Raventós, R.M. Analysis of total phenols and other oxidation substrates and antioxidants by means of Folin-Ciocalteu reagent. Methods Enzymol. 1999, 299, 152–178. [Google Scholar] [CrossRef]
- AOAC 991.43. Total, soluble, and insoluble dietary fiber in foods: Enzymatic-gravimetric method, MES-TRIS buffer. In AOAC Official Methods, Suppl; Association of Official Analytical Chemists: Rockville, MD, USA, March 1995; Chapter 32; pp. 7–9.
- AACC Method 88-04. In AACC Methods Manual, Revised Ed.; American Association of Cereal Chemists: St. Paul, MN, USA, 1983.
- Barišić, V.; Flanjak, I.; Križić, I.; Jozinović, A.; Šubarić, D.; Babić, J.; Miličević, B.; Ačkar, Đ. Impact of high-voltage electric discharge treatment on cocoa shell phenolic components and methylxanthines. J. Food Process Eng. 2020, 43, e13057. [Google Scholar] [CrossRef]
- Jokić, S.; Pavlović, N.; Jozinović, A.; Ačkar, Đ.; Babić, J.; Šubarić, D. High-voltage electric discharge extraction of bioactive compounds from the cocoa bean shell. Chem. Biochem. Eng. Q. 2019, 33, 271–280. [Google Scholar] [CrossRef]
- Delsart, C.; Grimi, N.; Boussetta, N.; Miot Sertier, C.; Ghidossi, R.; Vorobiev, E.; Mietton Peuchot, M. Impact of pulsed-electric field and high-voltage electrical discharges on red wine microbial stabilization and quality characteristics. J. Appl. Microbiol. 2015, 120, 152–164. [Google Scholar] [CrossRef]
- Lukić, K.; Vukušić, T.; Tomašević, M.; Ćurko, N.; Gracin, L.; Kovačević Ganić, K. The impact of high voltage electrical discharge plasma on the chromatic characteristics and phenolic composition of red and white wines. Innov. Food Sci. Emerg. Technol. 2019, 53, 70–77. [Google Scholar] [CrossRef]
- Guyot, S.; Bernillon, S.; Poupard, P.; Renard, M.G.C.C. Multiplicity of phenolic oxidation products in apple juices and ciders, from synthetic medium to commercial products. In Recent Advances in Polyphenol Research; Daayf, F., Lattanzio, V., Eds.; Wiley-Blackwell: Hoboken, NJ, USA, 2008; pp. 278–293. [Google Scholar]
- Lecumberri, E.; Mateos, R.; Izquierdo-Pulido, M.; Rupérez, P.; Goya, L.; Bravo, L. Dietary fibre composition, antioxidant capacity and physico-chemical properties of a fibre-rich product from cocoa (Theobroma cacao L.). Food Chem. 2007, 104, 948–954. [Google Scholar] [CrossRef]
- Bravo, L.; Grades, N.; Saura-Calixto, F. Composition and potential uses of mesquite pods (Prosopis pallida L): Comparison with carob pods (Ceratonia siliqua L). J. Sci. Food Agric. 1994, 65, 303–306. [Google Scholar] [CrossRef]
- Saura-Calixto, F. Dietary fibre complex in a sample rich in condensed tannins and uronic acids. Food Chem. 1987, 23, 95–103. [Google Scholar] [CrossRef]
- Perez, E.; Mendez, A.; Leon, M.; Hernandez, G.; Sivoli, L. Proximal composition and the nutritional and functional properties of cococa by-products (pods and husks) for their use in the food industry. In Chocolate-Cocoa Byproducts Technology, Rheology, Styling, and Nutrition; Perez Sira, E., Ed.; Nova: New York, NY, USA, 2015; pp. 219–230. [Google Scholar]
- Barišić, V.; Flanjak, I.; Tot, A.; Budeč, M.; Benšić, M.; Jozinović, A.; Babić, J.; Šubarić, D.; Miličević, B.; Ačkar, Đ. 5-hydroxymethylfurfural and acrylamide content of cocoa shell treated with high voltage electrical discharge. Food Cont. 2020, 107043. [Google Scholar] [CrossRef]
- Ozdal, T.; Capanoglu, E.; Altay, F. A review on protein–phenolic interactions and associated changes. Food Res. Int. 2013, 51, 954–970. [Google Scholar] [CrossRef]
- Yuan, X.; Jayaraman, K.; Bhattacharyya, D. Effects of plasma treatment in enhancing the performance of woodfibre-polypropylene composites. Compos. Part A Appl. Sci. Manuf. 2004, 35, 1363–1374. [Google Scholar] [CrossRef]
- Sinha, E.; Panigrahi, S. Effect of plasma treatment on structure, wettability of jute fiber and flexural strength of its composite. J. Compos. Mater. 2009, 43, 1791–1802. [Google Scholar] [CrossRef]
- Bozaci, E.; Sever, K.; Demir, A.; Seki, Y.; Sarikanat, M.; Ozdogan, E. Effect of the atmospheric plasma treatment parameters on surface and mechanical properties of jute fabric. Fibers Polym. 2009, 10, 781–786. [Google Scholar] [CrossRef]
- Karahan, H.A.; Özdoğan, E. Improvements of surface functionality of cotton fibers by atmospheric plasma treatment. Fibers Polym. 2008, 9, 21–26. [Google Scholar] [CrossRef]
- Sangnark, A.; Noomhorm, A. Effect of dietary fibre from sugarcane bagasse and sucrose esteron doughand bread properties. LWT 2004, 37, 697–704. [Google Scholar] [CrossRef]
- Ulbrich, M.; Flöter, E. Impact of high pressure homogenization modification of a cellulose based fiber product on water binding properties. Food Hydrocoll. 2014, 41, 281–289. [Google Scholar] [CrossRef]
- Günzler, H.; Gremlich, H. IR-Spektroskopie: Eine Einführung, 4th ed.; WILEY-VCH GmbH & Co. KGaA: Weinheim, Germany, 2003. [Google Scholar]
- Grillo, G.; Boffa, L.; Binello, A.; Mantegna, S.; Cravotto, G.; Chemat, F.; Dizhbite, T.; Lauberte, L.; Telysheva, G. Analytical dataset of Ecuadorian cocoa shells and beans. Data Brief. 2019, 22, 56–64. [Google Scholar] [CrossRef] [PubMed]


| Sum of Squares | DF | Mean Square | F-Value | p-Value | ||
|---|---|---|---|---|---|---|
| OBC (g/g) | Intercept | 392.4578 | 1 | 392.4578 | 533,103.9 | <0.001 * |
| Concentration (C) | 0.2885 | 1 | 0.2885 | 391.8 | <0.001 * | |
| Mixing (M) | 0.1274 | 2 | 0.0637 | 86.5 | <0.001 * | |
| Treatment (T) | 0.1614 | 2 | 0.0807 | 109.6 | <0.001 * | |
| C*M | 0.0200 | 2 | 0.0100 | 13.6 | <0.001 * | |
| C*T | 0.0474 | 2 | 0.0237 | 32.2 | <0.001 * | |
| M*T | 0.0516 | 4 | 0.0129 | 17.5 | <0.001 * | |
| C*M*T | 0.0821 | 4 | 0.0205 | 27.9 | <0.001 * | |
| Error | 0.0133 | 18 | 0.0007 | |||
| WBC (g/g) | Intercept | 2384.278 | 1 | 2384.278 | 313,752.4 | <0.001 * |
| Concentration (C) | 15.149 | 1 | 15.149 | 1993.6 | <0.001 * | |
| Mixing (M) | 3.762 | 2 | 1.881 | 247.6 | <0.001 * | |
| Treatment (T) | 0.040 | 2 | 0.020 | 2.6 | 0.101638 | |
| C*M | 0.130 | 2 | 0.065 | 8.5 | 0.002470 * | |
| C*T | 0.177 | 2 | 0.088 | 11.6 | <0.001 * | |
| M*T | 0.266 | 4 | 0.066 | 8.8 | <0.001 * | |
| C*M*T | 0.516 | 4 | 0.129 | 17.0 | <0.001 * | |
| Error | 0.137 | 18 | 0.008 | |||
| Tannin (mg TA/g of defatted sample) | Intercept | 4714.410 | 1 | 4714.410 | 1021.198 | <0.001 * |
| Concentration (C) | 0.030 | 1 | 0.030 | 0.006 | 0.936726 | |
| Mixing (M) | 13.343 | 2 | 6.671 | 1.445 | 0.261805 | |
| Treatment (T) | 17.066 | 2 | 8.533 | 1.848 | 0.186168 | |
| C*M | 24.240 | 2 | 12.120 | 2.625 | 0.099895 | |
| C*T | 10.946 | 2 | 5.473 | 1.186 | 0.328333 | |
| M*T | 29.441 | 4 | 7.360 | 1.594 | 0.218875 | |
| C*M*T | 24.668 | 4 | 6.167 | 1.336 | 0.294923 | |
| Error | 83.098 | 18 | 4.617 | |||
| Tannin (% of total polyphenols) | Intercept | 114,239.9 | 1 | 114,239.9 | 3614.463 | <0.001 * |
| Concentration (C) | 202.5 | 1 | 202.5 | 6.406 | 0.020914 * | |
| Mixing (M) | 453.1 | 2 | 226.5 | 7.167 | 0.005134 * | |
| Treatment (T) | 84.5 | 2 | 42.3 | 1.337 | 0.287391 | |
| C*M | 75.8 | 2 | 37.9 | 1.200 | 0.324306 | |
| C*T | 49.7 | 2 | 24.9 | 0.786 | 0.470508 | |
| M*T | 146.0 | 4 | 36.5 | 1.155 | 0.363192 | |
| C*M*T | 102.3 | 4 | 25.6 | 0.809 | 0.535434 | |
| Error | 568.9 | 18 | 31.6 |
| Effect | Sum of Squares | DF | Mean Square | F-Value | p-Value | |
|---|---|---|---|---|---|---|
| 0–50 µm | Intercept | 169.1845 | 1 | 169.1845 | 59.27547 | 0.000006 * |
| Concentration | 20.7446 | 1 | 20.7446 | 7.26806 | 0.019455 * | |
| Mixing | 2.4918 | 2 | 1.2459 | 0.43652 | 0.656146 | |
| Treatment | 2.8862 | 2 | 1.4431 | 0.50561 | 0.615433 | |
| Error | 34.2505 | 12 | 2.8542 | |||
| 51–71 µm | Intercept | 2025.733 | 1 | 2025.733 | 451.2232 | <0.001 * |
| Concentration | 54.266 | 1 | 54.266 | 12.0875 | 0.004574 * | |
| Mixing | 12.171 | 2 | 6.085 | 1.3555 | 0.294609 | |
| Treatment | 1.952 | 2 | 0.976 | 0.2174 | 0.807671 | |
| Error | 53.873 | 12 | 4.489 | |||
| 72–100 µm | Intercept | 1371.127 | 1 | 1371.127 | 705.1271 | <0.001 * |
| Concentration | 18.601 | 1 | 18.601 | 9.5659 | 0.009312 * | |
| Mixing | 0.303 | 2 | 0.152 | 0.0780 | 0.925440 | |
| Treatment | 1.729 | 2 | 0.864 | 0.4446 | 0.651247 | |
| Error | 23.334 | 12 | 1.945 | |||
| 101–125 µm | Intercept | 525.4466 | 1 | 525.4466 | 970.2258 | <0.001 * |
| Concentration | 0.9016 | 1 | 0.9016 | 1.6648 | 0.221262 | |
| Mixing | 0.5083 | 2 | 0.2542 | 0.4693 | 0.636443 | |
| Treatment | 0.8918 | 2 | 0.4459 | 0.8234 | 0.462285 | |
| Error | 6.4989 | 12 | 0.5416 | |||
| 126–200 µm | Intercept | 3189.472 | 1 | 3189.472 | 1644.420 | <0.001 * |
| Concentration | 1.189 | 1 | 1.189 | 0.613 | 0.448736 | |
| Mixing | 2.527 | 2 | 1.264 | 0.651 | 0.538775 | |
| Treatment | 2.636 | 2 | 1.318 | 0.679 | 0.525389 | |
| Error | 23.275 | 12 | 1.940 | |||
| 201–315 µm | Intercept | 5128.784 | 1 | 5128.784 | 3745.356 | <0.001 * |
| Concentration | 0.147 | 1 | 0.147 | 0.107 | 0.748864 | |
| Mixing | 3.778 | 2 | 1.889 | 1.379 | 0.288933 | |
| Treatment | 4.432 | 2 | 2.216 | 1.618 | 0.238628 | |
| Error | 16.432 | 12 | 1.369 | |||
| >315 µm | Intercept | 31,757.57 | 1 | 31,757.57 | 1505.873 | <0.001 * |
| Concentration | 26.88 | 1 | 26.88 | 1.275 | 0.280959 | |
| Mixing | 45.68 | 2 | 22.84 | 1.083 | 0.369462 | |
| Treatment | 52.88 | 2 | 26.44 | 1.254 | 0.320301 | |
| Error | 253.07 | 12 | 21.09 | |||
| Insoluble fibers | Intercept | 109,774.9 | 1 | 109,774.9 | 30,704.36 | <0.001 |
| Concentration | 0.1 | 1 | 0.1 | 0.02 | 0.883234 | |
| Mixing | 36.8 | 2 | 18.4 | 5.15 | 0.024326 * | |
| Treatment | 2.7 | 2 | 1.4 | 0.38 | 0.691002 | |
| Error | 42.9 | 12 | 3.6 | |||
| Soluble fibers | Intercept | 3038.191 | 1 | 3038.191 | 7378.913 | <0.001 * |
| Concentration | 0.962 | 1 | 0.962 | 2.336 | 0.152303 | |
| Mixing | 2.116 | 2 | 1.058 | 2.570 | 0.117785 | |
| Treatment | 0.501 | 2 | 0.250 | 0.608 | 0.560488 | |
| Error | 4.941 | 12 | 0.412 | |||
| Total fibers | Intercept | 149,338.0 | 1 | 149,338.0 | 43,452.47 | <0.001 * |
| Concentration | 1.6 | 1 | 1.6 | 0.47 | 0.508137 | |
| Mixing | 21.7 | 2 | 10.9 | 3.16 | 0.079032 | |
| Treatment | 1.0 | 2 | 0.5 | 0.14 | 0.867489 | |
| Error | 41.2 | 12 | 3.4 |
| Sample | 0–50 µm (%) | 51–71 µm (%) | 72–100 µm (%) | 101–125 µm (%) | 126–200 µm (%) | 201–315 µm (%) | >315 µm (%) |
|---|---|---|---|---|---|---|---|
| UCS | 15.19 | 21.89 | 11.83 | 7.94 | 18.24 | 14.10 | 10.81 |
| 1.5%, 15 min | 3.63 | 14.70 | 8.27 | 5.29 | 14.66 | 17.87 | 35.58 |
| 1.5%, 30 min | 3.12 | 12.64 | 7.83 | 5.07 | 13.12 | 16.76 | 41.47 |
| 1.5%, 45 min | 1.71 | 10.64 | 7.33 | 4.74 | 12.11 | 15.44 | 48.03 |
| 1.5%, 15 min, 40 Hz | 5.64 | 13.78 | 7.42 | 5.52 | 13.62 | 17.42 | 36.61 |
| 1.5%, 30 min, 40 Hz | 8.39 | 13.47 | 7.33 | 5.16 | 13.35 | 17.51 | 34.80 |
| 1.5%, 45 min, 40 Hz | 3.67 | 13.67 | 7.42 | 5.15 | 12.65 | 16.94 | 40.50 |
| 1.5%, 15 min, 80 Hz | 5.48 | 10.55 | 6.28 | 4.66 | 11.59 | 15.75 | 45.69 |
| 1.5%, 30 min, 80 Hz | 2.64 | 11.71 | 8.59 | 5.50 | 13.33 | 16.75 | 41.48 |
| 1.5%, 45 min, 80 Hz | 2.98 | 9.95 | 8.93 | 5.54 | 13.07 | 16.67 | 42.87 |
| 3.0%, 15 min | 3.52 | 9.98 | 7.22 | 4.64 | 11.72 | 15.36 | 47.56 |
| 3.0%, 30 min | 2.28 | 9.19 | 9.33 | 5.77 | 13.10 | 16.40 | 43.93 |
| 3.0%, 45 min | 2.16 | 9.26 | 10.98 | 6.40 | 15.05 | 17.31 | 38.84 |
| 3.0%, 15 min, 40 Hz | 1.36 | 8.89 | 11.45 | 5.79 | 15.12 | 18.76 | 38.64 |
| 3.0%, 30 min, 40 Hz | 0.64 | 4.04 | 11.23 | 7.40 | 15.23 | 18.69 | 42.77 |
| 3.0%, 45 min, 40 Hz | 2.08 | 8.84 | 10.14 | 5.24 | 12.78 | 16.18 | 44.75 |
| 3.0%, 15 min, 80 Hz | 1.50 | 11.73 | 10.83 | 6.07 | 15.48 | 19.18 | 35.20 |
| 3.0%, 30 min, 80 Hz | 1.32 | 6.51 | 9.05 | 4.92 | 12.47 | 15.72 | 50.01 |
| 3.0%, 45 min, 80 Hz | 3.07 | 11.41 | 7.46 | 4.41 | 11.17 | 15.14 | 47.33 |
| Variable | 0–50 µm | 51–71 µm | 72–100 µm | 101–125 µm | 126–200 µm | 201–315 µm | >315 µm | WBC (g/g) | OBC (g/g) | Insoluble Fibers (%) | Soluble Fibers (%) | Total Fibers (%) | Tannin (mg TA/g) | Tannin (%) |
|---|---|---|---|---|---|---|---|---|---|---|---|---|---|---|
| 0–50 µm | 1.000 | |||||||||||||
| 51–71 µm | 0.839 | 1.000 | ||||||||||||
| 72–100 µm | 0.006 | −0.083 | 1.000 | |||||||||||
| 101–125 µm | 0.364 | 0.199 | 0.819 | 1.000 | ||||||||||
| 126–200 µm | 0.430 | 0.402 | 0.803 | 0.908 | 1.000 | |||||||||
| 201–315 µm | −0.456 | −0.329 | 0.312 | 0.210 | 0.303 | 1.000 | ||||||||
| >315 µm | −0.809 | −0.795 | −0.467 | −0.717 | −0.851 | 0.018 | 1.000 | |||||||
| WBC (g/g) | −0.252 | −0.106 | −0.473 | −0.422 | −0.391 | 0.096 | 0.349 | 1.000 | ||||||
| OBC (g/g) | −0.827 | −0.838 | −0.103 | −0.479 | −0.600 | 0.114 | −0.862 | 0.233 | 1.000 | |||||
| Insoluble fibers (%) | −0.765 | −0.714 | −0.455 | −0.674 | −0.751 | 0.264 | 0.883 | 0.450 | 0.776 | 1.000 | ||||
| Soluble fibers (%) | −0.519 | −0.351 | 0.098 | −0.179 | −0.023 | 0.582 | 0.268 | 0.306 | 0.334 | 0.334 | 1.000 | |||
| Total fibers (%) | −0.791 | −0.723 | −0.425 | −0.666 | −0.722 | 0.318 | 0.875 | 0.464 | 0.780 | 0.994 | 0.435 | 1.000 | ||
| Tannin (mg TA/g) | −0.244 | −0.154 | 0.058 | −0.089 | 0.035 | 0.357 | 0.097 | −0.118 | −0.100 | 0.123 | 0.065 | 0.127 | 1.000 | |
| Tannin (%) | −0.768 | −0.747 | 0.004 | −0.365 | −0.511 | 0.018 | 0.762 | −0.014 | 0.844 | 0.635 | 0.167 | 0.627 | 0.067 | 1.000 |
© 2020 by the authors. Licensee MDPI, Basel, Switzerland. This article is an open access article distributed under the terms and conditions of the Creative Commons Attribution (CC BY) license (http://creativecommons.org/licenses/by/4.0/).
Share and Cite
Barišić, V.; Flanjak, I.; Kopjar, M.; Benšić, M.; Jozinović, A.; Babić, J.; Šubarić, D.; Miličević, B.; Doko, K.; Jašić, M.; et al. Does High Voltage Electrical Discharge Treatment Induce Changes in Tannin and Fiber Properties of Cocoa Shell? Foods 2020, 9, 810. https://doi.org/10.3390/foods9060810
Barišić V, Flanjak I, Kopjar M, Benšić M, Jozinović A, Babić J, Šubarić D, Miličević B, Doko K, Jašić M, et al. Does High Voltage Electrical Discharge Treatment Induce Changes in Tannin and Fiber Properties of Cocoa Shell? Foods. 2020; 9(6):810. https://doi.org/10.3390/foods9060810
Chicago/Turabian StyleBarišić, Veronika, Ivana Flanjak, Mirela Kopjar, Mirta Benšić, Antun Jozinović, Jurislav Babić, Drago Šubarić, Borislav Miličević, Kristina Doko, Midhat Jašić, and et al. 2020. "Does High Voltage Electrical Discharge Treatment Induce Changes in Tannin and Fiber Properties of Cocoa Shell?" Foods 9, no. 6: 810. https://doi.org/10.3390/foods9060810
APA StyleBarišić, V., Flanjak, I., Kopjar, M., Benšić, M., Jozinović, A., Babić, J., Šubarić, D., Miličević, B., Doko, K., Jašić, M., & Ačkar, Đ. (2020). Does High Voltage Electrical Discharge Treatment Induce Changes in Tannin and Fiber Properties of Cocoa Shell? Foods, 9(6), 810. https://doi.org/10.3390/foods9060810