
A Comprehensive and Comparative Study on the Biochemical Composition and Non-Volatile Taste Compounds of Thirteen Shellfish Species

 , , and
Abstract
1. Introduction
2. Materials and Methods
2.1. Materials and Reagents
2.2. Samples Pretreatment
2.3. Meat Yield and Proximate Composition
2.4. Amino Acids (AAs) and Free Amino Acids (FAAs) Analysis
2.5. Fatty Acids Analysis
2.6. Nucleotides Content Assay
2.7. Organic Acids Content Assay
2.8. Taste Activity Values (TAVs)
2.9. Equivalent Umami Concentrations (EUCs)
2.10. Statistical Analysis
3. Results and Discussion
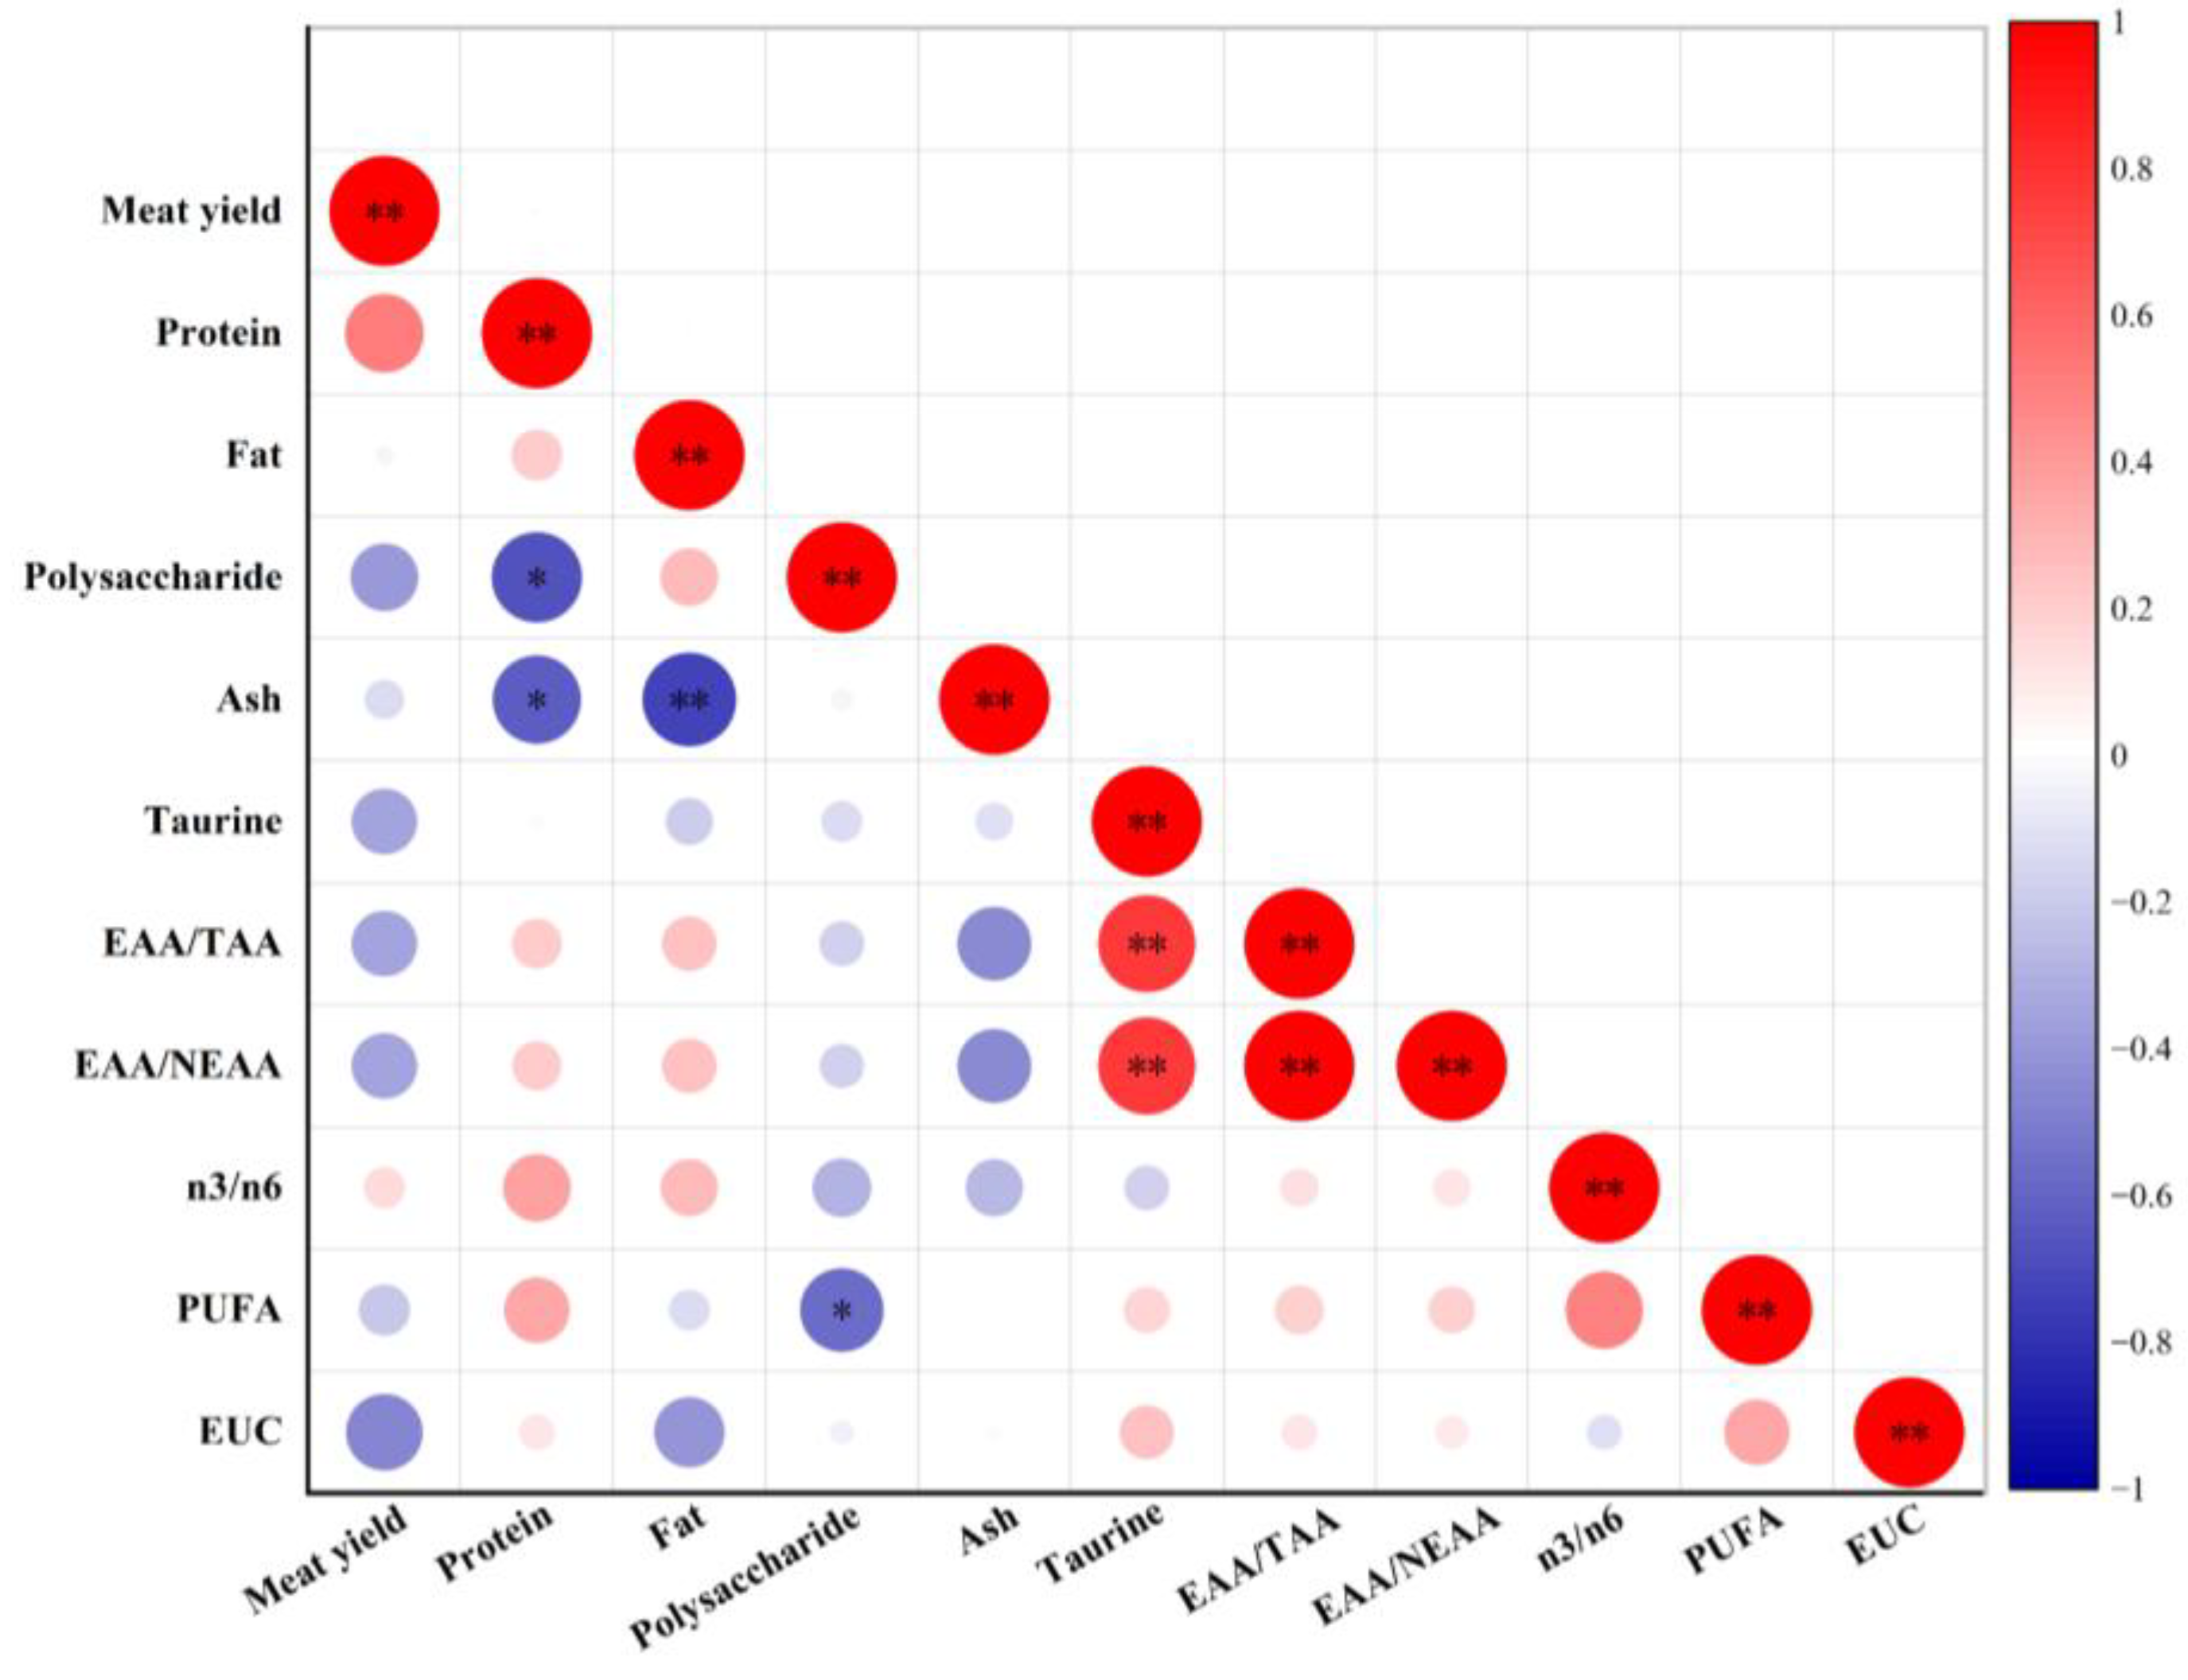
3.1. Meat Yield and Proximate Compositions
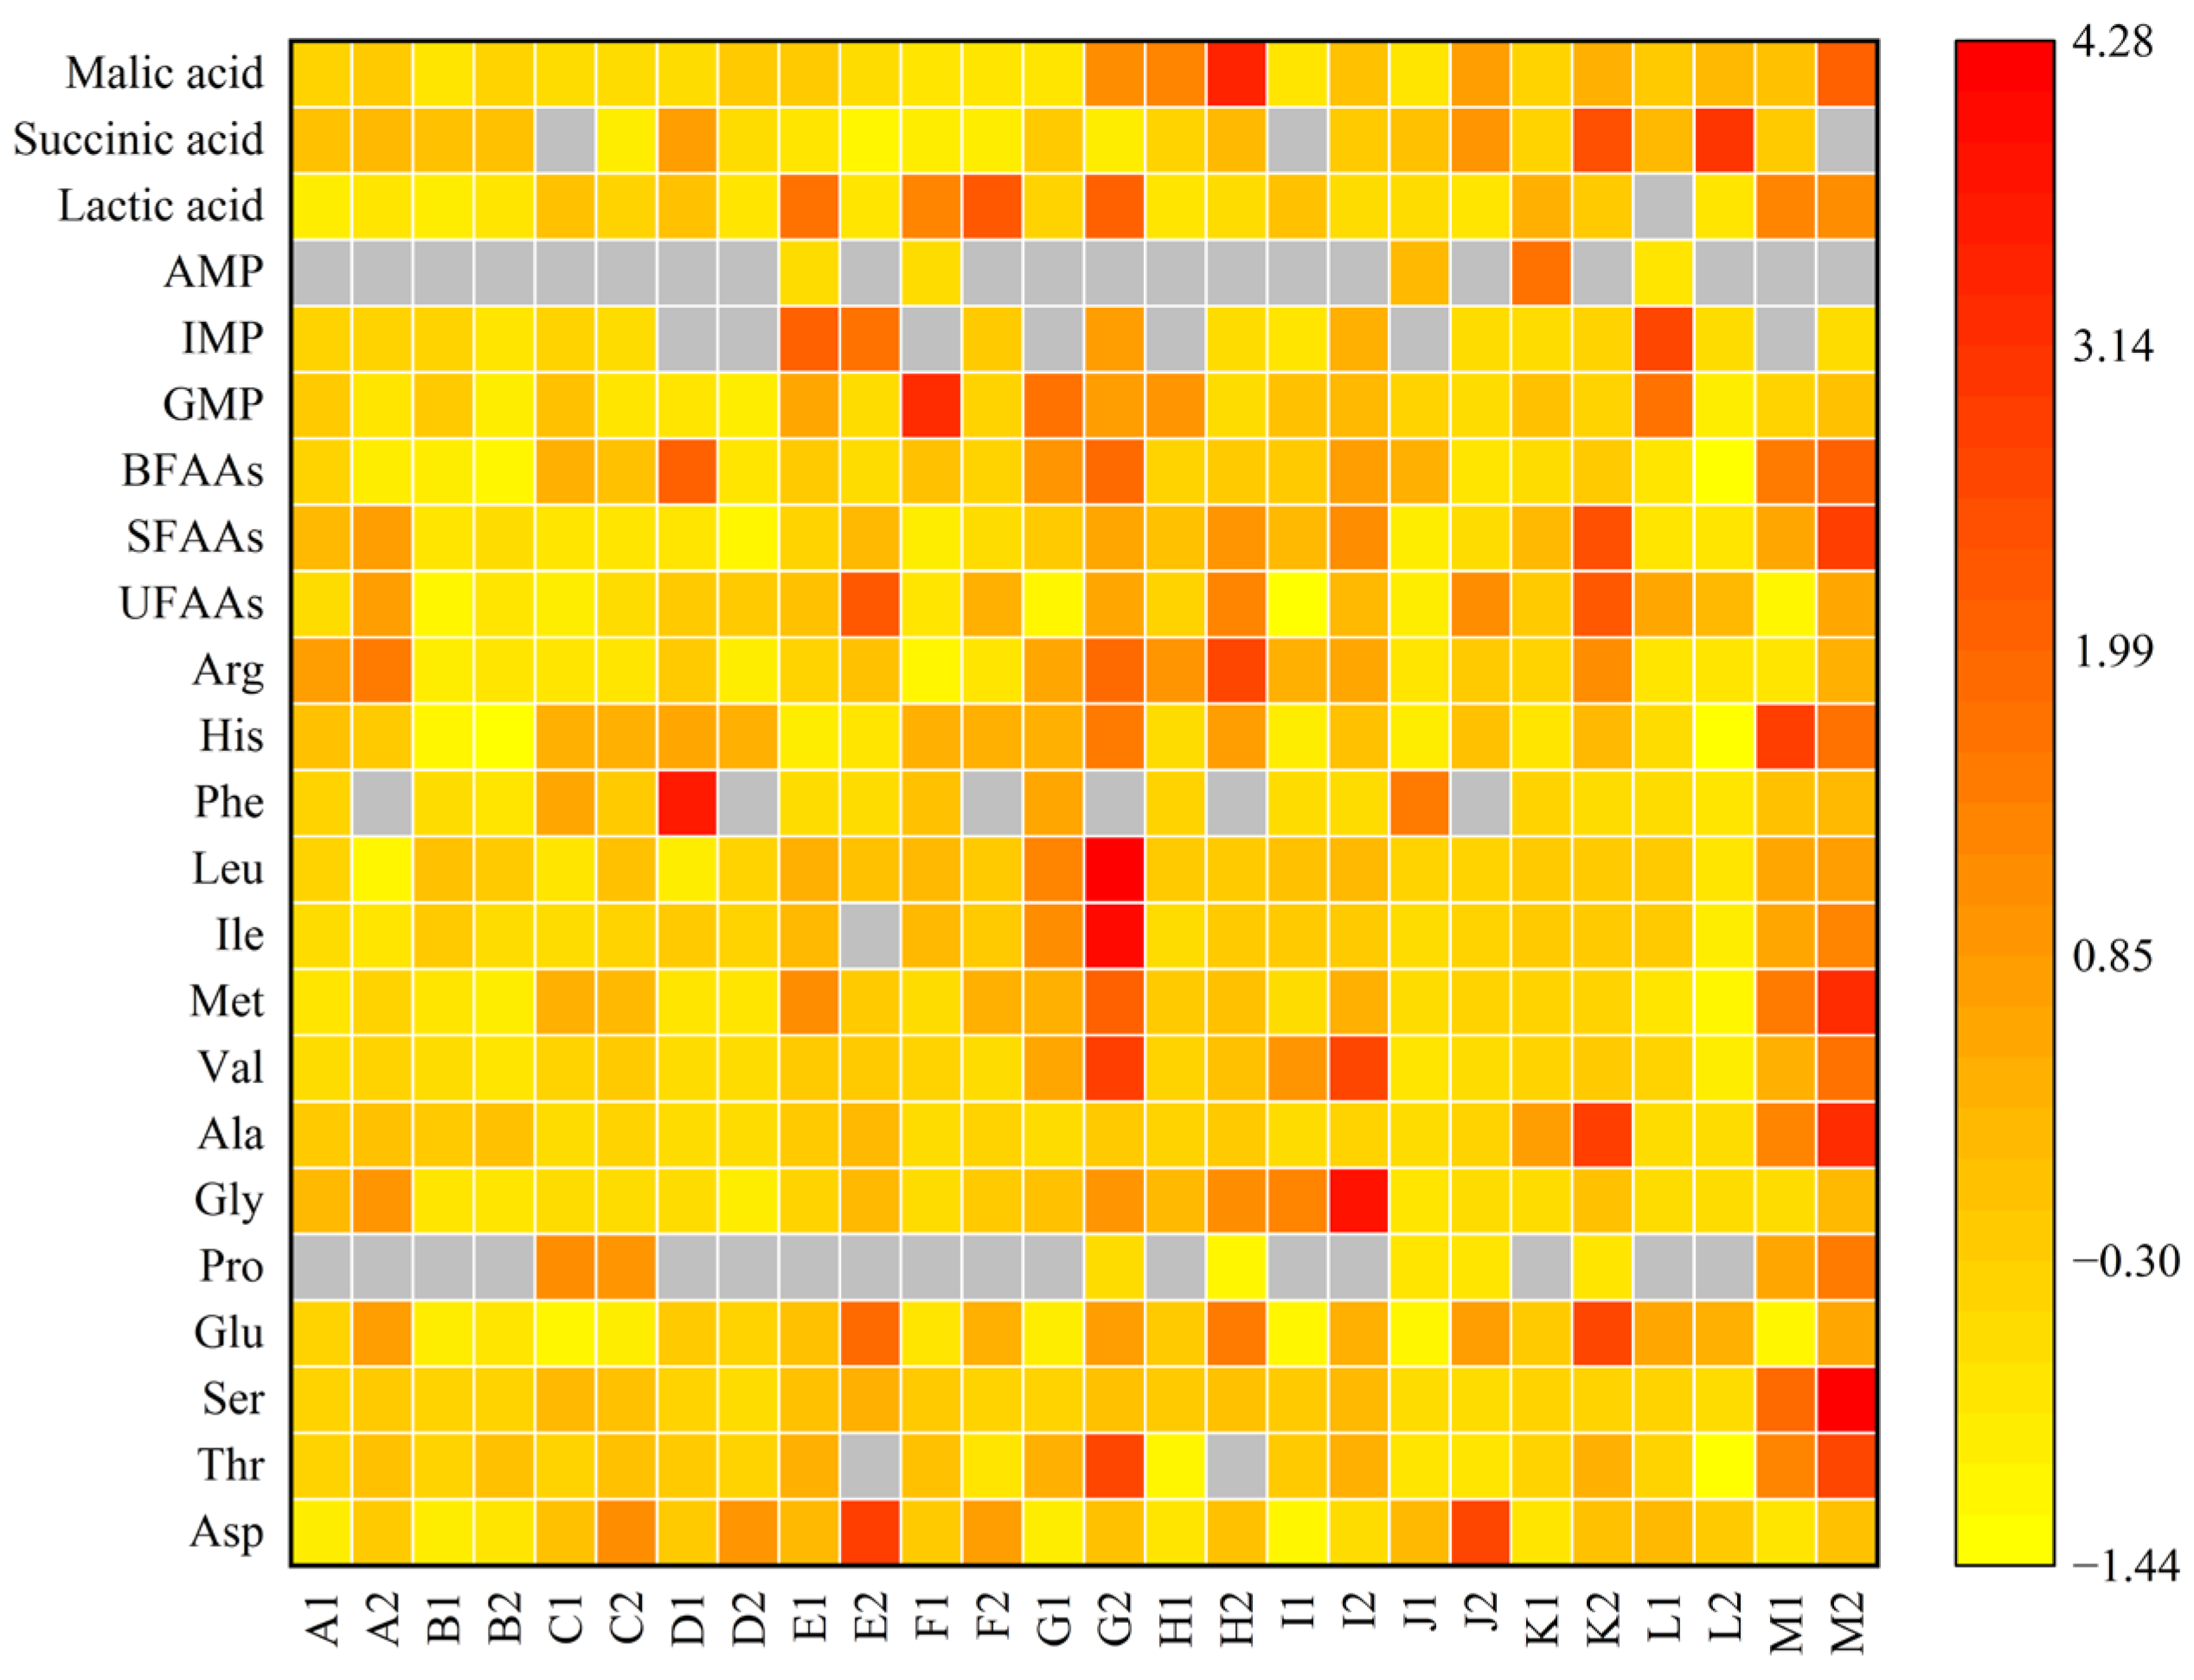
3.2. Amino Acids Analysis
3.3. Fatty Acids Composition
3.4. Free Amino Acids Analysis
3.5. 5′-Nucleotides Analysis
3.6. Organic Acids Analysis

| GMP | IMP | AMP | Lactic Acid | Succinic Acid | Malic Acid | ||
|---|---|---|---|---|---|---|---|
| Taste Threshold/(mg/100 mL) | 12.5 | 25 | 50 | 126 | 37 | 50 | |
| Shellfish meat | M. chinensis | 2.68 | 0.32 | - | 1.51 | 36.87 | 83.06 |
| C. sinensis | 2.55 | 0.33 | - | 0.03 | 34.78 | 36.61 | |
| C. gigas | 3.39 | 0.28 | - | 12.33 | - | 53.61 | |
| S. broughtonii | 1.24 | - | - | 11.30 | 53.09 | 47.71 | |
| R. philippinarum | 4.60 | 2.10 | 0.03 | 30.66 | 10.95 | 101.59 | |
| M. galloprovincialis | 12.12 | - | 0.03 | 26.40 | 9.35 | 29.89 | |
| C. californiense | 7.99 | - | - | 8.10 | 28.21 | 30.15 | |
| S. strictus | 5.74 | - | - | 3.25 | 24.95 | 271.49 | |
| C. farreri | 3.34 | 0.02 | - | 12.48 | - | 20.83 | |
| S. subcrenata | 2.55 | - | 0.05 | 5.17 | 36.61 | 28.55 | |
| M. veneriformis | 3.40 | 0.15 | 0.09 | 15.08 | 24.99 | 65.05 | |
| M. meretrix | 7.92 | 2.52 | 0.03 | - | 41.67 | 87.55 | |
| S. constricta | 2.06 | - | - | 26.41 | 26.67 | 114.01 | |
| Boiling liquids | M. chinensis | 1.36 | 0.31 | - | 3.39 | 37.56 | 90.88 |
| C. sinensis | 0.68 | 0.08 | - | 2.87 | 33.92 | 64.50 | |
| C. gigas | 1.30 | 0.13 | - | 7.05 | 9.15 | 49.52 | |
| S. broughtonii | 0.74 | - | - | 3.83 | 19.86 | 87.52 | |
| R. philippinarum | 2.02 | 1.83 | - | 3.55 | 3.73 | 50.29 | |
| M. galloprovincialis | 2.25 | 0.39 | - | 37.79 | 6.69 | 31.80 | |
| C. californiense | 5.12 | 1.13 | - | 34.60 | 10.21 | 253.63 | |
| S. strictus | 1.83 | 0.15 | - | 5.13 | 40.65 | 506.00 | |
| C. farreri | 3.80 | 0.86 | - | 4.88 | 29.42 | 115.18 | |
| S. subcrenata | 1.55 | 0.21 | - | 4.06 | 59.55 | 196.23 | |
| M. veneriformis | 2.28 | 0.39 | - | 9.44 | 100.05 | 168.01 | |
| M. meretrix | 1.00 | 0.23 | - | 2.26 | 115.65 | 142.52 | |
| S. constricta | 3.12 | 0.19 | - | 25.59 | - | 354.28 | |
3.7. EUC Analysis
3.8. PCA
4. Conclusions
Author Contributions
Funding
Data Availability Statement
Conflicts of Interest
References
- Tan, K.; Lu, S.-Y.; Tan, K.; Ransangan, J.; Cai, X.; Cheong, K.-L. Bioactivity of polysaccharides derived from bivalves. Int. J. Biol. Macromol. 2023, 250, 126096. [Google Scholar] [CrossRef] [PubMed]
- Xu, Z.; Huang, L.; Xu, P.; Lim, L.; Cheong, K.-L.; Wang, Y.; Tan, K. Microplastic pollution in commercially important edible marine bivalves: A comprehensive review. Food Chem. X 2024, 23, 101647. [Google Scholar] [CrossRef] [PubMed]
- Fishery and Fishery Administration Bureau of the Ministry of Agriculture and Rural Affairs. China Fishery Statistical Yearbook; China Agriculture Press: Beijing, China, 2024; pp. 17–51. [Google Scholar]
- Song, J.; Luo, C.; Lim, L.; Cheong, K.-L.; Farhadi, A.; Tan, K. Protein quality of commercially important edible bivalves. Crit. Rev. Food Sci. Nutr. 2025, 65, 1950–1961. [Google Scholar] [CrossRef] [PubMed]
- Wright, A.C.; Fan, Y.; Baker, G.L. Nutritional value and food safety of bivalve molluscan shellfish. J. Shellfish Res. 2018, 37, 695–708. [Google Scholar] [CrossRef]
- Halczuk, K.; Kazmierczak-Baranska, J.; Karwowski, B.T.; Karmanska, A.; Cieslak, M. Vitamin B12-multifaceted in vivo functions and in vitro applications. Nutrients 2023, 15, 2734. [Google Scholar] [CrossRef]
- Yang, F.; Zhao, D.; Zhang, K.; Wang, Z.; Wang, Y.; Wu, C.; Cui, S.; Guo, T.; Chen, L.; Chen, J. Oral delivery of marine shellfish supramolecule peptides for skin wound healing. Colloids Surf. B-Biointerfaces 2022, 216, 112592. [Google Scholar] [CrossRef]
- Lv, M.; Liu, M.; Zou, S.; Yin, D.; Lv, C.; Li, F.; Wei, Y. Immune enhancement of clam peptides on immunosuppressed mice induced by hydrocortisone. Molecules 2023, 28, 5709. [Google Scholar] [CrossRef]
- Willer, D.F.; Aldridge, D.C. Sustainable bivalve farming can deliver food security in the tropics. Nat. Food 2020, 1, 384–388. [Google Scholar] [CrossRef]
- Veselina, P.; Albena, M.; Dobreva, D.A. Nutritional composition, bioactive compounds and health-beneficial properties of black sea shellfish. J. IMAB 2020, 26, 3293–3297. [Google Scholar] [CrossRef]
- Karaulova, E.P.; Yakush, E.V.; Slutskaya, T.N.; Shulgina, L.V. Proximate composition, antioxidant properties, and hepatoprotective activity of three species of shellfish of the pacific coast of Russia. Molecules 2021, 26, 3397. [Google Scholar] [CrossRef]
- Cherifi, H.; Ajjabi, L.C.; Sadok, S. Nutritional value of the Tunisian mussel Mytilus galloprovincialis with a special emphasis on lipid quality. Food Chem. 2018, 268, 307–314. [Google Scholar] [CrossRef] [PubMed]
- Blandlino, F.; Di Leo, A.; Parlapiano, I.; Papa, L.; Giandomenico, S.; Spada, L.; Prato, E. Nutritional quality of edible marine bivalves from the southern coast of Italy, Mediterranean Sea. Pol. J. Food Nutr. Sci. 2019, 69, 71–81. [Google Scholar] [CrossRef]
- Puertolas, E.; Garcia-Munoz, S.; Caro, M.; Alvarez-Sabatel, S. Effect of different cold storage temperatures on the evolution of shucking yield and quality properties of offshore cultured Japanese oyster (Magallana gigas) treated by high pressure processing (HPP). Foods 2023, 12, 1156. [Google Scholar] [CrossRef] [PubMed]
- Hirabayasi, M.; Okazaki, T.; Tanimoto, S. Seasonal variation of extractive components in Mytilus galloprovincialis mussels. Fish. Sci. 2021, 87, 599–607. [Google Scholar] [CrossRef]
- Cho, W.I.; Kim, S.M. Taste compounds and biofunctional activities of the sandy beach clam hydrolysate for the shellfish flavoring condiment. J. Aquat. Food Prod. Technol. 2016, 25, 24–34. [Google Scholar] [CrossRef]
- Tremblay, A.; Corcuff, R.; Goulet, C.; Godefroy, S.B.; Doyen, A.; Beaulieu, L. Valorization of American lobster (Homarus americanus) cooking waters: Preparation and characterization of a food ingredient. J. Food Process. Preserv. 2021, 45, e15665. [Google Scholar] [CrossRef]
- Cros, S.; Lignot, B.; Bourseau, P.; Jaouen, P. Reverse osmosis for the production of aromatic concentrates from mussel cooking juices: A technical assessment. Desalination 2005, 180, 263–269. [Google Scholar] [CrossRef]
- Walha, K.; Ben Amar, R.; Masse, A.; Bourseau, P.; Cardinal, M.; Cornet, J.; Prost, C.; Jaouen, P. Aromas potentiality of tuna cooking juice concentrated by nanofiltration. LWT Food Sci. Technol. 2011, 44, 153–157. [Google Scholar] [CrossRef]
- Siewe, F.B.; Makebe, C.W.; Muala, W.C.B.; Laya, A.; Nkongho, N.R.; Meliko, M.O.; Kudre, T.G.; Bhaskar, N. Advances in processing, reaction pathways, stabilisation and food applications of natural seafood flavourings. Food Biosci. 2024, 58, 103627. [Google Scholar] [CrossRef]
- Cha, Y.J.; Cadwallader, K.R.; Baek, H.H. Volatile flavor components in snow crab cooker effluent and effluent concentrate. J. Food Sci. 1993, 58, 525–530. [Google Scholar] [CrossRef]
- Tremblay, A.; Corcuff, R.; Goulet, C.; Godefroy, S.B.; Doyen, A.; Beaulieu, L. Valorization of snow crab (Chionoecetes opilio) cooking effluents for food applications. J. Sci. Food Agric. 2020, 100, 384–393. [Google Scholar] [CrossRef] [PubMed]
- GB 5009.5-2016; Determination of Protein in Food. Standards Press of China: Beijing, China, 2016.
- GB 5009.6-2016; Determination of Fat in Food. Standards Press of China: Beijing, China, 2016.
- GB/T 9695.31-2008; Meat Products-Determination of Total Sugars Content. Standards Press of China: Beijing, China, 2008.
- GB 5009.4-2016; Determination of Ash in Food. Standards Press of China: Beijing, China, 2016.
- GB 5009.124-2016; Determination of Amino Acids in Food. Standards Press of China: Beijing, China, 2016.
- GB/T 15400-2018; Determination of Tryptophan in Feeds. Standards Press of China: Beijing, China, 2018.
- Bi, Y.; Shan, Q.; Luo, R.; Bai, S.; Ji, C.; Wang, Y.; Gao, S.; Guo, J.; Hu, X.; Dong, F. Dynamic changes in water mobility and taste substances of cooked Tan lamb meat after chilled storage. J. Food Compos. Anal. 2023, 117, 105133. [Google Scholar] [CrossRef]
- Zheng, J.; Li, J.; Song, Z.; Liu, Y.; Yu, D.; Wang, Q.; Jiang, C.; Li, L.; Fu, Z.; Jiang, P. Effects of different thermal cooking methods on the characteristic taste and flavor compounds of Solen grandis meat. LWT Food Sci. Technol. 2025, 217, 117439. [Google Scholar] [CrossRef]
- GB 5009.169-2016; Determination of Taurine in Food. Standards Press of China: Beijing, China, 2016.
- Saito, H.; Osako, K. Confirmation of a new food chain utilizing geothermal energy: Unusual fatty acids of a deep-sea bivalve, Calyptogena phaseoliformis. Limnol. Oceanogr. 2007, 52, 1910–1918. [Google Scholar] [CrossRef]
- Coulier, L.; Bas, R.; Jespersen, S.; Verheij, E. Simultaneous quantitative analysis of metabolites using ion-pair liquid chromatography−electrospray ionization mass spectrometry. Anal. Chem. 2006, 78, 6573–6582. [Google Scholar] [CrossRef]
- Liu, C.; Meng, F.; Tang, X.; Shi, Y.; Wang, A.; Gu, Z.; Pan, Z. Comparison of nonvolatile taste active compounds of wild and cultured mud crab Scylla paramamosain. Fish. Sci. 2018, 84, 897–907. [Google Scholar] [CrossRef]
- Zheng, J.-y.; Tao, N.-p.; Gong, J.; Gu, S.-Q.; Xu, C.-h. Comparison of non-volatile taste-active compounds between the cooked meats of pre- and post-spawning Yangtze Coilia ectenes. Fish. Sci. 2015, 81, 559–568. [Google Scholar] [CrossRef]
- Yamaguchi, S. The synergistic taste effect of monosodium glutamate and disodium 5′-inosinate. J. Food Sci. 1967, 32, 473–478. [Google Scholar] [CrossRef]
- Pedersen, A.F.; Gopalakrishnan, K.; Boegehold, A.G.; Peraino, N.J.; Westrick, J.A.; Kashian, D.R. Microplastic ingestion by quagga mussels, Dreissena bugensis, and its effects on physiological processes. Environ. Pollut. 2020, 260, 113964. [Google Scholar] [CrossRef]
- Imeson, R.J.; van den Bergh, J. Policy failure and stakeholder dissatisfaction in complex ecosystem management: The case of the Dutch Wadden Sea shellfishery. Ecol. Econ. 2006, 56, 488–507. [Google Scholar] [CrossRef]
- Zhang, Y.; Wang, H.; Liu, S.; Kong, X.; Chang, L.; Zhao, L.; Bao, Z.; Hu, X. Multi-tissue metabolomic profiling reveals the crucial metabolites and pathways associated with scallop growth. BMC Genom. 2024, 25, 1091. [Google Scholar] [CrossRef] [PubMed]
- Desai, D.V.; Gardade, L.; Khandeparker, L.; Anil, A.C. Habitat characteristics mediated partitioning of economically important bivalves in a tropical monsoon-influenced estuary. Environ. Sci. Pollut. Res. 2020, 27, 29303–29326. [Google Scholar] [CrossRef] [PubMed]
- Ahn, I.-Y.; Cho, K.W.; Choi, K.-S.; Seo, Y.; Shin, J. Lipid content and composition of the Antarctic lamellibranch, Laternula elliptica (King & Broderip) (Anomalodesmata: Laternulidae), in King George Island during an austral summer. Polar Biol. 2000, 23, 24–33. [Google Scholar]
- Dupčić-Radić, I.; Carić, M.; Najdek-Dragić, M.; Jasprica, N.; Bolotin, J.; Peharda, M.; Bratoš Cetinić, A. Biochemical and fatty acid composition of Arca noae (Bivalvia: Arcidae) from the Mali Ston Bay, Adriatic Sea. Mediterr. Mar. Sci. 2014, 15, 520–531. [Google Scholar] [CrossRef]
- Ngo, T.T.T.; Kang, S.G.; Kang, D.H.; Sorgeloos, P.; Choi, K.S. Effect of culture depth on the proximate composition and reproduction of the Pacific oyster, Crassostrea gigas from Gosung Bay, Korea. Aquaculture 2006, 253, 712–720. [Google Scholar] [CrossRef]
- Oh, E.G.; Shin, S.B.; Park, K.; Lim, C.-W. Seasonal variation in the proximate composition, pH and glycogen content of oysters Crassostrea gigas collected in Geoje and Jaran Bay in Korea. Korean J. Fish. Aquat. Sci. 2014, 47, 713–718. [Google Scholar] [CrossRef]
- Chen, L.; Yu, F.; Shi, H.; Wang, Q.; Xue, Y.; Xue, C.; Wang, Y.; Li, Z. Effect of salinity stress on respiratory metabolism, glycolysis, lipolysis, and apoptosis in Pacific oyster (Crassostrea gigas) during depuration stage. J. Sci. Food Agric. 2022, 102, 2003–2011. [Google Scholar] [CrossRef]
- Xiang, X.; Jiang, Q.; Yang, H.; Zhou, X.; Chen, Y.; Chen, H.; Liu, S.; Chen, L. A review on shellfish polysaccharides: Extraction, characterization and amelioration of metabolic syndrome. Front. Nutr. 2022, 9, 974860. [Google Scholar] [CrossRef]
- Day, L.; Cakebread, J.A.; Loveday, S.M. Food proteins from animals and plants: Differences in the nutritional and functional properties. Trends Food Sci. Technol. 2022, 119, 428–442. [Google Scholar] [CrossRef]
- Chasquibol, N.; Gonzales, B.F.; Alarcon, R.; Sotelo, A.; Marquez-Lopez, J.C.; Rodriguez-Martin, N.M.; del Carmen Millan-Linares, M.; Millan, F.; Pedroche, J. Optimisation and characterisation of the protein hydrolysate of scallops (Argopecten purpuratus) visceral by-products. Foods 2023, 12, 2003. [Google Scholar] [CrossRef]
- Jeong, Y.-R.; Park, J.-S.; Nkurunziza, D.; Cho, Y.-J.; Chun, B.-S. Valorization of blue mussel for the recovery of free amino acids rich products by subcritical water hydrolysis. J. Supercrit. Fluids 2021, 169, 105135. [Google Scholar] [CrossRef]
- Asha, K.K.; Anandan, R.; Mathew, S.; Lakshmanan, P.T. Biochemical profile of oyster Crassostrea madrasensis and its nutritional attributes. Egypt. J. Aquat. Res. 2014, 40, 35–41. [Google Scholar] [CrossRef]
- Moniruzzaman, M.; Sku, S.; Chowdhury, P.; Tanu, M.B.; Yeasmine, S.; Hossen, M.N.; Min, T.; Bai, S.C.; Mahmud, Y. Nutritional evaluation of some economically important marine and freshwater mollusc species of Bangladesh. Heliyon 2021, 7, e07088. [Google Scholar] [CrossRef] [PubMed]
- Chakraborty, K.; Chakkalakal, S.J.; Joseph, D.; Joy, M. Nutritional composition of edible oysters (Crassostrea madrasensis L.) from the south west coast of India. J. Aquat. Food Prod. Technol. 2016, 25, 1172–1189. [Google Scholar] [CrossRef]
- Adhikari, S.; Schop, M.; de Boer, I.J.M.; Huppertz, T. Protein quality in perspective: A review of protein quality metrics and their applications. Nutrients 2022, 14, 947. [Google Scholar] [CrossRef]
- Hong, H.-K.; Koo, J.-H.; Ko, J.-C.; Jeung, H.-D.; Choi, K.-S. Proximate composition, amino acids, and fatty acids in the adductor muscle of the giant honeycomb oyster Hyotissa hyotis (Linnaeus, 1758) from Jeju Island, Korea. J. Shellfish Res. 2022, 41, 101–107. [Google Scholar] [CrossRef]
- Song, D.; Peng, J.; Zhao, X.; Wu, H.; Zheng, G.; Zhao, Y.; Jiang, Y.; Sheng, X.; Guo, M.; Tan, Z. Quality and safety profiles of Chlamys farreri cultured in the Shandong peninsula: Analysis of nutritional content, flavor, and hazards. J. Food Compos. Anal. 2023, 118, 105193. [Google Scholar] [CrossRef]
- Richie, J.P.P., Jr.; Sinha, R.; Dong, Z.; Nichenametla, S.N.; Ables, G.P.; Ciccarella, A.; Sinha, I.; Calcagnotto, A.M.; Chinchilli, V.M.; Reinhart, L.; et al. Dietary methionine and total sulfur amino acid restriction in healthy adults. J. Nutr. Health Aging 2023, 27, 111–123. [Google Scholar] [CrossRef]
- Valenzuela, A.; Oyarzun, P.A.; Toro, J.E.; Navarro, J.M.; Ramirez, O.; Farias, A. Proximal and fatty acid analysis in Ostrea chilensis, Crassostrea gigas and Mytilus chilensis (Bivalvia: Mollusca) from southern Chile. PLoS ONE 2022, 17, e0270825. [Google Scholar] [CrossRef]
- Şereflişan, H.; Altun, B.E. Amino acid and fatty acid composition of freshwater mssels, Anodonta pseudodopsis and Unio tigridis. Pak. J. Zool. 2018, 50, 2153–2158. [Google Scholar] [CrossRef]
- Zhu, Y.; Li, Q.; Yu, H.; Kong, L. Biochemical composition and nutritional value of different shell color strains of Pacific oyster Crassostrea gigas. J. Ocean Univ. China 2018, 17, 897–904. [Google Scholar] [CrossRef]
- Saikia, D.K.; Chikkaputtaiah, C.; Velmurugan, N. A review of polyunsaturated fatty acids (PUFA) of marine zoosporic microorganisms and their commercialization. Bot. Mar. 2023, 66, 331–344. [Google Scholar] [CrossRef]
- Berge, J.P.; Barnathan, G. Marine Biotechnology I; Gal, Y.L., Ulber, R., Eds.; Springer: Berlin/Heidelberg, Germany, 2005; pp. 49–125. [Google Scholar]
- Ran, Z.; Chen, H.; Ran, Y.; Yu, S.; Li, S.; Xu, J.; Liao, K.; Yu, X.; Zhong, Y.; Ye, M.; et al. Fatty acid and sterol changes in razor clam Sinonovacula constricta (Lamarck 1818) reared at different salinities. Aquaculture 2017, 473, 493–500. [Google Scholar] [CrossRef]
- Kong, F.; Ran, Z.; Xie, H.; Tian, X.; Liao, K.; Xu, J. Effects of three microalgal diets varying in LC-PUFA composition on growth,Fad, and Elovl expressions, and fatty acid profiles in juvenile razor Clam Sinonovacula constricta. Fishes 2023, 8, 484. [Google Scholar] [CrossRef]
- Hu, X.; An, Q.; Zhou, D.; Lu, T.; Yin, F.; Song, L.; Zhao, Q.; Zhang, J.; Qin, L.; Zhu, B.; et al. Lipid profiles in different parts of two species of scallops (Chlamys farreri and Patinopecten yessoensis). Food Chem. 2018, 243, 319–327. [Google Scholar] [CrossRef]
- Dagorn, F.; Couzinet-Mossion, A.; Kendel, M.; Beninger, P.G.; Rabesaotra, V.; Barnathan, G.; Wielgosz-Collin, G. Exploitable lipids and fatty acids in the invasive oyster Crassostrea gigas on the French Atlantic coast. Mar. Drugs 2016, 14, 104. [Google Scholar] [CrossRef]
- AbuMweis, S.; Abu Omran, D.; Al-Shami, I.; Jew, S. The ratio of eicosapentaenoic acid to docosahexaenoic acid as a modulator for the cardio-metabolic effects of omega-3 supplements: A meta-regression of randomized clinical trials. Complement. Ther. Med. 2021, 57, 102662. [Google Scholar] [CrossRef]
- So, J.; Wu, D.; Lichtenstein, A.H.; Tai, A.K.; Matthan, N.R.; Maddipati, K.R.; Lamon-Fava, S. EPA and DHA differentially modulate monocyte inflammatory response in subjects with chronic inflammation in part via plasma specialized pro-resolving lipid mediators: A randomized, double-blind, crossover study. Atherosclerosis 2021, 316, 90–98. [Google Scholar] [CrossRef]
- Liu, Y.-F.; Yin, F.-W.; Liu, Y.-X.; Wu, Z.-X.; Zhang, J.; Zhao, Q.; Rakariyatham, K.; Zhou, D.-Y. Characterization of glycerophospholipid molecular species in two species of arcidaes (Scapharca subcrenata and Scapharca broughtonii). J. Aquat. Food Prod. Technol. 2019, 28, 342–351. [Google Scholar] [CrossRef]
- Chakraborty, N.; Gautam, A.; Muhie, S.; Miller, S.-A.; Meyerhoff, J.; Sowe, B.; Jett, M.; Hammamieh, R. Potential roles of polyunsaturated fatty acid-enriched diets in modulating social stress-like features. J. Nutr. Biochem. 2023, 116, 109309. [Google Scholar] [CrossRef]
- Çelik, M.; Türeli, C.; Çelik, M.; Yanar, Y.; Erdem, Ü.; Küçükgülmez, A. Fatty acid composition of the blue crab (Callinectes sapidus Rathbun, 1896) in the north eastern Mediterranean. Food Chem. 2004, 88, 271–273. [Google Scholar] [CrossRef]
- Prato, E.; Biandolino, F. Total lipid content and fatty acid composition of commercially important fish species from the Mediterranean, Mar Grande Sea. Food Chem. 2012, 131, 1233–1239. [Google Scholar] [CrossRef]
- Rincon-Cervera, M.A.; Gonzalez-Barriga, V.; Romero, J.; Rojas, R.; Lopez-Arana, S. Quantification and distribution of omega-3 fatty acids in south pacific fish and shellfish species. Foods 2020, 9, 233. [Google Scholar] [CrossRef] [PubMed]
- Wei, Y.; Shen, H.; Xu, W.; Pan, Y.; Chen, J.; Zhang, W.; Mai, K. Replacement of dietary fishmeal by Antarctic krill meal on growth performance, intestinal morphology, body composition and organoleptic quality of large yellow croaker Larimichthys crocea. Aquaculture 2019, 512, 734281. [Google Scholar] [CrossRef]
- Ramirez-Guerrero, S.; Guardo-Maya, S.; Medina-Rincon, G.J.; Orrego-Gonzalez, E.E.; Cabezas-Perez, R.; Gonzalez-Reyes, R.E. Taurine and astrocytes: A homeostatic and neuroprotective relationship. Front. Mol. Neurosci. 2022, 15, 937789. [Google Scholar] [CrossRef]
- Yousuf, M.; Shamsi, A.; Mohammad, T.; Azum, N.; Alfaifi, S.Y.M.; Asiri, A.M.; Elasbali, A.M.; Islam, A.; Hassan, M.I.; Haque, Q.M.R. Inhibiting cyclin-dependent kinase 6 by taurine: Implications in anticancer therapeutics. ACS Omega 2022, 7, 25844–25852. [Google Scholar] [CrossRef]
- Marinopoulou, A.; Petridis, D. A comparative study of the effect of different cooking methods on the quality and shucking of mussels. J. Food Process. Preserv. 2022, 46, e15875. [Google Scholar] [CrossRef]
- Liu, C.; Ji, W.; Jiang, H.; Shi, Y.; He, L.; Gu, Z.; Zhu, S. Comparison of biochemical composition and non-volatile taste active compounds in raw, high hydrostatic pressure-treated and steamed oysters Crassostrea hongkongensis. Food Chem. 2021, 344, 128632. [Google Scholar] [CrossRef]
- Ovissipour, M.; Rasco, B.; Tang, J.; Sablani, S.S. Kinetics of quality changes in whole blue mussel (Mytilus edulis) during pasteurization. Food Res. Int. 2013, 53, 141–148. [Google Scholar] [CrossRef]
- Bi, S.; Chen, L.; Sun, Z.; Wen, Y.; Xue, Q.; Xue, C.; Li, Z.; Sun, C.; Wei, Z.; Liu, H. Investigating influence of aquaculture seawater with different salinities on non-volatile taste-active compounds in Pacific oyster (Crassostrea gigas). J. Food Meas. Charact. 2021, 15, 2078–2087. [Google Scholar] [CrossRef]
- Zhao, Y.; Zhang, M.; Devahastin, S.; Liu, Y. Progresses on processing methods of umami substances: A review. Trends Food Sci. Technol. 2019, 93, 125–135. [Google Scholar] [CrossRef]
- Chen, J.; Huang, X.; Zheng, J.; Sun, Y.; Dong, X.; Zhou, D.; Zhu, B.; Qin, L. Comprehensive metabolomic and lipidomic profiling of the seasonal variation of blue mussels (Mytilus edulis L.): Free amino acids, 5′-nucleotides, and lipids. LWT Food Sci. Technol. 2021, 149, 111835. [Google Scholar] [CrossRef]
- Zhang, N.; Wang, W.; Li, B.; Liu, Y. Non-volatile taste active compounds and umami evaluation in two aquacultured pufferfish (Takifugu obscurus and Takifugu rubripes). Food Biosci. 2019, 32, 100468. [Google Scholar] [CrossRef]
- Zhang, J.; Tu, Z.; Hu, Z.; Hu, Y.; Wang, H. Efficient preparation of oyster hydrolysate with aroma and umami coexistence derived from ultrasonic pretreatment assisted enzymatic hydrolysis. Food Chem. 2024, 437, 137881. [Google Scholar] [CrossRef]
- Hong, H.; Regenstein, J.M.; Luo, Y. The importance of ATP-related compounds for the freshness and flavor of post-mortem fish and shellfish muscle: A review. Crit. Rev. Food Sci. Nutr. 2017, 57, 1787–1798. [Google Scholar] [CrossRef]
- Liu, Y.-X.; Zhang, Y.-Y.; Zheng, J.; Chen, J.-N.; Huang, X.-H.; Dong, X.-P.; Zhu, B.-W.; Qin, L. Seasonal variations in free amino acid, 5′-nucleotide, and lipid profiles of scallop (Patinopecten yessoensis) revealed by targeted and untargeted metabolomic approaches. LWT Food Sci. Technol. 2022, 154, 112881. [Google Scholar] [CrossRef]
- Dong, S.; Niu, Y.; Wei, H.; Lin, Y.; Lu, X.; Yamashita, T.; Yu, K.; Takaki, K.; Yuan, C. Effect of super-chilling storage on maintenance of quality and freshness of the Pacific oyster (Crassostrea gigas). Food Qual. Saf. 2023, 7, fyad008. [Google Scholar] [CrossRef]
- Wei, H.; Tian, Y.; Yamashita, T.; Ishimura, G.; Sasaki, K.; Niu, Y.; Yuan, C. Effects of thawing methods on the biochemical properties and microstructure of pre-rigor frozen scallop striated adductor muscle. Food Chem. 2020, 319, 126559. [Google Scholar] [CrossRef]
- Shi, Y.; Pu, D.; Zhou, X.; Zhang, Y. Recent progress in the study of taste characteristics and the nutrition and health properties of organic acids in foods. Foods 2022, 11, 3408. [Google Scholar] [CrossRef]
- Zhu, S.; Zhu, L.; Ke, Z.; Chen, H.; Zheng, Y.; Yang, P.; Xiang, X.; Zhou, X.; Jin, Y.; Deng, S.; et al. A comparative study on the taste quality of Mytilus coruscus under different shucking treatments. Food Chem. 2023, 412, 135480. [Google Scholar] [CrossRef]
- Wang, S.Y.; Zhang, L.Y. Enhancing effects of organic acids on saltiness of low-sodium salt. Sci. Technol. Food Ind. 2012, 33, 370–373. [Google Scholar] [CrossRef]
- Sato, T.; Ohgami, S.-I.; Kaneniwa, M. Seasonal variations in free amino acids, nucleotide-related compounds, and fatty acids and meat yield of the coconut crab Birgus latro. Fish. Sci. 2015, 81, 959–970. [Google Scholar] [CrossRef]
- Granato, D.; Santos, J.S.; Escher, G.B.; Ferreira, B.L.; Maggio, R.M. Use of principal component analysis (PCA) and hierarchical cluster analysis (HCA) for multivariate association between bioactive compounds and functional properties in foods: A critical perspective. Trends Food Sci. Technol. 2018, 72, 83–90. [Google Scholar] [CrossRef]
- Shen, G.; Ru, X.; Gu, Y.; Liu, W.; Wang, K.; Li, B.; Guo, Y.; Han, J. Pollution characteristics, spatial distribution, and evaluation of heavy metal(loid)s in farmland soils in a typical mountainous hilly area in China. Foods 2023, 12, 681. [Google Scholar] [CrossRef] [PubMed]


| Meat Yield | Crude Protein | Crude Fat | Crude Polysaccharide | Ash | |
|---|---|---|---|---|---|
| M. chinensis | 52.44 | 64.50 ± 0.55 a | 2.05 ± 0.09 e | 4.37 ± 0.20 h | 23.93 ± 0.04 c |
| C. sinensis | 33.10 | 41.24 ± 0.82 f | 1.83 ± 0.18 e | 15.03 ± 0.23 d | 37.62 ± 0.33 a |
| C. gigas | 11.57 | 45.82 ± 1.00 e | 5.65 ± 0.37 b | 20.93 ± 0.54 b | 18.24 ± 0.53 e |
| S. broughtonii | 32.43 | 61.02 ± 0.39 b | 7.72 ± 0.18 a | 15.63 ± 0.53 d | 11.25 ± 018 h |
| R. philippinarum | 34.04 | 57.45 ± 0.57 c | 3.46 ± 0.29 cd | 19.38 ± 0.71 bc | 15.08 ± 0.52 f |
| M. galloprovincialis | 13.41 | 61.77 ± 0.95 b | 4.27 ± 0.77 c | 9.70 ± 0.38 fg | 19.32 ± 0.18 e |
| C. californiense | 41.49 | 64.32 ± 0.52 a | 4.38 ± 0.36 c | 8.72 ± 0.37 g | 17.90 ± 0.14 e |
| S. strictus | 48.62 | 64.33 ± 0.28 a | 3.32 ± 0.28 cd | 13.35 ± 0.18 e | 15.86 ± 0.06 f |
| C. farreri | 39.61 | 64.58 ± 0.49 a | 6.58 ± 0.34 ab | 10.81 ± 0.02 f | 13.09 ± 1.41 g |
| S. subcrenata | 31.43 | 55.92 ± 0.76 c | 4.41 ± 0.36 c | 14.29 ± 0.47 de | 16.13 ± 0.66 f |
| M. veneriformis | 25.18 | 47.59 ± 1.06 e | 3.35 ± 0.12 cd | 19.92 ± 0.25 bc | 28.50 ± 0.12 b |
| M. meretrix | 11.93 | 51.01 ± 0.81 d | 2.68 ± 0.27 de | 19.41 ± 0.02 bc | 21.81 ± 0.30 d |
| S. constricta | 42.83 | 52.43 ± 0.47 d | 6.78 ± 0.33 ab | 25.41 ± 0.68 a | 15.49 ± 0.02 f |
| M. chinensis | C. sinensis | C. gigas | S. broughtonii | R. philippinarum | M. galloprovincialis | C. californiense | S. strictus | C. farreri | S. subcrenata | M. veneriformis | M. meretrix | S. constricta | |
|---|---|---|---|---|---|---|---|---|---|---|---|---|---|
| Asp | 4.73 ± 0.01 e | 3.23 ± 0.00 l | 3.58 ± 0.01 i | 5.31 ± 0.01 a | 5.21 ± 0.00 b | 4.23 ± 0.01 g | 4.06 ± 0.00 h | 5.00 ± 0.00 c | 4.60 ± 0.00 f | 5.24 ± 0.00 b | 3.35 ± 0.04 k | 4.90 ± 0.00 d | 3.50 ± 0.00 j |
| Thr | 2.23 ± 0.01 e | 1.46 ± 0.00 k | 1.64 ± 0.01 i | 2.41 ± 0.01 b | 2.24 ± 0.00 d | 2.10 ± 0.01 f | 2.07 ± 0.00 g | 2.56 ± 0.00 a | 2.24 ± 0.01 de | 2.28 ± 0.00 c | 1.56 ± 0.01 j | 2.22 ± 0.00 e | 1.86 ± 0.00 h |
| Ser | 2.34 ± 0.00 b | 1.52 ± 0.00 k | 1.71 ± 0.01 j | 2.32 ± 0.01 c | 2.29 ± 0.00 d | 2.16 ± 0.01 g | 2.07 ± 0.00 h | 2.48 ± 0.00 a | 2.17 ± 0.00 f | 2.20 ± 0.00 e | 1.53 ± 0.02 k | 2.17 ± 0.00 f | 1.97 ± 0.00 i |
| Glu | 6.92 ± 0.01 f | 4.38 ± 0.00 m | 4.92 ± 0.00 k | 8.09 ± 0.01 a | 7.02 ± 0.00 e | 5.88 ± 0.02 h | 5.56 ± 0.01 i | 7.82 ± 0.00 b | 6.55 ± 0.02 g | 7.09 ± 0.00 d | 4.84 ± 0.02 l | 7.19 ± 0.00 c | 5.06 ± 0.00 j |
| Pro | 1.88 ± 0.07 cde | 1.34 ± 0.03 h | 1.91 ± 0.02 cd | 1.95 ± 0.03 cd | 1.92 ± 0.01 cd | 2.04 ± 0.01 ab | 1.61 ± 0.00 f | 2.11 ± 0.01 a | 1.88 ± 0.06 de | 1.95 ± 0.02 bcd | 1.47 ± 0.06 g | 1.96 ± 0.00 bc | 1.82 ± 0.02 e |
| Gly | 4.74 ± 0.00 c | 2.02 ± 0.00 l | 2.57 ± 0.00 j | 3.09 ± 0.01 h | 3.58 ± 0.00 f | 3.93 ± 0.02 e | 4.02 ± 0.00 d | 5.36 ± 0.00 b | 7.00 ± 0.03 a | 2.76 ± 0.00 i | 2.39 ± 0.01 k | 3.32 ± 0.00 g | 2.54 ± 0.01 j |
| Ala | 3.25 ± 0.00 d | 2.27 ± 0.00 l | 2.03 ± 0.00 m | 2.81 ± 0.01 g | 3.19 ± 0.00 e | 2.37 ± 0.03 j | 2.31 ± 0.00 k | 3.30 ± 0.00 c | 2.52 ± 0.04 i | 2.89 ± 0.01 f | 4.01 ± 0.01 b | 2.71 ± 0.00 h | 5.23 ± 0.02 a |
| Cys | 0.20 ± 0.00 de | 0.16 ± 0.00 f | 0.18 ± 0.00 ef | 0.15 ± 0.00 f | 0.31 ± 0.00 a | 0.28 ± 0.03 ab | 0.23 ± 0.00 cd | 0.32 ± 0.00 a | 0.22 ± 0.04 d | 0.27 ± 0.00 b | 0.18 ± 0.00 ef | 0.20 ± 0.00 de | 0.26 ± 0.02 bc |
| Val | 2.00 ± 0.01 d | 1.33 ± 0.00 h | 1.58 ± 0.00 f | 2.13 ± 0.01 c | 2.12 ± 0.00 c | 1.80 ± 0.07 e | 1.82 ± 0.00 e | 2.35 ± 0.00 a | 2.01 ± 0.10 d | 2.24 ± 0.00 b | 1.43 ± 0.00 g | 2.13 ± 0.00 c | 1.63 ± 0.04 f |
| Met | 1.03 ± 0.03 ab | 0.56 ± 0.00 d | 0.87 ± 0.00 c | 0.55 ± 0.01 d | 1.07 ± 0.00 a | 0.86 ± 0.13 c | 0.85 ± 0.00 c | 1.10 ± 0.00 a | 0.92 ± 0.09 bc | 0.94 ± 0.00 bc | 0.60 ± 0.01 d | 0.88 ± 0.00 c | 0.83 ± 0.07 c |
| Ile | 2.10 ± 0.02 a | 1.22 ± 0.00 d | 1.55 ± 0.00 c | 2.18 ± 0.00 a | 2.12 ± 0.00 a | 1.76 ± 0.15 c | 1.82 ± 0.00 bc | 2.23 ± 0.00 a | 1.94 ± 0.11 b | 2.22 ± 0.00 a | 1.50 ± 0.00 c | 1.91 ± 0.00 bc | 1.53 ± 0.14 c |
| Leu | 3.46 ± 0.02 c | 2.07 ± 0.00 i | 2.47 ± 0.00 h | 3.85 ± 0.00 a | 3.41 ± 0.00 c | 2.84 ± 0.10 f | 2.98 ± 0.00 e | 3.88 ± 0.00 a | 3.27 ± 0.13 d | 3.71 ± 0.01 b | 2.38 ± 0.00 h | 3.34 ± 0.00 cd | 2.61 ± 0.09 g |
| Tyr | 1.69 ± 0.01 c | 1.14 ± 0.00 f | 0.99 ± 0.00 g | 1.75 ± 0.00 bc | 1.87 ± 0.00 a | 1.72 ± 0.07 c | 1.54 ± 0.00 d | 1.81 ± 0.00 ab | 0.04 ± 0.05 i | 1.50 ± 0.01 d | 0.51 ± 0.00 h | 1.54 ± 0.00 d | 1.35 ± 0.06 e |
| Phe | 2.56 ± 0.00 c | 1.48 ± 0.00 i | 2.06 ± 0.01 e | 3.48 ± 0.01 a | 1.96 ± 0.00 f | 2.28 ± 0.05 d | 1.85 ± 0.07 g | 3.13 ± 0.00 b | 2.30 ± 0.01 d | 3.14 ± 0.02 b | 1.55 ± 0.01 h | 2.50 ± 0.01 c | 1.82 ± 0.01 g |
| Lys | 3.51 ± 0.00 d | 2.23 ± 0.00 i | 2.55 ± 0.04 g | 3.79 ± 0.02 c | 3.55 ± 0.00 d | 3.37 ± 0.00 e | 3.14 ± 0.09 f | 4.20 ± 0.00 a | 3.50 ± 0.01 d | 3.57 ± 0.05 d | 2.43 ± 0.02 h | 3.89 ± 0.03 b | 2.59 ± 0.01 g |
| His | 1.11 ± 0.00 a | 1.13 ± 0.00 a | 0.90 ± 0.10 bcd | 1.11 ± 0.08 a | 1.05 ± 0.00 ab | 1.04 ± 0.00 ab | 0.90 ± 0.07 bcd | 1.20 ± 0.01 a | 0.93 ± 0.01 bc | 1.13 ± 0.14 a | 0.84 ± 0.12 cd | 1.16 ± 0.11 a | 0.73 ± 0.00 d |
| Arg | 4.21 ± 0.02 b | 2.25 ± 0.00 k | 2.46 ± 0.03 j | 4.23 ± 0.01 b | 3.59 ± 0.01 f | 3.09 ± 0.01 g | 3.76 ± 0.01 cd | 4.84 ± 0.00 a | 3.80 ± 0.03 c | 3.73 ± 0.01 de | 2.56 ± 0.01 i | 3.73 ± 0.00 e | 2.61 ± 0.01 h |
| Trp | 0.78 ± 0.04 a | 0.23 ± 0.00 e | 0.27 ± 0.01 de | 0.74 ± 0.01 a | 0.41 ± 0.00 cd | 0.79 ± 0.03 a | 0.74 ± 0.00 a | 0.41 ± 0.00 cd | 0.44 ± 0.00 c | 0.30 ± 0.01 de | 0.34 ± 0.01 cde | 0.33 ± 0.01 cde | 0.59 ± 0.20 b |
| EAA | 17.67 ± 0.03 d | 10.57 ± 0.01 k | 13.00 ± 0.07 i | 19.13 ± 0.03 b | 16.89 ± 0.00 ef | 15.79 ± 0.54 g | 15.26 ± 0.15 h | 19.86 ± 0.01 a | 16.62 ± 0.42 f | 18.41 ± 0.10 c | 11.79 ± 0.01 j | 17.20 ± 0.05 de | 13.45 ± 0.14 i |
| NEAA | 31.08 ± 0.07 b | 19.45 ± 0.03 k | 21.27 ± 0.13 j | 30.81 ± 0.08 b | 30.03 ± 0.01 c | 26.74 ± 0.19 f | 26.07 ± 0.05 g | 34.25 ± 0.01 a | 29.69 ± 0.26 d | 28.78 ± 0.19 e | 21.69 ± 0.09 i | 28.88 ± 0.10 e | 25.07 ± 0.10 h |
| TAA | 48.75 ± 0.03 c | 30.03 ± 0.03 l | 34.27 ± 0.20 j | 49.94 ± 0.11 b | 46.92 ± 0.01 de | 42.53 ± 0.73 g | 41.33 ± 0.20 h | 54.11 ± 0.02 a | 46.31 ± 0.68 ef | 47.18 ± 0.28 d | 33.48 ± 0.10 k | 46.08 ± 0.15 f | 38.53 ± 0.24 i |
| EAA/TAA (%) | 36.24 ± 0.09 ef | 35.21 ± 0.05 g | 37.93 ± 0.02 b | 38.30 ± 0.02 b | 35.99 ± 0.00 f | 37.12 ± 0.64 cd | 36.93 ± 0.19 cd | 36.71 ± 0.00 de | 35.88 ± 0.38 f | 39.02 ± 0.03 a | 35.22 ± 0.08 g | 37.32 ± 0.01 c | 34.92 ± 0.15 g |
| EAA/NEAA (%) | 56.84 ± 0.23 ef | 54.35 ± 0.12 g | 61.11 ± 0.06 b | 62.08 ± 0.04 b | 56.23 ± 0.00 f | 59.04 ± 1.62 cd | 58.55 ± 0.47 cd | 58.00 ± 0.00 de | 55.96 ± 0.94 f | 63.98 ± 0.07 a | 54.36 ± 0.19 g | 59.54 ± 0.02 c | 53.66 ± 0.35 g |
| FAO/WHO | M. chinensis | C. sinensis | C. gigas | S. broughtonii | R. philippinarum | M. galloprovincialis | C. californiense | S. strictus | C. farreri | S. subcrenata | M. veneriformis | M. meretrix | S. constricta | |
|---|---|---|---|---|---|---|---|---|---|---|---|---|---|---|
| Ile | 40 | 0.81 | 0.74 | 0.85 | 0.89 | 0.92 | 0.71 | 0.71 | 0.87 | 0.75 | 0.99 | 0.79 | 0.94 | 0.73 |
| Leu | 70 | 0.77 | 0.72 | 0.77 | 0.90 | 0.85 | 0.66 | 0.66 | 0.86 | 7.36 | 0.95 | 0.71 | 0.94 | 0.71 |
| Lys | 55 | 0.99 | 0.98 | 1.01 | 1.13 | 1.12 | 0.99 | 0.89 | 1.19 | 0.99 | 1.16 | 0.93 | 1.39 | 0.90 |
| Met + Cys | 35 | 0.55 * | 0.50 * | 0.66 ** | 0.33 * | 0.68 * | 0.53 * | 0.48 * | 0.63 * | 0.51 * | 0.62 ** | 0.47 * | 0.60 * | 0.60 * |
| Phe + Tyr | 60 | 1.10 | 1.06 | 1.11 | 1.43 | 1.11 | 1.08 | 0.88 | 1.28 | 0.60 ** | 1.39 | 0.72 | 1.32 | 1.01 |
| Thr | 40 | 0.86 | 0.88 | 0.89 | 0.99 | 0.98 | 0.85 | 0.80 | 1.00 | 0.87 | 1.02 | 0.82 | 1.09 | 0.89 |
| Val | 50 | 0.62 ** | 0.64 | 0.69 | 0.70 ** | 0.74 | 0.58 ** | 0.57 ** | 0.73 | 0.62 | 0.80 | 0.60 ** | 0.83 | 0.62 ** |
| Trp | 10 | 1.21 | 0.57 ** | 0.60 * | 1.21 | 0.72 ** | 1.27 | 1.15 | 0.64 ** | 0.68 | 0.53 * | 0.71 | 0.64 ** | 1.12 |
| M. chinensis | C. sinensis | C. gigas | S. broughtonii | R. philippinarum | M. galloprovincialis | C. californiense | S. strictus | C. farreri | S. subcrenata | M. veneriformis | M. meretrix | S. constricta | |
|---|---|---|---|---|---|---|---|---|---|---|---|---|---|
| C10:0 | 0.58 ± 0.01 b | 0.99 ± 0.02 a | 0.15 ± 0.04 f | - | 0.32 ± 0.04 de | 0.37 ± 0.05 de | - | 0.29 ± 0.00 e | - | 0.34 ± 0.02 de | 0.49 ± 0.04 bc | 1.01 ± 0.02 a | 0.41 ± 0.04 cd |
| C14:0 | 3.30 ± 0.03 f | 2.62 ± 0.16 g | 4.21 ± 0.12 d | 4.03 ± 0.05 de | 2.02 ± 0.01 h | 1.91 ± 0.04 h | 3.77 ± 0.12 e | 5.99 ± 0.05 b | 2.87 ± 0.05 g | 5.29 ± 0.24 c | 3.97 ± 0.08 de | 1.24 ± 0.07 i | 7.73 ± 0.08 a |
| C15:0 | 0.79 ± 0.11 bc | 0.87 ± 0.07 b | 1.07 ± 0.10 a | 0.36 ± 0.00 e | 0.76 ± 0.00 bcd | 0.71 ± 0.03 bcd | 0.74 ± 0.07 bcd | 0.64 ± 0.03 cd | 0.73 ± 0.03 bcd | 0.39 ± 0.06 e | 0.84 ± 0.07 bc | 0.55 ± 0.04 de | 1.11 ± 0.05 a |
| C16:0 | 20.29 ± 0.11 fg | 25.28 ± 0.25 c | 29.49 ± 0.22 a | 19.94 ± 0.51 g | 21.20 ± 0.07 def | 22.22 ± 0.20 d | 20.50 ± 0.22 efg | 19.91 ± 0.11 g | 21.58 ± 0.18 de | 24.73 ± 0.86 c | 21.12 ± 0.20 ef | 25.17 ± 0.07 c | 27.41 ± 0.13 b |
| C17:0 | 1.76 ± 0.06 ef | 3.45 ± 0.08 a | 2.78 ± 0.02 b | 2.14 ± 0.08 d | 2.90 ± 0.06 b | 3.33 ± 0.05 a | 1.45 ± 0.05 gh | 1.98 ± 0.04 de | 1.71 ± 0.03 efg | 2.39 ± 0.08 c | 1.30 ± 0.15 h | 3.47 ± 0.16 a | 1.68 ± 0.08 fg |
| C18:0 | 8.08 ± 0.06 d | 8.53 ± 0.07 c | 6.78 ± 0.03 f | 7.46 ± 0.24 e | 10.23 ± 0.06 a | 6.01 ± 0.06 g | 8.91 ± 0.12 c | 7.67 ± 0.12 de | 6.85 ± 0.02 f | 9.36 ± 0.30 b | 8.01 ± 0.09 d | 9.47 ± 0.15 b | 10.01 ± 0.08 a |
| C20:0 | - | - | 0.16 ± 0.01 a | - | - | - | 0.21 ± 0.02 a | - | - | - | - | - | - |
| C24:0 | - | 2.44 ± 0.10 a | - | 0.81 ± 0.03 d | 2.39 ± 0.03 ab | - | 1.19 ± 0.09 c | 2.24 ± 0.06 ab | - | 1.25 ± 0.05 c | - | 2.14 ± 0.12 b | - |
| SFA | 34.80 ± 0.14 fg | 44.17 ± 0.03 bc | 44.65 ± 0.18 b | 34.75 ± 0.27 fg | 39.81 ± 0.12 d | 34.56 ± 0.03 fg | 36.77 ± 0.11 e | 38.70 ± 0.13 d | 33.74 ± 0.04 g | 43.75 ± 1.60 bc | 35.74 ± 0.09 ef | 43.05 ± 0.05 c | 48.35 ± 0.03 a |
| C14:1 | - | - | - | - | - | - | - | 0.36 ± 0.06 a | - | 0.17 ± 0.02 a | - | - | - |
| C16:1 | 7.68 ± 0.02 bcd | 7.51 ± 0.12 bcd | 3.54 ± 0.02 ef | 9.19 ± 0.12 bc | 7.59 ± 0.13 bcd | 5.38 ± 0.01 de | 7.43 ± 0.13 bcd | 6.85 ± 0.12 cd | 9.12 ± 0.18 bc | 10.04 ± 2.83 b | 9.83 ± 0.09 bc | 2.36 ± 0.18 f | 28.94 ± 0.12 a |
| C18:1 n9 t | - | 0.79 ± 0.12 | - | - | - | - | - | - | - | - | - | - | - |
| C18:1 n9 c | 3.94 ± 0.11 e | 5.41 ± 0.07 b | 4.54 ± 0.14 d | 2.93 ± 0.01 g | 3.47 ± 0.06 f | 2.42 ± 0.02 h | 1.42 ± 0.07 i | 4.88 ± 0.08 c | 2.69 ± 0.02 gh | 10.39 ± 0.21 a | 2.88 ± 0.11 g | 3.47 ± 0.07 f | 1.60 ± 0.05 i |
| C20:1 | 3.36 ± 0.03 d | 0.47 ± 0.06 i | 0.77 ± 0.06 h | 1.21 ± 0.03 g | 2.37 ± 0.15 ef | 4.80 ± 0.04 b | 2.38 ± 0.03 ef | 6.50 ± 0.04 a | 0.61 ± 0.06 hi | 2.11 ± 0.18 f | 3.81 ± 0.13 c | 2.54 ± 0.06 e | 1.15 ± 0.01 g |
| MUFA | 14.97 ± 0.10 de | 14.18 ± 0.14 ef | 8.85 ± 0.22 h | 13.32 ± 0.14 efg | 13.43 ± 0.04 efg | 12.59 ± 0.04 efg | 11.23 ± 0.09 g | 18.59 ± 0.10 c | 12.41 ± 0.15 fg | 22.72 ± 2.44 b | 16.52 ± 0.34 cd | 8.37 ± 0.05 h | 31.70 ± 0.08 a |
| C18:2 n6 c | 0.42 ± 0.07 e | 1.20 ± 0.10 bc | 1.42 ± 0.09 b | 1.77 ± 0.03 a | - | 1.32 ± 0.03 bc | 0.39 ± 0.06 e | - | 1.24 ± 0.05 bc | 1.10 ± 0.02 c | 0.44 ± 0.06 e | 0.74 ± 0.10 d | - |
| C18:3 n3 | 0.25 ± 0.01 g | 1.93 ± 0.00 b | 1.06 ± 0.07 d | 1.47 ± 0.02 c | - | 1.60 ± 0.07 c | 0.60 ± 0.05 f | - | 1.63 ± 0.03 c | 0.37 ± 0.02 g | 0.90 ± 0.04 e | 3.10 ± 0.09 a | - |
| C20:2 | 1.69 ± 0.11 b | 1.25 ± 0.21 c | - | - | 1.81 ± 0.01 b | 0.37 ± 0.01 d | 1.13 ± 0.04 c | 1.14 ± 0.03 c | 0.25 ± 0.00 d | - | 1.87 ± 0.02 b | 3.41 ± 0.11 a | - |
| C20:3 n6 | - | - | - | - | - | - | - | 0.31 ± 0.02 | - | - | - | - | - |
| C20:4 n6 | 5.15 ± 0.06 c | 6.65 ± 0.04 a | 2.04 ± 0.09 hi | 1.83 ± 0.01 i | 4.23 ± 0.13 d | 5.15 ± 0.11 c | 1.50 ± 0.10 j | 3.37 ± 0.03 f | 1.95 ± 0.19 i | 2.52 ± 0.10 g | 2.31 ± 0.09 gh | 6.13 ± 0.03 b | 3.69 ± 0.04 e |
| C20:3 n3 | - | 0.58 ± 0.02 a | - | - | - | - | - | - | - | - | - | 0.70 ± 0.00 a | - |
| C20:5 n3 (EPA) | 20.11 ± 0.09 e | 14.69 ± 0.23 g | 23.10 ± 0.18 d | 29.10 ± 0.17 a | 17.42 ± 0.25 f | 17.81 ± 0.13 f | 25.29 ± 0.17 c | 19.37 ± 0.07 e | 27.26 ± 0.02 b | 19.85 ± 0.51 e | 25.25 ± 0.31 c | 11.45 ± 0.17 h | - |
| C22:6 n3 (DHA) | 22.61 ± 0.09 c | 15.36 ± 0.19 i | 18.87 ± 0.15 e | 17.76 ± 0.07 f | 23.30 ± 0.02 b | 26.59 ± 0.19 a | 23.08 ± 0.09 b | 18.51 ± 0.00 e | 21.51 ± 0.01 d | 9.70 ± 0.22 j | 16.97 ± 0.09 g | 23.06 ± 0.09 b | 16.26 ± 0.01 h |
| EPA + DHA | 42.72 ± 0.00 d | 30.04 ± 0.04 h | 41.97 ± 0.03 d | 46.86 ± 0.10 b | 40.72 ± 0.27 e | 44.40 ± 0.06 c | 48.37 ± 0.08 a | 37.89 ± 0.07 f | 48.77 ± 0.03 a | 29.55 ± 0.73 h | 42.23 ± 0.22 d | 34.51 ± 0.09 g | 16.26 ± 0.01 i |
| PUFA | 50.23 ± 0.03 d | 41.65 ± 0.17 i | 46.50 ± 0.04 g | 51.93 ± 0.12 c | 46.77 ± 0.16 g | 52.85 ± 0.07 b | 52.00 ± 0.02 c | 42.71 ± 0.03 h | 53.84 ± 0.19 a | 33.53 ± 0.84 j | 47.74 ± 0.26 f | 48.58 ± 0.00 e | 19.95 ± 0.05 k |
| n-3/n-6 | 7.72 ± 0.18 e | 4.15 ± 0.03 g | 12.42 ± 0.03 c | 13.44 ± 0.13 c | 9.62 ± 0.35 d | 7.11 ± 0.08 e | 25.82 ± 0.58 a | 10.28 ± 0.04 d | 15.82 ± 1.23 b | 8.29 ± 0.01 e | 15.73 ± 0.22 b | 5.58 ± 0.08 f | 4.40 ± 0.04 fg |
| M. chinensis | C. sinensis | C. gigas | S. broughtonii | R. philippinarum | M. galloprovincialis | C. californiense | S. strictus | C. farreri | S. subcrenata | M. veneriformis | M. meretrix | S. constricta | |
|---|---|---|---|---|---|---|---|---|---|---|---|---|---|
| Asp * | 0.16 ± 0.00 i | 0.17 ± 0.00 h | 0.41 ± 0.01 c | 0.36 ± 0.00 d | 0.45 ± 0.00 a | 0.34 ± 0.00 e | 0.15 ± 0.00 j | 0.22 ± 0.00 f | 0.10 ± 0.00 k | 0.45 ± 0.00 a | 0.20 ± 0.00 g | 0.44 ± 0.00 b | 0.22 ± 0.00 f |
| Thr # | 0.18 ± 0.00 cd | 0.17 ± 0.00 cde | 0.18 ± 0.00 cd | 0.21 ± 0.00 cd | 0.32 ± 0.00 b | 0.24 ± 0.01 bc | 0.32 ± 0.00 b | 0.09 ± 0.12 e | 0.21 ± 0.00 cd | 0.13 ± 0.00 de | 0.18 ± 0.00 cd | 0.19 ± 0.05 cd | 0.45 ± 0.00 a |
| Ser # | 0.15 ± 0.00 e | 0.13 ± 0.00 f | 0.30 ± 0.00 b | 0.11 ± 0.01 g | 0.23 ± 0.00 c | 0.18 ± 0.00 d | 0.14 ± 0.00 ef | 0.18 ± 0.00 d | 0.18 ± 0.00 d | 0.08 ± 0.00 h | 0.12 ± 0.00 g | 0.13 ± 0.00 f | 0.8 ± 0.01 a |
| Glu * | 1.16 ± 0.00 d | 0.92 ± 0.00 f | 0.86 ± 0.01 gh | 1.30 ± 0.03 b | 1.31 ± 0.00 b | 1.03 ± 0.01 e | 0.92 ± 0.00 f | 1.26 ± 0.03 c | 0.85 ± 0.00 hi | 0.90 ± 0.01 fg | 1.29 ± 0.01 bc | 1.61 ± 0.00 a | 0.83 ± 0.00 i |
| Pro # | - | - | 1.12 ± 0.20 a | 0.01 ± 0.02 d | - | - | - | - | - | 0.44 ± 0.07 c | - | - | 0.93 ± 0.19 b |
| Gly # | 4.43 ± 0.00 c | 0.78 ± 0.00 l | 1.27 ± 0.00 j | 1.09 ± 0.01 k | 2.27 ± 0.00 e | 1.62 ± 0.00 g | 3.71 ± 0.01 d | 4.48 ± 0.01 b | 8.40 ± 0.03 a | 0.50 ± 0.00 m | 1.67 ± 0.00 f | 1.45 ± 0.00 h | 1.30 ± 0.00 i |
| Ala # | 1.60 ± 0.00 c | 1.56 ± 0.00 d | 0.72 ± 0.00 f | 0.27 ± 0.01 k | 1.56 ± 0.00 d | 0.51 ± 0.00 j | 0.69 ± 0.00 g | 0.99 ± 0.00 e | 0.56 ± 0.00 i | 0.57 ± 0.00 h | 4.78 ± 0.02 b | 0.54 ± 0.00 i | 6.67 ± 0.02 a |
| Cys | 0.03 ± 0.00 de | 0.06 ± 0.00 b | 0.05 ± 0.00 bc | 0.03 ± 0.01 de | 0.06 ± 0.00 b | 0.03 ± 0.01 e | 0.04 ± 0.00 cd | - | 0.03 ± 0.00 de | - | 0.03 ± 0.00 de | - | 0.08 ± 0.00 a |
| Val ▪ | 0.10 ± 0.01 ef | 0.09 ± 0.00 f | 0.13 ± 0.00 d | 0.09 ± 0.02 f | 0.15 ± 0.00 c | 0.12 ± 0.01 de | 0.24 ± 0.00 b | 0.12 ± 0.00 de | 0.28 ± 0.00 a | 0.07 ± 0.00 g | 0.13 ± 0.00 d | 0.12 ± 0.00 de | 0.23 ± 0.00 b |
| Met ▪ | 0.04 ± 0.01 c | 0.04 ± 0.00 c | 0.11 ± 0.00 b | 0.04 ± 0.01 c | 0.16 ± 0.00 a | 0.06 ± 0.02 c | 0.11 ± 0.00 b | 0.07 ± 0.00 c | 0.06 ± 0.00 c | 0.05 ± 0.00 c | 0.06 ± 0.01 c | 0.05 ± 0.00 c | 0.18 ± 0.01 a |
| Ile ▪ | 0.05 ± 0.01 de | 0.07 ± 0.00 cde | 0.04 ± 0.00.e | 0.06 ± 0.02 cde | 0.10 ± 0.00 bc | 0.10 ± 0.04 bcd | 0.15 ± 0.00 a | 0.05 ± 0.00 de | 0.06 ± 0.00 cde | 0.04 ± 0.00 e | 0.07 ± 0.01 cde | 0.07 ± 0.00 cde | 0.12 ± 0.01 ab |
| Leu ▪ | 0.10 ± 0.06 def | 0.15 ± 0.00 bcdef | 0.08 ± 0.01 ef | 0.06 ± 0.00 f | 0.20 ± 0.00 bc | 0.18 ± 0.04 bcd | 0.29 ± 0.00 a | 0.13 ± 0.00 bcdef | 0.16 ± 0.00 bcde | 0.12 ± 0.00 cdef | 0.13 ± 0.04 bcdef | 0.14 ± 0.00 bcdef | 0.22 ± 0.01 b |
| Tyr ▪ | - | 0.17 ± 0.00 ab | - | - | 0.15 ± 0.01 ab | 0.11 ± 0.15 ab | 0.24 ± 0.00 a | 0.16 ± 0.01 ab | 0.17 ± 0.01 ab | 0.13 ± 0.01 ab | 0.07 ± 0.10 ab | 0.12 ± 0.00 ab | 0.24 ± 0.01 a |
| Phe ▪ | 0.35 ± 0.06 e | 0.24 ± 0.00 f | 0.75 ± 0.00 c | 2.30 ± 0.03 a | 0.22 ± 0.00 f | 0.53 ± 0.01 d | 0.77 ± 0.02 c | 0.32 ± 0.00 e | 0.24 ± 0.00 f | 1.24 ± 0.01 b | 0.34 ± 0.00 e | 0.23 ± 0.00 f | 0.51 ± 0.00 d |
| Lys ▪ | 0.17 ± 0.07 cd | 0.08 ± 0.00 d | 0.16 ± 0.00 cd | 0.18 ± 0.08 cd | 0.21 ± 0.00 bc | 0.37 ± 0.01 a | 0.31 ± 0.00 ab | 0.10 ± 0.00 cd | 0.13 ± 0.00 cd | 0.10 ± 0.00 cd | 0.17 ± 0.00 cd | 0.17 ± 0.00 cd | 0.30 ± 0.00 ab |
| His ▪ | 0.10 ± 0.01 bc | 0.04 ± 0.00 e | 0.12 ± 0.00 b | 0.13 ± 0.00 b | 0.05 ± 0.00 de | 0.12 ± 0.02 b | 0.12 ± 0.00 b | 0.08 ± 0.00 cd | 0.05 ± 0.00 de | 0.06 ± 0.00 de | 0.06 ± 0.00 de | 0.07 ± 0.00 de | 0.24 ± 0.02 a |
| Arg # | 2.22 ± 0.00 b | 0.58 ± 0.01 k | 0.65 ± 0.00 j | 1.27 ± 0.00 e | 1.04 ± 0.00 g | 0.36 ± 0.02 l | 1.96 ± 0.00 c | 2.26 ± 0.00 a | 1.79 ± 0.00 d | 0.64 ± 0.00 j | 1.11 ± 0.00 f | 0.70 ± 0.00 i | 0.79 ± 0.00 h |
| Tau | 0.93 ± 0.01 d | 0.91 ± 0.01 d | 1.04 ± 0.02 c | 1.14 ± 0.03 b | 1.15 ± 0.02 b | 1.11 ± 0.02 b | 0.88 ± 0.02 d | 0.91 ± 0.01 d | 0.56 ± 0.02 f | 1.32 ± 0.02 a | 0.72 ± 0.01 e | 1.01 ± 0.02 c | 0.56 ± 0.01 f |
| UFAAs | 1.32 ± 0.00 e | 1.09 ± 0.00 g | 1.28 ± 0.01 f | 1.66 ± 0.03 c | 1.76 ± 0.00 b | 1.37 ± 0.01 e | 1.08 ± 0.00 g | 1.48 ± 0.03 d | 0.95 ± 0.00 h | 1.35 ± 0.01 e | 1.49 ± 0.02 d | 2.05 ± 0.00 a | 1.05 ± 0.00 g |
| SFAAs | 8.58 ± 0.01 b | 3.23 ± 0.01 g | 4.26 ± 0.21 f | 2.95 ± 0.00 gh | 5.42 ± 0.01 e | 2.90 ± 0.02 h | 6.82 ± 0.01 d | 8.00 ± 0.11 c | 11.14 ± 0.02 a | 2.37 ± 0.07 i | 7.85 ± 0.02 c | 3.02 ± 0.05 gh | 10.93 ± 0.22 a |
| BFAAs | 0.92 ± 0.06 gh | 0.87 ± 0.01 h | 1.40 ± 0.00 de | 2.87 ± 0.11 a | 1.24 ± 0.01 ef | 1.58 ± 0.13 d | 2.23 ± 0.02 b | 1.02 ± 0.01 gh | 1.15 ± 0.01 fg | 1.81 ± 0.02 c | 1.03 ± 0.14 gh | 0.97 ± 0.00 gh | 2.03 ± 0.02 b |
| TFAAs | 11.78 ± 0.04 c | 6.16 ± 0.00 i | 8.03 ± 0.24 g | 8.65 ± 0.04 f | 9.63 ± 0.03 e | 6.98 ± 0.13 h | 11.04 ± 0.03 d | 11.41 ± 0.15 cd | 13.83 ± 0.02 b | 6.85 ± 0.12 h | 11.12 ± 0.18 d | 7.05 ± 0.04 h | 14.65 ± 0.24 a |
| M. chinensis | C. sinensis | C. gigas | S. broughtonii | R. philippinarum | M. galloprovincialis | C. californiense | S. strictus | C. farreri | S. subcrenata | M. veneriformis | M. meretrix | S. constricta | |
|---|---|---|---|---|---|---|---|---|---|---|---|---|---|
| Asp * | 0.34 ± 0.00 j | 0.20 ± 0.00 l | 0.70 ± 0.00 c | 0.67 ± 0.00 d | 1.19 ± 0.00 a | 0.61 ± 0.00 e | 0.39 ± 0.00 h | 0.43 ± 0.00 f | 0.27 ± 0.00 k | 1.13 ± 0.00 b | 0.42 ± 0.00 g | 0.37 ± 0.00 i | 0.39 ± 0.00 h |
| Thr # | 0.23 ± 0.00 c | 0.22 ± 0.00 c | 0.23 ± 0.00 c | 0.18 ± 0.00 d | - | 0.13 ± 0.00 e | 0.68 ± 0.00 a | - | 0.31 ± 0.00 b | 0.12 ± 0.00 f | 0.31 ± 0.00 b | 0.06 ± 0.00 g | 0.68 ± 0.00 a |
| Ser # | 0.18 ± 0.00 g | 0.12 ± 0.00 i | 0.25 ± 0.00 e | 0.06 ± 0.00 l | 0.35 ± 0.00 b | 0.15 ± 0.00 h | 0.26 ± 0.00 d | 0.23 ± 0.00 f | 0.31 ± 0.00 c | 0.08 ± 0.00 k | 0.10 ± 0.00 j | 0.09 ± 0.00 j | 1.50 ± 0.00 a |
| Glu * | 1.69 ± 0.00 e | 1.06 ± 0.00 l | 0.96 ± 0.00 m | 1.20 ± 0.00 k | 2.16 ± 0.00 b | 1.50 ± 0.00 i | 1.64 ± 0.00 f | 1.99 ± 0.00 c | 1.52 ± 0.00 h | 1.71 ± 0.00 d | 2.45 ± 0.00 a | 1.49 ± 0.00 j | 1.58 ± 0.00 g |
| Pro # | - | - | 1.02 ± 0.04 b | - | - | - | 0.50 ± 0.02 c | 0.31 ± 0.01 e | - | 0.45 ± 0.01 d | 0.42 ± 0.01 d | - | 1.22 ± 0.01 a |
| Gly # | 7.03 ± 0.01 c | 1.00. ± 0.00 l | 1.77 ± 0.00 i | 0.17 ± 0.00 m | 3.92 ± 0.00 f | 2.76 ± 0.00 h | 6.71 ± 0.00 d | 7.78 ± 0.00 b | 16.97 ± 0.02 a | 1.21 ± 0.00 k | 3.60 ± 0.01 g | 1.55 ± 0.00 j | 4.17 ± 0.00 e |
| Ala # | 2.67 ± 0.00 d | 2.27 ± 000 e | 0.83 ± 0.00 j | 0.45 ± 0.00 m | 2.81 ± 0.00 c | 0.79 ± 0.00 k | 1.57 ± 0.00 g | 1.85 ± 0.00 f | 0.88 ± 0.00 i | 1.27 ± 0.00 h | 11.84 ± 0.02 b | 0.57 ± 0.00 l | 13.31 ± 0.00 a |
| Cys | - | - | - | - | - | - | - | - | - | - | - | - | - |
| Val▪ | 0.12 ± 0.00 f | 0.08 ± 0.00 g | 0.15 ± 0.00 e | 0.11 ± 0.00 | 0.14 ± 0.01 e | 0.11 ± 0.00 f | 0.53 ± 0.00 a | 0.17 ± 0.00 d | 0.49 ± 0.00 b | 0.11 ± 0.00 f | 0.15 ± 0.00 e | 0.05 ± 0.00 h | 0.37 ± 0.00 c |
| Met▪ | 0.07 ± 0.00 ef | 0.03 ± 0.00 g | 0.10 ± 0.00 cd | 0.05 ± 0.00 fg | 0.07 ± 0.02 de | 0.11 ± 0.00 c | 0.21 ± 0.00 b | 0.08 ± 0.01 de | 0.11 ± 0.00 c | 0.07 ± 0.00 ef | 0.06 ± 0.00 ef | 0.02 ± 0.00 g | 0.29 ± 0.00 a |
| Ile▪ | 0.03 ± 0.00 e | 0.05 ± 0.00 d | 0.06 ± 0.00.cd | 0.05 ± 0.00 cd | - | 0.07 ± 0.00 c | 0.36 ± 0.00 a | 0.07 ± 0.00 c | 0.07 ± 0.00 c | 0.05 ± 0.00 d | 0.06 ± 0.00 cd | 0.02 ± 0.00 e | 0.17 ± 0.01 b |
| Leu▪ | 0.05 ± 0.00 h | 0.12 ± 0.00 e | 0.15 ± 000 d | 0.11 ± 0.00 f | 0.16 ± 0.00 cd | 0.13 ± 0.00 e | 0.58 ± 0.00 a | 0.13 ± 0.00 e | 0.17 ± 0.00 c | 0.12 ± 0.00 ef | 0.13 ± 0.00 e | 0.08 ± 0.00 g | 0.24 ± 0.01 b |
| Tyr▪ | - | 0.15 ± 0.00 d | 0.13 ± 0.00 ef | 0.12 ± 0.00 f | 0.1 ± 0.00 g | 0.21 ± 0.00 b | 0.35 ± 0.00 a | 0.15 ± 0.00 d | 0.17 ± 0.00 c | 0.14 ± 0.00 de | 0.16 ± 0.00 c | 0.08 ± 0.00 h | 0.22 ± 0.01 b |
| Phe ▪ | - | 0.15 ± 0.00 d | 0.79 ± 0.01 a | - | 0.25 ± 0.02 c | - | - | - | 0.51 ± 0.00 b | - | 0.51 ± 0.00 b | 0.10 ± 0.00 e | 0.55 ± 0.04 b |
| Lys ▪ | 0.15 ± 0.06 bcde | 0.06 ± 0.00 e | 0.16 ± 0.00 bcde | 0.12 ± 0.00 cde | 0.26 ± 0.00 bc | 0.15 ± 0.00 bcde | 0.48 ± 0.00 a | 0.22 ± 0.09 bcd | 0.23 ± 0.00 bcd | 0.18 ± 0.00 bcde | 0.27 ± 0.00 b | 0.10 ± 0.00 de | 0.28 ± 0.09 b |
| His ▪ | 0.09 ± 0.03 cd | 0.04 ± 0.00 d | 0.12 ± 0.00.bc | 0.12 ± 0.00.bc | 0.07 ± 0.00 cd | 0.12 ± 0.00 bc | 0.18 ± 0.00 ab | 0.14 ± 0.04 abc | 0.10 ± 0.00 cd | 0.11 ± 0.00.c | 0.12 ± 0.00 bc | 0.04 ± 0.00 d | 0.19 ± 0.04 a |
| Arg # | 2.86 ± 0.00 c | 0.70 ± 0.00 j | 0.67 ± 000 k | 0.5 ± 000.m | 1.50 ± 0.00 g | 0.70 ± 0.00 i | 3.17 ± 0.01 b | 3.85 ± 0.00 a | 1.95 ± 0.00 e | 1.27 ± 000 h | 2.44 ± 0.00 d | 0.65 ± 0.00 l | 1.79 ± 0.00 f |
| Tau | 1.01 ± 0.01 f | 1.07 ± 0.01 e | 0.96 ± 0.01 g | 1.37 ± 0.00 b | 1.24 ± 0.01 d | 1.31 ± 0.02 c | 0.84 ± 0.01 h | 1.02 ± 0.00 f | 0.53 ± 0.01 j | 1.47 ± 0.01 a | 0.85 ± 0.00 h | 1.06 ± 0.00 e | 0.64 ± 0.01 i |
| UFAAs | 2.03 ± 0.00 f | 1.26 ± 0.00 l | 1.66 ± 0.00 k | 1.87 ± 0.00 h | 3.34 ± 0.00 a | 2.11 ± 0.00 e | 2.03 ± 0.00 f | 2.42 ± 0.00 d | 1.79 ± 0.00 j | 2.84 ± 0.00 c | 2.87 ± 0.00 b | 1.86 ± 0.00 i | 1.97 ± 0.00 g |
| SFAAs | 12.97 ± 0.01 e | 4.32 ± 0.00 k | 4.76 ± 0.06 h | 1.36 ± 0.00 m | 8.58 ± 0.00 g | 4.54 ± 0.00 i | 12.88 ± 0.02 f | 14.03 ± 0.02 d | 20.42 ± 0.02 b | 4.41 ± 0.02 j | 18.71 ± 0.02 c | 2.93 ± 0.00 l | 22.68 ± 0.01 a |
| BFAAs | 0.50 ± 0.08 c | 0.68 ± 0.00 c | 1.27 ± 0.57 bc | 0.68 ± 0.00 c | 1.05 ± 0.05 bc | 0.90 ± 0.00 bc | 2.69 ± 0.00 a | 0.96 ± 0.15 bc | 1.60 ± 0.36 b | 0.78 ± 0.01 bc | 1.20 ± 0.36 bc | 0.47 ± 0.00 c | 2.30 ± 0.20 a |
| TFAAs | 16.51 ± 0.09 e | 7.33 ± 0.01 i | 8.65 ± 0.49 h | 5.28 ± 0.01 k | 14.20 ± 0.06 f | 8.87 ± 0.02 h | 18.44 ± 0.01 d | 18.43 ± 0.13 d | 24.33 ± 0.33 b | 9.49 ± 0.01 g | 23.63 ± 0.35 c | 6.32 ± 0.01 j | 27.59 ± 0.19 a |
| Samples | Nucleotides | GMP | IMP | AMP | CMP | UMP |
|---|---|---|---|---|---|---|
| Shellfish meat | M. chinensis | 33.45 ± 0.07 f | 7.90 ± 0.03 c | - | - | 34.48 ± 0.27 b |
| C. sinensis | 31.88 ± 0.13 g | 8.18 ± 0.07 c | - | - | 7.71 ± 0.06 h | |
| C. gigas | 42.38 ± 0.05 e | 7.05 ± 0.01 d | - | - | 16.99 ± 0.11 e | |
| S. broughtonii | 15.56 ± 0.01 i | - | - | 1.31 ± 0.03 b | 5.51 ± 0.00 i | |
| R. philippinarum | 57.56 ± 0.01 d | 52.57 ± 0.19 b | 1.49 ± 0.00 c | - | 44.45 ± 0.03 a | |
| M. galloprovincialis | 151.51 ± 0.53 a | - | 1.63 ± 0.01 c | - | 5.12 ± 0.02 i | |
| C. californiense | 99.91 ± 0.17 b | - | - | - | 10.08 ± 0.21 g | |
| S. strictus | 71.72 ± 0.32 c | - | - | - | 11.08 ± 0.03 f | |
| C. farreri | 41.80 ± 0.51 e | 0.42 ± 0.01 f | - | - | 3.83 ± 0.00 k | |
| S. subcrenata | 31.86 ± 0.02 g | - | 2.65 ± 0.11 b | - | 4.51 ± 0.01 j | |
| M. veneriformis | 42.52 ± 0.14 e | 3.84 ± 0.33 e | 4.68 ± 0.17 a | - | 28.67 ± 0.46 d | |
| M. meretrix | 99.01 ± 0.02 b | 63.10 ± 0.17 a | 1.37 ± 0.02 c | 2.75 ± 0.34 a | 31.89 ± 0.01 c | |
| S. constricta | 25.69 ± 0.04 h | - | - | - | 2.11 ± 0.05 l | |
| Boiling liquids | M. chinensis | 17.04 ± 0.02 h | 7.87 ± 0.13 e | - | - | 48.13 ± 0.16 g |
| C. sinensis | 8.51 ± 0.28 l | 1.91 ± 0.09 i | - | - | 22.72 ± 0.39 j | |
| C. gigas | 16.27 ± 0.13 i | 3.17 ± 0.04 h | - | 6.03 ± 0.06 a | 54.97 ± 0.09 f | |
| S. broughtonii | 9.28 ± 0.08 k | - | - | 5.98 ± 0.41 a | 22.62 ± 0.02 j | |
| R. philippinarum | 25.28 ± 0.00 e | 45.64 ± 0.01 a | - | - | 57.67 ± 0.00 e | |
| M. galloprovincialis | 28.18 ± 0.06 d | 9.83 ± 0.00 d | - | - | 61.43 ± 0.42 d | |
| C. californiense | 64.02 ± 0.00 a | 28.13 ± 0.38 b | - | - | 125.87 ± 0.12 a | |
| S. strictus | 22.90 ± 0.25 f | 3.66 ± 0.14 h | - | - | 42.49 ± 0.03 h | |
| C. farreri | 47.56 ± 0.05 b | 21.47 ± 0.20 c | - | - | 96.33 ± 0.24 b | |
| S. subcrenata | 19.32 ± 0.01 g | 5.18 ± 0.08 g | - | - | 48.14 ± 0.28 g | |
| M. veneriformis | 28.46 ± 0.06 d | 9.72 ± 0.00 d | - | 4.63 ± 0.35 b | 54.43 ± 0.10 f | |
| M. meretrix | 12.44 ± 0.00 j | 5.85 ± 0.41 f | - | - | 29.59 ± 0.06 i | |
| S. constricta | 39.01 ± 0.28 c | 4.75 ± 0.02 g | - | - | 74.46 ± 0.00 c |
| Samples | Organic Acids | Lactic Acid | Succinic Acid | Malic Acid | Oxalic Acid | Tartaric Acid | Acetic Acid | Maleic Acid | Fumaric Acid | Total Organic Acids |
|---|---|---|---|---|---|---|---|---|---|---|
| Shellfish meat | M. chinensis | 190.59 ± 5.33 i | 1364.14 ± 6.67 c | 830.64 ± 10.47 e | 599.07 ± 15.29 a | 2971.66 ± 30.26 c | 479.50 ± 7.52 d | 0.56 ± 0.09 f | 1.37 ± 0.13 h | 6437.53 ± 64.91 e |
| C. sinensis | 3.41 ± 0.82 j | 1287.02 ± 8.40 d | 366.12 ± 7.44 i | 98.21 ± 6.67 c | 819.12 ± 6.69 k | 145.93 ± 2.08 g | 0.16 ± 0.03 f | 4.36 ± 0.25 c | 2724.34 ± 12.69 l | |
| C. gigas | 1553.09 ± 13.51 d | - | 536.06 ± 7.62 g | 32.61 ± 2.28 ef | 2004.41 ± 13.20 f | - | 45.25 ± 1.34 b | 1.54 ± 0.06 gh | 4172.95 ± 3.74 i | |
| S. broughtonii | 1423.18 ± 9.91 e | 1964.32 ± 21.66 a | 477.06 ± 5.08 h | 19.78 ± 2.67 fgh | 5276.14 ± 15.97 a | 33.23 ± 2.36 h | 26.80 ± 2.42 d | 2.43 ± 0.09 ef | 9222.96 ± 25.17 a | |
| R. philippinarum | 3862.63 ± 4.69 a | 405.20 ± 15.25 h | 1015.89 ± 7.67 c | 169.26 ± 3.39 b | 2520.29 ± 16.04 d | 829.42 ± 10.61 a | 72.40 ± 2.71 a | 1.97 ± 0.12 fg | 8877.08 ± 20.37 b | |
| M. galloprovincialis | 3325.94 ± 8.14 b | 345.82 ± 10.37 i | 298.92 ± 8.30 j | 16.23 ± 2.51 fgh | 1090.09 ± 6.93 i | 253.78 ± 5.30 f | 27.96 ± 0.80 d | 1.79 ± 0.05 gh | 5360.53 ± 6.21 g | |
| C. californiense | 1020.03 ± 13.24 f | 1043.69 ± 14.36 e | 301.49 ± 5.62 j | 14.77 ± 1.15 fgh | 1639.86 ± 10.50 g | 341.77 ± 3.66 e | 3.08 ± 0.05 f | 3.12 ± 0.11 d | 4367.82 ± 10.16 h | |
| S. strictus | 409.24 ± 8.13 h | 923.05 ± 9.95 g | 2714.89 ± 14.67 a | 9.83 ± 1.68 gh | 1098.86 ± 10.61 i | 552.41 ± 5.75 c | 14.45 ± 0.05 e | 5.69 ± 0.06 b | 5728.43 ± 1.46 f | |
| C. farreri | 1572.54 ± 11.36 d | - | 208.34 ± 10.03 k | 6.36 ± 0.80 h | 1024.36 ± 5.82 j | - | 38.84 ± 1.16 c | 0.47 ± 0.05 i | 2850.94 ± 15.89 k | |
| S. subcrenata | 651.84 ± 5.77 g | 1354.40 ± 13.28 c | 285.51 ± 5.40 j | 29.01 ± 1.80 efg | 4677.03 ± 16.63 b | 151.93 ± 1.69 g | 15.95 ± 0.45 e | 2.73 ± 0.11 de | 7168.41 ± 0.08 d | |
| M. veneriformis | 1900.04 ± 12.08 c | 924.68 ± 26.71 g | 650.52 ± 8.76 f | 44.61 ± 1.66 e | 2325.27 ± 20.45 e | 646.14 ± 4.23 b | 0.05 ± 0.01 | 6.34 ± 0.20 a | 6497.67 ± 5.68 e | |
| M. meretrix | - | 1541.94 ± 36.10 b | 875.53 ± 12.08 d | 65.94 ± 2.58 d | 319.01 ± 5.69 l | 255.18 ± 3.06 f | 17.81 ± 1.32 e | 4.11 ± 0.18 c | 3079.50 ± 19.35 j | |
| S. constricta | 3327.95 ± 23.41 b | 986.63 ± 9.96 f | 1140.15 ± 11.36 b | 599.07 ± 11.63 a | 1211.70 ± 10.33 h | 29.77 ± 1.85 h | 45.16 ± 1.08 b | 2.67 ± 0.36 de | 7343.09 ± 47.26 c | |
| Boiling liquids | M. chinensis | 427.48 ± 12.23 h | 1389.83 ± 4.83 e | 908.78 ± 5.97 h | 400.99 ± 7.22 a | 5147.79 ± 19.52 d | 991.02 ± 13.25 a | 3.91 ± 0.23 i | 7.56 ± 0.52 f | 9277.36 ± 11.74 f |
| C. sinensis | 361.02 ± 18.90 i | 1254.99 ± 16.82 f | 644.95 ± 8.83 i | 27.76 ± 2.16 g | 856.05 ± 13.72 l | 128.98 ± 4.56 g | 3.70 ± 0.14 i | 2.06 ± 0.06 h | 3279.52 ± 24.19 l | |
| C. gigas | 888.59 ± 14.62 e | 338.37 ± 8.61 i | 495.23 ± 11.34 j | 16.71 ± 1.83 h | 2104.76 ± 9.80 k | - | 13.35 ± 0.55 d | 3.77 ± 0.14 g | 3860.77 ± 26.21 j | |
| S. broughtonii | 483.05 ± 23.16 gh | 734.90 ± 15.39 h | 875.22 ± 13.52 h | 64.24 ± 2.64 e | 8193.76 ± 17.67 b | 166.07 ± 4.71 f | 7.10 ± 0.06 g | 13.88 ± 0.66 d | 10,538.23 ± 40.31 e | |
| R. philippinarum | 447.28 ± 9.23 h | 138.19 ± 7.75 k | 502.89 ± 8.71 j | 280.47 ± 4.78 b | 2253.84 ± 20.36 j | 96.74 ± 1.36 h | 5.67 ± 0.01 h | 8.78 ± 0.43 ef | 3733.85 ± 52.61 k | |
| M. galloprovincialis | 4761.02 ± 15.38 a | 247.49 ± 6.87 j | 317.98 ± 4.83 k | 51.83 ± 3.00 f | 2250.42 ± 14.46 j | 387.59 ± 5.79 d | 51.94 ± 0.13 a | 15.42 ± 0.58 cd | 8083.64 ± 19.71 h | |
| C. californiense | 4360.01 ± 30.82 b | 377.80 ± 13.29 i | 2536.31 ± 19.64 c | 82.31 ± 2.26 d | 5385.86 ± 28.43 c | 627.39 ± 11.05 c | 11.60 ± 0.06 e | 8.96 ± 0.43 ef | 13,390.24 ± 39.22 b | |
| S. strictus | 646.03 ± 20.61 f | 1504.05 ± 40.35 d | 5060.04 ± 15.74 a | 32.39 ± 1.05 g | 4099.55 ± 16.37 f | 630.82 ± 4.63 c | 12.84 ± 0.04 d | 15.09 ± 0.39 cd | 12,000.81 ± 34.96 c | |
| C. farreri | 615.08 ± 10.68 f | 1088.48 ± 9.80 g | 1151.83 ± 4.63 g | 65.29 ± 3.69 e | 3610.16 ± 15.04 g | - | 15.80 ± 0.11 c | 10.11 ± 0.26 e | 6556.74 ± 13.61 i | |
| S. subcrenata | 511.54 ± 5.79 g | 2203.31 ± 23.16 c | 1962.33 ± 8.52 d | 109.83 ± 0.95 c | 11,095.26 ± 34.26 a | 261.14 ± 7.12 e | 8.02 ± 0.03 f | 32.94 ± 0.73 a | 16,184.39 ± 62.06 a | |
| M. veneriformis | 1189.02 ± 15.49 d | 3701.68 ± 18.62 b | 1680.05 ± 20.33 e | 62.24 ± 1.46 e | 4708.31 ± 16.69 e | 698.87 ± 10.60 b | 2.53 ± 0.06 j | 27.78 ± 0.84 b | 12,070.48 ± 17.52 c | |
| M. meretrix | 285.25 ± 11.64 j | 4279.10 ± 14.92 a | 1425.23 ± 14.86 f | - | 2904.50 ± 26.43 i | - | 7.06 ± 0.10 g | 3.91 ± 0.05 g | 8905.05 ± 14.79 g | |
| S. constricta | 3224.62 ± 16.81 c | - | 3542.85 ± 24.44 b | 17.60 ± 0.48 h | 3310.77 ± 17.80 h | 991.02 ± 17.85 a | 17.54 ± 0.39 b | 16.62 ± 0.11 c | 11,121.02 ± 76.14 d |
| Shellfish Species | EUCs | |
|---|---|---|
| Shellfish Meat | Boiling Liquids | |
| M. chinensis | 122.8 ± 0.4 f | 99.8 ± 0.5 h |
| C. sinensis | 93.4 ± 0.6 i | 29.1 ± 0.2 l |
| C. gigas | 114.9 ± 1.2 g | 51.7 ± 0.8 j |
| S. broughtonii | 59.4 ± 1.6 k | 34.1 ± 0.4 k |
| R. philippinarum | 305.2 ± 0.7 c | 286.8 ± 0.6 b |
| M. galloprovincialis | 450.4 ± 3.2 b | 142.1 ± 0.3 f |
| C. californiense | 261.9 ± 0.6 d | 358.3 ± 0.9 a |
| S. strictus | 258.0 ± 5.7 d | 140.6 ± 0.2 f |
| C. farreri | 102.6 ± 1.1 h | 248.4 ± 1.0 c |
| S. subcrenata | 84.5 ± 0.5 j | 110.5 ± 0.2 g |
| M. veneriformis | 165.0 ± 3.0 e | 230.9 ± 1.1 d |
| M. meretrix | 586.8 ± 1.4 a | 65.5 ± 0.7 i |
| S. constricta | 62.3 ± 0.1 k | 187.5 ± 1.0 e |
| Index | PC1 | PC2 | PC3 | PC4 |
|---|---|---|---|---|
| EAA/TAA | 0.909 | −0.283 | −0.161 | −0.134 |
| EAA/NEAA | 0.904 | −0.288 | −0.173 | −0.141 |
| Taurine | 0.687 | −0.521 | 0.105 | −0.361 |
| Ash | −0.622 | −0.345 | 0.532 | −0.049 |
| Meat yield | −0.221 | 0.796 | −0.026 | −0.510 |
| Protein | 0.534 | 0.731 | 0.157 | −0.133 |
| n3/n6 | 0.334 | 0.548 | 0.098 | 0.535 |
| Fat | 0.286 | 0.304 | −0.779 | 0.348 |
| PUFA | 0.451 | 0.165 | 0.665 | 0.434 |
| Polysaccharide | −0.378 | −0.495 | −0.649 | 0.293 |
| EUC | 0.223 | −0.380 | 0.524 | 0.277 |
| Eigenvalue | 3.425 | 2.532 | 2.129 | 1.207 |
| Variance contribution rate (%) | 31.137 | 23.014 | 19.357 | 10.970 |
| cumulative variance contribution rate (%) | 31.137 | 54.151 | 73.508 | 84.478 |
| Shellfish Species | Scores of First Principal Components (F1) | Scores of Second Principal Components (F2) | Scores of Third Principal Components (F3) | Scores of Fourth Principal Components (F4) | Comprehensive Score (F) | Rank |
|---|---|---|---|---|---|---|
| M. chinensis | −0.30 | 1.57 | 1.89 | −1.80 | 0.44 | 4 |
| C. sinensis | −3.17 | −1.43 | 1.22 | −0.89 | −1.18 | 11 |
| C. gigas | 0.92 | −1.76 | −1.32 | 1.02 | −0.26 | 9 |
| S. broughtonii | 2.56 | 0.54 | −1.57 | 0.23 | 0.64 | 2 |
| R. philippinarum | −0.10 | −0.35 | 0.19 | −0.05 | −0.08 | 7 |
| M. galloprovincialis | 1.44 | −0.95 | 1.37 | 0.37 | 0.54 | 3 |
| C. californiense | 1.27 | 2.08 | 1.05 | 0.92 | 1.18 | 1 |
| S. strictus | 0.35 | 1.16 | 0.16 | −0.93 | 0.30 | 5 |
| C. farreri | −0.21 | 2.64 | −0.13 | 1.15 | 0.64 | 2 |
| S. subcrenata | 2.18 | −1.21 | −1.31 | −1.88 | −0.06 | 6 |
| M. veneriformis | −2.23 | −0.28 | 0.55 | 1.42 | −0.50 | 10 |
| M. meretrix | 0.41 | −2.63 | 1.08 | 0.75 | −0.18 | 8 |
| S. constricta | −3.13 | 0.61 | −3.18 | −0.30 | −1.48 | 12 |
Disclaimer/Publisher’s Note: The statements, opinions and data contained in all publications are solely those of the individual author(s) and contributor(s) and not of MDPI and/or the editor(s). MDPI and/or the editor(s) disclaim responsibility for any injury to people or property resulting from any ideas, methods, instructions or products referred to in the content. |
© 2025 by the authors. Licensee MDPI, Basel, Switzerland. This article is an open access article distributed under the terms and conditions of the Creative Commons Attribution (CC BY) license (https://creativecommons.org/licenses/by/4.0/).
Share and Cite
Li, L.; Fu, Z.; Liu, Y.; Song, Z.; Yang, X.; Yu, D.; Wang, Q.; Chi, H.; Zheng, J. A Comprehensive and Comparative Study on the Biochemical Composition and Non-Volatile Taste Compounds of Thirteen Shellfish Species. Foods 2025, 14, 1595. https://doi.org/10.3390/foods14091595
Li L, Fu Z, Liu Y, Song Z, Yang X, Yu D, Wang Q, Chi H, Zheng J. A Comprehensive and Comparative Study on the Biochemical Composition and Non-Volatile Taste Compounds of Thirteen Shellfish Species. Foods. 2025; 14(9):1595. https://doi.org/10.3390/foods14091595
Chicago/Turabian StyleLi, Long, Zhiyu Fu, Yujun Liu, Zhiyuan Song, Xinrui Yang, Di Yu, Qingzhi Wang, Hai Chi, and Jie Zheng. 2025. "A Comprehensive and Comparative Study on the Biochemical Composition and Non-Volatile Taste Compounds of Thirteen Shellfish Species" Foods 14, no. 9: 1595. https://doi.org/10.3390/foods14091595
APA StyleLi, L., Fu, Z., Liu, Y., Song, Z., Yang, X., Yu, D., Wang, Q., Chi, H., & Zheng, J. (2025). A Comprehensive and Comparative Study on the Biochemical Composition and Non-Volatile Taste Compounds of Thirteen Shellfish Species. Foods, 14(9), 1595. https://doi.org/10.3390/foods14091595