3.1. Study of Safflower Oil Extraction at Different Pressing Times and Degrees of Grinding
To evaluate the quantitative and qualitative parameters of safflower oil extraction, experiments were conducted under the following conditions:
Pressing Times: s, s, s, s;
Degrees of Grinding: , , , .
The parameter “pressing time” was evaluated as an important factor affecting the pressing efficiency. Excessive pressing time could reduce the oil yield, and a short pressing time could lead to high oil content in the cake. The total pressing time was determined using the following relationship based on time and screw speed. The formula was used to calculate the pressing time at a known rotational speed:
where
is the pressing time (min),
is the press chamber length (m), and
is the feed rate of raw material (m/s), which depends on screw speed.
As shown in
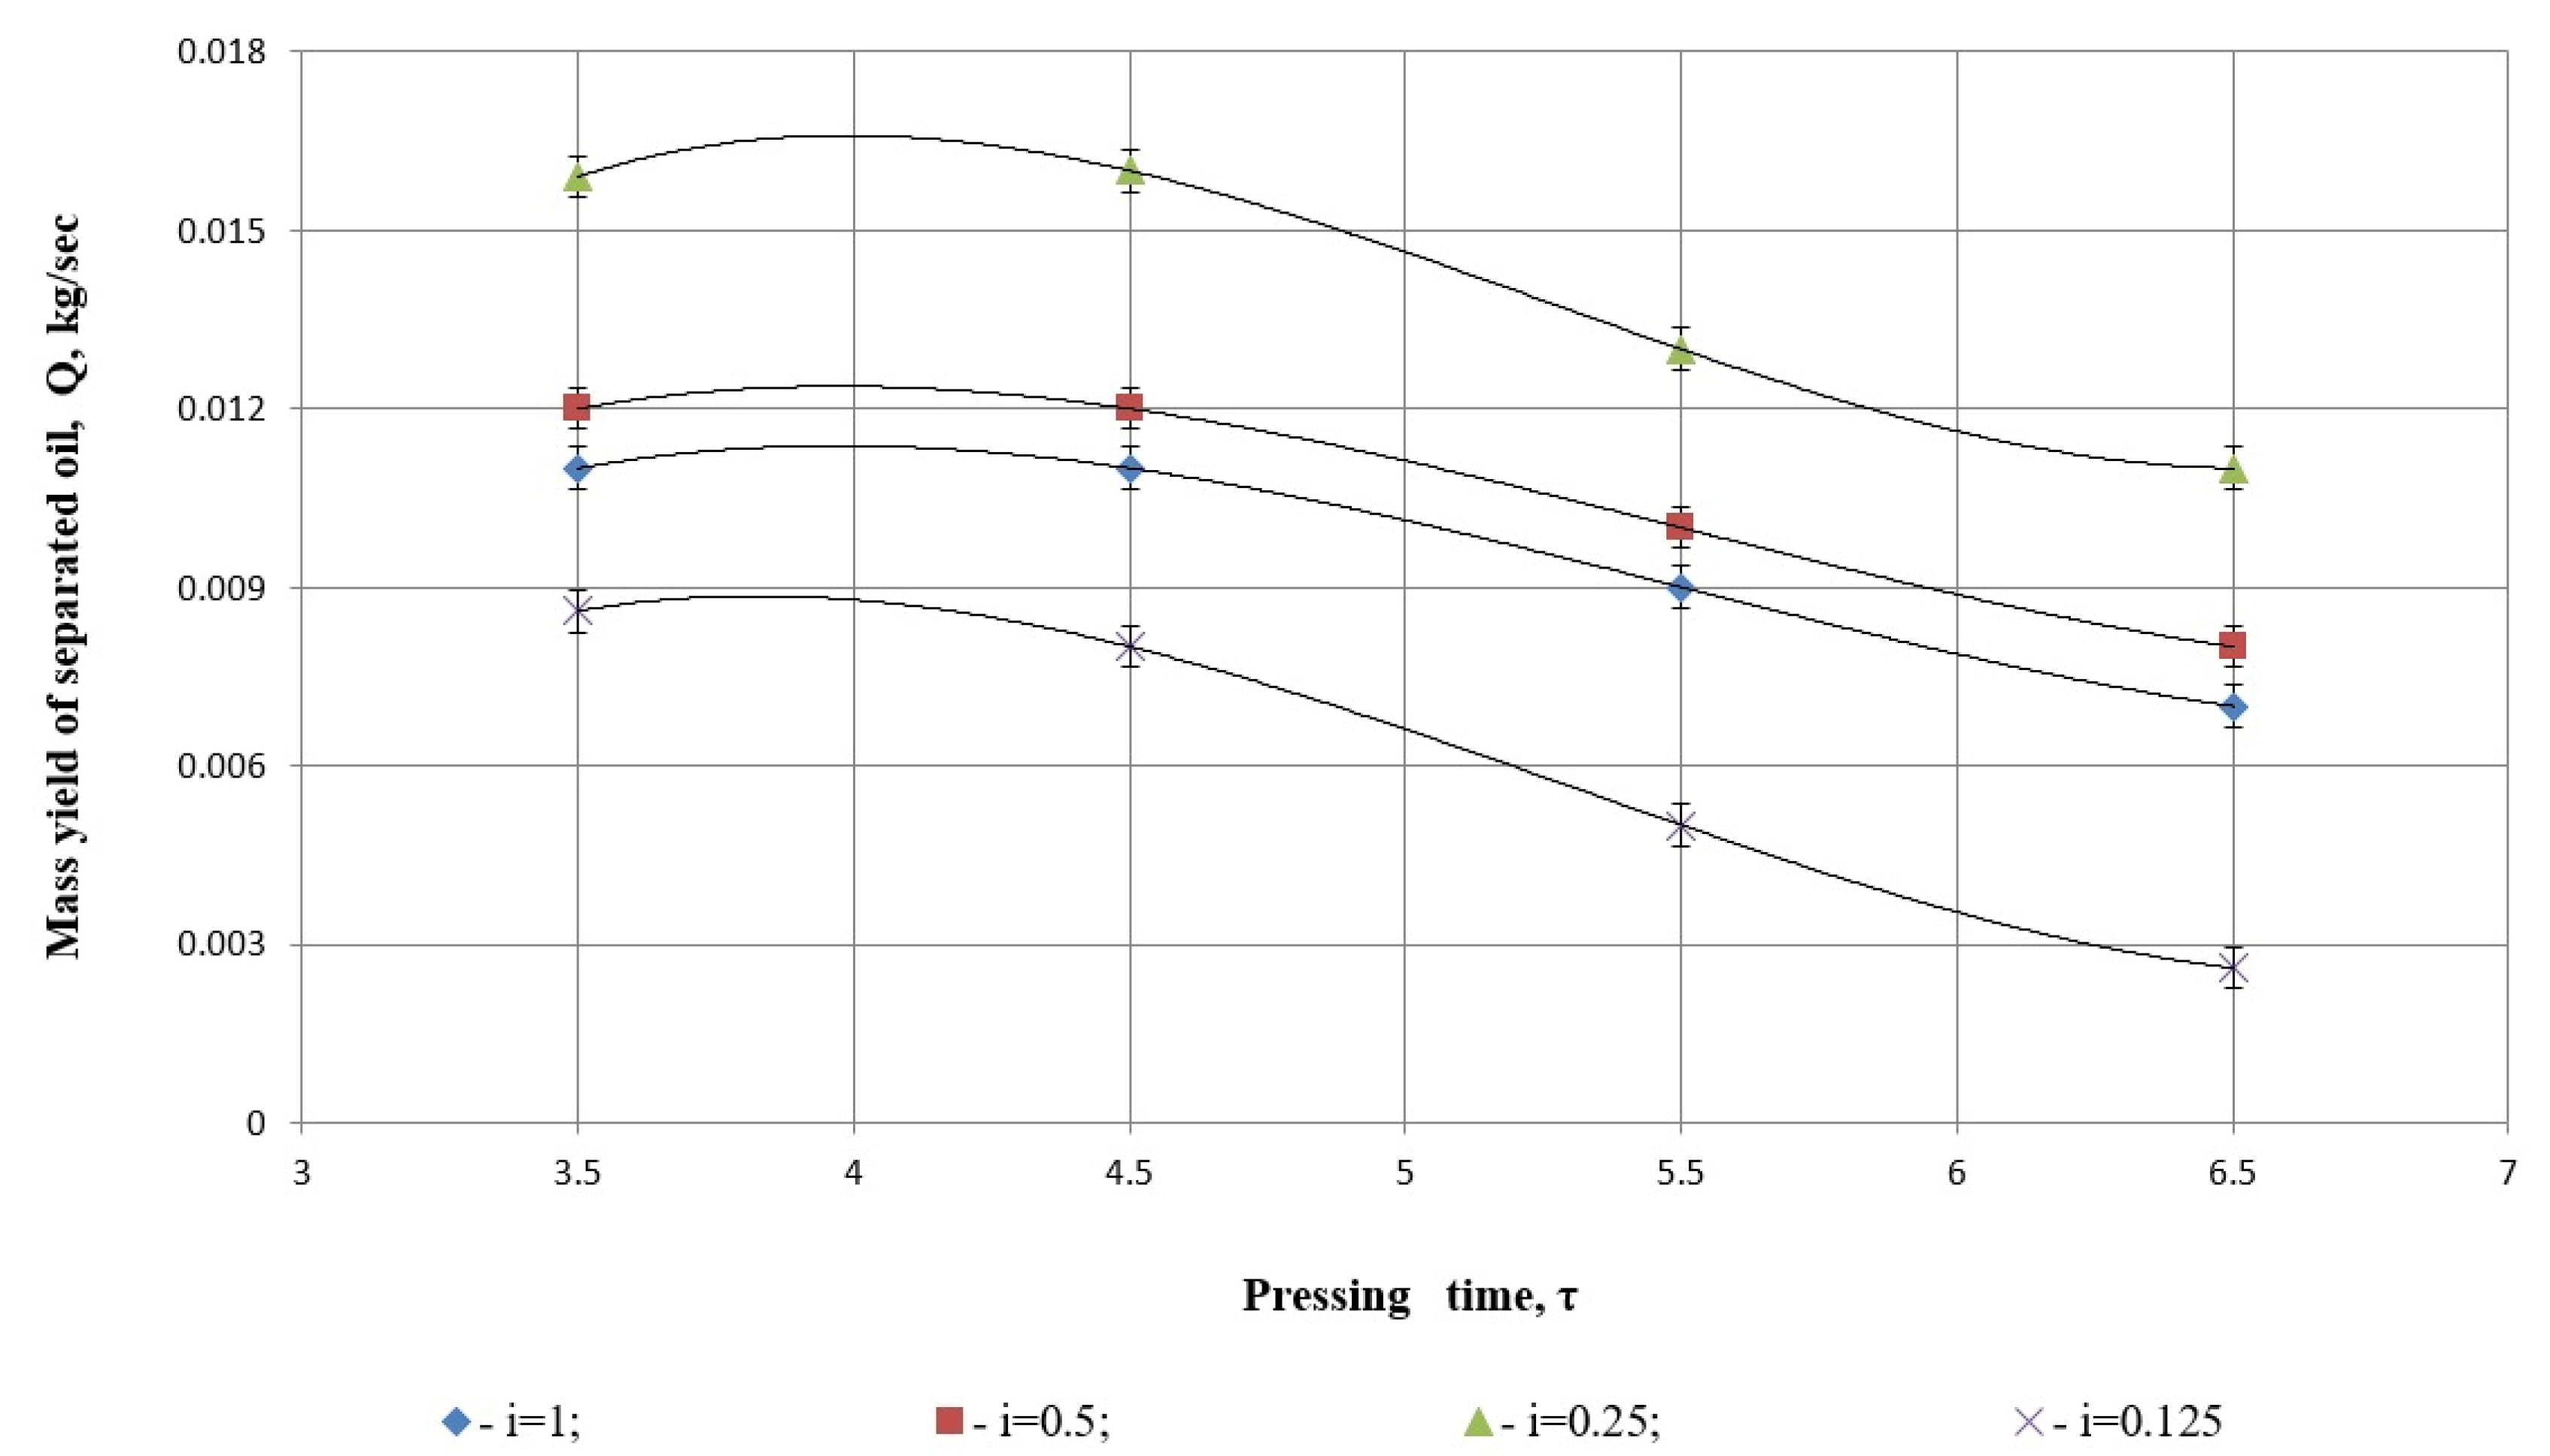
Figure 6, analysis of the oil yield at various degrees of grinding revealed that the optimal conditions for the pressing process are a pressing time of
s and a grinding degree of
.
At lower screw rotation speeds, the reduced throughput limits the oil extraction due to the material balance constraints, resulting in decreased oil yield. Conversely, excessively high rotation speeds reduce pressing time, leading to insufficient separation of oil from safflower seeds and a significant increase in energy consumption. Consequently, reducing the pressing time below s does not yield further improvements.
When we examine the graph in
Figure 6, the relationship between degrees of grinding and oil yield becomes evident. Smaller particle sizes require shorter pressing times, but degrees of grinding beyond
lead to a sharp decline in oil yield. This decrease is particularly pronounced at
and
, which can be attributed to changes in the viscosity of the material. Excessive grinding at these levels closes the natural filter channels within the product matrix, hindering effective oil separation.
Quadratic regression analysis of
Figure 6 illustrates the relationship between pressing time
τ and the mass yield of separated oil
Q (in kg/s), for different values of the parameter
i. For each case, a second-degree polynomial of the form (
Table 1) was fitted to the data:
3.1.1. Polynomial Coefficients
For all values of the parameter i, the coefficient a is negative. This indicates a concave-down parabola, meaning that each function has a distinct maximum, an optimal pressing time beyond which the oil yield starts to decrease;
The coefficient b is positive in each case, which reflects an initial increase in oil yield as pressing time increases.
3.1.2. Model Fit Quality (R2 Values):
Slightly lower R2 values were observed for i = 1 (0.91) and i = 0.25 (0.88).
3.1.3. Interpretation of Parameter i
The highest yield was achieved at i = 0.25, which aligns with the peak visually observable in the plot, indicating the most efficient pressing conditions;
Both overly high (i = 1) and overly low (i = 0.125) values of the parameter resulted in decreased yields, suggesting the existence of an optimal operating condition.
Quadratic regression analysis reveals a linear–nonlinear relationship between pressing time and separated oil mass yield that graphs as a concave-down parabola for all conditions tested. The negative value of the quadratic coefficients (a) at all levels of process parameter iii indicates that the oil yield becomes better with pressing time up to a certain point, when it begins to decrease. Such a trend suggests that there might be an optimal period for pressing for efficiency in extraction. Such large R2 values bear witness to the efficiency of models used here, characterizing well the observed tendencies and proving their predictiveness and suitability for optimization applications.
Mizera et al. (2018) [
14] investigated the pressing of rapeseed using a Farmer 20 Duo screw press (Farmer 20, Farmet AS, Ceska Skalice, Czech Republic) at screw speeds of 10, 20, 30, 40, 55, and 65 rpm. Their findings showed that the maximum oil extraction efficiency of 82.6% occurred at the lowest screw speed and longest pressing time. However, it is important to note that their study involved a different seed type and equipment specification compared with the present research.
Similarly, the results align with the findings of Bogaert et al. (2018) [
11], which indicate that increasing screw speed can reduce both oil yield and specific energy consumption. This highlights the necessity of optimizing screw speed to balance extraction efficiency and energy use.
It was determined that the optimal pressing conditions are achieved at a pressing time of s and a grinding degree of .
Pressure is one of the key parameters influencing the efficiency of the pressing process [
43]. Analyzing the graph in
Figure 7, which illustrates the relationship between grinding degree and pressure during pressing, reveals important insights.
Residual oil content is an important indicator of the efficiency of the pressing process and the quality of the resulting oil.
At a degree of grinding of and a pressure of kPa, the residual fat content in the cake reaches its minimum level, indicating optimal oil extraction. Beyond this pressure, no significant reduction in residual fat is observed, suggesting that further increases in pressure during pressing are ineffective.
For other degrees of grinding, the observed dependence of residual fat content on pressure during pressing can be attributed to the closure of the product’s natural filter channels. Excessive grinding creates finer particles that impede oil flow, reducing the efficiency of the pressing process. It is known that a low residual oil content indicates a high efficiency of the extracted oil because most of the oil has been removed from the raw material. In contrast, high residual oil content may indicate an inefficient pressing process or equipment problems [
44,
45].
Figure 7 illustrates the relationship between pressing pressure (
P, in kPa) and the residual oil content in safflower cake (%,
y-axis) for different degrees of grinding (
i), as follows (
Table 2):
—whole seeds (blue diamonds);
—moderately ground (red squares);
—optimally ground (green triangles);
—very finely ground (purple Xs).
Each curve represents a third-degree polynomial regression (cubic function), and the respective regression equations and coefficients of determination R2 are shown on the graph.
This model has the highest coefficient of determination, explaining 97.76% of the variability in residual oil content. This is the best-fitting model, both statistically and technologically, indicating optimal pressing conditions.
This is also a very good model fit. It explains 96.78% of the variability. However, the residual oil content remains higher than at i = 0.25, likely owing to over-grinding, which clogs natural filtration channels and impairs oil flow.
This is also a very good fit that explains 95.74% of the variance in the residual oil content. It is slightly worse than the one for i = 0.25, but it is still reliable for practical use.
This model explains 95.04% of the variation in the data. Though still statistically valid, it is the least accurate among the four and corresponds to unprocessed whole seeds, which provide the lowest oil extraction efficiency.
Statistical treatment of the regression equations unambiguously indicates that the relationship between pressing pressure and residual oil content in safflower cake is not linear and hence presumably can be most adequately described by cubic polynomial functions. The degree of grinding i = 0.25 model of all examined ones not only had the maximum value of the coefficient of determination (R2 = 0.9776), but also the optimal practical result—minimum residual oil content. This implies that there is an optimum degree of grinding that creates optimal structural conditions within the seed matrix for efficient pressure-release oil drainage. Under-grinding (i = 1) and over-grinding (i = 0.125) yielded worse regression fits and higher residual oil content, lending support to the contention that excessive particle sizes hinder efficient oil separation, either by too little mechanical rupture or clogging of natural filtration channels.
The experimental study concludes that intensification of the pressing process cannot be achieved solely by increasing pressure. Instead, it is necessary to experimentally determine an optimal pressure value, considering the technological characteristics of production, the structural and mechanical properties of the material, and the quantity and quality of the extracted liquid.
3.2. Determination of Power Requirements for the Pressing Process at Different Degrees of Grinding and Pressing Times
The pressing process is known to be one of the most energy-intensive operations. Combining grinding and pressing processes, while quantifying the power required for both, adds a quantitative dimension to this research and provides insights into process optimization.
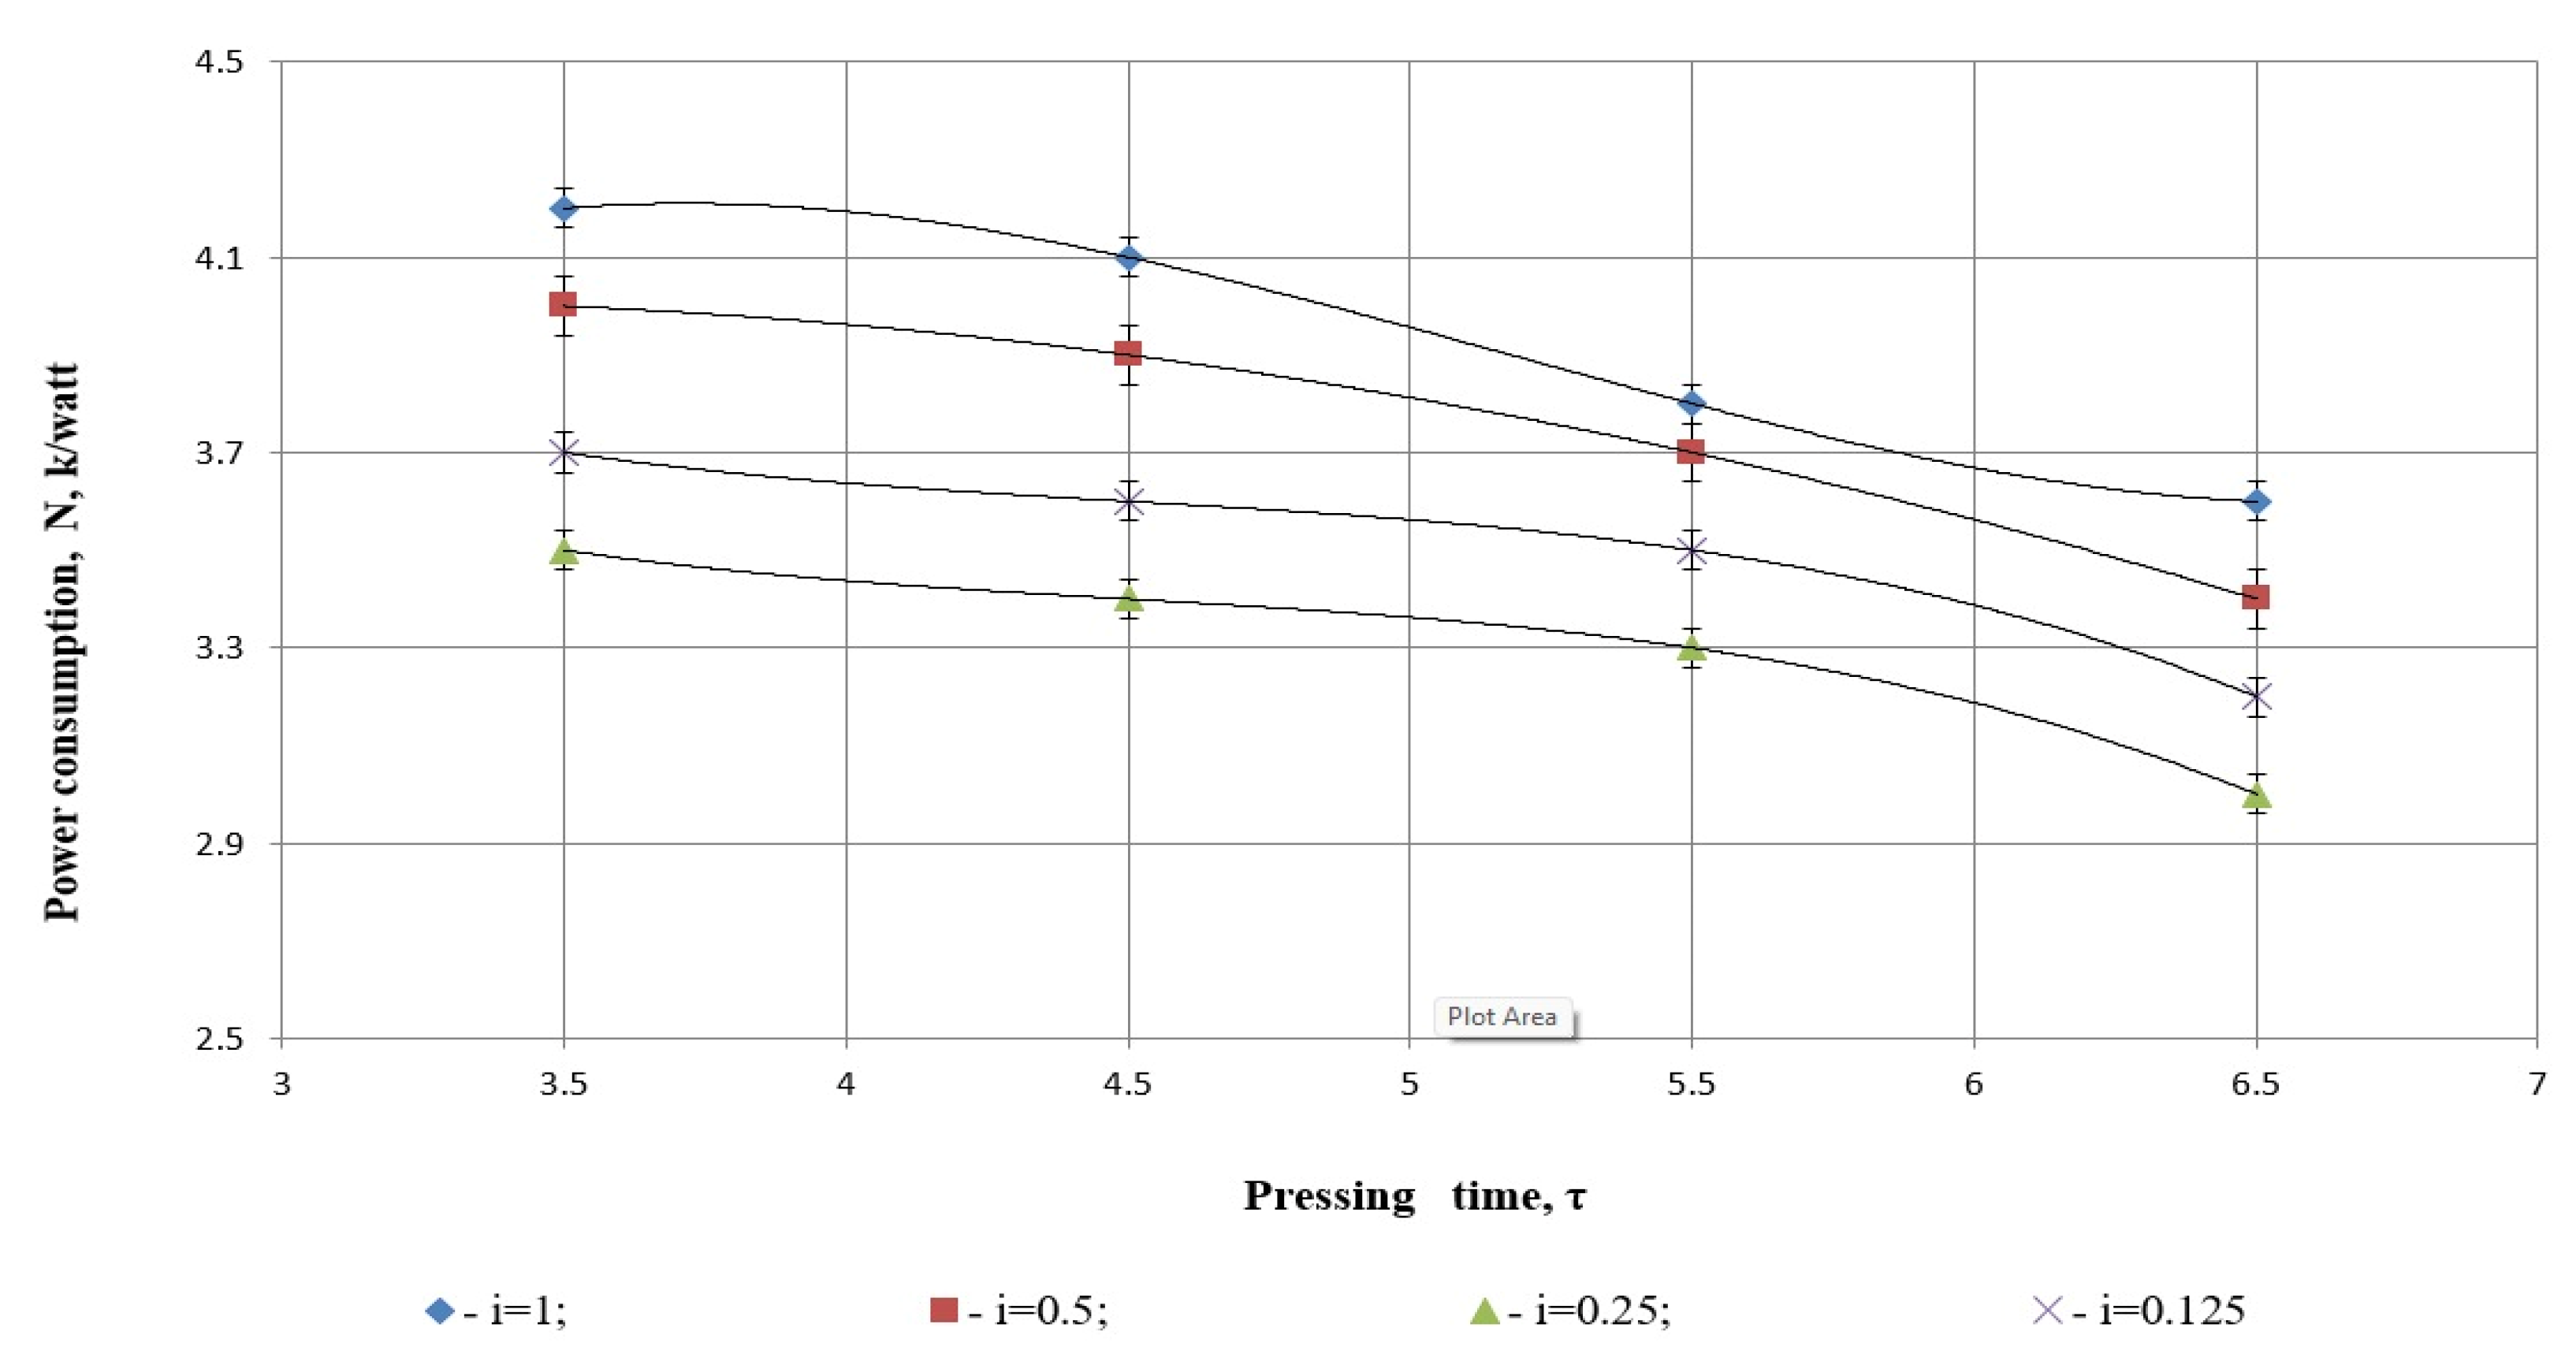
Figure 8 shows the relationship between pressing time (
τ) and energy consumption (Capacity, N·kWatt) at various degrees of grinding (
i). Each curve represents a cubic polynomial regression fitted to the data, with corresponding equations and coefficients of determination
R2 provided on the plot (
Table 3).
Each degree of grinding i has its own fitted cubic polynomial. The statistical measure of interest is the coefficient of determination (R2), which indicates how well the model explains the variability in the observed data.
The regression model for i = 1 perfectly fits the observed data, as shown by the coefficient R2 = 1. This means the model explains 100% of the variability in energy consumption based on pressing time. This result strongly indicates a deterministic, well-behaved trend in the data, likely due to high experimental consistency at this degree of grinding.
Again, we observe a perfect statistical fit for this model. The cubic term is effectively zero, indicating that a quadratic function might be sufficient to describe this trend. However, the R2 value of 1 confirms that the regression surface passes through all data points with no deviation.
This degree of grinding also yields a model with perfect goodness-of-fit. The shape of the curve indicates a downward trend in energy consumption with increasing pressing time, which may reflect improved flow dynamics or material plasticity during prolonged pressing.
This model has an identical structure to the one for i = 0.25, but a slightly higher constant term. Again, the R2 = 1 indicates that the model fits the data exactly, implying highly regular behavior in energy consumption under this grinding condition.
The statistical evaluation of
Figure 8 confirms that the dependency between pressing time and energy demand (capacity) is best described by the applied cubic regression models used, and all degrees of grinding (
i = 1.0, 0.5, 0.25, and 0.125) possess a coefficient of determination
R2 = 1. This implies that the models describe the experimental data precisely, without remaining variance in the observed interval. This level of exact fit is characteristic of very uniform experimental and data-gathering conditions. It also means, however, that models are assumed to interpolate in a small set of data points, so the models are theoretically precise but possibly sensitive to deviations from the sampled values. Every one of the regression lines’ typical shapes reflects the way particle grinding level affects the material’s mechanical resistivity, in which fine particles will lead to low energy requirements for long pressing times.
As illustrated in
Figure 8, the relationship between power consumption, pressing time, and degree of grinding was analyzed. The results indicate that power consumption increases as the pressing time is reduced. This is attributed to the intensified oil separation process during shorter pressing intervals, where increased oil extraction correlates with higher energy usage. For example, when the time taken varied from 3.5 to 6.5 s, the power consumption varied with the degree of grinding and time, from 3.6 kWt without pre-crushing to 4.2 kWt when the seeds were crushed to 2 mm.
The study found that at a degree of grinding of , power consumption was at its lowest level. Conversely, the maximum power consumption occurred at , where the pressing process was carried out without any pre-milling. This increase in power demand is explained by the higher oil separation pressure and greater internal and external friction in the unprocessed product.
At a degree of grinding of
, the higher power requirement is attributed to the energy-intensive nature of the grinding process itself, which outweighs the energy demands of the pressing process. Therefore,
emerges as the most efficient grinding parameter, balancing energy consumption and oil separation performance. The findings of this study closely align with those reported by Kabulov et al. (2012), which demonstrated that an increase in screw rotation speed during sunflower seed pressing leads to a corresponding rise in power consumption [
46]. Similarly, Korendiy et al. developed a novel press featuring two compression stages for vegetable oil extraction. Their experiments revealed that this design achieves an oil yield exceeding 90%, outperforming traditional presses. The final phase of their research focused on the energy characterization of the developed equipment, particularly analyzing power consumption during oil extraction and cake discharge [
47].
As a result, it was determined that further reduction of the safflower seed degree of grinding below does not yield beneficial results. Instead, it leads to a decline in pressing efficiency and an increase in power consumption.
3.3. Compression and Rheological Changes of Safflower Product During Pressing at Different Degrees of Grinding
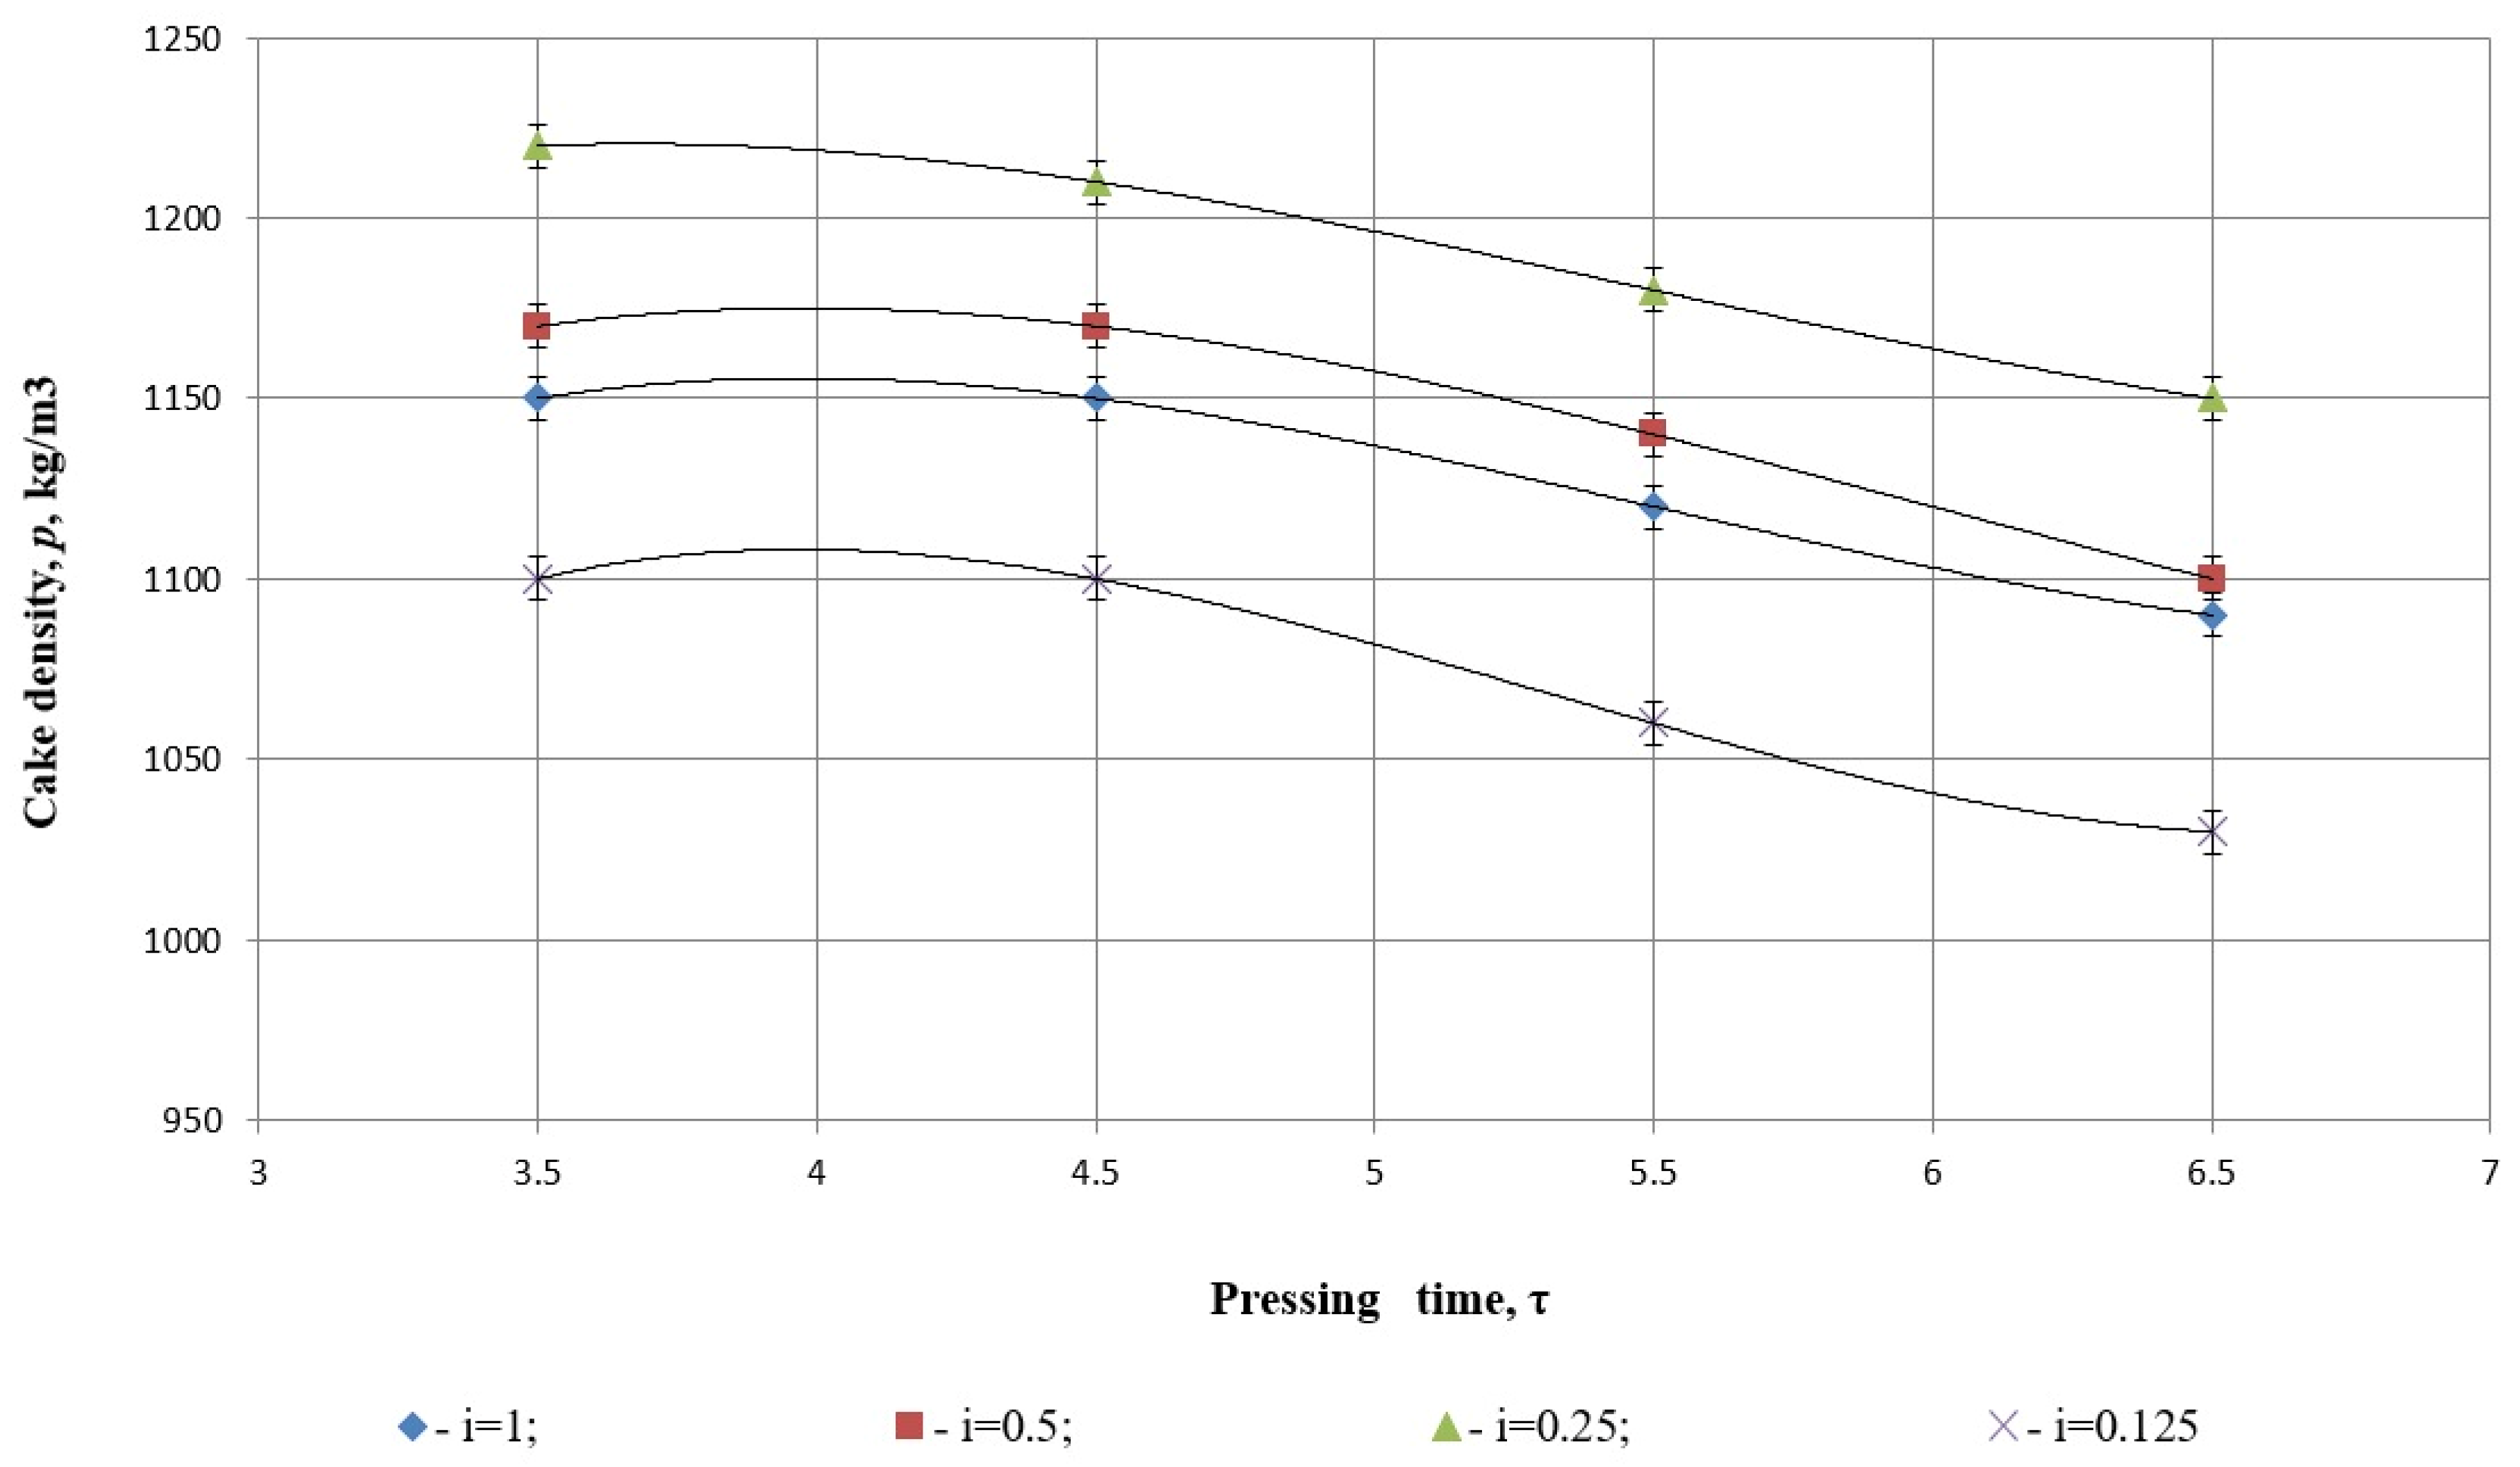
Among the physical properties of safflower cake during the pressing process, density plays a pivotal role. The density of the cake serves as a key parameter in characterizing the degree of compression during the pressing process.
The variation in cake density as a function of pressing time and degree of grinding was analyzed (as seen in
Figure 9). The findings revealed that under the influence of external forces during pressing, the density of safflower cake increases, irrespective of the liquid fraction remaining in the cake. However, upon the cessation of external forces, the density decreases due to the cake’s inherent elasticity, which is influenced by the liquid fraction retained within the cake.
These observations highlight the interplay between external compressive forces and the rheological properties of the product, emphasizing the importance of optimizing grinding and pressing parameters to achieve the desired product quality and minimize energy losses.
Figure 9 illustrates the relationship between pressing time (τ) and cake density (ρ, kg/m
3) for various degrees of grinding, denoted as
i = 1, 0.5, 0.25, 0.125. Each dataset is modeled using a cubic polynomial regression, and the goodness-of-fit of each model is evaluated using the coefficient of determination
R2 (
Table 4).
The cake density curves are fitted with third-degree polynomials. Each regression equation is explicitly shown on the graph, along with its corresponding R2 value. All models report R2 = 1, suggesting a perfect fit to the experimental data.
The regression model shows a perfect fit, indicating that the cubic polynomial explains 100% of the variance in cake density across the measured pressing times. The high-order terms suggest a non-linear dynamic, and the curve shape indicates a density peak at moderate pressing times, followed by a slight decline. This likely reflects compaction followed by material relaxation or internal resistance build-up.
Another case of the perfect fit, with slightly lower initial density values than the i = 0.25 case. The regression terms describe a similar curvature trend, suggesting that density initially increases or stabilizes and then decreases slightly with longer pressing durations. The perfect R2 implies no deviation between observed and predicted data points.
Despite the relatively coarse material (i = 1), the data still fit the cubic model exactly. The intercept and coefficients reflect higher initial density compared to more finely ground material, possibly due to larger particles resisting compaction. The curve shows a slower density decline over time, which may indicate a different internal structure evolution under pressure.
Although this model also exhibits a perfect statistical fit, the negative cubic term and strong curvature suggest a steeper and more irregular response. The finely ground material seems to reach a density peak early, then undergoes a sharper decline. This may point to structural instability or the collapse of natural oil-flow channels due to excessive pulverization.
Statistical analysis of
Figure 9 shows a highly coherent and accurate cubic regression model fit to the experimental data, where all four levels of grind (
i = 1, 0.5, 0.25, and 0.125) yielded the coefficient of determination
R2 = 1. This perfect statistical fit indicates that the polynomial equations account for all the variation in cake density with pressing time across the data range being measured. Of most interest, the models suggest various compaction behaviors depending on the degree of grinding: a moderate grinding (
i = 0.25 and 0.5) exhibits higher initial cake density and a gradual decline with time, while over-grinding (
i = 0.125) produces a sharp drop, the likely reason being the collapse of the structural matrix. Even with the ideal fit, the consistently high
R2 values mean that the models are interpolative and can, in theory, overfit to sparse data points, so extrapolation beyond experimental conditions should be performed with caution.
According to
Figure 9, the density of safflower cake decreases during the pressing experiment owing to the reduction of fat content within the cake. On the contrary, the modulus of elasticity increases because oil removal takes place during safflower pressing, which leads to a decrease in cake density due to a decrease in mass and pore formation. However, at the same time, the elastic modulus increases because the structure becomes more cohesive and stable, which is given in the work by Paronyan [
48].
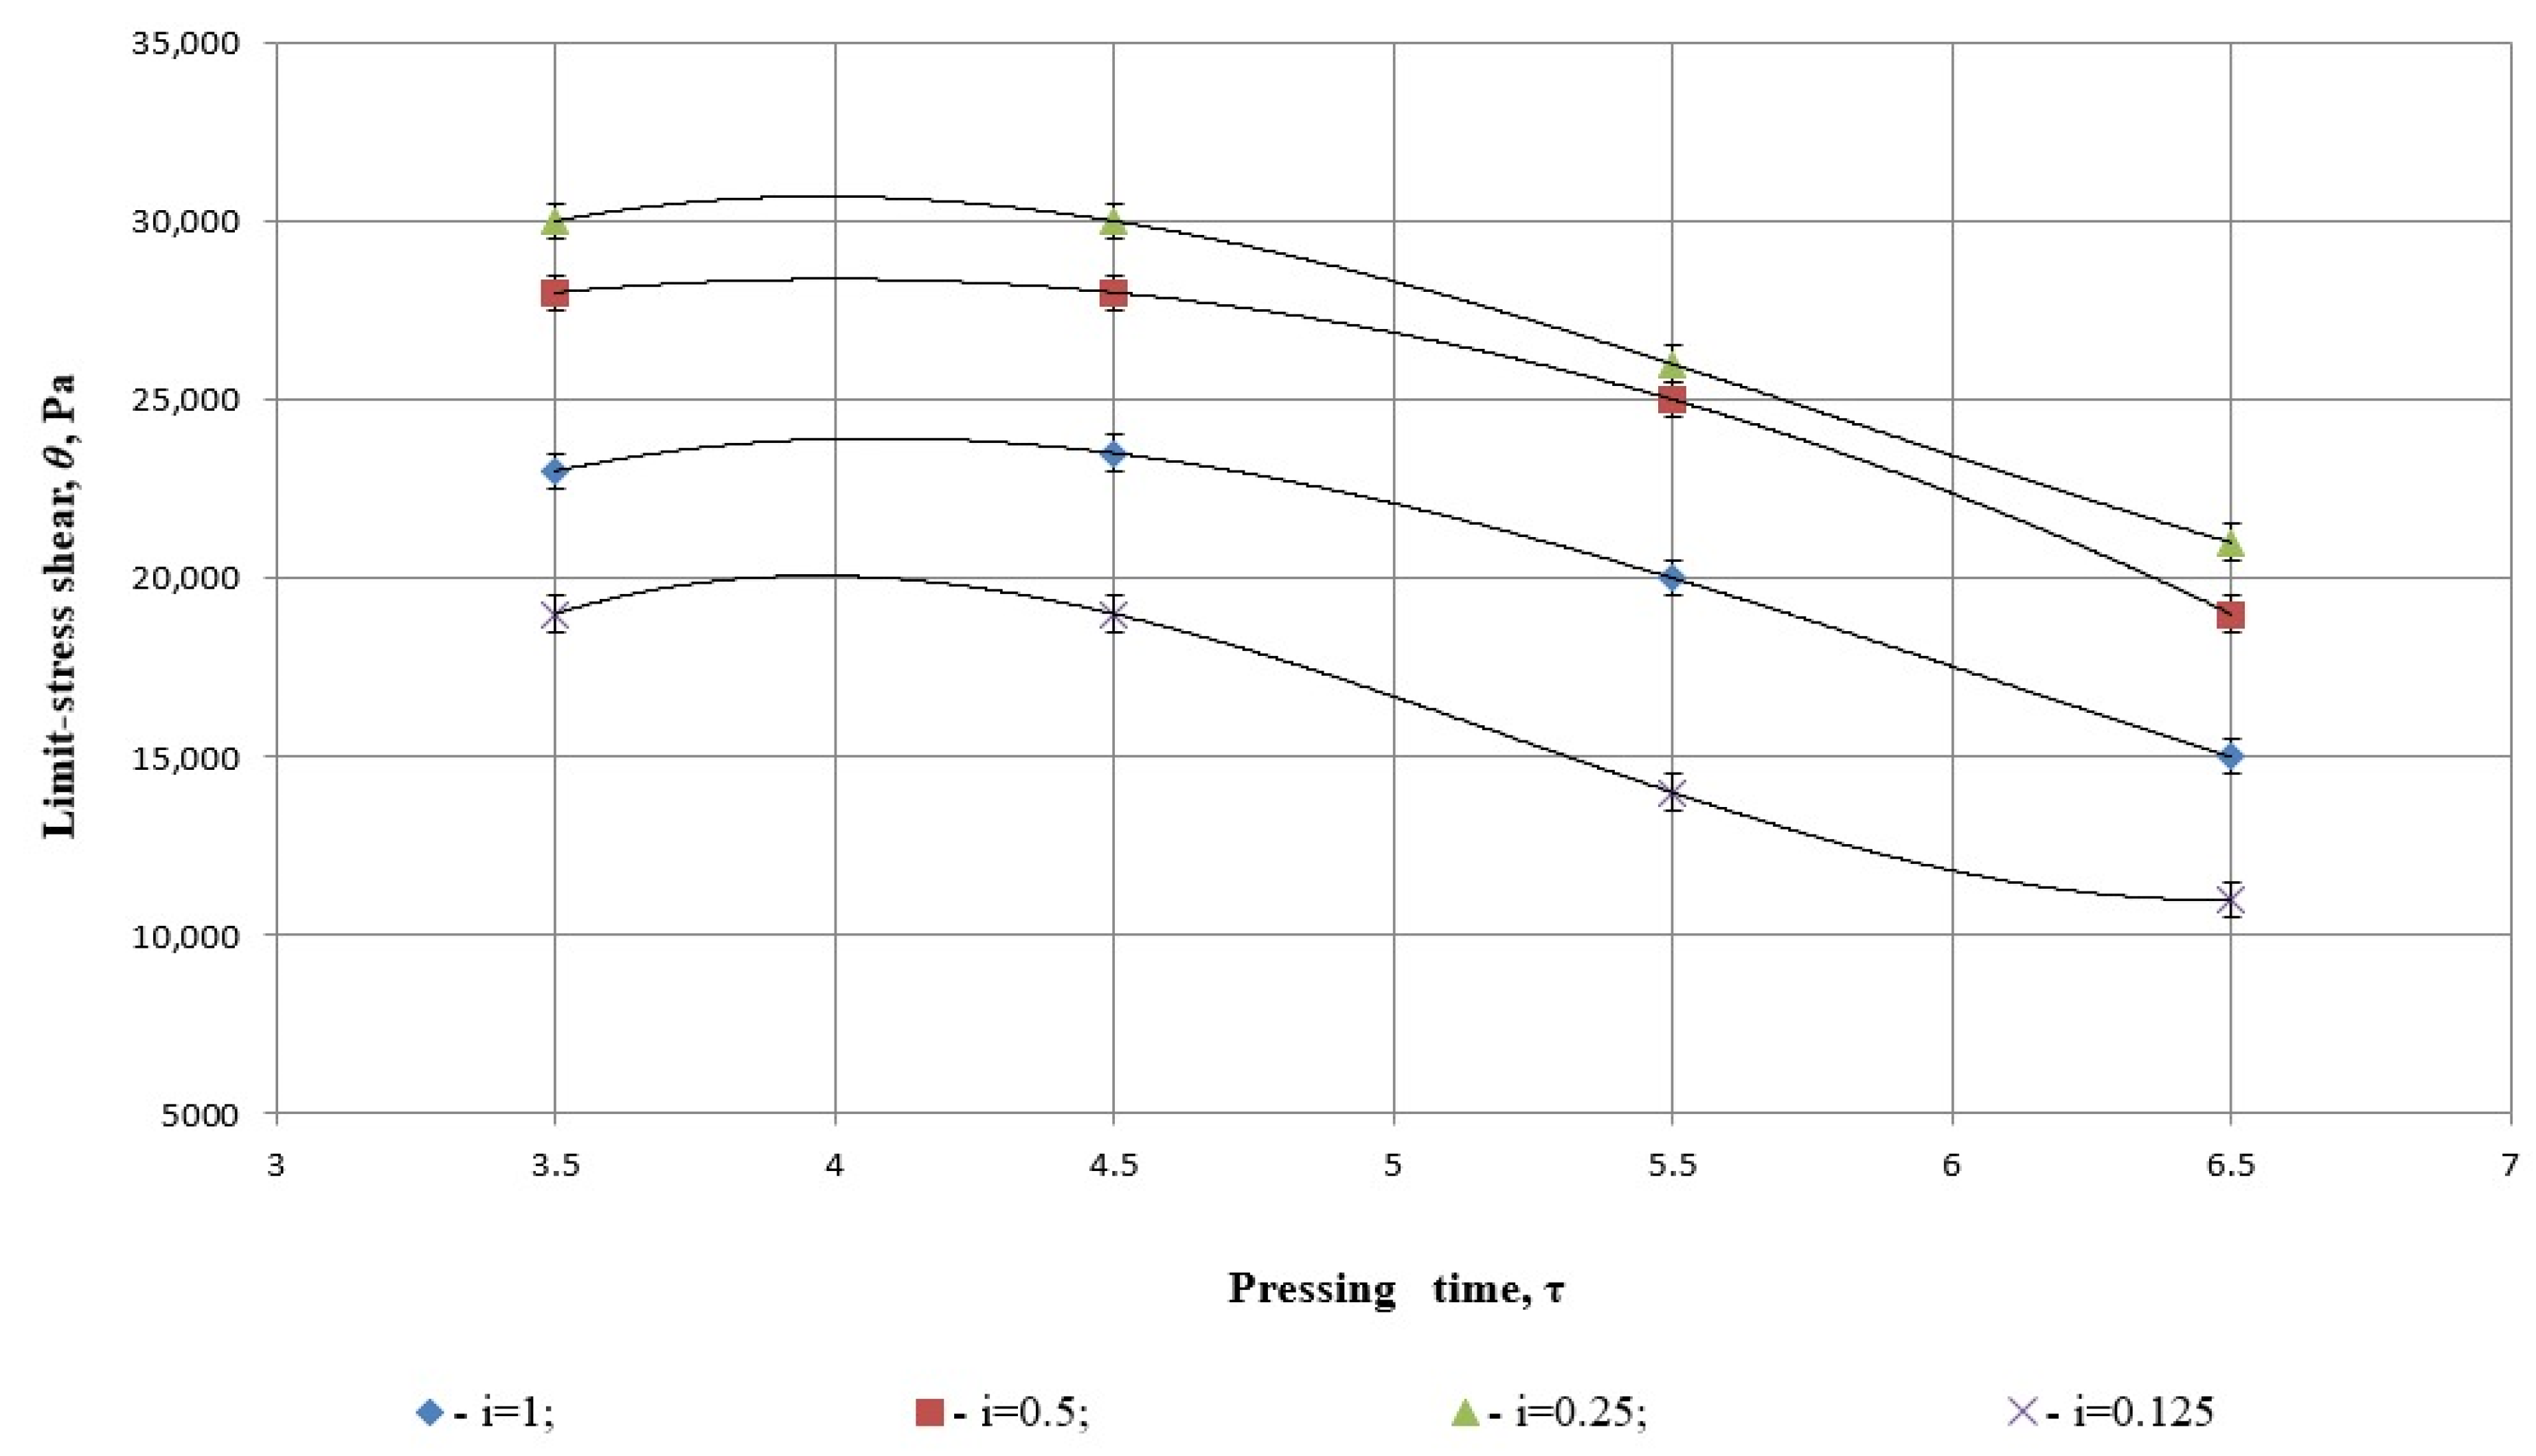
The study of the structural and mechanical properties of safflower cake during pressing highlights the importance of yield stress. As shown in
Figure 10, the maximum yield stress was observed at a degree of grinding of
and a pressing time of
s. This change can be attributed to the low residual fat content in the cake under these conditions, reflecting the optimal balance between grinding and pressing parameters.
It is important to note that, in addition to the liquid fraction, yield stress values are potentially influenced by temperature differences. However, the experimental results did not establish a significant correlation between temperature variation and yield stress, as indicated in the referenced figure.
Figure 10 illustrates the relationship between pressing time (
τ) and limit shear stress (
θ, Pa) of safflower press cake under varying degrees of grinding
i. Each dataset is modeled using a third-degree polynomial regression, and the strength of fit is evaluated using the coefficient of determination
R2 (
Table 5).
All models presented in
Figure 10 report a coefficient of determination
R2 = 1.
This means that each regression curve fits the corresponding data perfectly, with 100% of the variation in shear stress explained by the model. While mathematically ideal, this may reflect interpolation over a small dataset and should be interpreted with care in predictive applications.
This model represents the highest limit shear stress across all pressing times. The curve has a concave shape, peaking at moderate pressing durations and slightly decreasing thereafter. The perfect R2 confirms a precise mathematical fit, and the behavior likely corresponds to an optimally compacted cake structure that weakens only slightly over time.
This curve is relatively flat, indicating that the shear stress remains mechanically stable over time at this degree of grinding. The perfect fit suggests high consistency in material behavior. The peak value is slightly lower than for i = 0.25, which aligns with slightly reduced structural compactness.
This model reflects lower shear strength, likely due to insufficient seed breakdown in whole (unmilled) material. The polynomial shows a more pronounced decline in stress over time, likely due to internal voids and low cohesion. Despite this, the model still captures the trend with complete precision.
Although the statistical fit is again perfect, this curve exhibits the most dramatic decline in shear stress as pressing time increases. This strongly suggests that over-grinding compromises the structural integrity of the press cake. The initial high stress may result from early compaction, followed by weakening due to collapse of microchannels or excessive fragmentation.
The statistical analysis of
Figure 10 reveals that the cubic polynomial regressions used to model the relationship between pressing time and the limit shear stress of safflower press cake exhibit a perfect fit across all degrees of grinding, with each model achieving a coefficient of determination
R2 = 1. This indicates that the mathematical models fully capture the variability in the data, reflecting highly consistent experimental conditions. Among the variants, the shear stress reaches its maximum values for moderately ground material (
i = 0.25), suggesting optimal structural cohesion, while both over-ground (
i = 0.125) and unground seeds (
i = 1) display significantly lower and less stable mechanical resistance over time. The steep decline in shear stress for the finest degree of grinding further suggests a weakening of the internal cake structure due to excessive particle breakdown, confirming that moderate grinding provides the most mechanically resilient pressing conditions.
As illustrated in
Figure 10, the yield stress (
τ) is influenced by both the fat content and the temperature of the safflower cake. However, as oil is separated during the pressing process, the dependence of yield stress on cake temperature diminishes.
In the experimental study, safflower grains underwent heat treatment within an effective temperature range of K, factoring in the additional temperature increase caused by internal friction within the working components during the pressing process.
Figure 11 highlights that variations in cake temperature during pressing are primarily influenced by the separation of the liquid fraction and the pressing time. A lower rotation speed of the pressing screw intensifies the temperature’s effect on the liquid fraction separation while reducing its dependence on pressing time.
Figure 11 presents the relationship between pressing time (
τ, in minutes) and the temperature of safflower cake (
T, in Kelvin) across different degrees of grinding,
i = 1, 0.5, 0.25, 0.125. As in the previous figures, each dataset is fitted using a cubic polynomial regression, and the fit quality is assessed by the coefficient of determination
R2, which equals 1.000 for all cases (
Table 6).
All models exhibit a coefficient of determination R2 = 1, indicating a perfect statistical fit to the measured data points. This suggests that the polynomial regressions explain 100% of the variability in temperature for each degree of grinding, with no residual error.
The temperature curve shows a slight peak and then a gradual decrease with longer pressing times. The low magnitude of coefficients indicates mild nonlinearity. The perfect fit means this model passes precisely through all observed data points and captures the nuanced thermal response of moderately ground material.
This model also reflects a small thermal curvature, with slightly lower maximum temperature than for i = 0.25. The curve is nearly parallel in shape, suggesting similar thermal dynamics but at a marginally reduced energy dissipation. Again, the R2 = 1 confirms perfect mathematical alignment.
Structurally identical to the model for i = 0.5, but with a lower intercept. The regression perfectly captures the more modest rise and decline in temperature for whole seeds, possibly due to lower heat generation from reduced internal friction or compaction resistance.
The negative sign on the cubic and quadratic terms indicates a mirror curvature compared to other curves. This model suggests a steeper and more linear-like temperature decrease with pressing time, likely due to over-grinding, which diminishes internal structural resistance and reduces internal heat buildup. Despite this behavioral deviation, the model maintains perfect fidelity to the experimental data.
Statistical fit of
Figure 11 is in line with maintaining that cubic re-gradients models are best at defining the press time vs. safflower cake temperature relation for each degree of grinding on the premise of assuming a determination coefficient
R2 = 1 in each case. The ideal fit guarantees that models account for all variations of temperature across the range of measurement, which is characteristic of very replicable experimental data. The trends with the measurements indicate that moderately ground material (
i = 0.25 and 0.5) is warmest, with a consistent decrease as pressing advances, perhaps due to the balance between thermal dissipation and internal friction. Highly ground material (
i = 0.125), on the other hand, indicates a consistent decrease in temperature, which suggests that over-grinding reduces internal resistance and inhibits heat formation during pressing. These trends, well represented by the regressions, show that the degree of grinding determines the thermal response of the pressed material.
As shown in
Figure 11, the experimental results reveal that changes in both pressure and power are influenced by the same set of factors.
These findings align closely with the study by Abdilova et al. (2023) [
17], which examined temperature variations during the pressing of sunflower seeds at different screw speeds. At a screw speed of 30 rpm, the cake temperature ranged from 93 to 106 °C. Increasing the speed to 120 rpm resulted in temperatures between 95 and 107 °C, while at 250 rpm, the temperature reached 108 °C.
3.5. Fatty Acid Composition of Safflower Oil
The fatty acid composition is a key determinant of the quality and nutritional value of safflower oil.
Table 9 presents a comparative analysis of the fatty acid composition of safflower oil extracted using the existing screw press and the experimental press, which integrates grinding and pressing into a single process. This comparison highlights the impact of the modernized extraction method on the fatty acid profile of the oil.
The outcomes in
Table 9 and
Table 10 demonstrate that processing using the experimental screw press leads to a stunning surge in the nutritional quality of safflower oil, particularly the content of fatty acids. Most strikingly of all, the level of α-linolenic acid (C
18:3), an extremely valued omega-3 fatty acid, surges from 0.1 ± 0.062% in the control press to 1.3 ± 0.225% with the experimental process. This is more than a tenfold increase and may be due to improved extraction conditions that favor or preserve the liberation of more susceptible, unsaturated fatty acids. Additionally, oleic acid (C
18:1) with its positive cardiovascular effects, is raised from 6.3 ± 0.506% to 7.9 ± 0.568%. All these observations show that experimental technology not only preserves but also enhances the functional and health-imparting components of safflower oil.
It is evident in the broader and more varied composition of the identified unsaturated fatty acids of the oil from the experimental screw press. Eicosenoic acids (Ʃ C20:1) and erucic acids (Ʃ C22:1) content, though low, reflect a rise in the experimental change, from 0.2 ± 0.089% to 0.25 ± 0.101% and from 1.5 ± 0.256% to 2.7 ± 0.327%, respectively. These findings indicate that the experimental press is capable of inflicting less thermal or oxidative stress on the oil matrix and hence recover or extract fewer exotic long-chain fatty acids better. Interestingly, while the comparatively higher total unsaturated acid yields, saturation of fatty acids such as palmitic acid (C16:0) and arachidic acid (C20:0) also show marginal increases, perhaps due to the overall higher recovery of the oil. Overall, this is a step towards the betterment of the technology that can facilitate more capture of the indigenous lipid profile native to safflower seeds.
The analysis of the fatty acid composition of safflower oil reveals notable changes in various components after processing with the modernized screw press. Among the saturated fatty acids, C18:0 (stearic acid) was present at 2.1% in the safflower oil processed by the existing screw press, which decreased slightly to 2% after processing with the modernized press.
An increase in the content of several fatty acids was observed, including C16:1 (palmitoleic acid) to 5%, C20:0 (arachidic acid) to 0.9%, C18:1 (oleic acid) to 7.9%, C22:0 (behenic acid) to 0.28%, Ʃ C20:1 (eicosenoic acids) to 0.25%, and Ʃ C22:1 (erucic acids) to 2.7%. Notably, the unsaturated fatty acids C18:2 (linoleic acid) and C18:3 (α-linolenic acid) increased to 85.3% and 1.3%, respectively.
The obtained data align closely with existing literature [
49,
50], which underscores the reliability and accuracy of the conducted studies. These results further confirm the ability of the modernized press to enhance the unsaturated fatty acid profile of safflower oil, which in turn contributes to its nutritional and functional properties.
Unlike the studies by Kakimov et al. (2024) [
51], which focused primarily on optimizing individual aspects of press equipment, or the work of Iskakov et al. (2023) [
4], which examined the effects of centrifuge design and parameters on safflower oil quality, this research introduces a novel integration of grinding and pressing processes. By combining these two stages within a single piece of equipment, this approach enhances production efficiency, reduces equipment and operational costs, and minimizes processing time.
This paper proposes a resource-efficient technology tailored for small and medium-sized enterprises, where financial and production resources are often limited, focusing on the mathematical modeling of safflower seed pressing and the development of compact production lines. This work presents an innovative, integrated solution.
Comparative studies were conducted to evaluate the physicochemical and fatty acid composition of safflower oil produced using traditional pressing methods versus the newly developed combined-process equipment. The determination of optimal parameters (e.g., pressing time τ = 3.41 and degree of grinding i = 0.25) not only enhances technological efficiency but also improves oil quality by increasing fatty acid content. The results indicate that oil obtained using the developed equipment exhibits an improved fatty acid profile, enhancing its biological value and expanding its potential applications beyond direct consumption to include use in oil-based products. Overall, this study marks a significant advancement in safflower oil production technology. It offers a comprehensive, resource-saving approach that can be readily adopted by small and medium-sized enterprises, enhancing both the competitiveness and quality of the final product.

 ,
, 


