

Current Developments of Analytical Methodologies for Aflatoxins’ Determination in Food during the Last Decade (2013–2022), with a Particular Focus on Nuts and Nut Products
 , , ,
, , ,  and
and 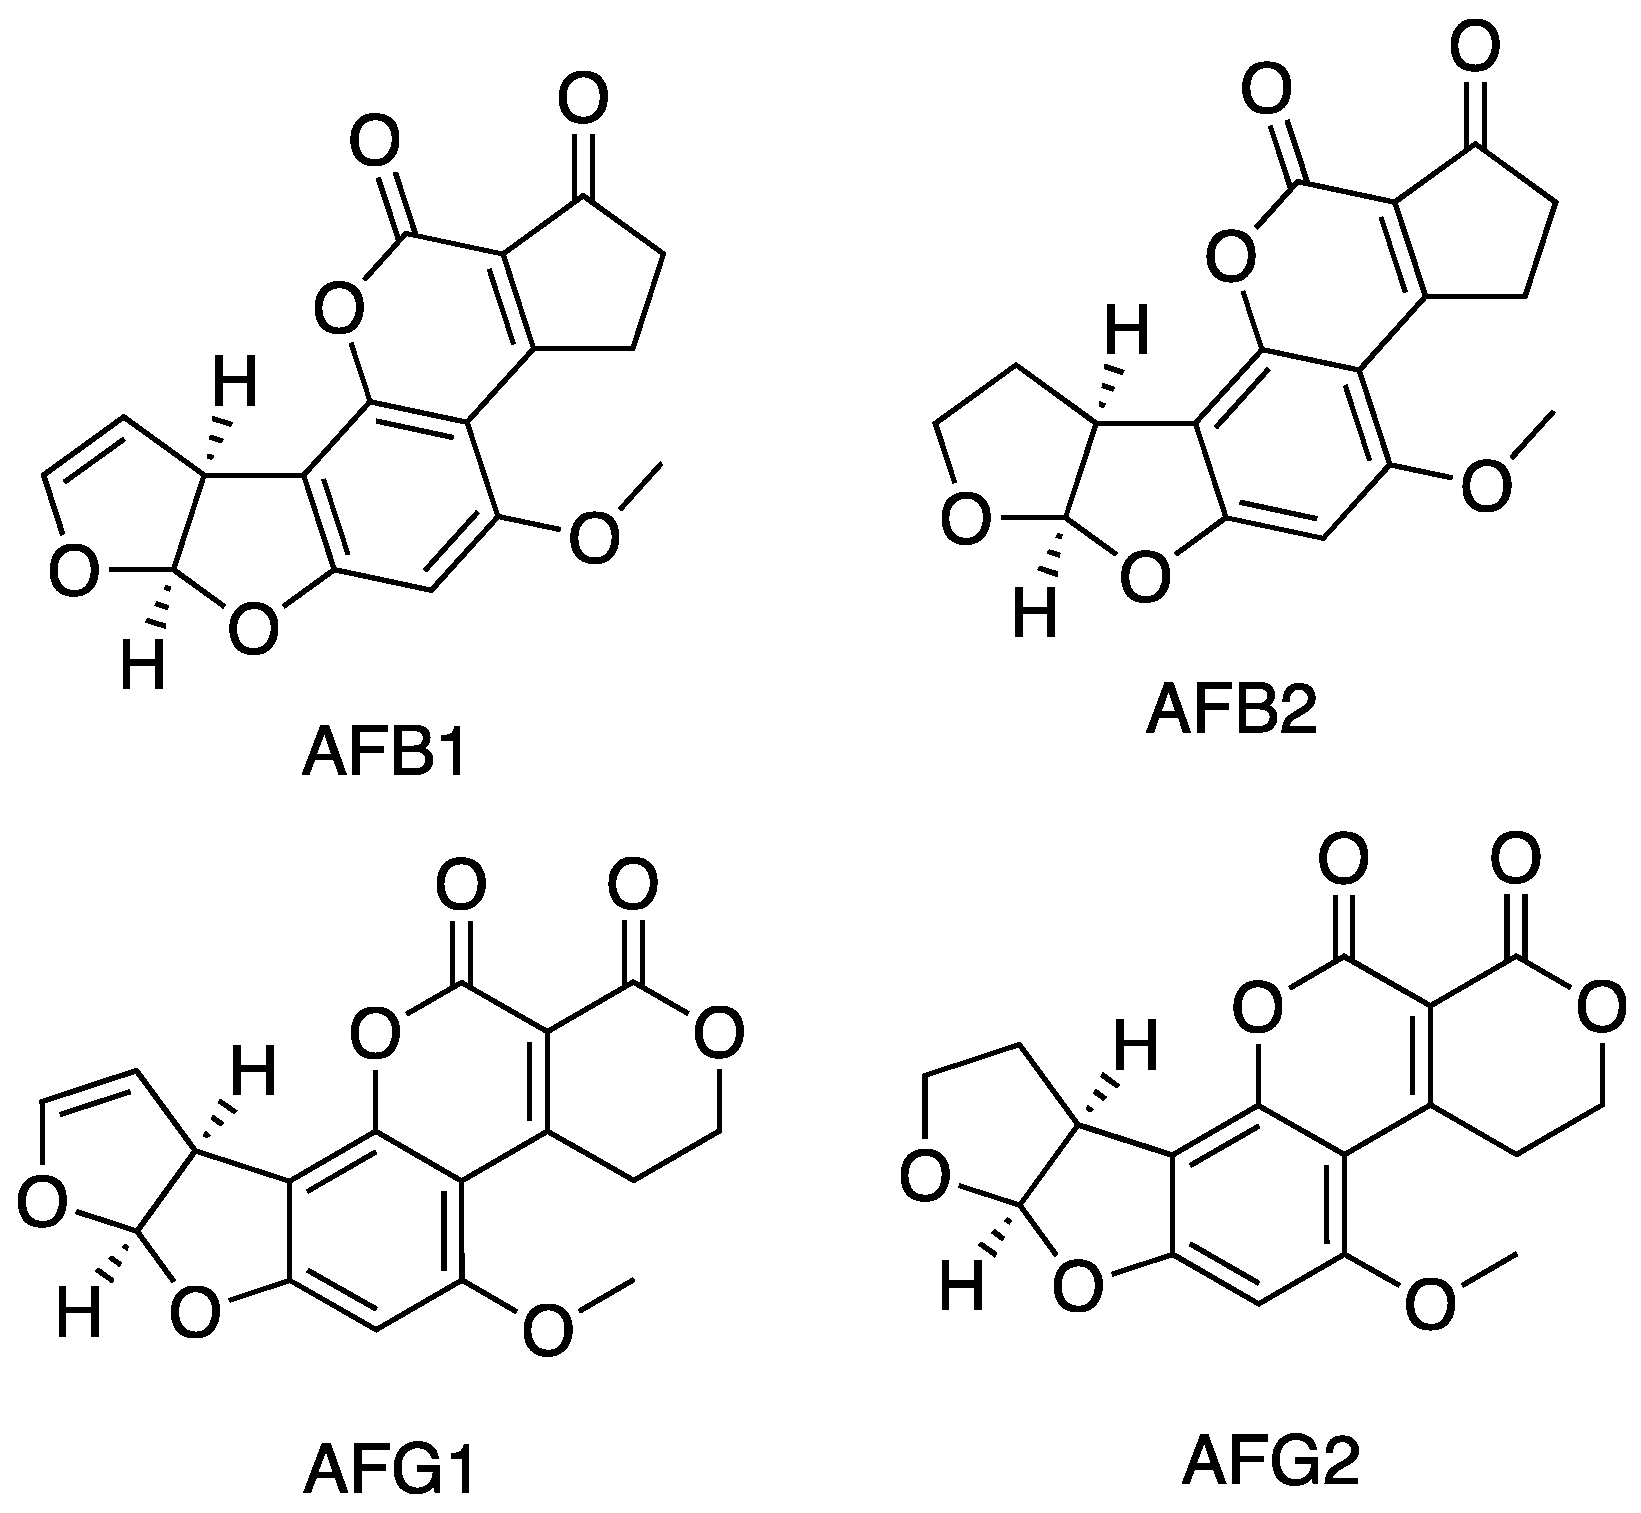
Abstract
1. Introduction
2. Aflatoxin’s General Information
2.1. Formation and Occurrence
2.2. Toxicity and Legislation
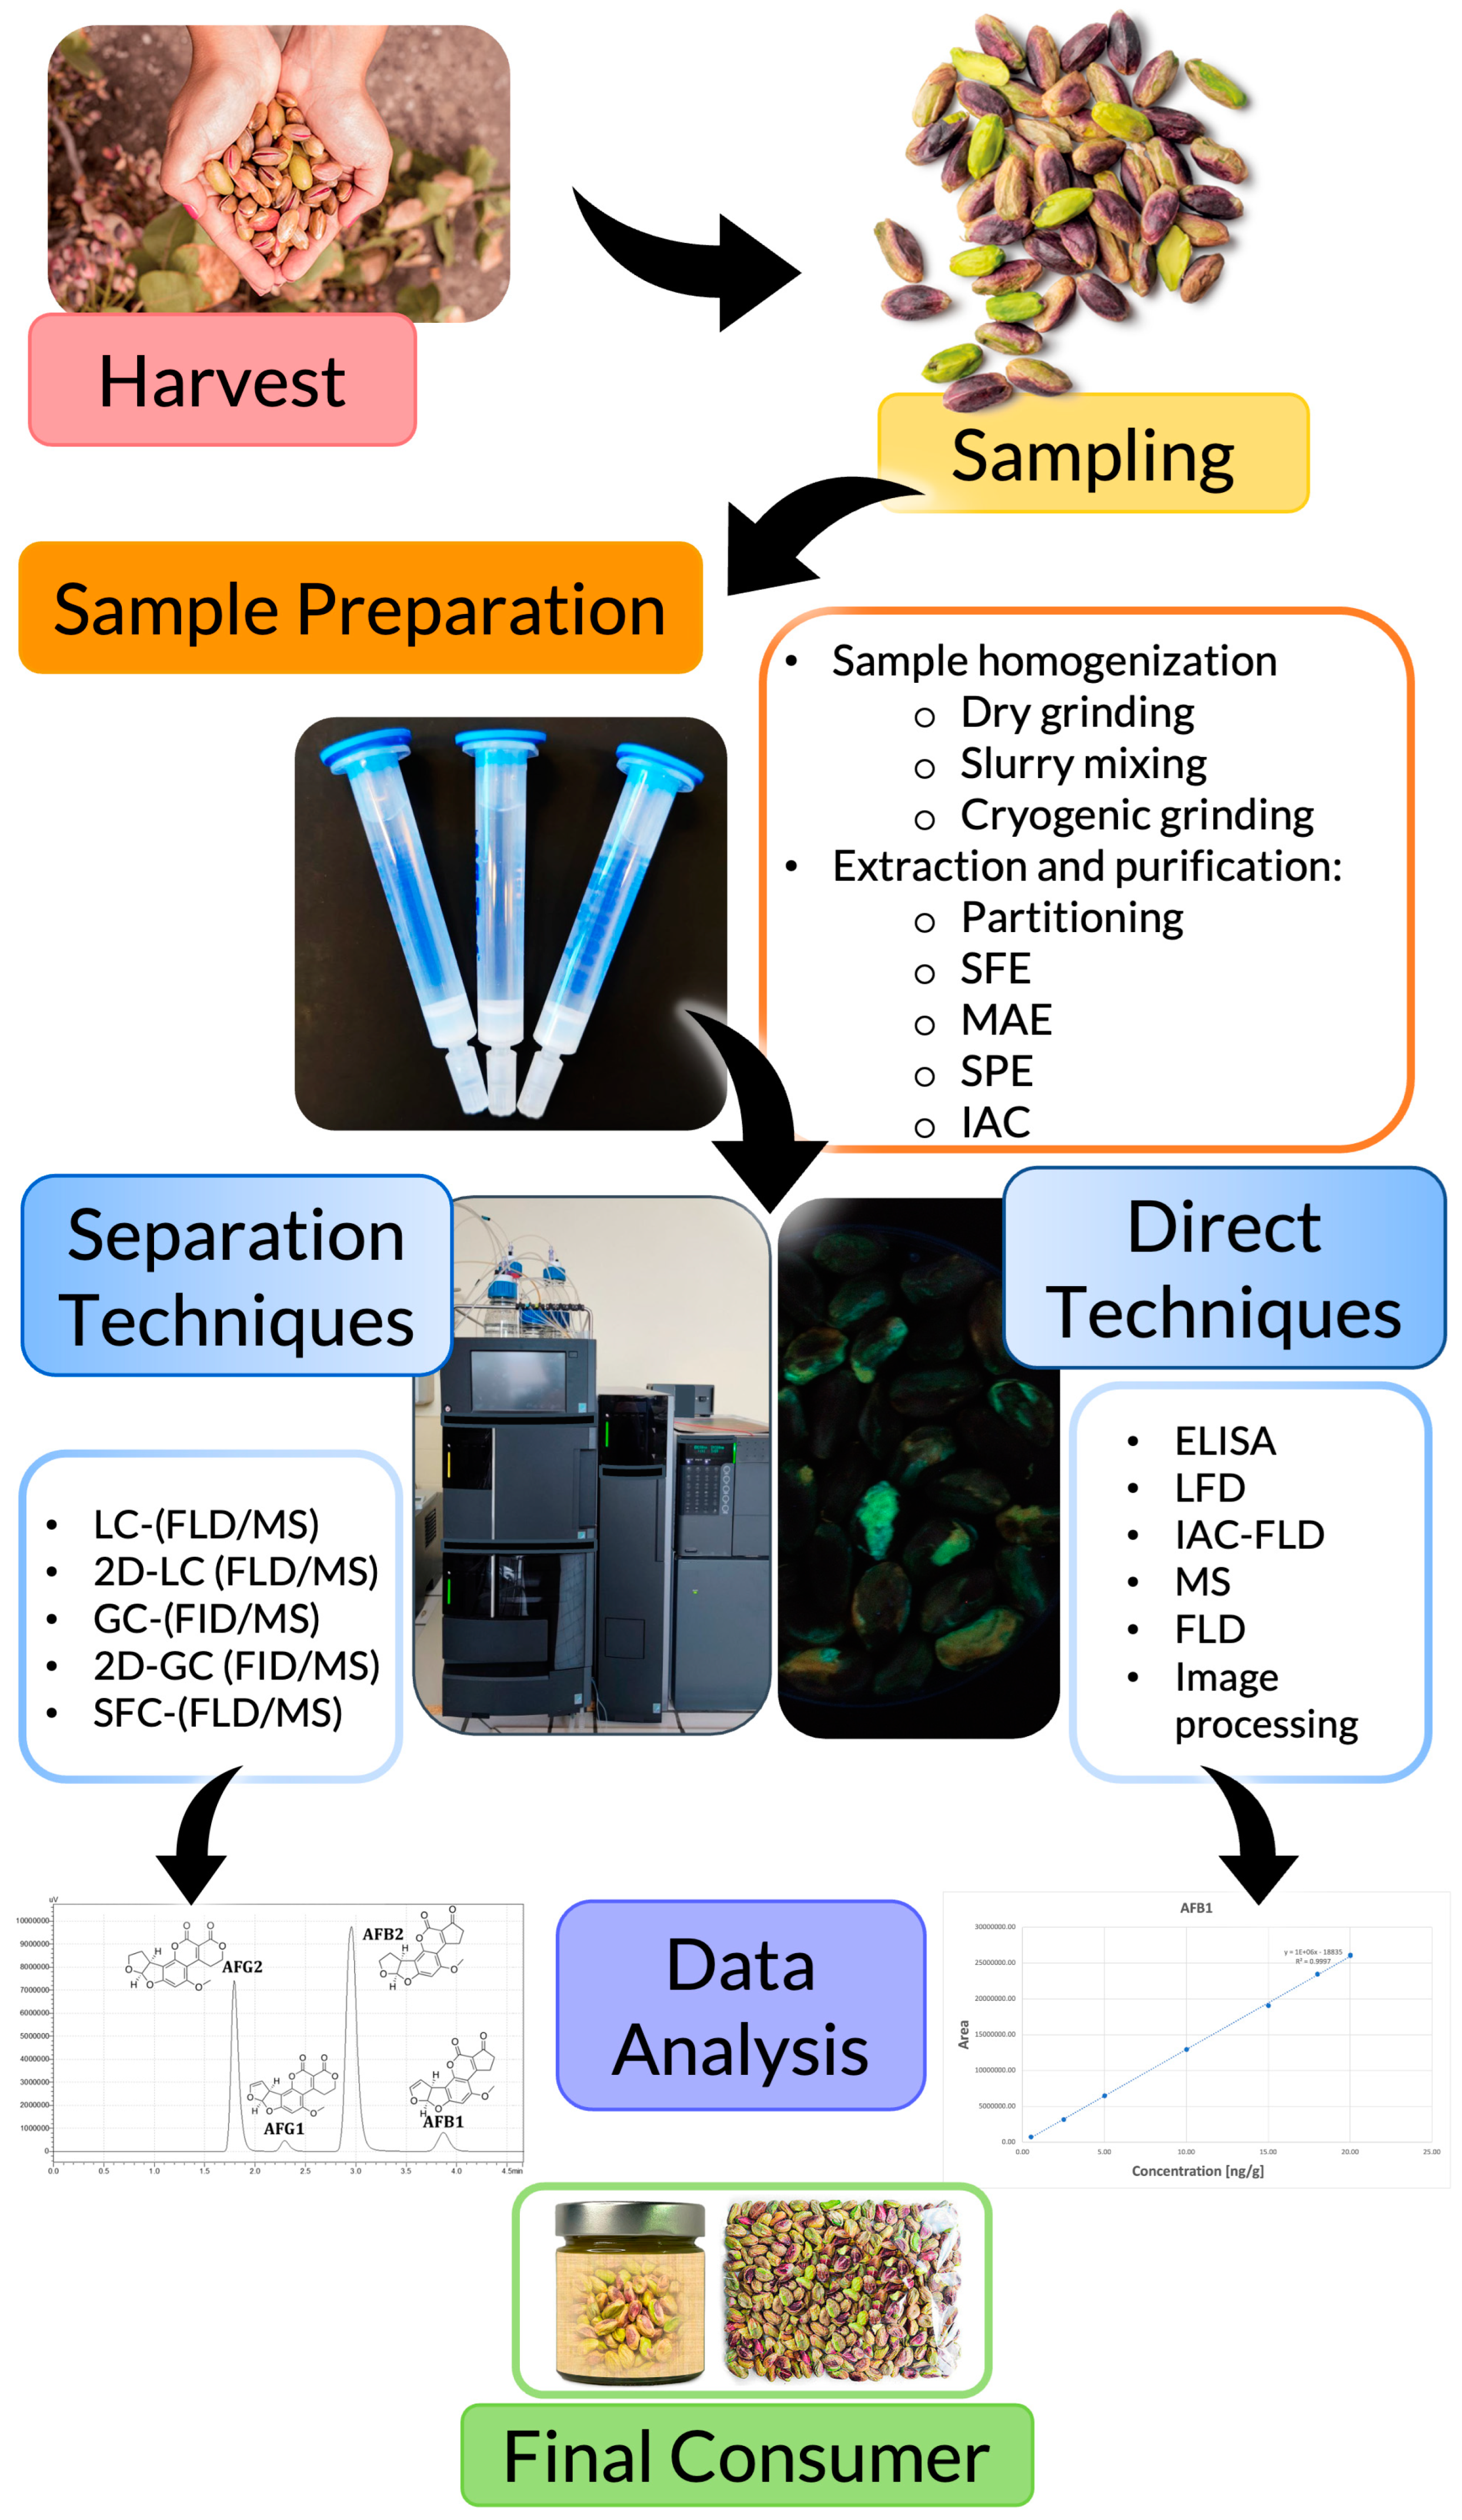
3. Sampling
4. Analytical Methodologies
4.1. Sample Preparation
4.1.1. Sample Homogenization
Dry Grinding
Wet Grinding–Slurry Mixing
Cryogenic Grinding
4.1.2. Extraction and Purification
Partitioning
Supercritical Fluid Extraction (SFE)
Microwave-Assisted Extraction (MAE) and Pressurized Liquid Extraction (PLE)
Solid Phase Extraction
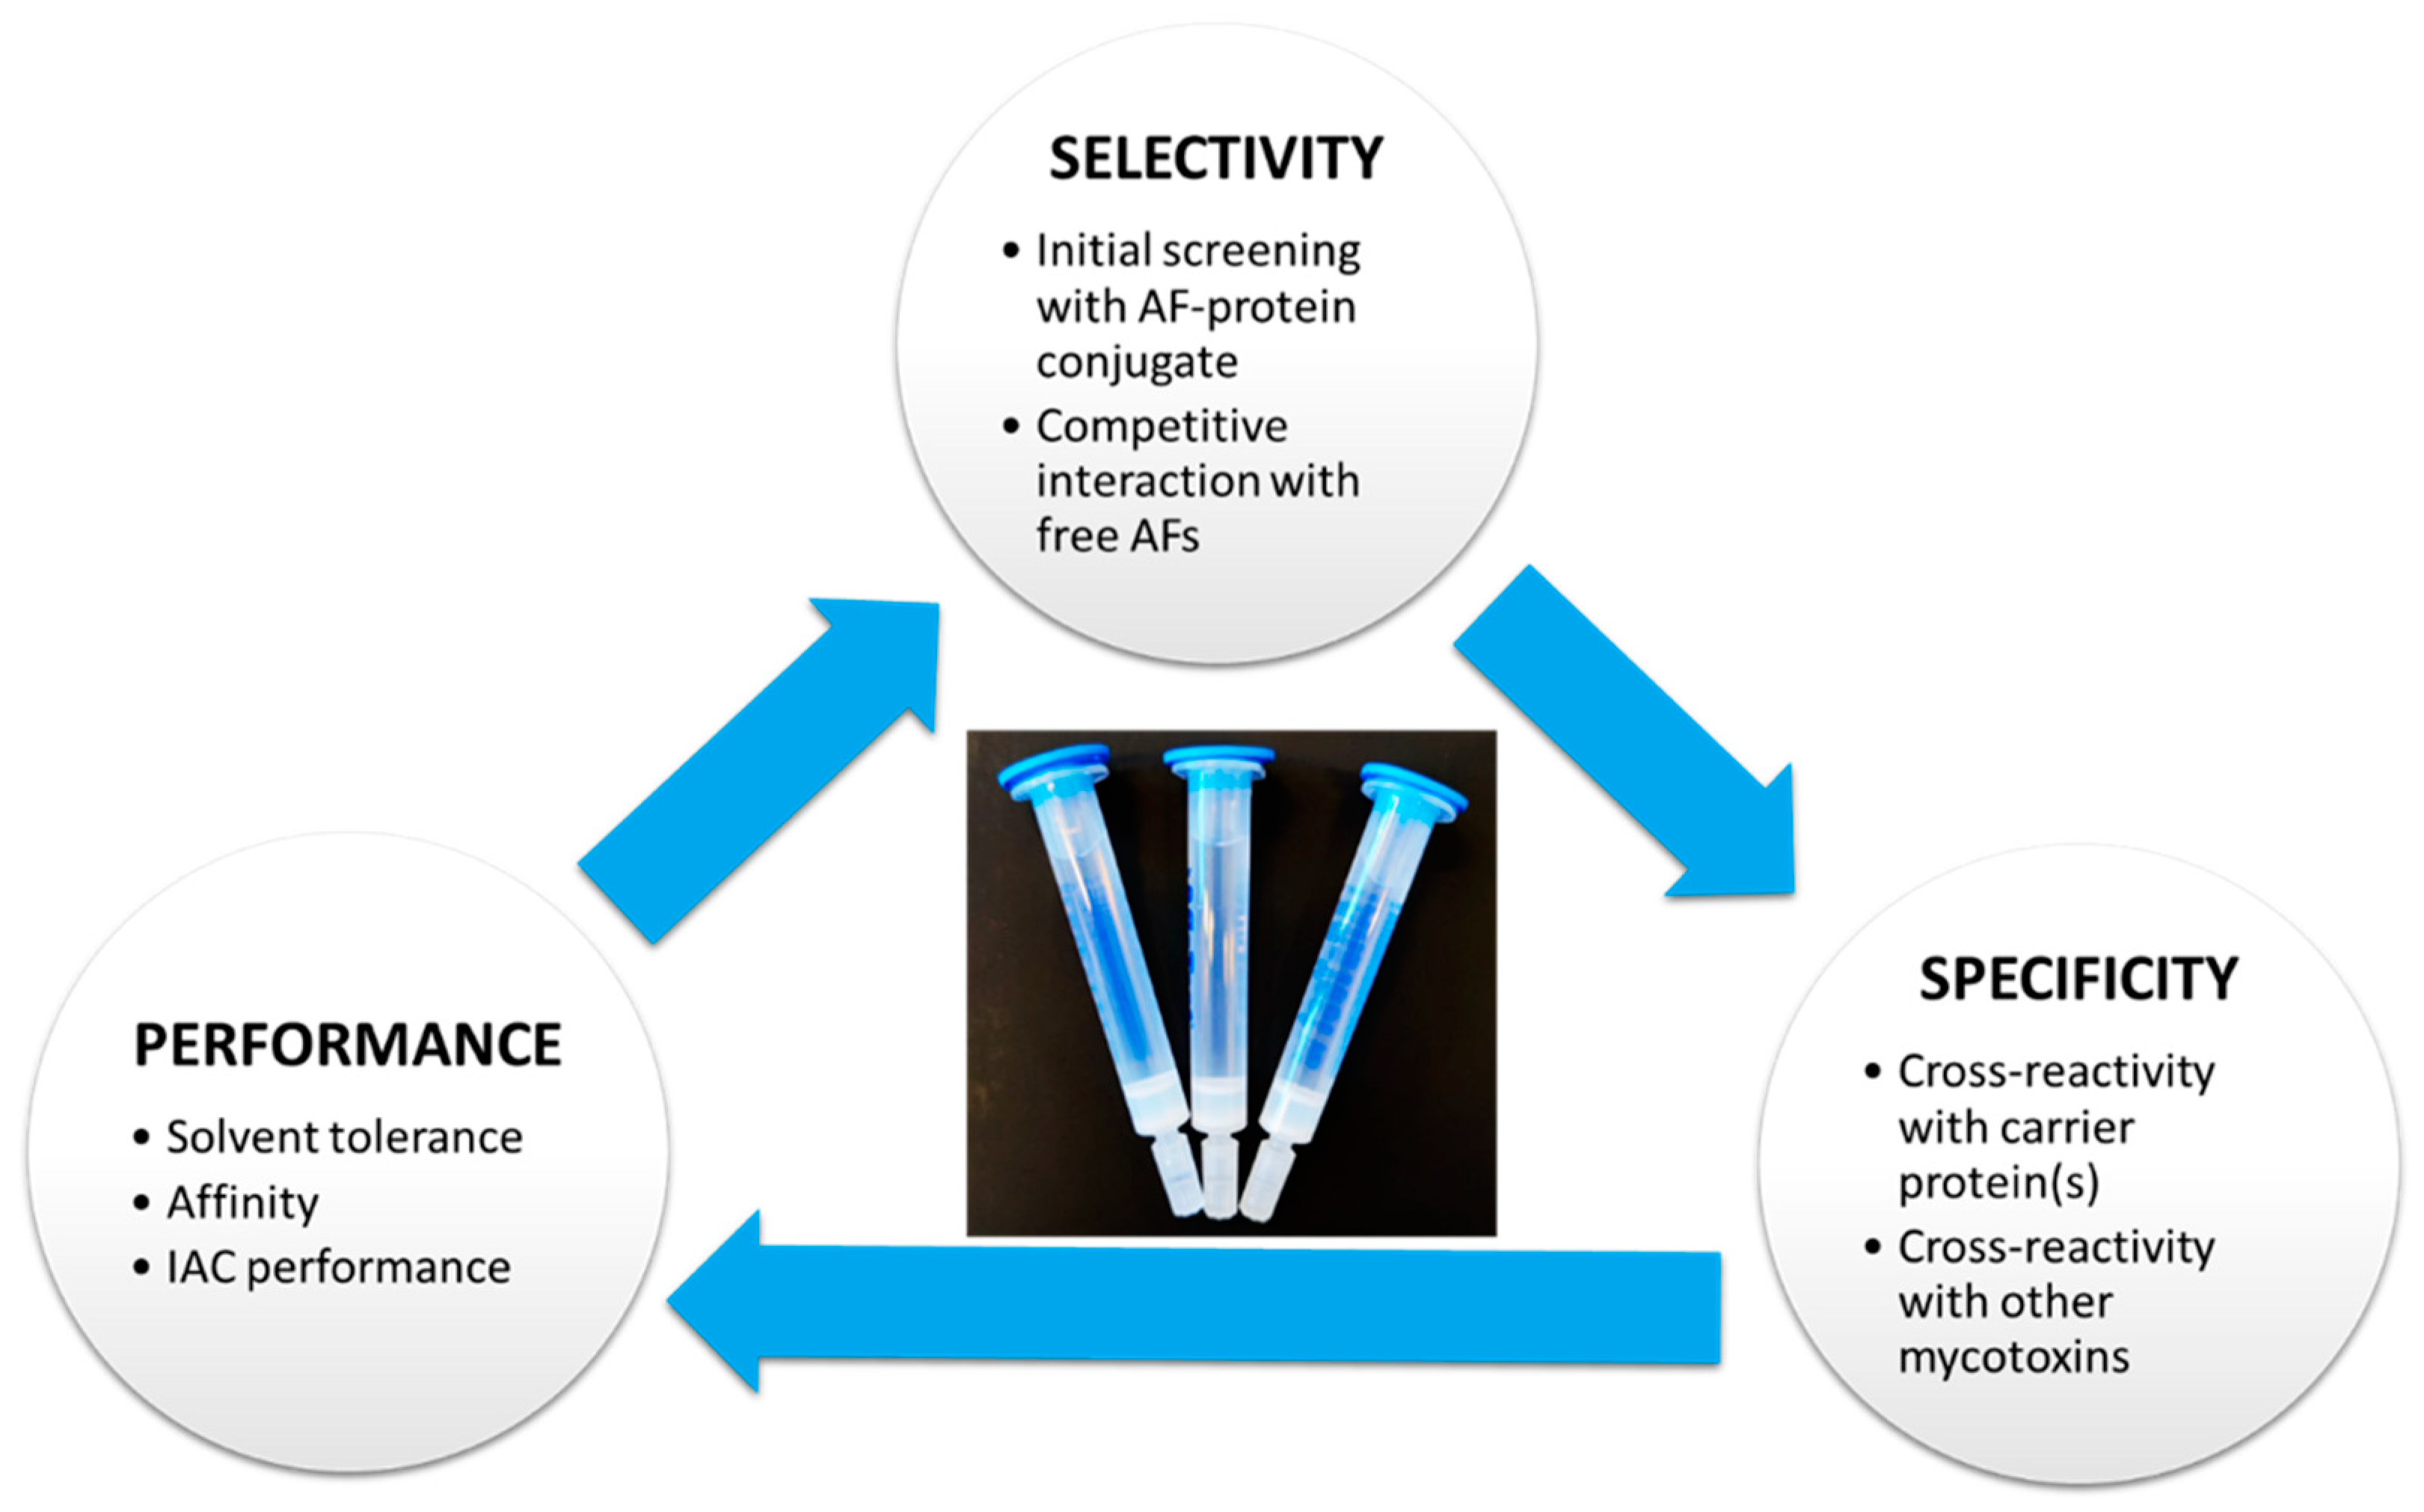
Immunoaffinity Column (IAC)
4.2. Analytical Determination
4.2.1. Indirect Techniques (Separative Techniques)
Liquid Chromatography Coupled to Classic Detectors
AFs Derivatization
- i.
- Iodination was the first post-column derivatization approach implemented back in 1979 when it was noticed that iodination of the double bond of AFB1 and AFG1 provides products with enhanced fluorescence. Although the optimization of this methodology, regarding different parameters such as time of reaction, reaction temperature, iodine reagent flow rates, and iodine concentration, allowed the development of widely accepted post-column derivatization procedures, it has been rarely applied in the last decade, leaving room for other derivatization procedures [51,120].
- ii.
- The bromination approach can be achieved with either pyridinyl hydrobromide perbromide (PBPB) or with an electrochemical cell (KobraCell) where KBr is added to the mobile phase. During the last decade, this procedure has almost replaced the previous one becoming the first choice as a post-column derivatization approach, particularly considering the AFs determination in nut matrices [107,121,122].
- iii.
- Photochemical derivatization is based on the reaction of AFs with the water contained within the mobile phase, thanks to post-column UV irradiation. This derivatization determines the formation of hemiacetals, compounds similar to those obtained by TFA derivatization, showing enhanced fluorescence. Moreover, this approach is free from the use of other chemicals to obtain the desired derivatives [123]. However, no application has been reported in nuts matrices yet. A critical review of the pros and cons of LC-based techniques hyphenated to post-column derivatization approaches have been recently published by Zacharis et al. [123].
Liquid Chromatography Coupled with Mass Spectrometry (LC-MS)
4.2.2. Other Separation Techniques
Multidimensional Liquid Chromatography (2D-LC)
Gas Chromatography (GC)
Supercritical Fluid Chromatography (SFC)
4.2.3. Direct Techniques
Direct MS-Based Techniques
Enzyme-Linked Immunosorbent Assay–ELISA
Lateral Flow Device
Immunoaffinity Column, Direct Fluorescence Measurement
Image Processing
5. Conclusions and Future Perspectives
Author Contributions
Funding
Institutional Review Board Statement
Informed Consent Statement
Data Availability Statement
Conflicts of Interest
References
- Mateus, A.R.S.; Barros, S.; Pena, A.; Silva, A.S. Mycotoxins in Pistachios (Pistacia vera L.): Methods for Determination, Occurrence, Decontamination. Toxins 2021, 13, 682. [Google Scholar] [CrossRef]
- Magan, N. Mycotoxins in Food: Detection and Control; Woodhead Publishing Limited: Sawston, UK, 2004; Volume 40. [Google Scholar]
- Rushing, B.R.; Selim, M.I. Aflatoxin B1: A Review on Metabolism, Toxicity, Occurrence in Food, Occupational Exposure, and Detoxification Methods. Food Chem. Toxicol. 2019, 124, 81–100. [Google Scholar] [CrossRef]
- Khan, R.; Ghazali, F.M.; Mahyudin, N.A.; Samsudin, N.I.P. Aflatoxin Biosynthesis, Genetic Regulation, Toxicity, and Control Strategies: A Review. J. Fungi 2021, 7, 606. [Google Scholar] [CrossRef]
- Alshannaq, A.; Yu, J.H. Occurrence, Toxicity, and Analysis of Major Mycotoxins in Food. Int. J. Environ. Res. Public Health 2017, 14, 632. [Google Scholar] [CrossRef] [PubMed]
- Ostry, V.; Malir, F.; Toman, J.; Grosse, Y. Mycotoxins as Human Carcinogens—The IARC Monographs Classification. Mycotoxin Res. 2017, 33, 65–73. [Google Scholar] [CrossRef] [PubMed]
- Okwara, C.; Afolabi, I.; Ahuekwe, E.; Ali, M.H.; Al-Hamdani, A.A.Y.; Alwan, M.A.; Yu, J.; Hennessy, D.A.; Tack, J.; Wu, F. Climate Change Will Increase Aflatoxin Presence in US Corn. Environ. Res. Lett. 2022, 17, 054017. [Google Scholar] [CrossRef]
- Leggieri, M.C.; Toscano, P.; Battilani, P. Predicted Aflatoxin B1 Increase in Europe Due to Climate Change: Actions and Reactions at Global Level. Toxins 2021, 13, 292. [Google Scholar] [CrossRef] [PubMed]
- Medina, A.; Rodríguez, A.; Magan, N. Effect of Climate Change on Aspergillus Flavus and Aflatoxin B1 Production. Front. Microbiol. 2014, 5, 348. [Google Scholar] [CrossRef]
- Meneely, J.P.; Kolawole, O.; Haughey, S.A.; Miller, S.J.; Krska, R.; Elliott, C.T. The Challenge of Global Aflatoxins Legislation with a Focus on Peanuts and Peanut Products: A Systematic Review. Expo. Health 2022. [Google Scholar] [CrossRef]
- EUR-Lex—32006R1881—EN—EUR-Lex. Available online: https://eur-lex.europa.eu/eli/reg/2006/1881/oj (accessed on 27 August 2022).
- ECFR:: 7 CFR Part 996—Minimum Quality and Handling Standards for Domestic and Imported Peanuts Marketed in the United States. Available online: https://www.ecfr.gov/current/title-7/subtitle-B/chapter-IX/part-996 (accessed on 24 October 2022).
- ECFR:: 7 CFR Part 999—Specialty Crops; Import Regulations. Available online: https://www.ecfr.gov/current/title-7/subtitle-B/chapter-IX/part-999#999.600 (accessed on 24 October 2022).
- Alshannaq, A.; Yu, J.H. Analysis of E.U. Rapid Alert System (RASFF) Notifications for Aflatoxins in Exported U.S. Food and Feed Products for 2010-2019. Toxins 2021, 13, 90. [Google Scholar] [CrossRef]
- Pickova, D.; Ostry, V.; Toman, J.; Malir, F. Aflatoxins: History, Significant Milestones, Recent Data on Their Toxicity and Ways to Mitigation. Toxins 2021, 13, 399. [Google Scholar] [CrossRef] [PubMed]
- Anukul, N.; Vangnai, K.; Mahakarnchandkul, W. Significance of Regulation Limits in Mycotoxin Contamination in Asia and Risk Management Programs at the National Level. J. Food Drug. Anal. 2013, 21, 227–241. [Google Scholar] [CrossRef]
- Miraglia, M.; de Santis, B.; Minardi, V.; Debegnach, F.; Brera, C. The Role of Sampling in Mycotoxin Contamination: An Holistic View. Food Addit. Contam. 2006, 22, 31–36. [Google Scholar] [CrossRef]
- EUR-Lex—32006R0401—EN—EUR-Lex. Available online: https://eur-lex.europa.eu/eli/reg/2006/401/oj (accessed on 27 August 2022).
- Cucullu, A.F.; Lee, L.S.; Mayne, R.Y.; Goldblatt, L.A. Determination of Aflatoxins in Individual Peanuts and Peanut Sections. J. Am. Oil. Chem. Soc. 1966, 43, 89–92. [Google Scholar] [CrossRef]
- El-Sayed, R.A.; Jebur, A.B.; Kang, W.; El-Demerdash, F.M. An Overview on the Major Mycotoxins in Food Products: Characteristics, Toxicity, and Analysis. J. Future Foods 2022, 2, 91–102. [Google Scholar] [CrossRef]
- Turner, N.W.; Subrahmanyam, S.; Piletsky, S.A. Analytical Methods for Determination of Mycotoxins: A Review. Anal. Chim. Acta 2009, 632, 168–180. [Google Scholar] [CrossRef]
- Pitt, J.I.; Miller, J.D. A Concise History of Mycotoxin Research. J. Agric. Food Chem. 2017, 65, 7021–7033. [Google Scholar] [CrossRef] [PubMed]
- Valencia-Quintana, R.; Milić, M.; Jakšić, D.; Klarić, M.Š.; Tenorio-Arvide, M.G.; Pérez-Flores, G.A.; Bonassi, S.; Sánchez-Alarcón, J. Environment Changes, Aflatoxins, and Health Issues, a Review. Int. J. Environ. Res. Public Health 2020, 17, 7850. [Google Scholar] [CrossRef]
- Frisvad, J.; Hubka, V.; Ezekiel, C.; Hong, S.-B.; Novakova, A.; Chen, A.; Arzanlou, M.; Larsen, T.; Sklenář, F.; Mahakarnchanakul, W.; et al. Taxonomy of Aspergillus Section Flavi and Their Production of Aflatoxins, Ochratoxins and Other Mycotoxins. Stud. Mycol. 2019, 93, 1. [Google Scholar] [CrossRef] [PubMed]
- Bennett, J.; Bhatnagar, D.; Chang, P. The Molecular Genetics of Aflatoxin Biosynthesis. In The Genus Aspergillus; Springer: New York, NY, USA, 1994; pp. 51–58. ISBN 978-1-4899-0983-1. [Google Scholar]
- Moss, M. Risk Assessment of Aflatoxins in Foodstuffs. Int. Biodeterior. Biodegrad. 2002, 50, 137–142. [Google Scholar] [CrossRef]
- Righetti, L.; Rolli, E.; Dellafiora, L.; Galaverna, G.; Suman, M.; Bruni, R.; Dall’Asta, C. Thinking Out of the Box: On the Ability of Zea mays L. to Biotrasform Aflatoxin B1 Into Its Modified Forms. Front. Plant Sci. 2021, 11, 2081. [Google Scholar] [CrossRef]
- Gallo, P.; Imbimbo, S.; Alvino, S.; Castellano, V.; Arace, O.; Soprano, V.; Esposito, M.; Serpe, F.P.; Sansone, D. Contamination by Aflatoxins B/G in Food and Commodities Imported in Southern Italy from 2017 to 2020: A Risk-Based Evaluation. Toxins 2021, 13, 368. [Google Scholar] [CrossRef]
- Carla, G.; Souza, S.; Feddern, V.; Heidtmann, R.; dos Santos Hackbart, H.C.; de Souza, M.M.; dos Santos Oliveira, M.; Garda-Buffon, J.; Gilberto, E.; Badiale-Furlong, E. Aflatoxins: Contamination, Analysis and Control. Aflatoxins-Biochem. Mol. Biol. 2011, 418. [Google Scholar] [CrossRef]
- Feddern, V.; Dors, G.C.; Tavernari, F.D.C.; Mazzuco, H.; Cunha, A.; Krabbe, E.L.; Scheuermann, G.N. Aflatoxins Importance on Animal Nutrition. Aflatoxins-Recent Adv. Future Prospect. 2013, 177–182. [Google Scholar] [CrossRef]
- Waliyar, F.; Osiru, M.; Ntare, B.R.; Vijay Krishna Kumar, K.; Sudini, H.; Traore, A.; Diarra, B. Post-Harvest Management of Aflatoxin Contamination in Groundnut. World Mycotoxin J. 2015, 8, 245–252. [Google Scholar] [CrossRef]
- Jallow, A.; Xie, H.; Tang, X.; Qi, Z.; Li, P. Worldwide Aflatoxin Contamination of Agricultural Products and Foods: From Occurrence to Control. Compr. Rev. Food Sci. Food Saf. 2021, 20, 2332–2381. [Google Scholar] [CrossRef]
- International Agency for Research on Cancer (IARC). Chemical Agents and Related Occupations, A Review of Human Carcinogens. IARC Monogr. 2012, 100F, 225–244. [Google Scholar]
- Schrenk, D.; Bignami, M.; Bodin, L.; Chipman, J.K.; del Mazo, J.; Grasl-Kraupp, B.; Hogstrand, C.; Hoogenboom, L.; Leblanc, J.C.; Nebbia, C.S.; et al. Risk Assessment of Aflatoxins in Food. EFSA J. 2020, 18, e06040. [Google Scholar] [CrossRef]
- Marchese, S.; Polo, A.; Ariano, A.; Velotto, S.; Costantini, S.; Severino, L. Aflatoxin B1 and M1: Biological Properties and Their Involvement in Cancer Development. Toxins 2018, 10, 214. [Google Scholar] [CrossRef]
- Evaluation of Certain Contaminants in Food: Eighty-Third Report of the Joint FAO/WHO Expert Committee on Food Additives. Available online: https://www.who.int/publications/i/item/9789241210027 (accessed on 31 October 2022).
- EUR-Lex—32010R0165—EN—EUR-Lex. Available online: https://eur-lex.europa.eu/eli/reg/2010/165/oj (accessed on 27 August 2022).
- EUR-Lex—32012R1058—EN—EUR-Lex. Available online: https://eur-lex.europa.eu/eli/reg/2012/1058/oj (accessed on 27 August 2022).
- Aflatoxins in Food | EFSA. Available online: https://www.efsa.europa.eu/en/topics/topic/aflatoxins-food (accessed on 27 August 2022).
- Sampling Plans for Aflatoxin Analysis in Peanuts and Corn: Report of an FAO Technical Consultation. National Library of Australia. Available online: https://catalogue.nla.gov.au/Record/1855101 (accessed on 27 August 2022).
- AOAC Official Method: AOAC 977.16-1977, Sampling for Aflatoxins. Available online: http://www.aoacofficialmethod.org/index.php?main_page=product_info&cPath=1&products_id=2065 (accessed on 28 August 2022).
- Kim, D.H.; Hong, S.Y.; Kang, J.W.; Cho, S.M.; Lee, K.R.; An, T.K.; Lee, C.; Chung, S.H. Simultaneous Determination of Multi-Mycotoxins in Cereal Grains Collected from South Korea by LC/MS/MS. Toxins 2017, 9, 106. [Google Scholar] [CrossRef]
- Ouakhssase, A.; Fatini, N.; Ait Addi, E. A Facile Extraction Method Followed by UPLC-MS/MS for the Analysis of Aflatoxins and Ochratoxin A in Raw Coffee Beans. Food Addit. Contam. Part A Chem. Anal. Control. Expo. Risk Assess 2021, 38, 1551–1560. [Google Scholar] [CrossRef]
- Ouakhssase, A.; Fatini, N.; Ait Addi, E. A Simple Extraction Method with No Lipid Removal for the Determination of Aflatoxins in Almonds by Liquid Chromatography Tandem-Mass Spectrometry (LC-MS/MS). Food Addit. Contam. Part A 2021, 38, 1561–1570. [Google Scholar] [CrossRef]
- Selim, M.I.; Juchems, A.M.; Popendorf, W. Assessing Airborne Aflatoxin B1 During On-Farm Grain Handling Activities. Am. Ind. Hyg. Assoc. J. 2010, 59, 252–256. [Google Scholar] [CrossRef]
- Whitaker, T.B.; Dickens, J.W.; Giesbrecht, F.G. Optimum Methanol Concentration and Solvent/Peanut Ratio for Extraction of Aflatoxin from Raw Peanuts by Modified AOAC Method II. J. AOAC Int. 1986, 69, 508–510. [Google Scholar] [CrossRef]
- Spanjer, M.C.; Scholten, J.M.; Kastrup, S.; Jörissen, U.; Schatzki, T.F.; Toyofuku, N. Sample Comminution for Mycotoxin Analysis: Dry Milling or Slurry Mixing? Food Addit. Contam. 2007, 23, 73–83. [Google Scholar] [CrossRef]
- Kumphanda, J.; Matumba, L.; Whitaker, T.B.; Kasapila, W.; Sandahl, J. Maize Meal Slurry Mixing: An Economical Recipe for Precise Aflatoxin Quantitation. World Mycotoxin J. 2019, 12, 203–212. [Google Scholar] [CrossRef]
- Cole, R.J.; Dorner, J.W. Extraction of Aflatoxins from Naturally Contaminated Peanuts with Different Solvents and Solvent/Peanut Ratios. J. AOAC Int. 1994, 77, 1509–1511. [Google Scholar] [CrossRef]
- AOAC Official Method: AOAC 998.03-1998, Aflatoxins in Peanuts. Available online: http://www.aoacofficialmethod.org/index.php?main_page=product_info&products_id=829 (accessed on 28 August 2022).
- Zhang, K.; Banerjee, K. A Review: Sample Preparation and Chromatographic Technologies for Detection of Aflatoxins in Foods. Toxins 2020, 12, 539. [Google Scholar] [CrossRef] [PubMed]
- Zhang, K.; Tan, S.; Xu, D. Determination of Mycotoxins in Dried Fruits Using LC-MS/MS-A Sample Homogeneity, Troubleshooting and Confirmation of Identity Study. Foods 2022, 11, 894. [Google Scholar] [CrossRef]
- Eppley, R.M. Screening Method for Zearalenone., Aflatoxin, And. J. AOAC Int. 1968, 51, 74–78. [Google Scholar] [CrossRef]
- Vargas Medina, D.A.; Bassolli Borsatto, J.V.; Maciel, E.V.S.; Lanças, F.M. Current Role of Modern Chromatography and Mass Spectrometry in the Analysis of Mycotoxins in Food. TrAC-Trends Anal. Chem. 2021, 135, 116156. [Google Scholar] [CrossRef]
- Kiseleva, M.; Chalyy, Z.; Sedova, I.; Aksenov, I. Stability of Mycotoxins in Individual Stock and Multi-Analyte Standard Solutions. Toxins 2020, 12, 94. [Google Scholar] [CrossRef] [PubMed]
- Diaz, G.J.; Cepeda, S.M.; Martos, P.A. Stability of Aflatoxins in Solution. J. AOAC Int. 2012, 95, 1084–1088. [Google Scholar] [CrossRef] [PubMed]
- AOAC Official Method: AOAC 991.31-1994(2002), Aflatoxins in Corn, Raw Peanuts, and Peanut Butter. Immunoaffinity Column (Aflatest) Method. Available online: http://www.aoacofficialmethod.org/index.php?main_page=product_info&products_id=1723 (accessed on 28 August 2022).
- Choochuay, S.; Phakam, J.; Jala, P.; Maneeboon, T.; Tansakul, N. Determination of Aflatoxin B1 in Feedstuffs without Clean-up Step by High-Performance Liquid Chromatography. Int. J. Anal. Chem. 2018, 2018, 4650764. [Google Scholar] [CrossRef]
- Lee, J.; Cameron, I.; Hassall, M. Information Needs and Challenges in Future Process Safety. Digit. Chem. Eng. 2022, 3, 100017. [Google Scholar] [CrossRef]
- Chen, F.; Luan, C.; Wang, L.; Wang, S.; Shao, L. Simultaneous Determination of Six Mycotoxins in Peanut by High-Performance Liquid Chromatography with a Fluorescence Detector. J. Sci. Food Agric. 2017, 97, 1805–1810. [Google Scholar] [CrossRef] [PubMed]
- Arroyo-Manzanares, N.; Huertas-Pérez, J.F.; Gámiz-Gracia, L.; García-Campaña, A.M. A New Approach in Sample Treatment Combined with UHPLC-MS/MS for the Determination of Multiclass Mycotoxins in Edible Nuts and Seeds. Talanta 2013, 115, 61–67. [Google Scholar] [CrossRef]
- Vardanega, R.; Osorio-Tobón, J.F.; Duba, K. Contributions of Supercritical Fluid Extraction to Sustainable Development Goal 9 in South America: Industry, Innovation, and Infrastructure. J. Supercrit. Fluids 2022, 188, 105681. [Google Scholar] [CrossRef]
- Sánchez-Camargo, A.D.P.; Parada-Alonso, F.; Ibáñez, E.; Cifuentes, A. Recent Applications of On-Line Supercritical Fluid Extraction Coupled to Advanced Analytical Techniques for Compounds Extraction and Identification. J. Sep. Sci. 2019, 42, 243–257. [Google Scholar] [CrossRef]
- Singh, S.; Verma, D.K.; Thakur, M.; Tripathy, S.; Patel, A.R.; Shah, N.; Utama, G.L.; Srivastav, P.P.; Benavente-Valdés, J.R.; Chávez-González, M.L.; et al. Supercritical Fluid Extraction (SCFE) as Green Extraction Technology for High-Value Metabolites of Algae, Its Potential Trends in Food and Human Health. Food Res. Int. 2021, 150, 110746. [Google Scholar] [CrossRef]
- Fornari, T.; Vicente, G.; Vázquez, E.; García-Risco, M.R.; Reglero, G. Isolation of Essential Oil from Different Plants and Herbs by Supercritical Fluid Extraction. J. Chromatogr. A 2012, 1250, 34–48. [Google Scholar] [CrossRef] [PubMed]
- Khaw, K.Y.; Parat, M.O.; Shaw, P.N.; Falconer, J.R. Solvent Supercritical Fluid Technologies to Extract Bioactive Compounds from Natural Sources: A Review. Molecules 2017, 22, 1186. [Google Scholar] [CrossRef] [PubMed]
- Pourmortazavi, S.; Rahimi-Nasrabadi, M.; Hajimirsadeghic, S. Supercritical Fluid Technology in Analytical Chemistry—Review. Curr. Anal. Chem. 2013, 10, 3–28. [Google Scholar] [CrossRef]
- Ogura, T.; Schad, G.J. Extraction and Quantification of Mycotoxins in Peanut Butter Using SFE–SFC–MS. Column 2016, 3, 21–24. [Google Scholar]
- Bagade, S.B.; Patil, M. Recent Advances in Microwave Assisted Extraction of Bioactive Compounds from Complex Herbal Samples: A Review. Crit. Rev. Anal. Chem. 2021, 51, 138–149. [Google Scholar] [CrossRef] [PubMed]
- Fina, A.; Mascrez, S.; Beccaria, M.; de Luca, C.; Aspromonte, J.; Cordero, C.; Purcaro, G. A High Throughput Method for Fatty Acid Profiling Using Simultaneous Microwave-Assisted Extraction and Derivatization Followed by Reversed Fill/Flush Flow Modulation Comprehensive Multidimensional Gas Chromatography. Adv. Sample Prep. 2022, 4, 100039. [Google Scholar] [CrossRef]
- Chen, S.; Zhang, H. Development of a Microwave-Assisted-Extraction-Based Method for the Determination of Aflatoxins B1, G1, B2, and G2 in Grains and Grain Products. Anal. Bioanal. Chem. 2013, 405, 1623–1630. [Google Scholar] [CrossRef]
- Li, C.; Xie, G.; Lu, A.; Ping, H.; Ma, Z.; Luan, Y.; Wang, J. Determination of Aflatoxins in Rice and Maize by Ultra-High Performance Liquid Chromatography-Tandem Mass Spectrometry with Accelerated Solvent Extraction and Solid-Phase Extraction. Anal. Lett. 2014, 47, 1485–1499. [Google Scholar] [CrossRef]
- Du, L.J.; Chu, C.; Warner, E.; Wang, Q.Y.; Hu, Y.H.; Chai, K.J.; Cao, J.; Peng, L.Q.; Chen, Y.B.; Yang, J.; et al. Rapid Microwave-Assisted Dispersive Micro-Solid Phase Extraction of Mycotoxins in Food Using Zirconia Nanoparticles. J. Chromatogr. A 2018, 1561, 1–12. [Google Scholar] [CrossRef]
- Campone, L.; Piccinelli, A.L.; Celano, R.; Russo, M.; Valdés, A.; Ibáñez, C.; Rastrelli, L. A Fully Automated Method for Simultaneous Determination of Aflatoxins and Ochratoxin A in Dried Fruits by Pressurized Liquid Extraction and Online Solid-Phase Extraction Cleanup Coupled to Ultra-High-Pressure Liquid Chromatography–Tandem Mass Spectrometry. Anal. Bioanal. Chem. 2015, 407, 2899–2911. [Google Scholar] [CrossRef]
- Poole, C.F. New Trends in Solid-Phase Extraction. TrAC-Trends Anal. Chem. 2003, 22, 362–373. [Google Scholar] [CrossRef]
- Tahir, N.I.; Hussain, S.; Javed, M.; Rehman, H.; Shahzady, T.G.; Parveen, B.; Ali, K.G. Nature of Aflatoxins: Their Extraction, Analysis, and Control. J. Food Saf. 2018, 38, e12561. [Google Scholar] [CrossRef]
- Campone, L.; Piccinelli, A.L.; Celano, R.; Pagano, I.; Russo, M.; Rastrelli, L. Rapid and Automated Analysis of Aflatoxin M1 in Milk and Dairy Products by Online Solid Phase Extraction Coupled to Ultra-High-Pressure-Liquid-Chromatography Tandem Mass Spectrometry. J. Chromatogr. A 2016, 1428, 212–219. [Google Scholar] [CrossRef] [PubMed]
- Jia, W.; Chu, X.; Ling, Y.; Huang, J.; Chang, J. Multi-Mycotoxin Analysis in Dairy Products by Liquid Chromatography Coupled to Quadrupole Orbitrap Mass Spectrometry. J. Chromatogr. A 2014, 1345, 107–114. [Google Scholar] [CrossRef] [PubMed]
- Mateus, A.R.S.; Barros, S.; Pena, A.; Silva, A.S. Development and Validation of QuEChERS Followed by UHPLC-ToF-MS Method for Determination of Multi-Mycotoxins in Pistachio Nuts. Molecules 2021, 26, 5754. [Google Scholar] [CrossRef]
- Alcántara-Durán, J.; Moreno-González, D.; García-Reyes, J.F.; Molina-Díaz, A. Use of a Modified QuEChERS Method for the Determination of Mycotoxin Residues in Edible Nuts by Nano Flow Liquid Chromatography High Resolution Mass Spectrometry. Food Chem. 2019, 279, 144–149. [Google Scholar] [CrossRef]
- Rezaee, M.; Khalilian, F.; Mashayekhi, H.A.; Fattahi, N. A Novel Method for the High Preconcentration of Trace Amounts of the Aflatoxins in Pistachios by Dispersive Liquid–Liquid Microextraction after Solid-Phase Extraction. Anal. Methods 2014, 6, 3456–3461. [Google Scholar] [CrossRef]
- Karapınar, H.S.; Balıkçıoğlu, A. Boron-Doped Activated Carbon Nanocomposite as a Selective Adsorbent for Rapid Extraction of Aflatoxins in Nut Samples. J. Food Compos. Anal. 2022, 112, 104680. [Google Scholar] [CrossRef]
- Li, J.; Li, Y.; Xu, D.; Zhang, J.; Wang, Y.; Luo, C. Determination of Metrafenone in Vegetables by Matrix Solid-Phase Dispersion and HPLC-UV Method. Food Chem. 2017, 214, 77–81. [Google Scholar] [CrossRef]
- Wu, X.; Zhang, X.; Yang, Y.; Liu, Y.; Chen, X. Development of a Deep Eutectic Solvent-Based Matrix Solid Phase Dispersion Methodology for the Determination of Aflatoxins in Crops. Food Chem. 2019, 291, 239–244. [Google Scholar] [CrossRef]
- Liang, J.; Dong, Y.; Yuan, X.; Fan, L.; Zhao, S.; Wang, L. Fast Determination of 14 Mycotoxins in Chestnut by Dispersive Solid-Phase Extraction Coupled with Ultra High Performance Liquid Chromatography-Tandem Mass Spectrometry. J. Sep. Sci. 2019, 42, 2191–2201. [Google Scholar] [CrossRef] [PubMed]
- Karapınar, H.S.; Bilgiç, A. A New Magnetic Fe3O4@SiO2@TiO2-APTMS-CPA Adsorbent for Simple, Fast and Effective Extraction of Aflatoxins from Some Nuts. J. Food Compos. Anal. 2022, 105, 104261. [Google Scholar] [CrossRef]
- Karami-Osboo, R.; Mirabolfathi, M. A Novel Dispersive Nanomagnetic Particle Solid-Phase Extraction Method to Determine Aflatoxins in Nut and Cereal Samples. Food Anal. Methods 2017, 10, 4086–4093. [Google Scholar] [CrossRef]
- Karami-Osboo, R.; Ahmadpoor, F.; Nasrollahzadeh, M.; Maham, M. Polydopamine-Coated Magnetic Spirulina Nanocomposite for Efficient Magnetic Dispersive Solid-Phase Extraction of Aflatoxins in Pistachio. Food Chem. 2022, 377, 131967. [Google Scholar] [CrossRef] [PubMed]
- Taherimaslak, Z.; Amoli-Diva, M.; Allahyari, M.; Pourghazi, K.; Manafi, M.H. Low Density Solvent Based Dispersive Liquid–Liquid Microextraction Followed by Vortex-Assisted Magnetic Nanoparticle Based Solid-Phase Extraction and Surfactant Enhanced Spectrofluorimetric Detection for the Determination of Aflatoxins in Pistachio Nuts. RSC Adv. 2015, 5, 12747–12754. [Google Scholar] [CrossRef]
- Manoochehri, M.; Akbar Asgharinezhad, A.; Safaei, M. Multivariate Optimisation of an Ultrasound Assisted-Matrix Solid-Phase Dispersion Method Combined with LC-Fluorescence Detection for Simultaneous Extraction and Determination of Aflatoxins in Pistachio Nut Samples. Food Addit. Contam. Part A 2013, 30, 1954–1962. [Google Scholar] [CrossRef]
- Zhu, A.; Jiao, T.; Ali, S.; Xu, Y.; Ouyang, Q.; Chen, Q. Dispersive Micro Solid Phase Extraction Based Ionic Liquid Functionalized ZnO Nanoflowers Couple with Chromatographic Methods for Rapid Determination of Aflatoxins in Wheat and Peanut Samples. Food Chem. 2022, 391, 133277. [Google Scholar] [CrossRef]
- Risticevic, S.; Niri, V.H.; Vuckovic, D.; Pawliszyn, J. Recent Developments in Solid-Phase Microextraction. Anal. Bioanal. Chem. 2009, 393, 781–795. [Google Scholar] [CrossRef]
- Balasubramanian, S.; Panigrahi, S. Solid-Phase Microextraction (SPME) Techniques for Quality Characterization of Food Products: A Review. Food Bioprocess Technol. 2010, 4, 1–26. [Google Scholar] [CrossRef]
- Jalili, V.; Barkhordari, A.; Ghiasvand, A. A Comprehensive Look at Solid-Phase Microextraction Technique: A Review of Reviews. Microchem. J. 2020, 152, 104319. [Google Scholar] [CrossRef]
- Georgiadou, M.; Gardeli, C.; Komaitis, M.; Tsitsigiannis, D.I.; Paplomatas, E.J.; Sotirakoglou, K.; Yanniotis, S. Volatile Profiles of Healthy and Aflatoxin Contaminated Pistachios. Food Res. Int. 2015, 74, 89–96. [Google Scholar] [CrossRef]
- Beck, J.J.; Willett, D.S.; Gee, W.S.; Mahoney, N.E.; Higbee, B.S. Differentiation of Volatile Profiles from Stockpiled Almonds at Varying Relative Humidity Levels Using Benchtop and Portable GC-MS. J. Agric. Food Chem. 2016, 64, 9286–9292. [Google Scholar] [CrossRef]
- Souza, I.D.; Oliveira, I.G.C.; Queiroz, M.E.C. Innovative Extraction Materials for Fiber-in-Tube Solid Phase Microextraction: A Review. Anal. Chim. Acta 2021, 1165, 238110. [Google Scholar] [CrossRef] [PubMed]
- Amde, M.; Temsgen, A.; Dechassa, N. Ionic Liquid Functionalized Zinc Oxide Nanorods for Solid-Phase Microextraction of Aflatoxins in Food Products. J. Food Compos. Anal. 2020, 91, 103528. [Google Scholar] [CrossRef]
- Tsai, J.-J.; Lai, Y.-T.; Chen, Y.-C.; Tsai, J.-J.; Lai, Y.-T.; Chen, Y.-C. Using Solid-Phase Microextraction Coupled with Reactive Carbon Fiber Ionization-Mass Spectrometry for the Detection of Aflatoxin B1 from Complex Samples. Separations 2022, 9, 199. [Google Scholar] [CrossRef]
- Wang, Y.; Xianyu, Y. Nanobody and Nanozyme-Enabled Immunoassays with Enhanced Specificity and Sensitivity. Small Methods 2022, 6, 2101576. [Google Scholar] [CrossRef] [PubMed]
- Hong, S.P.; Zakaria, S.N.A.; Ahmed, M.U. Trends in the Development of Immunoassays for Mycotoxins and Food Allergens Using Gold and Carbon Nanostructured Material. Food Chem. Adv. 2022, 1, 100069. [Google Scholar] [CrossRef]
- AOAC Official Method: AOAC 999.07-2008, Aflatoxin B1 and Total Aflatoxins in Peanut Butter, Pistachio Paste, Fig Paste, and Paprika Powder. Immunoaffinity Column Liquid Chromatography with Post-Column Derivatization. Available online: http://www.aoacofficialmethod.org/index.php?main_page=product_info&products_id=2804 (accessed on 28 August 2022).
- Dini, A.; Nadimi, A.E.; Behmaram, K. The Effect of Monitoring System on Risk Assessment of Aflatoxins in Iran’s Pistachio Nuts Exported to the E.U. During 2012–2018. Iran. J. Pharm. Res. 2022, 21, e123951. [Google Scholar] [CrossRef]
- Sharman, M.; Gilbert, J. Automated Aflatoxin Analysis of Foods and Animal Feeds Using Immunoaffinity Column Clean-up and High-Performance Liquid Chromatographic Determination. J. Chromatogr. A 1991, 543, 220–225. [Google Scholar] [CrossRef]
- Carman, A.S.; Kuan, S.S.; Ware, G.M.; Umrigar, P.P.; Miller, K.V.; Guerrero, H.G. Robotic Automated Analysis of Foods for Aflatoxin. J. AOAC Int. 1996, 79, 456–464. [Google Scholar] [CrossRef]
- Rhemrev, R.; Pazdanska, M.; Marley, E.; Biselli, S.; Staiger, S. Automated Aflatoxin Analysis Using Inline Reusable Immunoaffinity Column Cleanup and LC-Fluorescence Detection. J. AOAC Int. 2015, 98, 1585–1590. [Google Scholar] [CrossRef] [PubMed]
- Dhanshetty, M.; Thorat, P.; Banerjee, K. High-Throughput Analysis of Aflatoxins in Cereals, Nuts, and Processed Products Involving Automated Immunoaffinity Cleanup and Inline HPLC–Fluorescence Detection. J. AOAC Int. 2021, 104, 1526–1532. [Google Scholar] [CrossRef] [PubMed]
- Zhang, K. Evaluation of Automated Sample Preparation for Mycotoxin Analysis in Foods. J. AOAC Int. 2021, 103, 1052–1059. [Google Scholar] [CrossRef]
- Gilbert, J.; Anklam, E. Validation of Analytical Methods for Determining Mycotoxins in Foodstuffs. TrAC Trends Anal. Chem. 2002, 21, 468–486. [Google Scholar] [CrossRef]
- Shen, M.H.; Singh, R.K. Determining Aflatoxins in Raw Peanuts Using Immunoaffinity Column as Sample Clean-up Method Followed by Normal-Phase HPLC-FLD Analysis. Food Control. 2022, 139, 109065. [Google Scholar] [CrossRef]
- Beccaria, M.; Cabooter, D. Current Developments in LC-MS for Pharmaceutical Analysis. Analyst 2020, 145, 1129–1157. [Google Scholar] [CrossRef]
- Ramadhaningtyas, D.P.; Aryana, N.; Aristiawan, Y.; Styarini, D. Optimization of Chromatographic Conditions for Determination of Aflatoxin B1, B2, G1 and G2 by Using Liquid Chromatography-Mass Spectrometry. AIP Conf. Proc. 2017, 1904, 020071. [Google Scholar] [CrossRef]
- Danezis, G.P.; Anagnostopoulos, C.J.; Liapis, K.; Koupparis, M.A. Multi-Residue Analysis of Pesticides, Plant Hormones, Veterinary Drugs and Mycotoxins Using HILIC Chromatography—MS/MS in Various Food Matrices. Anal. Chim. Acta 2016, 942, 121–138. [Google Scholar] [CrossRef]
- Carnaghan, R.B.A.; Hartley, R.D.; O’Kelly, J. Toxicity and Fluorescence Properties of the Aflatoxins. Nature 1963, 200, 1101. [Google Scholar] [CrossRef]
- Nardiello, D.; Magro, S.; Iammarino, M.; Palermo, C.; Muscarella, M.; Centonze, D. Recent Advances in the Post-Column Derivatization for the Determination of Mycotoxins in Food Products and Feed Materials by Liquid Chromatography and Fluorescence Detection. Curr. Anal. Chem. 2014, 10, 355–365. [Google Scholar] [CrossRef]
- Pons, W.A.; Cucullu, A.F.; Lee, L.S.; Janssen, H.J.; Goldblatt, L.A. Kinetic Study of Acid-Catalyzed Conversion of Aflatoxins B1 and G1 to B2a and G2a. J. Am. Oil Chem. Soc. 1972, 49, 124–128. [Google Scholar] [CrossRef] [PubMed]
- Shepherd, M.J.; Gilbert, J. An Investigation of HPLC Post-column Iodination Conditions for the Enhancement of Aflatoxin B1 Fluorescence. Food Addit. Contam. 2009, 1, 325–335. [Google Scholar] [CrossRef] [PubMed]
- Lavilla, I.; Romero, V.; Costas, I.; Bendicho, C. Greener Derivatization in Analytical Chemistry. TrAC Trends Anal. Chem. 2014, 61, 1–10. [Google Scholar] [CrossRef]
- Jubeen, F.; Sher, F.; Hazafa, A.; Zafar, F.; Ameen, M.; Rasheed, T. Evaluation and Detoxification of Aflatoxins in Ground and Tree Nuts Using Food Grade Organic Acids. Biocatal. Agric. Biotechnol. 2020, 29, 101749. [Google Scholar] [CrossRef]
- Campos, W.E.O.; Rosas, L.B.; Neto, A.P.; Mello, R.A.; Vasconcelos, A.A. Extended Validation of a Senstive and Robust Method for Simultaneous Quantification of Aflatoxins B1, B2, G1 and G2 in Brazil Nuts by HPLC-FLD. J. Food Compos. Anal. 2017, 60, 90–96. [Google Scholar] [CrossRef]
- Iamanaka, B.T.; Nakano, F.; Lemes, D.P.; Ferranti, L.S.; Taniwaki, M.H. Aflatoxin Evaluation in Ready-to-Eat Brazil Nuts Using Reversed-Phase Liquid Chromatography and Post-Column Derivatisation. Food Addit. Contam. Part A 2014, 31, 917–923. [Google Scholar] [CrossRef]
- Saffari, E.; Madani, M.; Karbasizade, V.; Shakib, P. Detection of Fungal and Bacterial Contamination of Hazelnut and Determination of Aflatoxin B by HPLC Method in Isfahan, Iran. Curr. Med. Mycol. 2021, 7, 1–5. [Google Scholar] [CrossRef]
- Zacharis, C.K.; Tzanavaras, P.D. Liquid Chromatography Coupled to On-Line Post Column Derivatization for the Determination of Organic Compounds: A Review on Instrumentation and Chemistries. Anal. Chim. Acta 2013, 798, 1–24. [Google Scholar] [CrossRef]
- Tittlemier, S.A.; Cramer, B.; Dall’Asta, C.; Iha, M.H.; Lattanzio, V.M.T.; Maragos, C.; Solfrizzo, M.; Stranska, M.; Stroka, J.; Sumarah, M. Developments in Mycotoxin Analysis: An Update for 2018-19. World Mycotoxin J. 2020, 13, 3–24. [Google Scholar] [CrossRef]
- Di Stefano, V.; Avellone, G.; Bongiorno, D.; Cunsolo, V.; Muccilli, V.; Sforza, S.; Dossena, A.; Drahos, L.; Vékey, K. Applications of Liquid Chromatography-Mass Spectrometry for Food Analysis. J. Chromatogr. A 2012, 1259, 74–85. [Google Scholar] [CrossRef]
- Aiko, V.; Mehta, A. Occurrence, Detection and Detoxification of Mycotoxins. J. Biosci. 2015, 40, 943–954. [Google Scholar] [CrossRef]
- Mahfuz, M.; Gazi, M.A.; Hossain, M.; Islam, M.R.; Fahim, S.M.; Ahmed, T. General and Advanced Methods for the Detection and Measurement of Aflatoxins and Aflatoxin Metabolites: A Review. Toxin Rev. 2018, 39, 123–137. [Google Scholar] [CrossRef]
- Furey, A.; Moriarty, M.; Bane, V.; Kinsella, B.; Lehane, M. Ion Suppression; A Critical Review on Causes, Evaluation, Prevention and Applications. Talanta 2013, 115, 104–122. [Google Scholar] [CrossRef]
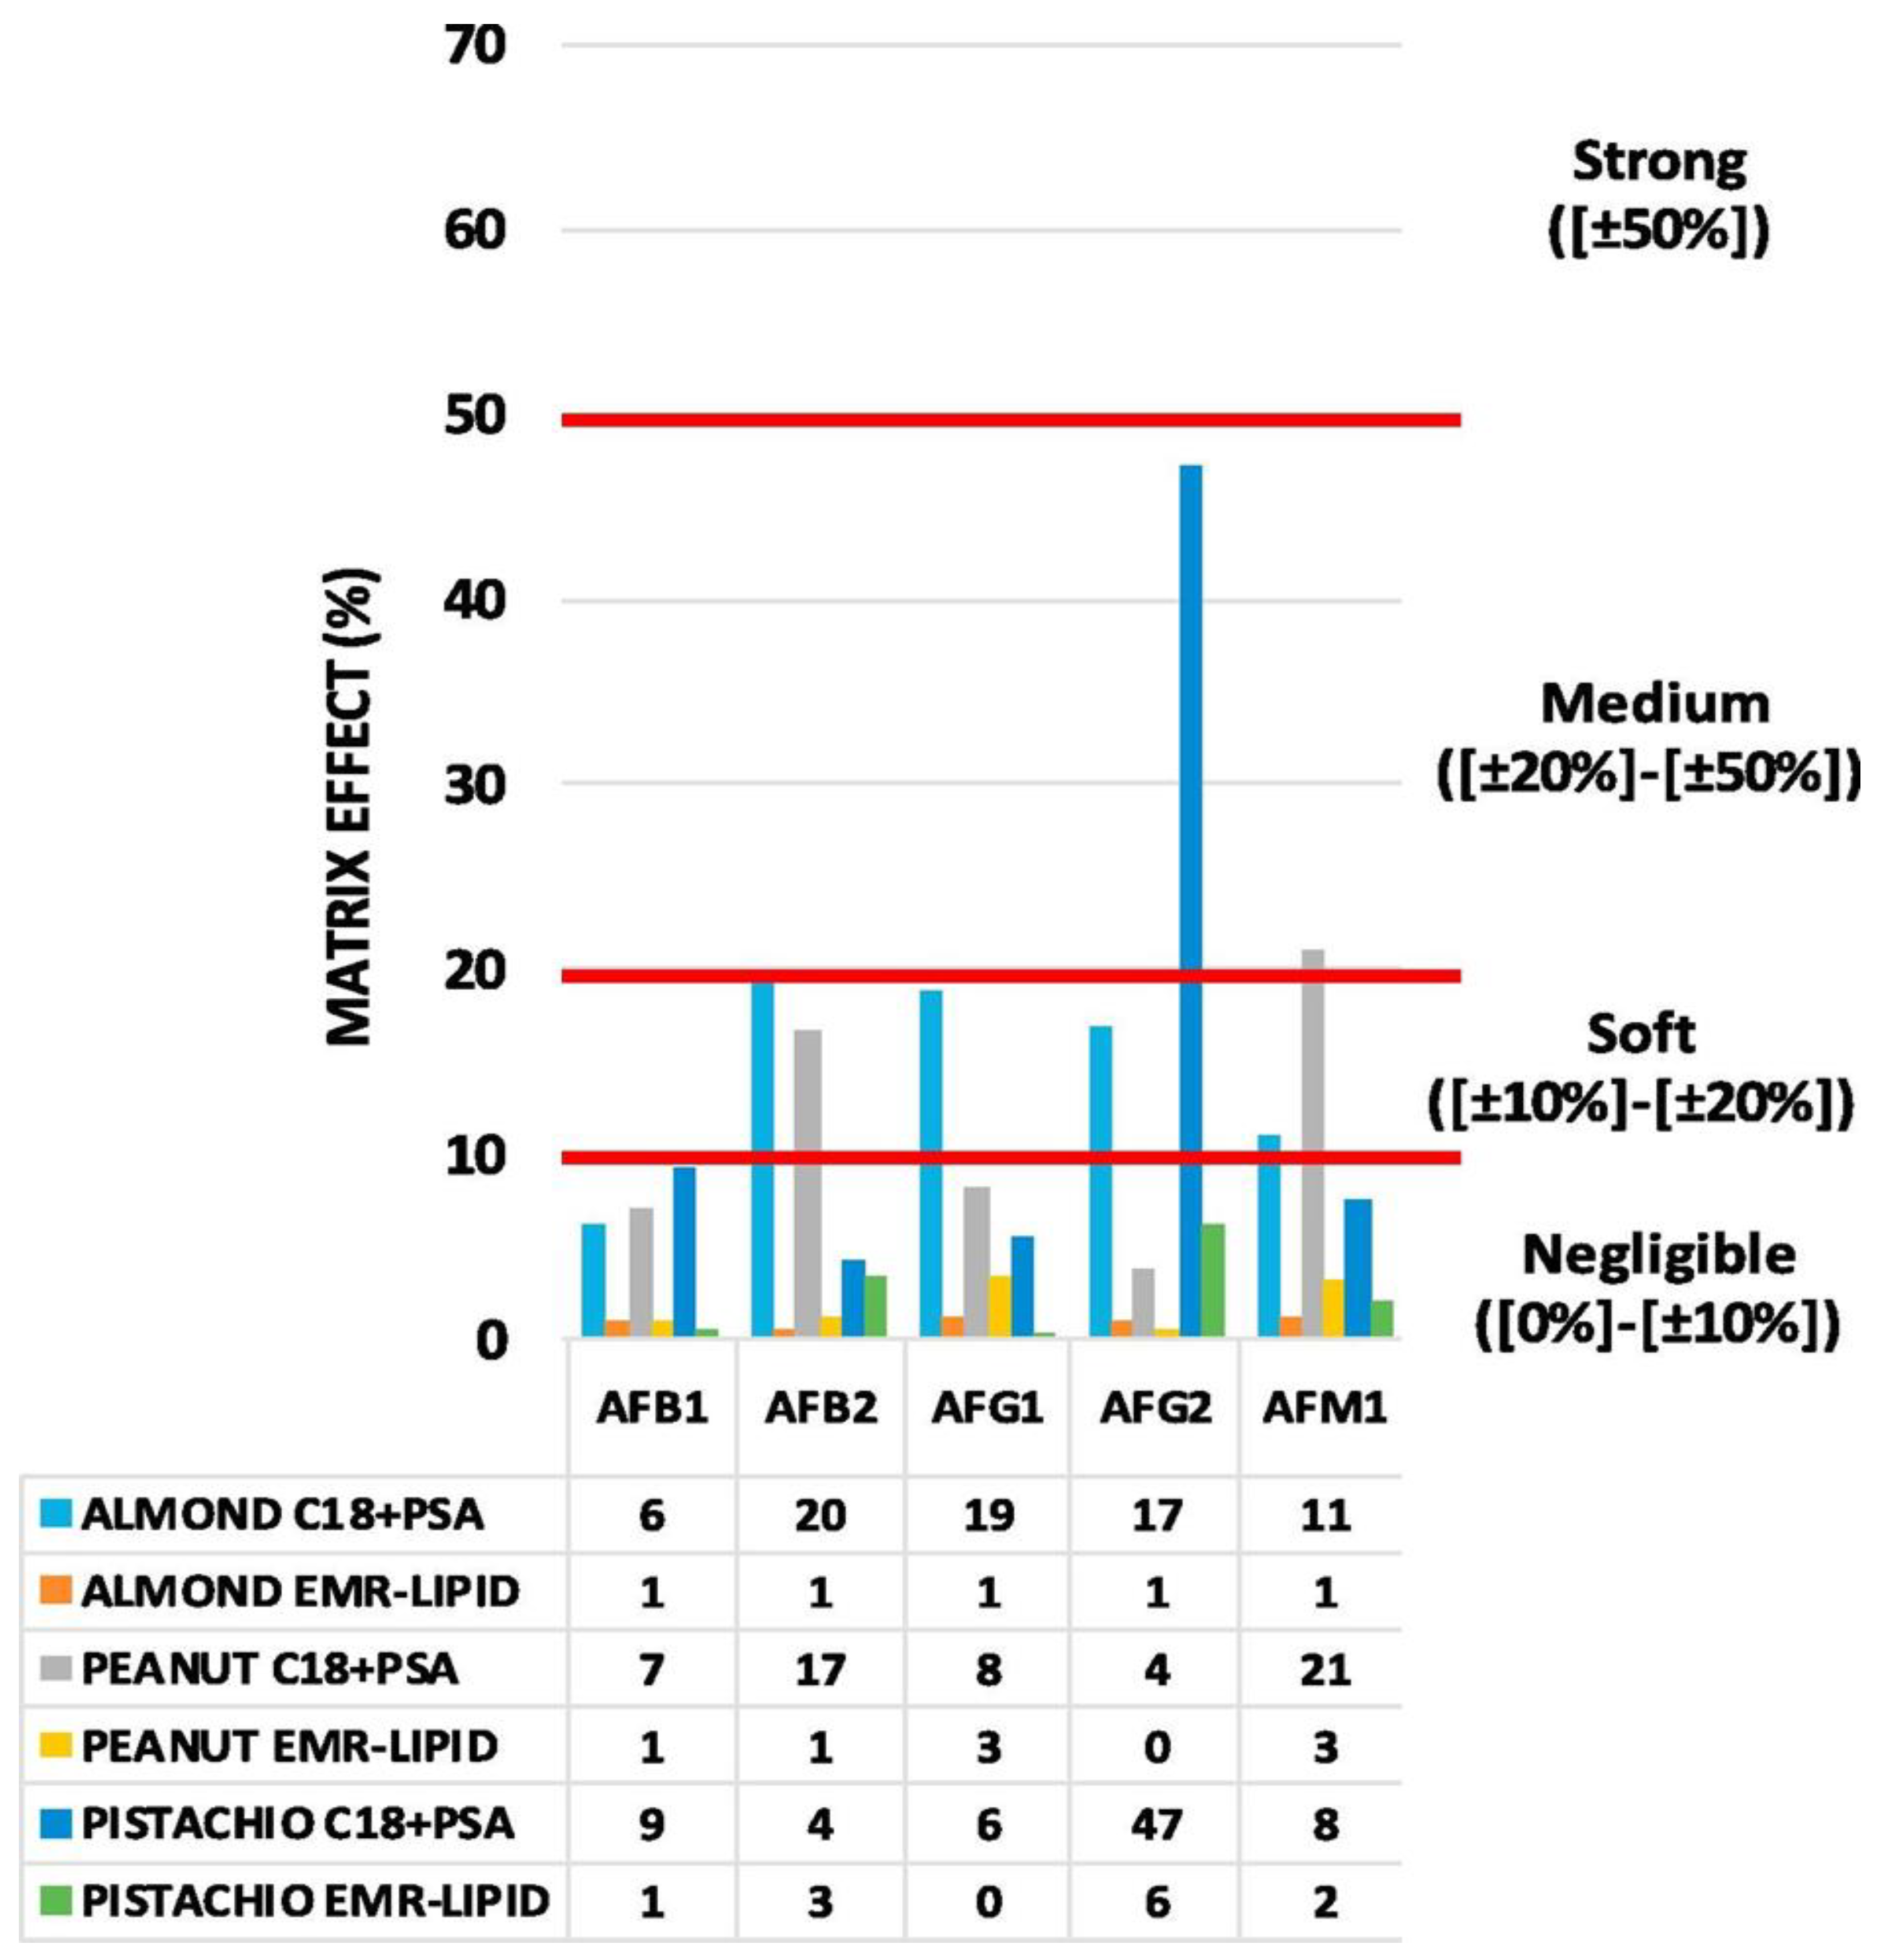
- Trufelli, H.; Palma, P.; Famiglini, G.; Cappiello, A. An Overview of Matrix Effects in Liquid Chromatography–Mass Spectrometry. Mass Spectrom Rev. 2011, 30, 491–509. [Google Scholar] [CrossRef] [PubMed]
- Stahnke, H.; Kittlaus, S.; Kempe, G.; Alder, L. Reduction of Matrix Effects in Liquid Chromatography-Electrospray Ionization-Mass Spectrometry by Dilution of the Sample Extracts: How Much Dilution Is Needed? Anal. Chem. 2012, 84, 1474–1482. [Google Scholar] [CrossRef]
- Fabregat-Cabello, N.; Zomer, P.; Sancho, J.V.; Roig-Navarro, A.F.; Mol, H.G.J. Comparison of Approaches to Deal with Matrix Effects in LC-MS/MS Based Determinations of Mycotoxins in Food and Feed. World Mycotoxin J. 2016, 9, 149–161. [Google Scholar] [CrossRef]
- Guidance for Industry: Action Levels for Poisonous or Deleterious Substances in Human Food and Animal Feed | FDA. Available online: https://www.fda.gov/regulatory-information/search-fda-guidance-documents/guidance-industry-action-levels-poisonous-or-deleterious-substances-human-food-and-animal-feed (accessed on 28 August 2022).
- Glineur, A.; Beccaria, M.; Purcaro, G. Exploring 20 EV Electron Impact Ionization in Gas Chromatography-Tandem Mass Spectrometry for the Determination of Estrogenic Compounds. J. Chromatogr. A 2021, 1652, 462359. [Google Scholar] [CrossRef] [PubMed]
- Malachová, A.; Sulyok, M.; Beltrán, E.; Berthiller, F.; Krska, R. Optimization and Validation of a Quantitative Liquid Chromatography–Tandem Mass Spectrometric Method Covering 295 Bacterial and Fungal Metabolites Including All Regulated Mycotoxins in Four Model Food Matrices. J. Chromatogr. A 2014, 1362, 145–156. [Google Scholar] [CrossRef] [PubMed]
- Beltrán, E.; Ibáñez, M.; Sancho, J.V.; Hernández, F. Determination of Mycotoxins in Different Food Commodities by Ultra-High-Pressure Liquid Chromatography Coupled to Triple Quadrupole Mass Spectrometry. Rapid Commun. Mass Spectrom. 2009, 23, 1801–1809. [Google Scholar] [CrossRef] [PubMed]
- Tsiplakou, E.; Anagnostopoulos, C.; Liapis, K.; Haroutounian, S.A.; Zervas, G. Determination of Mycotoxins in Feedstuffs and Ruminant’s Milk Using an Easy and Simple LC–MS/MS Multiresidue Method. Talanta 2014, 130, 8–19. [Google Scholar] [CrossRef]
- Lattanzio, V.M.T.; Ciasca, B.; Powers, S.; Visconti, A. Improved Method for the Simultaneous Determination of Aflatoxins, Ochratoxin A and Fusarium Toxins in Cereals and Derived Products by Liquid Chromatography–Tandem Mass Spectrometry after Multi-Toxin Immunoaffinity Clean Up. J. Chromatogr. A 2014, 1354, 139–143. [Google Scholar] [CrossRef] [PubMed]
- Lv, S.; Wang, H.; Yan, Y.; Ge, M.; Guan, J. Quantification and Confirmation of Four Aflatoxins Using a LC–MS/MS QTRAP System in Multiple Reaction Monitoring, Enhanced Product Ion Scan, and MS3 Modes. Eur. J. Mass Spectrom. 2020, 26, 63–77. [Google Scholar] [CrossRef] [PubMed]
- Huang, P.; Kong, W.; Wang, S.; Wang, R.; Lu, J.; Yang, M. Multiclass Mycotoxins in Lotus Seeds Analysed by an Isotope-Labelled Internal Standard-Based UPLC-MS/MS. J. Pharm. Pharmacol. 2018, 70, 1378–1388. [Google Scholar] [CrossRef] [PubMed]
- Beccaria, M.; Inferrera, V.; Rigano, F.; Gorynski, K.; Purcaro, G.; Pawliszyn, J.; Dugo, P.; Mondello, L. Highly Informative Multiclass Profiling of Lipids by Ultra-High Performance Liquid Chromatography—Low Resolution (Quadrupole) Mass Spectrometry by Using Electrospray Ionization and Atmospheric Pressure Chemical Ionization Interfaces. J. Chromatogr. A 2017, 1509, 69–82. [Google Scholar] [CrossRef]
- Demirhan, B.E.; Demirhan, B. Investigation of Twelve Significant Mycotoxin Contamination in Nut-Based Products by the LC–MS/MS Method. Metabolites 2022, 12, 120. [Google Scholar] [CrossRef]
- Gámiz-Gracia, L.; García-Campaña, A.M.; Arroyo-Manzanares, N. Application of LC–MS/MS in the Mycotoxins Studies. Toxins 2020, 12, 272. [Google Scholar] [CrossRef]
- Streit, E.; Schwab, C.; Sulyok, M.; Naehrer, K.; Krska, R.; Schatzmayr, G. Multi-Mycotoxin Screening Reveals the Occurrence of 139 Different Secondary Metabolites in Feed and Feed Ingredients. Toxins 2013, 5, 504–523. [Google Scholar] [CrossRef]
- Abia, W.A.; Warth, B.; Sulyok, M.; Krska, R.; Tchana, A.N.; Njobeh, P.B.; Dutton, M.F.; Moundipa, P.F. Determination of Multi-Mycotoxin Occurrence in Cereals, Nuts and Their Products in Cameroon by Liquid Chromatography Tandem Mass Spectrometry (LC-MS/MS). Food Control. 2013, 31, 438–453. [Google Scholar] [CrossRef]
- Bi, B.; Bao, J.; Xi, G.; Xu, Y.; Zhang, L. Determination of Multiple Mycotoxin Residues in Panax Ginseng Using Simultaneous UPLC-ESI-MS/MS. J. Food Saf. 2018, 38, e12458. [Google Scholar] [CrossRef]
- Choi, B.K.; Hercules, D.M.; Gusev, A.I. Effect of Liquid Chromatography Separation of Complex Matrices on Liquid Chromatography-Tandem Mass Spectrometry Signal Suppression. J. Chromatogr. A 2001, 907, 337–342. [Google Scholar] [CrossRef]
- Mondello, L.; Beccaria, M.; Donato, P.; Cacciola, F.; Dugo, G.; Dugo, P. Comprehensive Two-Dimensional Liquid Chromatography with Evaporative Light-Scattering Detection for the Analysis of Triacylglycerols in Borago Officinalis. J. Sep. Sci. 2011, 34, 688–692. [Google Scholar] [CrossRef] [PubMed]
- Dsouza, B.R.; Joseph, A.; Das, S.; Alex, A.T. Multiple Heart-Cutting Two-Dimensional Liquid Chromatography: Recent Developments and Applications. Curr. Anal. Chem. 2020, 17, 339–354. [Google Scholar] [CrossRef]
- Stoll, D.R.; Carr, P.W. Two-Dimensional Liquid Chromatography: A State of the Art Tutorial. Anal. Chem. 2017, 89, 519–531. [Google Scholar] [CrossRef]
- Kresse, M.; Drinda, H.; Romanotto, A.; Speer, K. Simultaneous Determination of Pesticides, Mycotoxins, and Metabolites as Well as Other Contaminants in Cereals by LC-LC-MS/MS. J. Chromatogr. B Analyt. Technol. Biomed. Life Sci. 2019, 1117, 86–102. [Google Scholar] [CrossRef] [PubMed]
- Campone, L.; Rizzo, S.; Piccinelli, A.L.; Celano, R.; Pagano, I.; Russo, M.; Labra, M.; Rastrelli, L. Determination of Mycotoxins in Beer by Multi Heart-Cutting Two-Dimensional Liquid Chromatography Tandem Mass Spectrometry Method. Food Chem. 2020, 318, 126496. [Google Scholar] [CrossRef] [PubMed]
- Breidbach, A.; Ulberth, F. Two-Dimensional Heart-Cut LC-LC Improves Accuracy of Exact-Matching Double Isotope Dilution Mass Spectrometry Measurements of Aflatoxin B1 in Cereal-Based Baby Food, Maize, and Maize-Based Feed. Anal. Bioanal. Chem. 2015, 407, 3159–3167. [Google Scholar] [CrossRef]
- Qi, D.; Fei, T.; Liu, H.; Yao, H.; Wu, D.; Liu, B. Development of Multiple Heart-Cutting Two-Dimensional Liquid Chromatography Coupled to Quadrupole-Orbitrap High Resolution Mass Spectrometry for Simultaneous Determination of Aflatoxin B1, B2, G1, G2, and Ochratoxin A in Snus, a Smokeless Tobacco Product. J. Agric. Food Chem. 2017, 65, 9923–9929. [Google Scholar] [CrossRef]
- Kumar, V.V. Aflatoxins: Properties, Toxicity and Detoxification. Nutr. Food Sci. Int. J. 2018, 6, 555696. [Google Scholar] [CrossRef]
- Rosen, J.D.; DiProssimo, V.P.; Rosen, R.T. Confirmation of Aflatoxins B1 and B2 in Peanuts by Gas Chromatography/Mass Spectrometry/Selected Ion Monitoring. J. Agric. Food Chem. 1984, 32, 276–278. [Google Scholar] [CrossRef]
- Trucksess, M.W.; Brumley, W.C.; Nesheim, S. Rapid Quantitation and Confirmation of Aflatoxins in Corn and Peanut Butter, Using a Disposable Silica Gel Column, Thin Layer Chromatography, and Gas Chromatography/Mass Spectromety. J. Assoc. Off. Anal. Chem. 1984, 67, 973–975. [Google Scholar] [CrossRef]
- Goto, T.; Matsui, M.; Kitsuwa, T. Analysis of Aspergillus Mycotoxins by Gas Chromatography Using Fused Silica Capillary Column. JSM Mycotoxins 1990, 1990, 43–47. [Google Scholar] [CrossRef]
- Lei, F.; Li, C.; Zhou, S.; Wang, D.; Zhao, Y.; Wu, Y. Hyphenation of Supercritical Fluid Chromatography with Tandem Mass Spectrometry for Fast Determination of Four Aflatoxins in Edible Oil. Rapid Commun. Mass Spectrom. 2016, 30, 122–127. [Google Scholar] [CrossRef] [PubMed]
- Tao, F.; Yao, H.; Hruska, Z.; Burger, L.W.; Rajasekaran, K.; Bhatnagar, D. Recent Development of Optical Methods in Rapid and Non-Destructive Detection of Aflatoxin and Fungal Contamination in Agricultural Products. TrAC Trends Anal. Chem. 2018, 100, 65–81. [Google Scholar] [CrossRef]
- Xie, L.; Chen, M.; Ying, Y. Development of Methods for Determination of Aflatoxins. Crit. Rev. Food Sci. Nutr. 2016, 56, 2642–2664. [Google Scholar] [CrossRef]
- Anfossi, L.; Giovannoli, C.; Baggiani, C. Mycotoxin Detection. Curr. Opin. Biotechnol. 2016, 37, 120–126. [Google Scholar] [CrossRef]
- Hleba, L.; Císarová, M.; Shariati, M.A.; Tancinová, D. Detection of Mycotoxins Using MALDI-TOF Mass Spectrometry. J. Microbiol. Biotechnol. Food Sci. 2017, 7, 181–185. [Google Scholar] [CrossRef]
- De Oliveira, D.N.; Ferreira, M.S.; Catharino, R.R. Rapid and Simultaneous In Situ Assessment of Aflatoxins and Stilbenes Using Silica Plate Imprinting Mass Spectrometry Imaging. PLoS ONE 2014, 9, e90901. [Google Scholar] [CrossRef]
- Rodrigues, P.; Venâncio, A.; Lima, N. Aflatoxigenic Fungi and Aflatoxins in Portuguese Almonds. Sci. World J. 2012, 2012, 471926. [Google Scholar] [CrossRef]
- Pechanova, O.; Pechan, T.; Rodriguez, J.M.; Paul Williams, W.; Brown, A.E. A Two-Dimensional Proteome Map of the Aflatoxigenic Fungus Aspergillus Flavus. Proteomics 2013, 13, 1513–1518. [Google Scholar] [CrossRef]
- Da Silva, F.C.; Chalfoun, S.M.; Batista, L.R.; Santos, C.; Lima, N. Use of a Polyphasic Approach Including MALDI-TOF MS for Identification of Aspergillus Section Flavi Strains Isolated from Food Commodities in Brazil. Ann. Microbiol. 2015, 65, 2119–2129. [Google Scholar] [CrossRef]
- Zhang, X.; Ren, X.; Chingin, K. Applications of Direct Analysis in Real Time Mass Spectrometry in Food Analysis: A Review. Rapid Commun. Mass Spectrom. 2021, 35, e9013. [Google Scholar] [CrossRef] [PubMed]
- Beneito-Cambra, M.; Gilbert-López, B.; Moreno-González, D.; Bouza, M.; Franzke, J.; García-Reyes, J.F.; Molina-Díaz, A. Ambient (Desorption/Ionization) Mass Spectrometry Methods for Pesticide Testing in Food: A Review. Anal. Methods 2020, 12, 4831–4852. [Google Scholar] [CrossRef] [PubMed]
- Busman, M. Quantitation of Mycotoxins Using Direct Analysis in Real Time Mass Spectrometry (DART-MS). J. AOAC Int. 2018, 101, 643–646. [Google Scholar] [CrossRef]
- Busman, M.; Liu, J.; Zhong, H.; Bobell, J.R.; Maragos, C.M. Determination of the Aflatoxin AFB1 from Corn by Direct Analysis in Real Time-Mass Spectrometry (DART-MS). Food Addit. Contam. Part A 2014, 31, 932–939. [Google Scholar] [CrossRef] [PubMed]
- Wang, Y.; Jiang, J.; Fotina, H.; Zhang, H.; Chen, J. Advances in Antibody Preparation Techniques for Immunoassays of Total Aflatoxin in Food. Molecules 2020, 25, 4113. [Google Scholar] [CrossRef]
- Hosseini, S.; Vázquez-Villegas, P.; Rito-Palomares, M.; Martinez-Chapa, S.O. Enzyme-Linked Immunosorbent Assay (ELISA); Springer Briefs in Applied Sciences and Technology; Springer: Singapore, 2018; ISBN 978-981-10-6765-5. [Google Scholar]
- Eivazzadeh-Keihan, R.; Pashazadeh, P.; Hejazi, M.; de la Guardia, M.; Mokhtarzadeh, A. Recent Advances in Nanomaterial-Mediated Bio and Immune Sensors for Detection of Aflatoxin in Food Products. TrAC Trends Anal. Chem. 2017, 87, 112–128. [Google Scholar] [CrossRef]
- Stefanovic, S.; Spiric, D.; Petronijevic, R.; Trailovic, J.N.; Milicevic, D.; Nikolic, D.; Jankovic, S. Comparison of Two Analytical Methods (ELISA and LC-MS/MS) for Determination of Aflatoxin B1 in Corn and Aflatoxin M1 in Milk. Procedia Food Sci. 2015, 5, 270–273. [Google Scholar] [CrossRef]
- Kos, J.; Hajnal, E.J.; Jajić, I.; Krstović, S.; Mastilović, J.; Šarić, B.; Jovanov, P. Comparison of ELISA, HPLC-FLD and HPLC-MS/MS Methods for Determination of Aflatoxin M1 in Natural Contaminated Milk Samples. Acta Chim. Slov. 2016, 63, 747–756. [Google Scholar] [CrossRef]
- Gichohi-Wainaina, W.N.; Kumwenda, N.C.; Harry, M.; Matumba, L.; Njoroge, S.M.C.; Okori, P. Aflatoxin in Cereals and Groundnut from Small Holder Farming Households in Malawi. Food Addit. Contam. Part B Surveill 2022, 15, 266–274. [Google Scholar] [CrossRef]
- Seetha, A.; Munthali, W.; Msere, H.W.; Swai, E.; Muzanila, Y.; Sichone, E.; Tsusaka, T.W.; Rathore, A.; Okori, P. Occurrence of Aflatoxins and Its Management in Diverse Cropping Systems of Central Tanzania. Mycotoxin Res. 2017, 33, 323–331. [Google Scholar] [CrossRef]
- Ostadrahimi, A.; Ashrafnejad, F.; Kazemi, A.; Sargheini, N.; Mahdavi, R.; Farshchian, M.; Mahluji, S. Aflatoxin in Raw and Salt-Roasted Nuts (Pistachios, Peanuts and Walnuts) Sold in Markets of Tabriz, Iran. Jundishapur. J. Microbiol. 2014, 7, e8674. [Google Scholar] [CrossRef]
- Macri, A.M.; Pop, I.; Simeanu, D.; Toma, D.; Sandu, I.; Pavel, L.L.; Mintas, O.S. The Occurrence of Aflatoxins in Nuts and Dry Nuts Packed in Four Different Plastic Packaging from the Romanian Market. Microorganisms 2020, 9, 61. [Google Scholar] [CrossRef]
- AOAC 990.32-1990(1996), Aflatoxin B1 in Corn and Roasted Peanuts. Enzyme-Linked Immunosorbent (Agri-Screen) Screening Assay. Available online: http://www.aoacofficialmethod.org/index.php?main_page=product_info&cPath=1&products_id=797 (accessed on 3 November 2022).
- AOAC 990.34-1994(1996), Aflatoxins B1, B2, and G1 in Corn, Cottonseed, Peanuts, and Peanut Butter. Enzyme-Linked Immunosorbent (Immunodot Screen Cup) Screening Assay. Available online: http://www.aoacofficialmethod.org/index.php?main_page=product_info&cPath=1&products_id=47 (accessed on 3 November 2022).
- Anfossi, L.; Baggiani, C.; Giovannoli, C.; D’Arco, G.; Giraudi, G. Lateral-Flow Immunoassays for Mycotoxins and Phycotoxins: A Review. Anal. Bioanal. Chem. 2013, 405, 467–480. [Google Scholar] [CrossRef]
- Zhang, L.; Mazouzi, Y.; Salmain, M.; Liedberg, B.; Boujday, S. Antibody-Gold Nanoparticle Bioconjugates for Biosensors: Synthesis, Characterization and Selected Applications. Biosens. Bioelectron. 2020, 165, 112370. [Google Scholar] [CrossRef]
- Urusov, A.E.; Zherdev, A.V.; Dzantiev, B.B. Towards Lateral Flow Quantitative Assays: Detection Approaches. Biosensors 2019, 9, 89. [Google Scholar] [CrossRef]
- Li, R.; Meng, C.; Wen, Y.; Fu, W.; He, P. Fluorometric Lateral Flow Immunoassay for Simultaneous Determination of Three Mycotoxins (Aflatoxin B1, Zearalenone and Deoxynivalenol) Using Quantum Dot Microbeads. Microchim. Acta 2019, 186, 12. [Google Scholar] [CrossRef]
- Chen, Y.; Chen, Q.; Han, M.; Zhou, J.; Gong, L.; Niu, Y.; Zhang, Y.; He, L.; Zhang, L. Development and Optimization of a Multiplex Lateral Flow Immunoassay for the Simultaneous Determination of Three Mycotoxins in Corn, Rice and Peanut. Food Chem. 2016, 213, 478–484. [Google Scholar] [CrossRef]
- Hafez, E.; Abd El-Aziz, N.M.; Darwish, A.M.G.; Shehata, M.G.; Ibrahim, A.A.; Elframawy, A.M.; Badr, A.N. Validation of New ELISA Technique for Detection of Aflatoxin B1 Contamination in Food Products versus HPLC and VICAM. Toxins 2021, 13, 747. [Google Scholar] [CrossRef]
- Kumar, S.N.; Ahilan, A.; Fred, A.L.; Kumar, H.A. ROI Extraction in CT Lung Images of COVID-19 Using Fast Fuzzy C Means Clustering. In Biomedical Engineering Tools for Management for Patients with COVID-19; Academic Press: Cambridge, MA, USA, 2021; pp. 103–119. [Google Scholar] [CrossRef]
- Ziyaee, P.; Ahmadi, V.F.; Bazyar, P.; Cavallo, E. Comparison of Different Image Processing Methods for Segregation of Peanut (Arachis hypogaea L.) Seeds Infected by Aflatoxin-Producing Fungi. Agronomy 2021, 11, 873. [Google Scholar] [CrossRef]
- Valasi, L.; Georgiadou, M.; Tarantilis, P.A.; Yanniotis, S.; Pappas, C.S. Rapid Screening on Aflatoxins’ Presence in Pistachia Vera Nuts Using Diffuse Reflectance Infrared Fourier Transform Spectroscopy and Chemometrics. J. Food Sci. Technol. 2021, 58, 356–365. [Google Scholar] [CrossRef]
- Kos, G.; Sieger, M.; McMullin, D.; Zahradnik, C.; Sulyok, M.; Öner, T.; Mizaikoff, B.; Krska, R. A Novel Chemometric Classification for FTIR Spectra of Mycotoxin-Contaminated Maize and Peanuts at Regulatory Limits. Food Addit. Contam. Part A 2016, 33, 1596–1607. [Google Scholar] [CrossRef]
- Wu, Q.; Xie, L.; Xu, H. Determination of Toxigenic Fungi and Aflatoxins in Nuts and Dried Fruits Using Imaging and Spectroscopic Techniques. Food Chem. 2018, 252, 228–242. [Google Scholar] [CrossRef] [PubMed]
- Zhongzhi, H.; Limiao, D. Aflatoxin Contaminated Degree Detection by Hyperspectral Data Using Band Index. Food Chem. Toxicol. 2020, 137, 111159. [Google Scholar] [CrossRef]
- Ömer Barış, Ö. Development of a UV-Based Imaging System for Real-Time Detection and Separation of Dried Figs Contaminated with Aflatoxins. Tarım Bilim. Derg. 2014, 20, 302–316. [Google Scholar] [CrossRef]
- Yao, H.; Hruska, Z.; Kincaid, R.; Brown, R.; Cleveland, T.; Bhatnagar, D. Correlation and Classification of Single Kernel Fluorescence Hyperspectral Data with Aflatoxin Concentration in Corn Kernels Inoculated with Aspergillus Flavus Spores. Food Addit. Contam. Part A Chem. Anal. Control. Expo. Risk Assess 2010, 27, 701–709. [Google Scholar] [CrossRef]
- Hruska, Z.; Yao, H.; Kincaid, R.; Brown, R.; Cleveland, T.; Bhatnagar, D. Fluorescence Excitation-Emission Features of Aflatoxin and Related Secondary Metabolites and Their Application for Rapid Detection of Mycotoxins. Food Bioproc. Technol. 2014, 7, 1195–1201. [Google Scholar] [CrossRef]
- Paghaleh, S.J.; Askari, H.R.; Marashi, S.M.B.; Rahimi, M.; Bahrampour, A.R. A Method for the Measurement of in Line Pistachio Aflatoxin Concentration Based on the Laser Induced Fluorescence Spectroscopy. J. Lumin. 2015, 161, 135–141. [Google Scholar] [CrossRef]
- He, H.J.; Sun, D.W. Hyperspectral Imaging Technology for Rapid Detection of Various Microbial Contaminants in Agricultural and Food Products. Trends Food Sci. Technol. 2015, 46, 99–109. [Google Scholar] [CrossRef]
- Lee, K.M.; Davis, J.; Herrman, T.J.; Murray, S.C.; Deng, Y. An Empirical Evaluation of Three Vibrational Spectroscopic Methods for Detection of Aflatoxins in Maize. Food Chem. 2015, 173, 629–639. [Google Scholar] [CrossRef]
- Gao, J.; Zhao, L.; Li, J.; Deng, L.; Ni, J.; Han, Z. Aflatoxin Rapid Detection Based on Hyperspectral with 1D-Convolution Neural Network in the Pixel Level. Food Chem. 2021, 360, 129968. [Google Scholar] [CrossRef]
- Mishra, G.; Panda, B.K.; Ramirez, W.A.; Jung, H.; Singh, C.B.; Lee, S.H.; Lee, I. Application of SWIR Hyperspectral Imaging Coupled with Chemometrics for Rapid and Non-Destructive Prediction of Aflatoxin B1 in Single Kernel Almonds. LWT 2022, 155, 112954. [Google Scholar] [CrossRef]
- Soemantri, A.S.; Miskiyah; Juniawati; Diyono, W. Rapid Testing of Aflatoxin by Using Image Processing and Artificial Neural Network. IOP Conf. Ser. Earth Environ. Sci. 2019, 309, 012062. [Google Scholar] [CrossRef]


Disclaimer/Publisher’s Note: The statements, opinions and data contained in all publications are solely those of the individual author(s) and contributor(s) and not of MDPI and/or the editor(s). MDPI and/or the editor(s) disclaim responsibility for any injury to people or property resulting from any ideas, methods, instructions or products referred to in the content. |
© 2023 by the authors. Licensee MDPI, Basel, Switzerland. This article is an open access article distributed under the terms and conditions of the Creative Commons Attribution (CC BY) license (https://creativecommons.org/licenses/by/4.0/).
Share and Cite
Schincaglia, A.; Aspromonte, J.; Franchina, F.A.; Chenet, T.; Pasti, L.; Cavazzini, A.; Purcaro, G.; Beccaria, M. Current Developments of Analytical Methodologies for Aflatoxins’ Determination in Food during the Last Decade (2013–2022), with a Particular Focus on Nuts and Nut Products. Foods 2023, 12, 527. https://doi.org/10.3390/foods12030527
Schincaglia A, Aspromonte J, Franchina FA, Chenet T, Pasti L, Cavazzini A, Purcaro G, Beccaria M. Current Developments of Analytical Methodologies for Aflatoxins’ Determination in Food during the Last Decade (2013–2022), with a Particular Focus on Nuts and Nut Products. Foods. 2023; 12(3):527. https://doi.org/10.3390/foods12030527
Chicago/Turabian StyleSchincaglia, Andrea, Juan Aspromonte, Flavio A. Franchina, Tatiana Chenet, Luisa Pasti, Alberto Cavazzini, Giorgia Purcaro, and Marco Beccaria. 2023. "Current Developments of Analytical Methodologies for Aflatoxins’ Determination in Food during the Last Decade (2013–2022), with a Particular Focus on Nuts and Nut Products" Foods 12, no. 3: 527. https://doi.org/10.3390/foods12030527
APA StyleSchincaglia, A., Aspromonte, J., Franchina, F. A., Chenet, T., Pasti, L., Cavazzini, A., Purcaro, G., & Beccaria, M. (2023). Current Developments of Analytical Methodologies for Aflatoxins’ Determination in Food during the Last Decade (2013–2022), with a Particular Focus on Nuts and Nut Products. Foods, 12(3), 527. https://doi.org/10.3390/foods12030527