Article

Comparison and Intercorrelation of Various Bentonite Products for Oenological Properties, Elemental Compositions, Volatile Compounds and Organoleptic Attributes of White Wine

1
Institute of Horticulture, University of Debrecen, Böszörményi út 138, 4032 Debrecen, Hungary
2
Department of Genetics and Applied Microbiology, University of Debrecen, Egyetem tér 1, 4032 Debrecen, Hungary
3
Institute of Food Science, University of Debrecen, Böszörményi út 138, 4032 Debrecen, Hungary
4
Department of Physical Geography and Geoinformatics, University of Debrecen, Egyetem tér 1, 4032 Debrecen, Hungary
5
Eötvös Loránd Research Network (ELKH), Centre for Agricultural Research, Plant Protection Institute, 1022 Budapest, Hungary
*
Author to whom correspondence should be addressed.
Foods 2023, 12(2), 355; https://doi.org/10.3390/foods12020355
Submission received: 26 November 2022 / Revised: 5 January 2023 / Accepted: 9 January 2023 / Published: 11 January 2023
(This article belongs to the Section Drinks and Liquid Nutrition)

Abstract

:
Bentonite fining is one of the generally applied wine-making technological elements that may seriously affect wine components. The aim of this study was (i) to investigate the effect of 21 bentonite products on eight oenological parameters, 19 elements, 21 volatile organic compounds (VOCs) and 10 organoleptic properties of white wine; and (ii) to quantify intercorrelations among the parameters separately for each of the four quality attributes. Among oenological parameters, sugar, acidity, malic-, lactic-, citric acid and total phenol contents were significant among several bentonite products. The amounts of elements were the lowest in the control wine treatments (with exceptions of, e.g., Ni and Cu); and these values were significantly different from several bentonite products. The relative presence of the VOCs was above 100% for most VOCs, but it was below 100% for 1-propanol, 4-amino-1,5-pentandioic acid and butane-dioic acid, and diethyl ester in all treatments. For organoleptic parameters, the values of clearness, colour, flavour intensity and taste persistency was the lowest in the control wine treatment, while the values of flavour character, flavour quality, taste intensity, taste character, and overall harmony were the highest for the bentonite products of AP, EBE, M-SA, EBE, EBE, respectively. Results of correlation and factor analyses showed strong intercorrelative effects of bentonite fining on the four quality attributes. In conclusion, this study can help in the proper choice of a specific bentonite product in relation to complexity effects of bentonite fining.

1. Introduction

Wine contains numerous compounds, including polyphenols, elemental composition, and volatile organic compounds (VOCs) (e.g., [1]). Several studies have shown that moderate wine consumption has several positive effects on human health due to, e.g., phenolic compounds [2,3,4]. These compounds in wine can protect human health via anti-microbial, anticancer, cardioprotective, hepatoprotective and neuroprotective activities. The phenolic compounds of wine also have a key effect on the oenological parameters of the wine, but the sensory properties (e.g., colour, astringency and bitterness) are also directly influenced by the phenolic composition of the wine (e.g., [5,6,7,8]). The various chemical constituents of wine are among those most investigated features. Elemental composition directly influences the qualitative characteristics of the wine, such as total acidity, alcohol, dry extract and residual sugar [9]. Metals among elemental compositions also affect the organoleptic characteristics of wine [10]. In addition, the amount and type of VOCs may be affected by several factors, such as geographical origin, aging, alcoholic and acetic fermentation as well as technological processes [11,12]. The characterization of the volatile fraction helps to improve the quality of the wine product [12].
The bentonite fining of wine has been generally applied in the technology for a long time in order to eliminate thermolabile proteins, which cause haziness in wine [13]. These proteins are positively charged and easily react with the negatively charged particles of bentonite (mainly montmorillonite: Al2O3-4SiO2-H2O). This results in flocculation, followed by sedimentation. In this process, not only are the thermolabile proteins eliminated, but the mineral background and phenolic and volatile constituents also change. This process can be bentonite product-specific and may influence the terroir-character of the wine. Bentonite is one of the most efficient fining agents for reaching protein stability in wine; however, bentonite may influence seriously the quality of wine [14].
Among oenological parameters, previous studies showed various results on bentonite fining. For example, titratable acidity, ethanol, and tartaric acid contents were not different between the bentonite and control treatments. However, malic acid contents were significantly lower in the bentonite treatment compared to the control treatment during wine bottling [15], and in the study of Maslov-Bandic et al. [16] the sugar content was also significantly lower in the bentonite treatments compared to the control.
Previous studies showed that elemental compositions of wine were the most affected parameters during bentonite finings. In some cases, bentonite fining increased the amounts of some micro-elements in the wine, such as Na, Al and Ca [10,17,18,19,20] and Fe, Sr and Ba [21]. However in other cases, previous wine studies demonstrated that Cu, K and Zn contents [22] and also B content [23] decreased in the bentonite treatments compared to the control. The largest decrease was achieved for Cu (−43%) [22]. Previous results also showed that different bentonite products may cause various changes in the elemental composition of the wine, as bentonite quality (clearness, activity, absorption capacity and the surface of the particles) is dependent upon the place of origin [23,24,25]. As a consequence, bentonite fining not only influences the elemental composition of the wine but is a main source of mineral contamination too [22,23,26,27].
In the case of the VOCs, Horvat et al. [14] demonstrated that bentonite affected wine quality by changing some key fermentation volatiles compared to treatments without bentonite fining. Bentonite fining may reduce aroma and flavour compounds in the wine due to direct adsorption and deproteinization [28,29,30,31,32,33]. The VOCs loss was verified after multiple treatments in various wine types [32,34]. The results of Sanborn et al. [35] indicated that fining agents can perform unpredictably and may result in various levels of wine quality reductions. Several studies showed that the loss of VOCs in wine after bentonite treatments severely affects the sensory attributes of the wine too [28,29,32,33,34].
Overall, previous studies verified that bentonite fining affects many wine parameters including oenological, elemental, volatile and sensory attributes, but most studies measured only parts of the parameters and only few bentonite products; and therefore, an overall evaluation may help to better characterize the effect of a given bentonite product on wine quality.
Correlations among several wine attributes (including elemental, volatile, and sensory parameters) in bentonite treatments were investigated [16,21,36,37,38]. However, intercorrelation among the parameters were not shown in an overall evaluation with different wine attributes and large numbers of bentonite products, which may give a better understanding of the relationship between the bentonite fining process and wine quality changes.
The aim of this study was firstly to investigate the effect of twenty-one bentonite products together with three control treatments on eight oenological parameters, nineteen elements, twenty-two VOCs and ten organoleptic properties of white wine that originated from the Eastern Hungarian wine regions (Debrecen, Hajdú-Bihar county); and secondly to quantify intercorrelations (Pearson correlation, factor analyses) among the parameters separately for oenological, elemental, volatile, and organoleptic properties in order to highlight the best relationships of the correlated measures.

2. Materials and Methods

2.1. Experimental Design: Wine Material, Bentonite Products and Treatments

The examined wine was made from varieties of ‘Bianca’ (70%), ‘Furmint’ plus ‘Harslevelű’ (30%). The plantation was established in 1998 in the Experimental Horticultural Station, University, Debrecen-Pallag (47°35′20”/21°38′23”; 128 m above sea level). Harvest was carried out in late September, 2017. The wine for the experiment was prepared from the three varieties as follows. The harvested grape was cooled down to 12 °C before processing, then 100 mg/kg potassium metabisulphite was sprinkled into the grapes during the processes of crushing and destemming. Pressing started immediately after destemming, and 2 g/10 L yeast was added a day later (Mycoferm A-R-T, Interker-Wein, Eger, Hungary). Decantation was not applied because the grapes were clean and healthy. After the start of the fermentation process at 20 °C, the wine must in 11 × 120-litre plastic casks was transported to a cooling chamber at 12 °C. The fermentation process ended after three weeks. At the end, to support the completion of sugar degradation, the plastic casks were placed at 15 °C. Within a week, the wine was racked open with the joint application of sulfitization (50 mg/L, with SO2 solution, Interker-Wein, Eger, Hungary), and the casks were filled up with minimal air lock. The base wine was put together into an IBC plastic container in the middle of December (2017) with open racking and the addition of 30 mg/L supplementary sulfitization. Fining was performed in spring 2018 and then bentonite fining treatments were performed.
To perform the treatments, 20 L of wine samples were racked into 30-litre plastic drums, which were fined with medium doses of 18 bentonite products according to producers’ recommendations (Table 1). The experimental design also included three control treatments (C, SC, SMC) in order to represent the complexity of the procedure (Table 1). C treatment contains only the wine sample and did not get any additional amendments. SC treatment contains the wine sample with 10 mg/L sulfitization. Sulfitization was applied to counterbalance the oxidation in the wine. In the SMC treatment, apart from the sulfitization a mixing was applied with the same speed and timing as in the bentonite product treatments (full rotation with 30 s). Assays were carried out in triplicate.
Preparation of bentonite treatments was as follows: each bentonite product was previously hydrated according to the producers’ instructions. Prepared products were mixed into the wine with a drill mixer for 30 s with full rotation besides intensive aeration. After the collapse of the foam (some minutes), the solutions were racked into new glass jugs previously rinsed with hot tap water (measure of capacity: 15 L). Then 10 mg/L sulfitization was applied at racking. Jugs were closed with plastic caps with no headspace over the wine and were put into a cool chamber set to 12 °C. According to the concept of the trial, wine was left over the bentonite sediment. The wine samples were taken two weeks after bentonite treatments. Dissolved oxygen was measured with a HI 9146 equipment (HANNA Instruments Service Ltd., Szeged, Hungary) before bottling of the wine samples (Table 1).

2.2. Mesurements

All measurements were prepared according to the European Commission Regulation (EEC) No. 2676/90.

2.2.1. Oenological Parameters

Eight oenological parameters (ethyl-alcohol, sugar, total acidity, tartaric acid, malic acid, lactic acid, citric acid, volatile acid and total phenol) of the white wine sample of the twenty-one treatments were determined according to the official standards of the International Organisation of Vine and Wine [33]. Parameters were measured in three replicates. Ethyl-alcohol content was expressed as v/v%. Sugar, total acidity, tartaric acid, malic acid, lactic acid, citric acid, and volatile acid contents was given as g/L and total phenol contents as mg/L.

2.2.2. Elemental Composition

Quantities of eight macro- and meso elements (P, K, Ca, Mg, S, Al, Na, and B) and eleven micro elements (Cr, Mn, Fe, Co, Ni, Cu, Zn, Sr, Cd, Ba, and Pb) were determined and expressed in mg/L and µg/L, respectively, from the white wine samples treated with twenty-one bentonite products, including three control treatments. Elemental composition was determined with ICP OES and ICP MS, similarly to the study of Rakonczás et al. [21]. Briefly the used determination method was the following. Before the analysis, wine samples were diluted ten-fold with 5 (m/V) % nitric acid (VWR International Ltd., Debrecen, Hungary). A deionized water type-1 grade was used by using a Milli-Q® water purification system (Merck-Millipore, Molsheim, France). Three replicates were analyzed from each sample. The elemental analysis was measured by an iCAP 6300 ICP-OES instrument equipped with a CETAC ASX-520 autosampler and by a Meinhard-type concentric nebulizer attached to a cyclonic spray chamber (Thermo Fischer Scientific, Cambridge, UK). All measurements were made in axial-mode. An external calibration was made for the element quantification. A multi-element solution was made from mono-element standards using a 1000 mg/L solution in 2% nitric acid (Scharlab, Sentmenat, Spain). This solution was used as a stock solution and used to construct calibration curves for appropriate dilutions. Each sample was measured in three replicates.

2.2.3. Volatile Organic Compounds (VOCs)

Twenty-two VOCs were determined from the white wine samples in the twenty-one bentonite product treatments, including three control treatments (Table 2). The profile of the VOCs in each wine sample was determined by a Bruker Scion 456-gas chromatograph equipped with a Bruker SHS-40 Headspace Sampler (Bruker Corporation, Billerica, MA, USA). The equipment was supplemented with a Bruker SQ mass spectrometer and with a Br-5 capillary column (30 m 0.25 mm i. d. 1.0 µm film thickness).
Helium was used as a carrier gas, applied in a constant flow mode with a flow rate of 1 mL/min. In the headspace vials, 5000 µL solution samples were applied at 60 °C for 20 min. in the automatic sampler with added sodium chloride (1 g) and with no agitation, and then 1000 µL headspace sample was injected into the column. The transfer line was maintained at 230 °C, and the injector temperature was 250 °C (20:1 split time ratio). The initial temperature of the oven was 40 °C, held for 2 min. Then the temperature was increased to 280 °C at 10 °C min−1, and this temperature was held for 3 min. Electron impact ionisation mode (70 eV) was applied for the mass spectrometer with a source temperature of 180 °C, with a scanning rate of 1 scan per second, and with a full scan mode. Mass spectrometric data were used for the identification of the VOCs (National Institute of Standards and Technology (NIST), version 2005, mass spectral library). A semi-quantitative analysis was performed to identify VOCs. In the analysis, changes in volatile compounds caused by bentonite products were more essential for our study than the exact concentration of volatile compounds. Therefore, the relative presence of VOCs is expressed in the percentage of control (C) treatment.

2.2.4. Organoleptic Evaluation

The organoleptic evaluation of the wine samples in the twenty-one bentonite product treatments was performed according to OIV 332A/2009 resolution. The procedure of organoleptic evaluation of the wine samples was made by a panel of 14 trained students between the ages of 20 and 24 (University Debrecen, Hungary) according to Jackson [39] and Hopfer & Heymann [40]. The panel members took part in a one-semester theoretical and practical course including 3 h theory and 3 × 4 h thematic wine-tasting occasions: white wine, red wine, technological wines and wines of the world. The environmental, material and personal conditions during the sensory evaluation were created taking into account the MSZ 9462-81 standard. Written consent and ethics approval were arranged for the organoleptic assessments. All evaluations were done independently and in three replicates. Each panel member was asked to evaluate clearness, colour, flavour intensity, flavour character, flavour quality, taste intensity, taste character, taste quality, taste persistency, and overall harmony. The assessment guide, containing a scale for each organoleptic parameter, including the two anchors, was as follows: skin and flesh colour: 0 = unacceptable, 9 = excellent; flavour intensity and character: 0 = very weak, 8 = very strong; flavour quality: 0 = unacceptable and 15 = excellent; taste intensity, character and persistency: 0 = very bad, 8 = excellent; taste quality: 0 = very bad, 20 = excellent and overall harmony: 0 = unacceptable, 10 = excellent.

2.3. Data Analyses

2.3.1. ANOVA

For oenological, elemental, volatile, and organoleptic measure types, a randomized complete block design (RCBD) was used to design the bentonite treatments. ANOVA was performed to analyze the data set of all measurements in the four measurement types using an SPSS 19 program (SPSS Inc., Chicago, IL, USA). The effects of twenty-one bentonite product treatments including the three control treatments were evaluated on all measurements of the oenological, elemental, volatile, and organoleptic measure types. The LSD t-test was used to separate treatment means at p = 0.05 levels.

2.3.2. Pearson Correlation Analyses

The relationship among the measurements was quantified separately for oenological, elemental, volatile, and organoleptic measure types. In order to quantify relationships among the measurements, Pearson’s correlation coefficients were determined for the relationships of the measures of the four measure types in all combinations (55, 154, 214, and 46 variable pairs for oenological, elemental, volatile, and organoleptic measure types, respectively. Pearson’s correlation analyses were done by using Genstat 5 Release 4.1 (Lawes Agricultural Trust, IACR, Rothamsted, UK).

2.3.3. Principal Axis Factor Analyses with Varimax Rotation

Factor analysis using Genstat 5 Release 4.1 (Lawes Agricultural Trust, IACR, Rothamsted, UK) was done separately for oenological, elemental, volatile, and organoleptic measure types. The aim of factor analyses was to select those measurements that can characterize the best white wine in the bentonite product treatments. In a factor analysis model, each measurement is represented as a linear equation of n hypothetical factors, f1, f2, f3, … fn:
Mi = ai1f1 + ai2f2 + ai3f3 and + … + aijfj + Ri,
where Mi is the ith measurement (e.g., M1 = ethyl-alcohol content); fj is the jth factor; aij is the factor loading representing the correlation of the measurement i with factor j; and Ri represents a residual component not accounted for by the factors. A principal axis procedure was used to calculate factor loadings followed by a Varimax rotation according to the study of Kaiser [41]. Four factors were presented and significant factor loadings were highlighted separately for the four measure types. Biplot diagrams were also prepared to visualise the first two factors (Factor 1 vs. Factor 2) with the distributions of the measure types and bentonite products. The biplot diagrams were performed separately for oenological, elemental, volatile, and organoleptic measure types with the statistical package of R 1.3.30 [42] with the MultBiplotR [43].

3. Results

3.1. Oenological Parameters

Oenological parameters characterized a dry white wine (mean residual sugar content: 0.57 g/L) with a mild, intermediate acidity (mean titratable acid content: 6.11 g/L) and considerably high ethyl-alcohol content (mean ethyl-alcohol content: 12.05 v/v%) (Table 3). Among the eight oenological parameters, ethyl-alcohol, tartaric acid and volatile acid contents were non-significant among the bentonite product treatments including control treatments (Table 3). The lowest sugar content of the sampled wine (0.4 g/L) was measured in NCPE and the highest (1.2 g/L) in SC (Table 3). The sugar content of the sampled wine was 0.5 and 0.6 g/L for the bentonite products with the exceptions of EBS, NCPE, and EG products (Table 3). The lowest titratable acidity was measured in the C treatment (5.6 g/L) and the highest (6.2 g/L) in SMC treatment. The lowest total phenol was measured in the SC treatment (10.2 mg/L) and the highest (21.0 mg/L) in C. Values in the treatments of bentonite products ranged between 6.01 and 6.19 g/L for titratable acidity and between 16.4 and 18.0 mg/L for total phenol (Table 3). The largest values were 2.1 g/L in SC treatment for malic acid, 1.6 g/L in C treatments for lactic acid and 0.49 g/L in SC treatment for citric acid.

3.2. Chemical Elements

3.2.1. Macro- and Meso Elements

The amounts of measured macro- and meso elements in the sampled wine were the lowest in the control (C) treatments (Table 4).
P contents of the sampled wine were 66.7, 74.9 and 73.6 mg/L in the C, SC, and SMC treatments, respectively, and ranged between 70.1 and 75.9 mg/L in the eighteen bentonite product treatments (Table 4). The P content in all bentonite product treatments was significantly higher than in the control (C) treatment, with the exception of P and GPT treatments.
K contents of the sampled wine were 432.7, 470.5 and 479.3 mg/L in the C, SC, and SMC treatments, respectively, and ranged between 466.3 and 496.2 mg/L in the eighteen bentonite product treatments (Table 4). The K content in all bentonite product treatments was significantly higher than in the control (C) treatment.
Ca contents of the sampled wine ranged between 41.22, 41.87 and 45.81 mg/L in the C, SC, and SMC treatments, respectively, and three values were not significantly different from each other (Table 4). The Ca values of the eighteen bentonite product treatments ranged between 47.02 and 53.3 mg/L (Table 4), and all bentonite product treatments were significantly higher than in the control (C) and sulfur content (SC) treatments.
Mg content of the sampled wine ranged between 41.8 and 47.3 mg/L in the twenty-one treatments including the three control treatments (Table 4). Mg values of all eighteen bentonite treatments were significantly different from Mg values of the control (C) treatment (Table 4).
S content of the sampled wine was the lowest in the C treatment (5.845 mg/L) and the highest in the NCPE treatment (9.181 mg/L); and the highest value was significantly different from S values of all treatments, with the only exceptions being AP and EBE treatments. S content ranged between 5.845 and 6.955 mg/L in the three control treatments (C, SC, and SMC), and the C values were significantly different from the SC treatment (Table 4). The S values of the eighteen bentonite product treatments ranged between 6.091 and 9.181 mg/L (Table 4), and S values of most bentonite product treatments were significantly higher than in the control (C) except for FB, EC, EB, B, GTP, P and EG treatments.
Al and Na contents of the sampled wine were 0.27, 0.296 and 0.302 mg/L, and 7.75, 8.82 and 8.63 mg/L, respectively (Table 4). Al contents in the three control treatments were significantly different from the eighteen bentonite product treatments with the exceptions of M-SA, CR, EB, P and EG treatments. Na contents in the FB, BW, GTP and EBS treatments were significantly higher than the Na content values in the three control treatments, and the Na content values of the FB, BW and GTP treatments were at least twice higher compared to the three control treatments (Table 4).
B content of the sampled wine ranged between 0.526 and 0.603 mg/L in the twenty-one treatments (Table 4). The B content in the M-SA treatment (0.603 mg/L) was significantly different only from the control (C) treatment (0.526 mg/L), and all other treatments were non-significant from each other (Table 4).

3.2.2. Micro Elements

Cr, Fe and Co contents of the sampled wine were 1.58, 1.71 and 1.63 µg/L, 1047, 1111 and 1105 µg/L, and 1.56, 1.69 and 1.72 µg/L in the C, SC, and SMC treatments, respectively, (Table 5). Cr and Co contents (2.85 and 2.86 µg/L, respectively) were the highest in the FB treatment while the Fe content (2132 µg/L) was the highest in the BW treatment. The highest Cr content in the FB treatment was significantly higher than all other treatments, with the exception of the BW treatment. The highest Co content in the FB treatment was significantly higher than all other treatments with the exceptions of the BW and EO treatments. The highest Fe content in the BW treatment was significantly higher than all other treatment (Table 5).
Mn contents of the sampled wine were 725.7, 747.4 and 741.2 µg/L in the C, SC, and SMC treatments, respectively, and ranged between 718.5 and 886.2 µg/L in the eighteen bentonite product treatments (Table 5). The Mn content was the highest in the AP treatment, which was significantly higher than all other treatments with the exceptions of the NCPE, GPT, and EBE treatments.
Ni contents were the lowest in the C and SMC treatments (12.5 and 13.7 µg/L, Table 5). The highest Ni value was in the FB treatment (17.9 µg/L); however, this value was not significantly different from those of several treatments (M-SA, NCPE, CR, BW, B, GPT, EO, BCD, and BF).
The Cu contents of the sampled wine ranged widely in the twenty-one treatments (values ranged from 6.42 to 23.2 µg/L, Table 5). Cu content was the lowest (6.42 µg/L) in the GTP treatment, and this value was significantly lower than in all other treatments. The highest Cu content (23.2 µg/L) was in the sulfur control (SC) treatment, and this value was significantly higher than in all other treatments (Table 5).
The Zn contents of the sampled wine ranged between 209.5 and 263.5 µg/L (Table 5). The Zn content was the lowest (209.5 µg/L) in the control (C) treatment, and this value did not significantly differ from values in the EC, BW, P and EG treatments. The highest Cu content (263.5 µg/L) was in the M-SA treatment, and this value was significantly higher than in the C, EC, BW, P, and EG treatments (Table 5).
The Sr contents of the sampled wine ranged between 316.2 and 431.3 µg/L (Table 5). The Sr content was the lowest (316.2 µg/L) in the control (C) treatment, and this value did not significantly differ from values in the SC, SMC, M-SA, EB, P, and EG treatments. The highest Sr content (431.3 µg/L) was in the NCPE treatment, and this value was significantly higher compared to values of all treatments except for the treatments of GTP and BCD (Table 5).
Among the micro-elements, Cd contents of the sampled wine was the lowest (between 0.198 and 0.413 µg/L) (Table 5). The Cd content was the lowest (0.198 µg/L) in the control (C) treatment, and this value did not significantly differ from values in the SC, SMC, EBS, M-SA, EC, EBS, FB, EC, EB, AP, N, EO, P, and EG treatments. The highest Cd content (0.413 µg/L) was in the CR treatment, and this value was significantly higher compared to values of all treatments except for the treatments of M-SA, NCPE, BW, B, GTP and BCD (Table 5).
Ba contents of the sampled wine ranged between 39.67 and 81.95 µg/L (Table 5). The Ba content was the lowest (39.67 µg/L) in the control (C) treatment, and this value did not significantly differ from values in the SC, M-SA, P, and EG treatments. The highest Ba content (81.95 µg/L) was in the CR treatment, and this value was significantly higher than the values of all treatments (Table 5).
Pb contents of the sampled wine ranged between 2.27 and 9.46 µg/L (Table 5). The Pb content was the lowest (2.27 µg/L) in the control (C) treatment, and this value did not significantly differ from values in the SC, SMC, M-SA, EB, and EG treatments. The highest Pb content (9.46 µg/L) was in the CR treatment, and this value was significantly higher than the values of all treatments (Table 5).

3.3. Volatile Organic Compounds (VOCs)

The relative presence of the twenty-two VOCs, expressed in the percentage of control (C) treatment, ranged from 18.5 to 169.8% (Table 6). The lowest percentage (18.5%) was detected for the VOCs of phenol, 2-methoxy- in the EO treatment, while the highest (169.8%) was for acetic acid in the CR treatment. The VOCs of ‘phenol, 2-methyl-‘, ‘butanedioic acid, diethyl ester’, ‘δ-dodecalactone’, ‘1-propanol, 2-methyl-‘, and ‘octanoic acid, ethyl ester’ were not detected in seven (FB, M-SA, NCPE, BW, EB, EO, BF) five (FB, EB, N, EO, P), three (FB, EO, EG), one (GPT), and one (EO) treatments, respectively. The lowest number of VOCs (18) were detected in the EO treatment (Table 6).
The relative presence of the VOCs was below 100% for ‘1-propanol’, ‘4-amino-1,5-pentandioic acid’ and ‘butanedioic acid, diethyl ester’ in all bentonite treatments (Table 6). The relative presence of the VOCs was above 100% for ‘acetic acid’, ‘ethyl acetate’, ‘1-propanol, 2-methyl-‘, ‘δ-dodecalactone’, ‘propanoic acid, ethyl ester’, ‘1,3-dioxolane, 2,4,5-trimethyl-‘, ‘1-butanol, 3-methyl-‘, ‘1-butanol, 2-methyl-, (S)-‘, ‘propanoic acid, 2-methyl-, ethyl ester’, ‘isobutyl acetate’, ‘triethyl borate’, ‘butanoic acid, ethyl ester’, ‘1-hexanol’, ‘1-butanol, 3-methyl-, acetate’, ‘hexanoic acid, ethyl ester’, ‘phenol, 2-methyl-‘, ‘phenol, 2-methoxy-‘, ‘phenylethyl alcohol’ and ‘octanoic acid, ethyl ester’ in five (SMC, CR, BW, AP, EBE), five (SC, SMC, N, GPT, BCD), four (SC, SMC, NCPE, BCD), four (NCPE, CR, AP, N), two (NCPE, GPT), one (GPT), four (SC, SMC, NCPE, BCD), four (SC, SMC, NCPE, BCD), one (GPT), four (SC, SMC, NCPE, N, BCD), six (NCPE, EC, BW, AP, BCD, EBE), four (SC, SMC, N, GPT), one (SC), three (SMC, N, GPT), two (NCPE, N), three (SC, SMC, BCD), four (SC, EC, GPT, BCD), four (SC, EBS, BW), and three (SMC, NCPE, GPT) treatments, respectively. The highest numbers of VOCs (10), above 100% relative presence, were detected in the SMC treatment (Table 6).
The relative presence of the VOCs of ‘1-propanol’ in the control (C) treatment was significantly higher than the values in the FB, B, GPT, EO, P, and BF treatments (Table 6). The relative presence of the VOCs of ‘acetic acid’ in the C treatment was significantly lower than the values in the CR and AP treatments. The relative presence of the VOCs of ‘ethyl acetate’ in the C treatment was significantly higher than the values in the FB, EB, B, EO, and BF treatments. The relative presence of the VOCs of ‘1-propanol, 2-methyl-‘ in the C treatment was significantly higher than the values in the FB, M-SA, CR, EB, B, EO, P and BF treatments. The relative presence of the VOCs of ‘δ-dodecalactone’ in the C treatment was significantly lower than the values in the NCPE treatment. The relative presence of the VOCs of ‘propanoic acid, ethyl ester’ in the C treatment was significantly higher than the values in the FB, M-SA, EC, BW, CR, EB, B, EO, P, EG and BF treatments. The relative presence of the VOCs of ‘1,3-dioxolane, 2,4,5-trimethyl-‘ in the C treatment was not significantly different from the values of the SC, SMC, NCPE, N, GPT, and BCD treatments. The relative presence of the VOCs of ‘1-butanol, 3-methyl-‘ in the C treatment was significantly higher than in the FB, M-SA, EB, B, EO, P, EG, and BF treatments. The relative presence of the VOCs of ‘1-butanol, 2-methyl-, (S)-‘ in the C treatment was significantly lower than in the SC, SMC, NCPE and BCD treatments. The relative presence of the VOCs of ‘4-amino-1,5-pentandioic acid’ in the C treatment was not different significantly from in the SC, SMC, N, GPT, EO and BCD treatments. The relative presence of the VOCs of ‘propanoic acid, 2-methyl-, ethyl ester’ in the C treatment was significantly higher than in the FB, EC, CR, EB, AP, B, EO, P, EG, and BF treatments (Table 6).
The relative presence of the VOCs of ‘isobutyl acetate’ in the C treatment was significantly higher than in the FB, BW, and EO treatments (Table 6). The relative presence of the VOCs of ‘triethyl borate’ in the C treatment was significantly higher than in the SC, FB, EB, B, EO, P, EG and BF treatments. The relative presence of the VOCs of ‘butanoic acid, ethyl ester’ in the C treatment was significantly higher than in the FB, M-SA, EB, EO and BF treatments. The relative presence of the VOCs of ‘1-hexanol’ in the C treatment was not different significantly from that in the SC, SMC, NCPE, BW, AP, N, GPT, BCD, and EBE treatments. The relative presence of the VOCs of ‘1-butanol, 3-methyl-, acetate’ in the C treatment was significantly higher than in the EB, B, EO, EG and BF treatments. The relative presence of the VOCs of ‘hexanoic acid, ethyl ester’ in the C treatment was significantly higher than in the FB, M-SA, EB, AP, EO, P, EG and BF treatments. The relative presence of the VOCs of ‘phenol, 2-methyl-‘ in the C treatment was significantly higher than in the EC, CR, AP, B, N, P and EG treatments. The relative presence of the VOCs of ‘phenol, 2-methoxy-‘ in the C treatment was significantly higher than in the EBS, FB, M-SA, NCPE, CR, BW, EB, N, EO, P and BF treatments. The relative presence of the VOCs of ‘phenylethyl alcohol’ in the C treatment was not significantly different from that in the SC, SMC, EBS, BW, N, P and EBE treatments. The relative presence of the VOCs of ‘butane-dioic acid, diethyl ester’ in the C treatment was significantly higher than that in the M-SA, NCPE, EC, CR, AP, B, GPT, EG and BF treatments. The relative presence of the VOCs of ‘octanoic acid, ethyl ester’ in the C treatment was significantly higher than in FB, EC, EB, B, EG and BF treatments (Table 6).

3.4. Organoleptic Parameters

Clearness indices of the sampled wine ranged between 3.23 and 4.62; the lowest value was obtained in the CR and FB treatments and the highest in the EBE treatment (Table 7). The lowest clearness index was not significantly different from the values of the SC, M-SA, NCPE and N treatments. However, the highest clearness index was significantly higher than in all other treatment.
Colour indices of the sampled wine ranged between 7.54 and 8.62; the lowest values were obtained in the SC, FB, CR and N treatments and the highest in the EBE treatment (Table 7). The lowest colour index was significantly different from values of BW, GPT and EBE treatments.
Flavor intensity indices of the sampled wine ranged between 4.77 and 6.15; the lowest value was obtained in the M-SA treatment and the highest in the BF treatment (Table 7). The lowest flavour intensity index was not significantly different from values of SMC and EC treatments. The highest flavour intensity index was significantly higher than in all other treatments with the exceptions of the SC, EBS, BW, EB, AP and EO treatments.
Flavor character indices of the sampled wine ranged between 3.54 and 4.52; and the lowest value was obtained in the EBE treatment and the highest one in the AP treatment (Table 7). The lowest flavour character index was not significantly different from values of SMC, M-SA, EC, B, N, BCD and EBE treatments. The highest flavour character index was significantly higher than in all other treatments with the exceptions of the C, SC, BW and BF treatments.
Flavor quality indices of the sampled wine ranged between 10.62 and 12.46; the lowest value was obtained in the EBE treatment and the highest in the EB and AP treatments (Table 7). The lowest flavour quality index was not significantly different from the values of the FB and M-SA treatments. The highest flavour quality index was significantly higher than the values of the FB, M-SA, EC, EG and EBE treatments.
Taste intensity indices of the sampled wine ranged between 5.62 and 6.46; the lowest value was obtained in the M-SA treatment and the highest in the SC treatment (Table 7). The lowest taste intensity index was significantly lower than the values of the SC, SMC, CR, EB, AP, B, GPT, EO, BCD and BF treatments. The highest taste intensity index was significantly higher than the values of the FB, M-SA, NCPE, N and EBE treatments.
Taste character indices of the sampled wine ranged between 3.77 and 5.77; the lowest value was obtained in the EBE treatment and the highest in the SC treatment (Table 7). The lowest taste intensity index was not significantly different from the values of the C, EBS, FB, M-SA, NCPE, EC, N, EO, P, BCD and EG treatments. The highest taste character index was significantly higher than the values of all other treatments.
Taste quality indices of the sampled wine ranged between 14.62 and 16.92; the lowest value was obtained in the FB treatment and the highest in the SMC and BF treatments (Table 7). The lowest taste intensity index was not significantly lower than the values of the SC, EBS, M-SA, NCPE, EC, CR, N, P, BCD and EBE treatments. The highest taste quality index was not significantly higher than the values of the EB, AP, B, EO and EG treatments.
Taste persistency indices of the sampled wine ranged between 5.62 and 6.23; the lowest values were obtained in the C, FB, M-SA, and NCPE treatments and the highest in the SC treatment (Table 7). The lowest taste persistency index was significantly lower than the values of the SC, SMC, EB and AP treatments. The highest taste persistency index was significantly higher than the values of the C, FB, M-SA, and NCPE treatments.
Overall harmony indices of the sampled wine ranged between 8.46 and 9.54; the lowest value was obtained in the EBE treatment and the highest in the AP treatment (Table 7). The lowest overall harmony index was significantly lower than the values of the SMC, EB, AP and BF treatments. The highest overall harmony index was significantly higher than the values of the FB, M-SA, EC and P treatments.

3.5. Relationship among Parameters

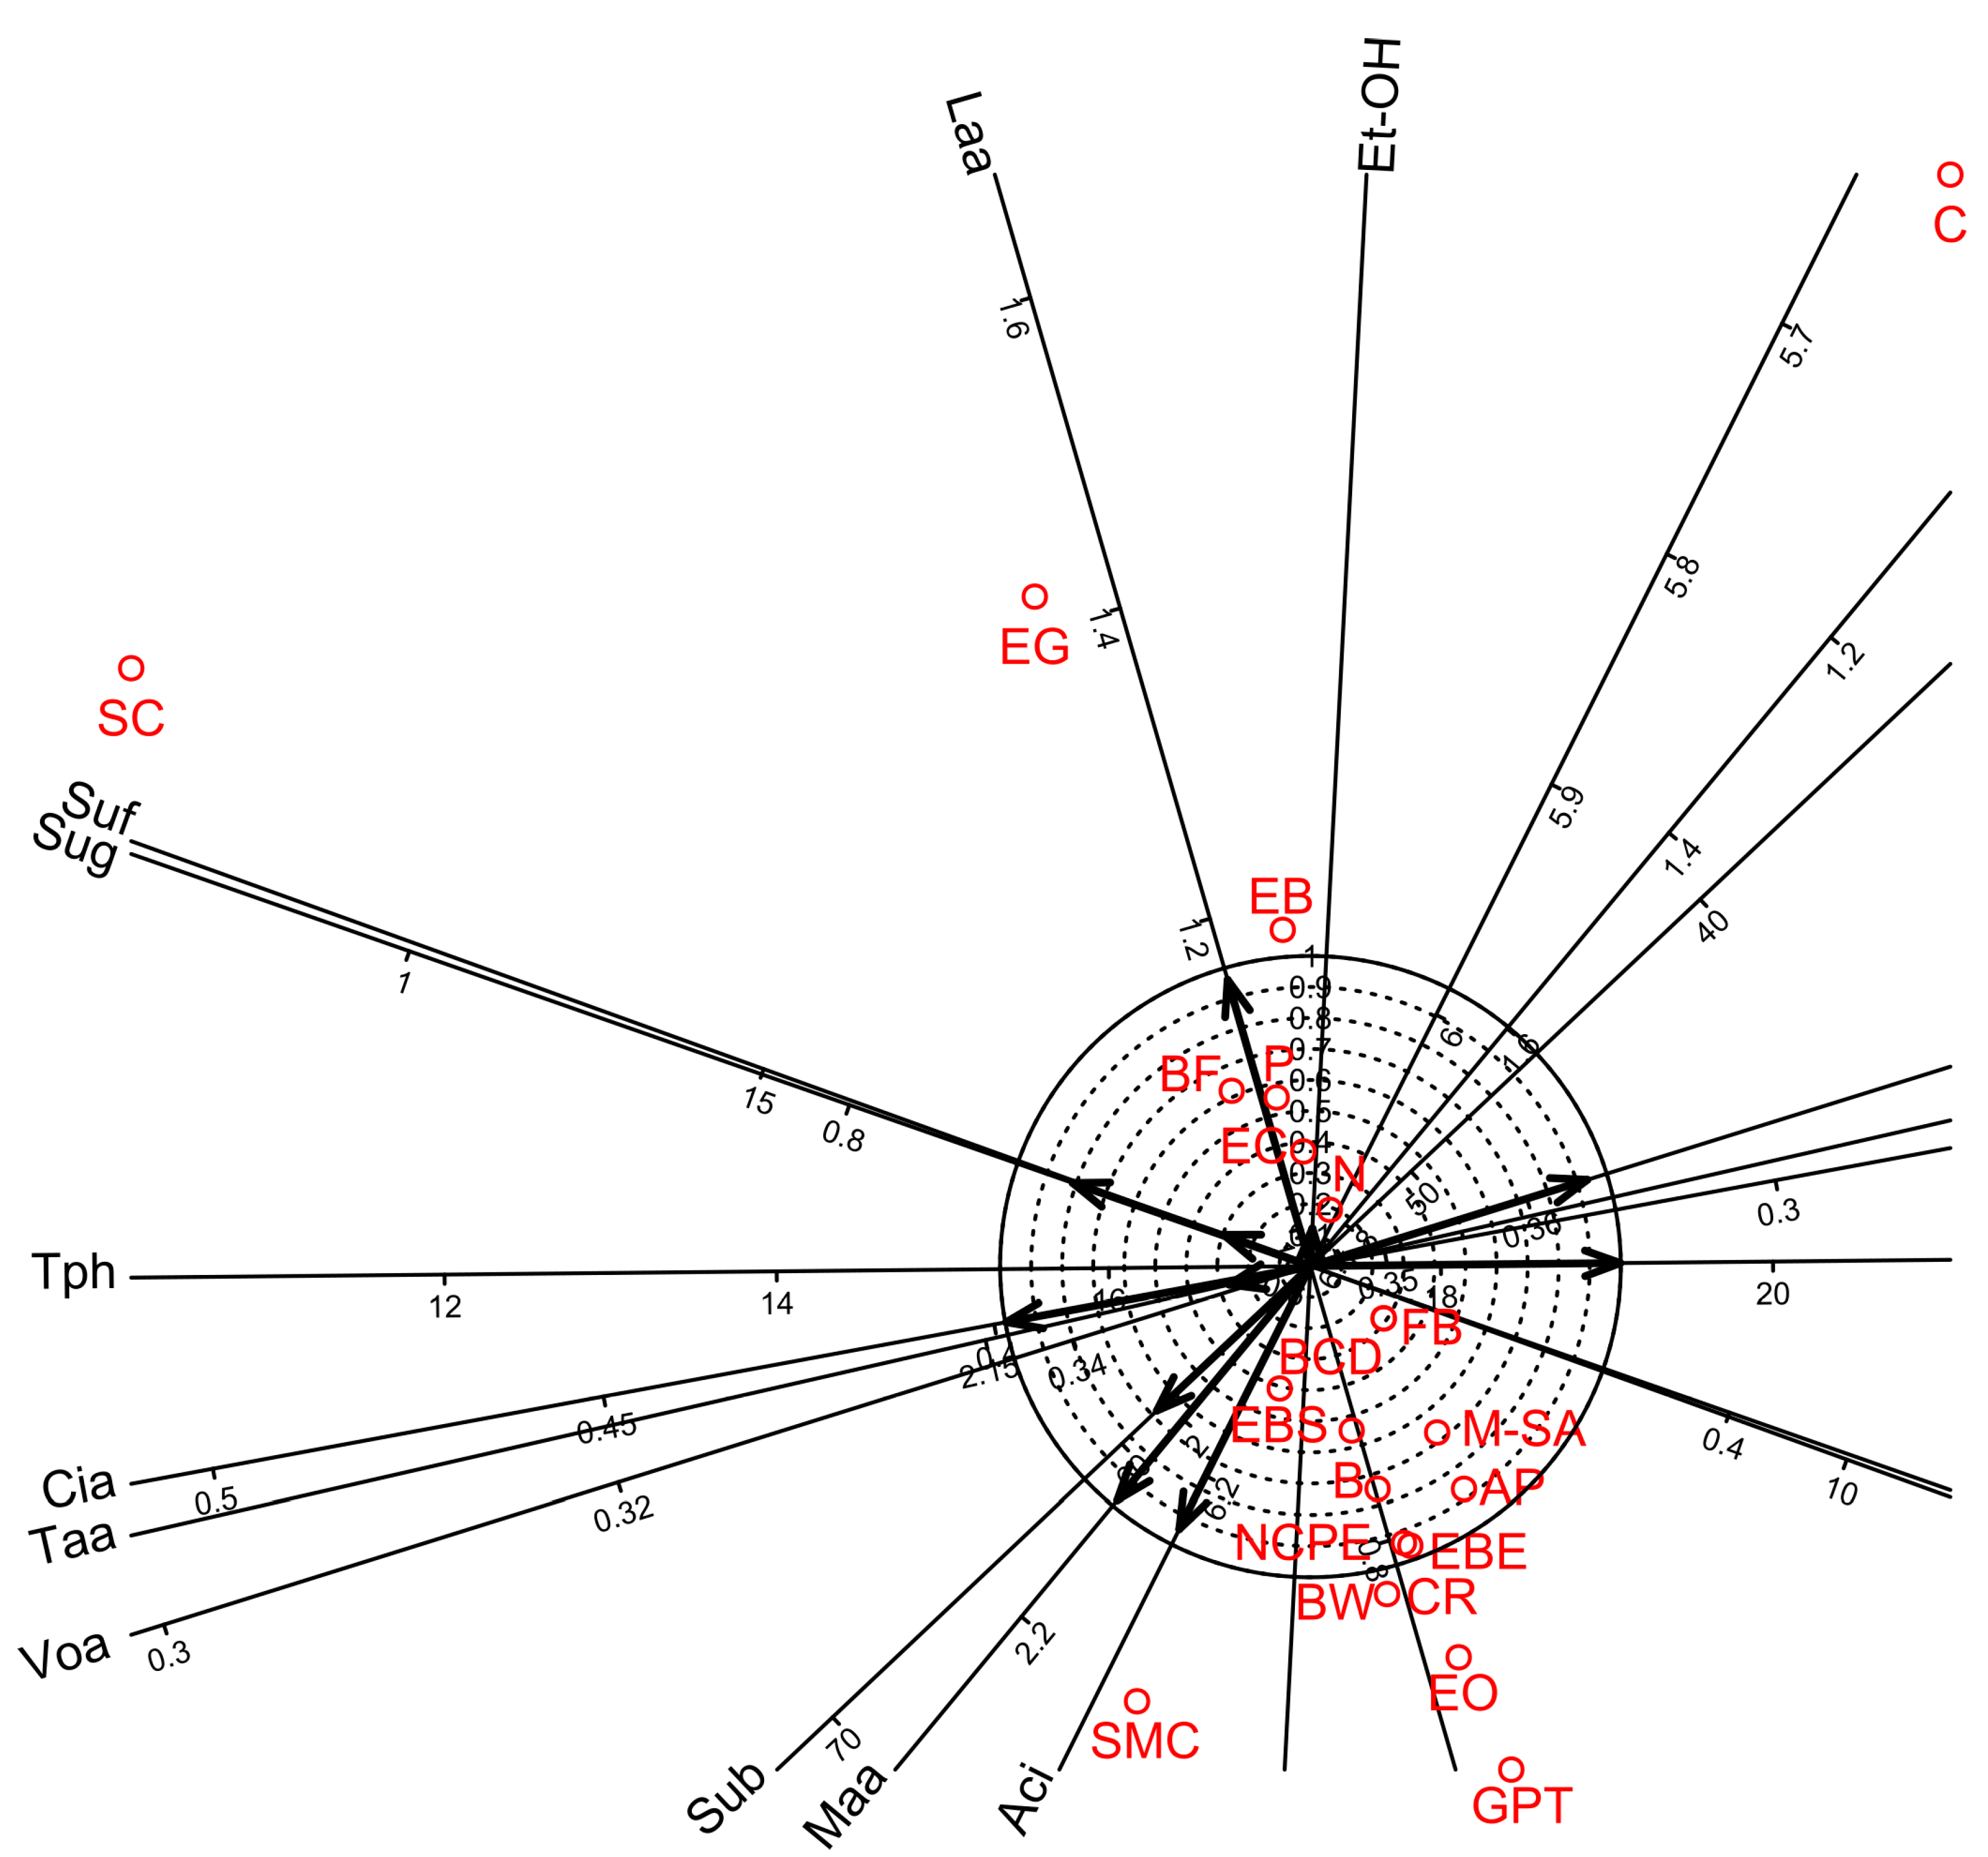
3.5.1. Pearson Correlation and Factor Analyses for Oenological Parameters

When the oenological parameters data set were analyzed for all bentonite products together, 55 parameter pairs were correlated. Of the 55 pairs, 18 correlated significantly at p = 0.05 probability level (Table 8). Among these 18 pair-variables, nine were correlated positively (alcohol versus (vs.) tartaric acid, sugar vs. citric acid, acidity vs. malic acid, acidity vs. citric acid, acidity vs. sulphur-bound, malic acid vs. citric acid, malic acid vs. sulphur-bound, citric acid vs. sulphur-bound and volatile acid vs. total phenol) and nine negatively (sugar vs. volatile acid, sugar vs. total phenol, acidity vs. lactic acid, acidity vs. volatile acid, malic acid vs. volatile acid, malic acid vs. total phenol, citric acid vs. volatile acid, citric acid vs. total phenol and volatile acid vs. sulphur-bound) indicating a strong connection among basic parameters (Table 8).
Factor analyses for the oenological parameters showed that four factors were sufficient to account for 92.0% of the total variance. Factor 1 accounted for 45.4% of the total variance (Table 9) and showed strong significant correlations for seven parameters. Among these seven parameters, five showed high positive loadings (sugar, acidity, malic acid, citric acid, and sulphur-bound) while two showed high negative loadings (volatile acid and total phenol). Factors 2, 3, and 4 accounted for 22.7, 14.4, and 9.5% of the total variance, respectively (Table 9) and showed significant positive correlations for lactic acid, alcohol, and sulphur-free, respectively. In addition, biplot diagrams of Factor 1 vs. Factor 2 visualised the above relationship among the oenological measurements and the bentonite product treatments (Figure 1).

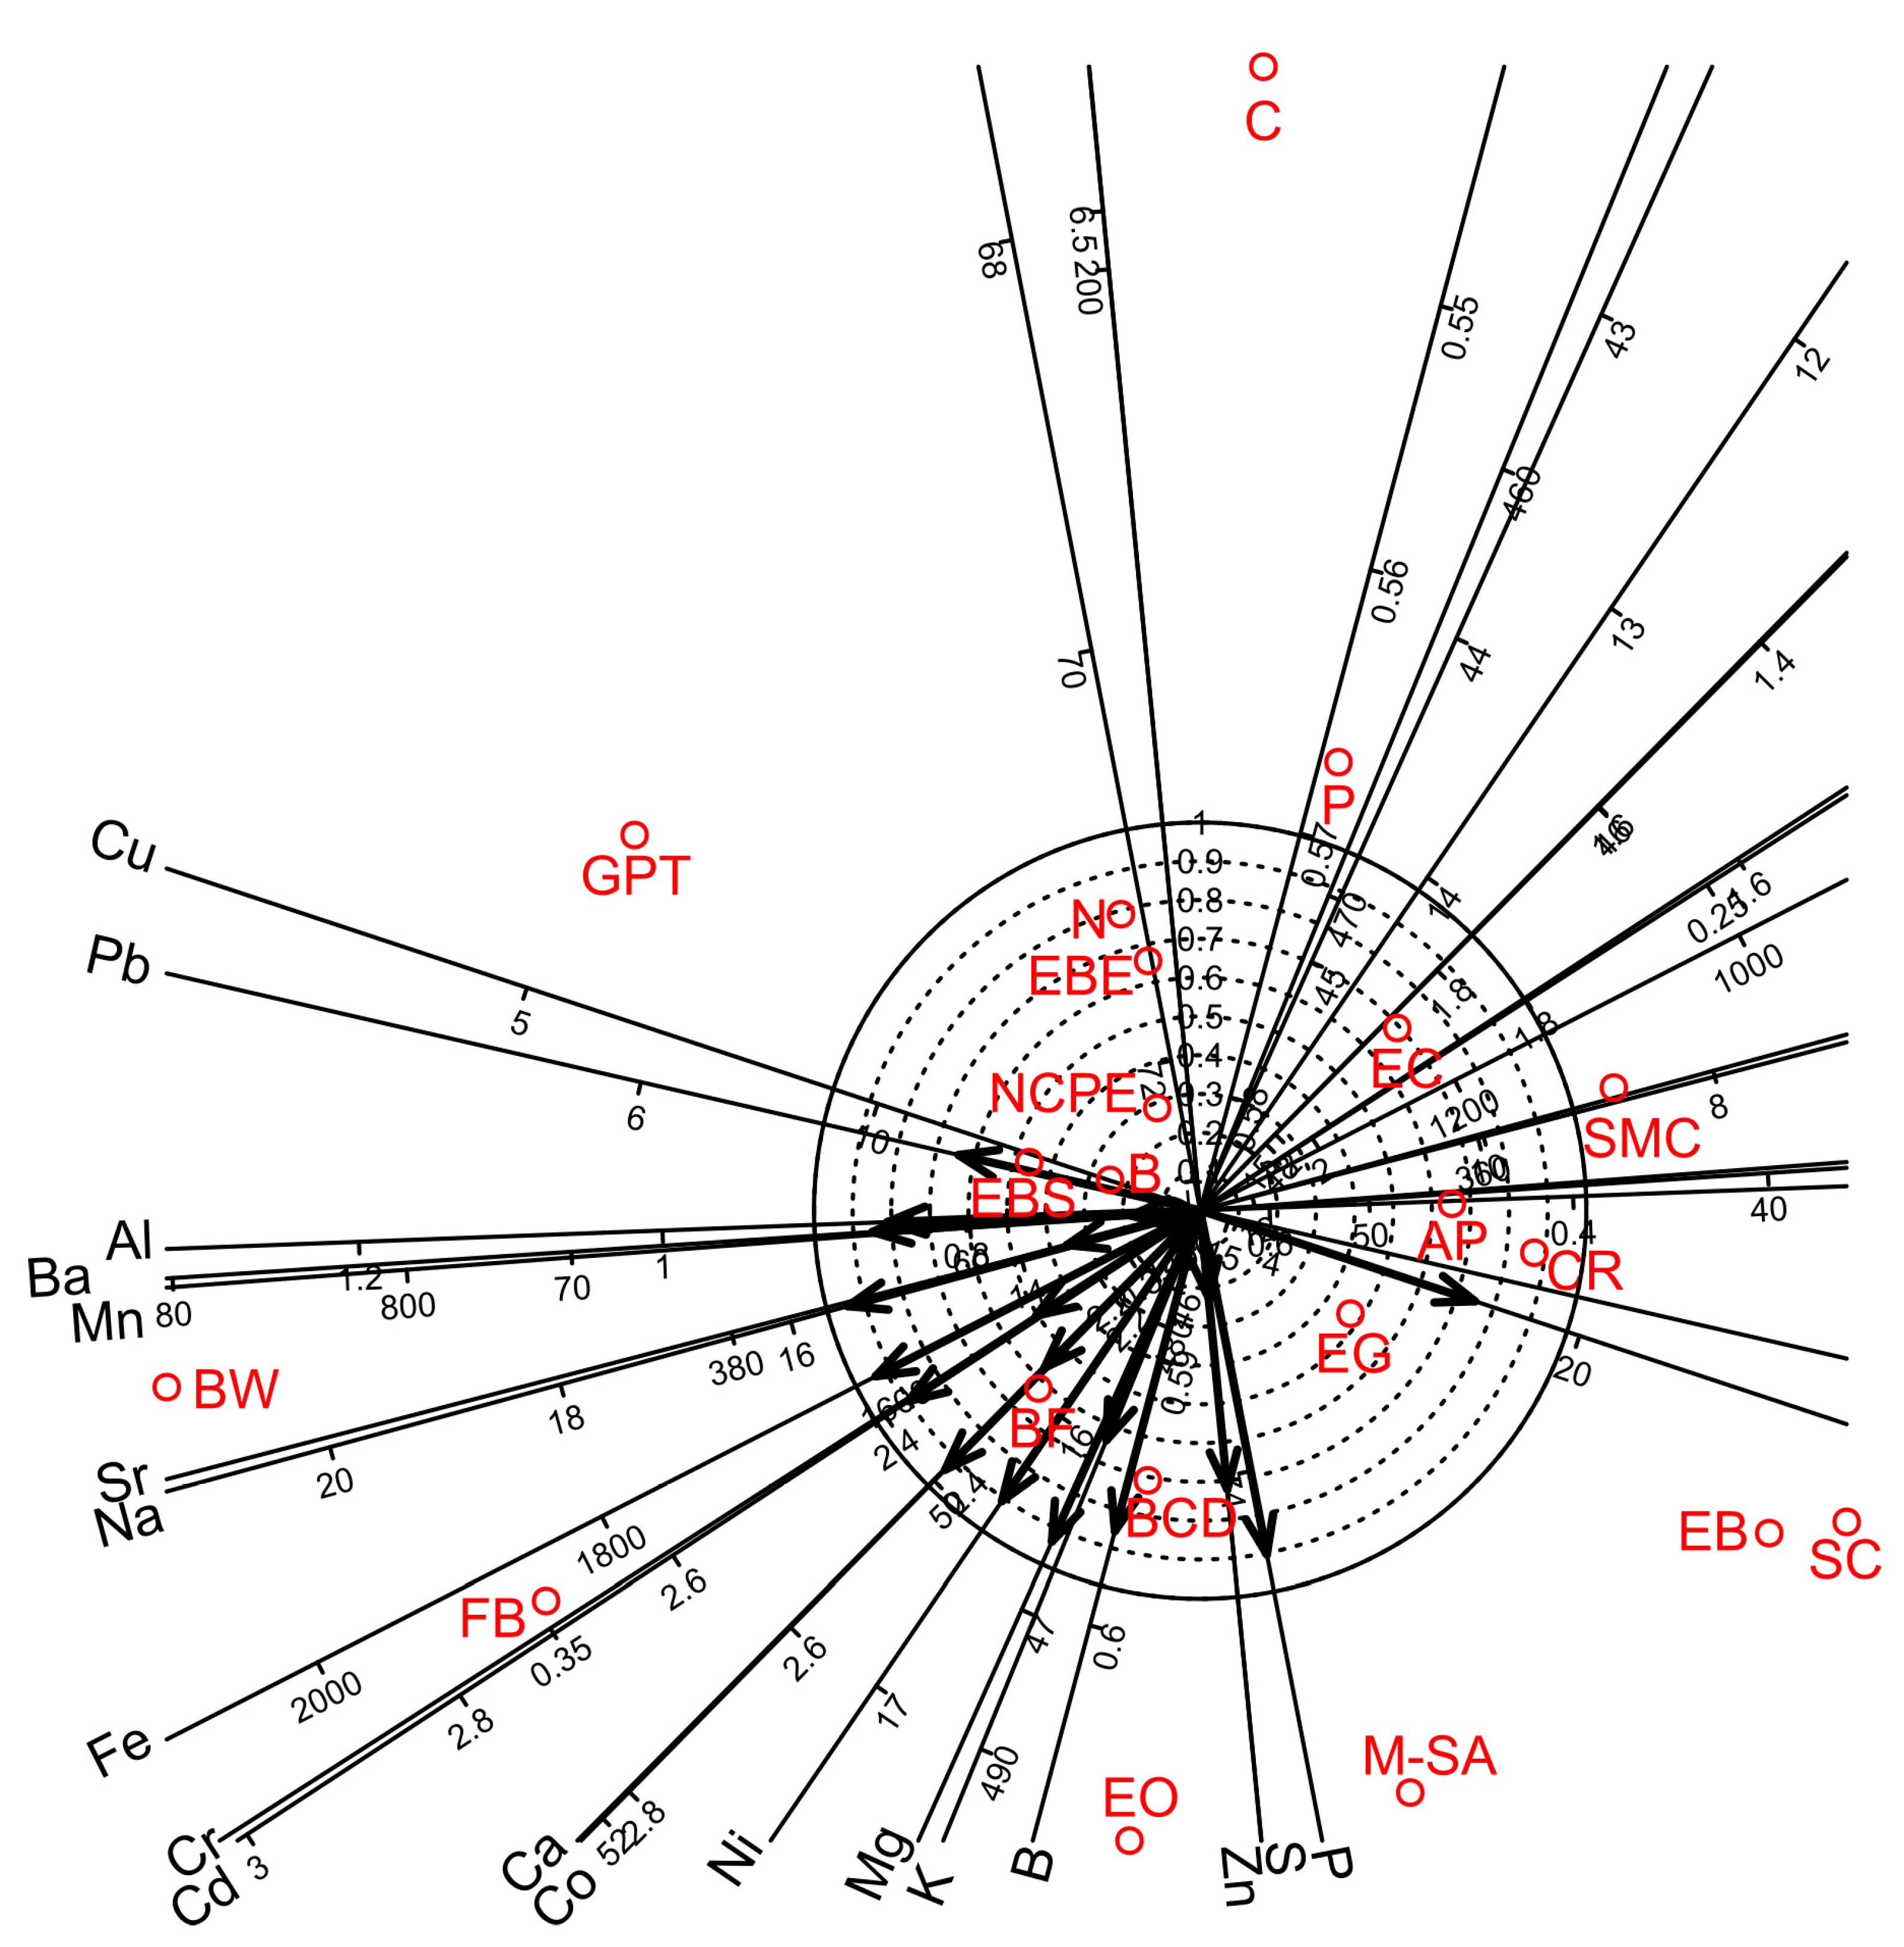
3.5.2. Pearson Correlation and Factor Analyses for Chemical Elements

When the data set of the 19 chemical elements of white wine were analyzed for all bentonite products together, 190 parameter pairs were correlated. Of the 190 pairs, 51 correlated significantly at p = 0.05 probability level (Table 10).
Among these 51 pairs, 50 were correlated positively (Al vs. Na, Al vs. Cr, Al vs. Fe, Al vs. Sr, Al vs. Ba, Al vs. Pb, B vs. Ca, B vs. K, B vs. Mg, B vs. P, B vs. Cr, B vs. F, B vs. Co, B vs. Ni, B vs. Cd, Ca vs. K, Ca vs. Mg, Ca vs. Cr, Ca vs. Cr, Ca vs. Fe, Ca vs. Co, Ca vs. Cd, K vs. Mg, K vs. Sr, K vs. Cd, Mg vs. Na, Mg vs. P, Mg vs. Cr, Mg vs. Fe, Mg vs. Co, Mg vs. Ni, Na vs. Cr, Na vs. Fe, Na vs. Co, Na vs. Ni, Na vs. Ba, Na vs. Pb, P vs. Zn, S vs. Mn, S vs. Sr, Cr vs. Fe, Cr vs. Co, Cr vs. Ni, Cr vs. Ba, Mn vs. Sr, Fe vs. Co, Fe vs. Ni, Fe vs. Ba, Co vs. Ni, Ni vs. Cd, Sr vs. Cd, and Ba vs. Pb) and one negatively (Al vs. Cu), indicating a strong connection among most chemical elements (Table 10).
Factor analyses for the nineteen chemical elements of white wine showed that four factors were sufficient to account for 81.5% of the total variance. Factors 1, 2, 3, and 4 accounted for 48.8, 16.3, 11.1, and 5.4% of the total variance, respectively (Table 11). Factors 1–3 provided separate groups of chemical elements. Factor 1 gave high positive loadings for B, Ca, K, Mg and P; Factor 2 showed high positive loadings for Mn, Sr and Cd; and Factor 3 gave high positive loadings for Co, Ni, Fe, Cr and Na. Factor 4 partially overlapped with Factor 3 and gave high positive loadings for Fe, Cr, Na, Ba, Pb, Al and Cu. Biplot diagram prepared for Factor 1 vs Factor 2 visualised strong relationships among the chemical elements and the bentonite products (Figure 2).

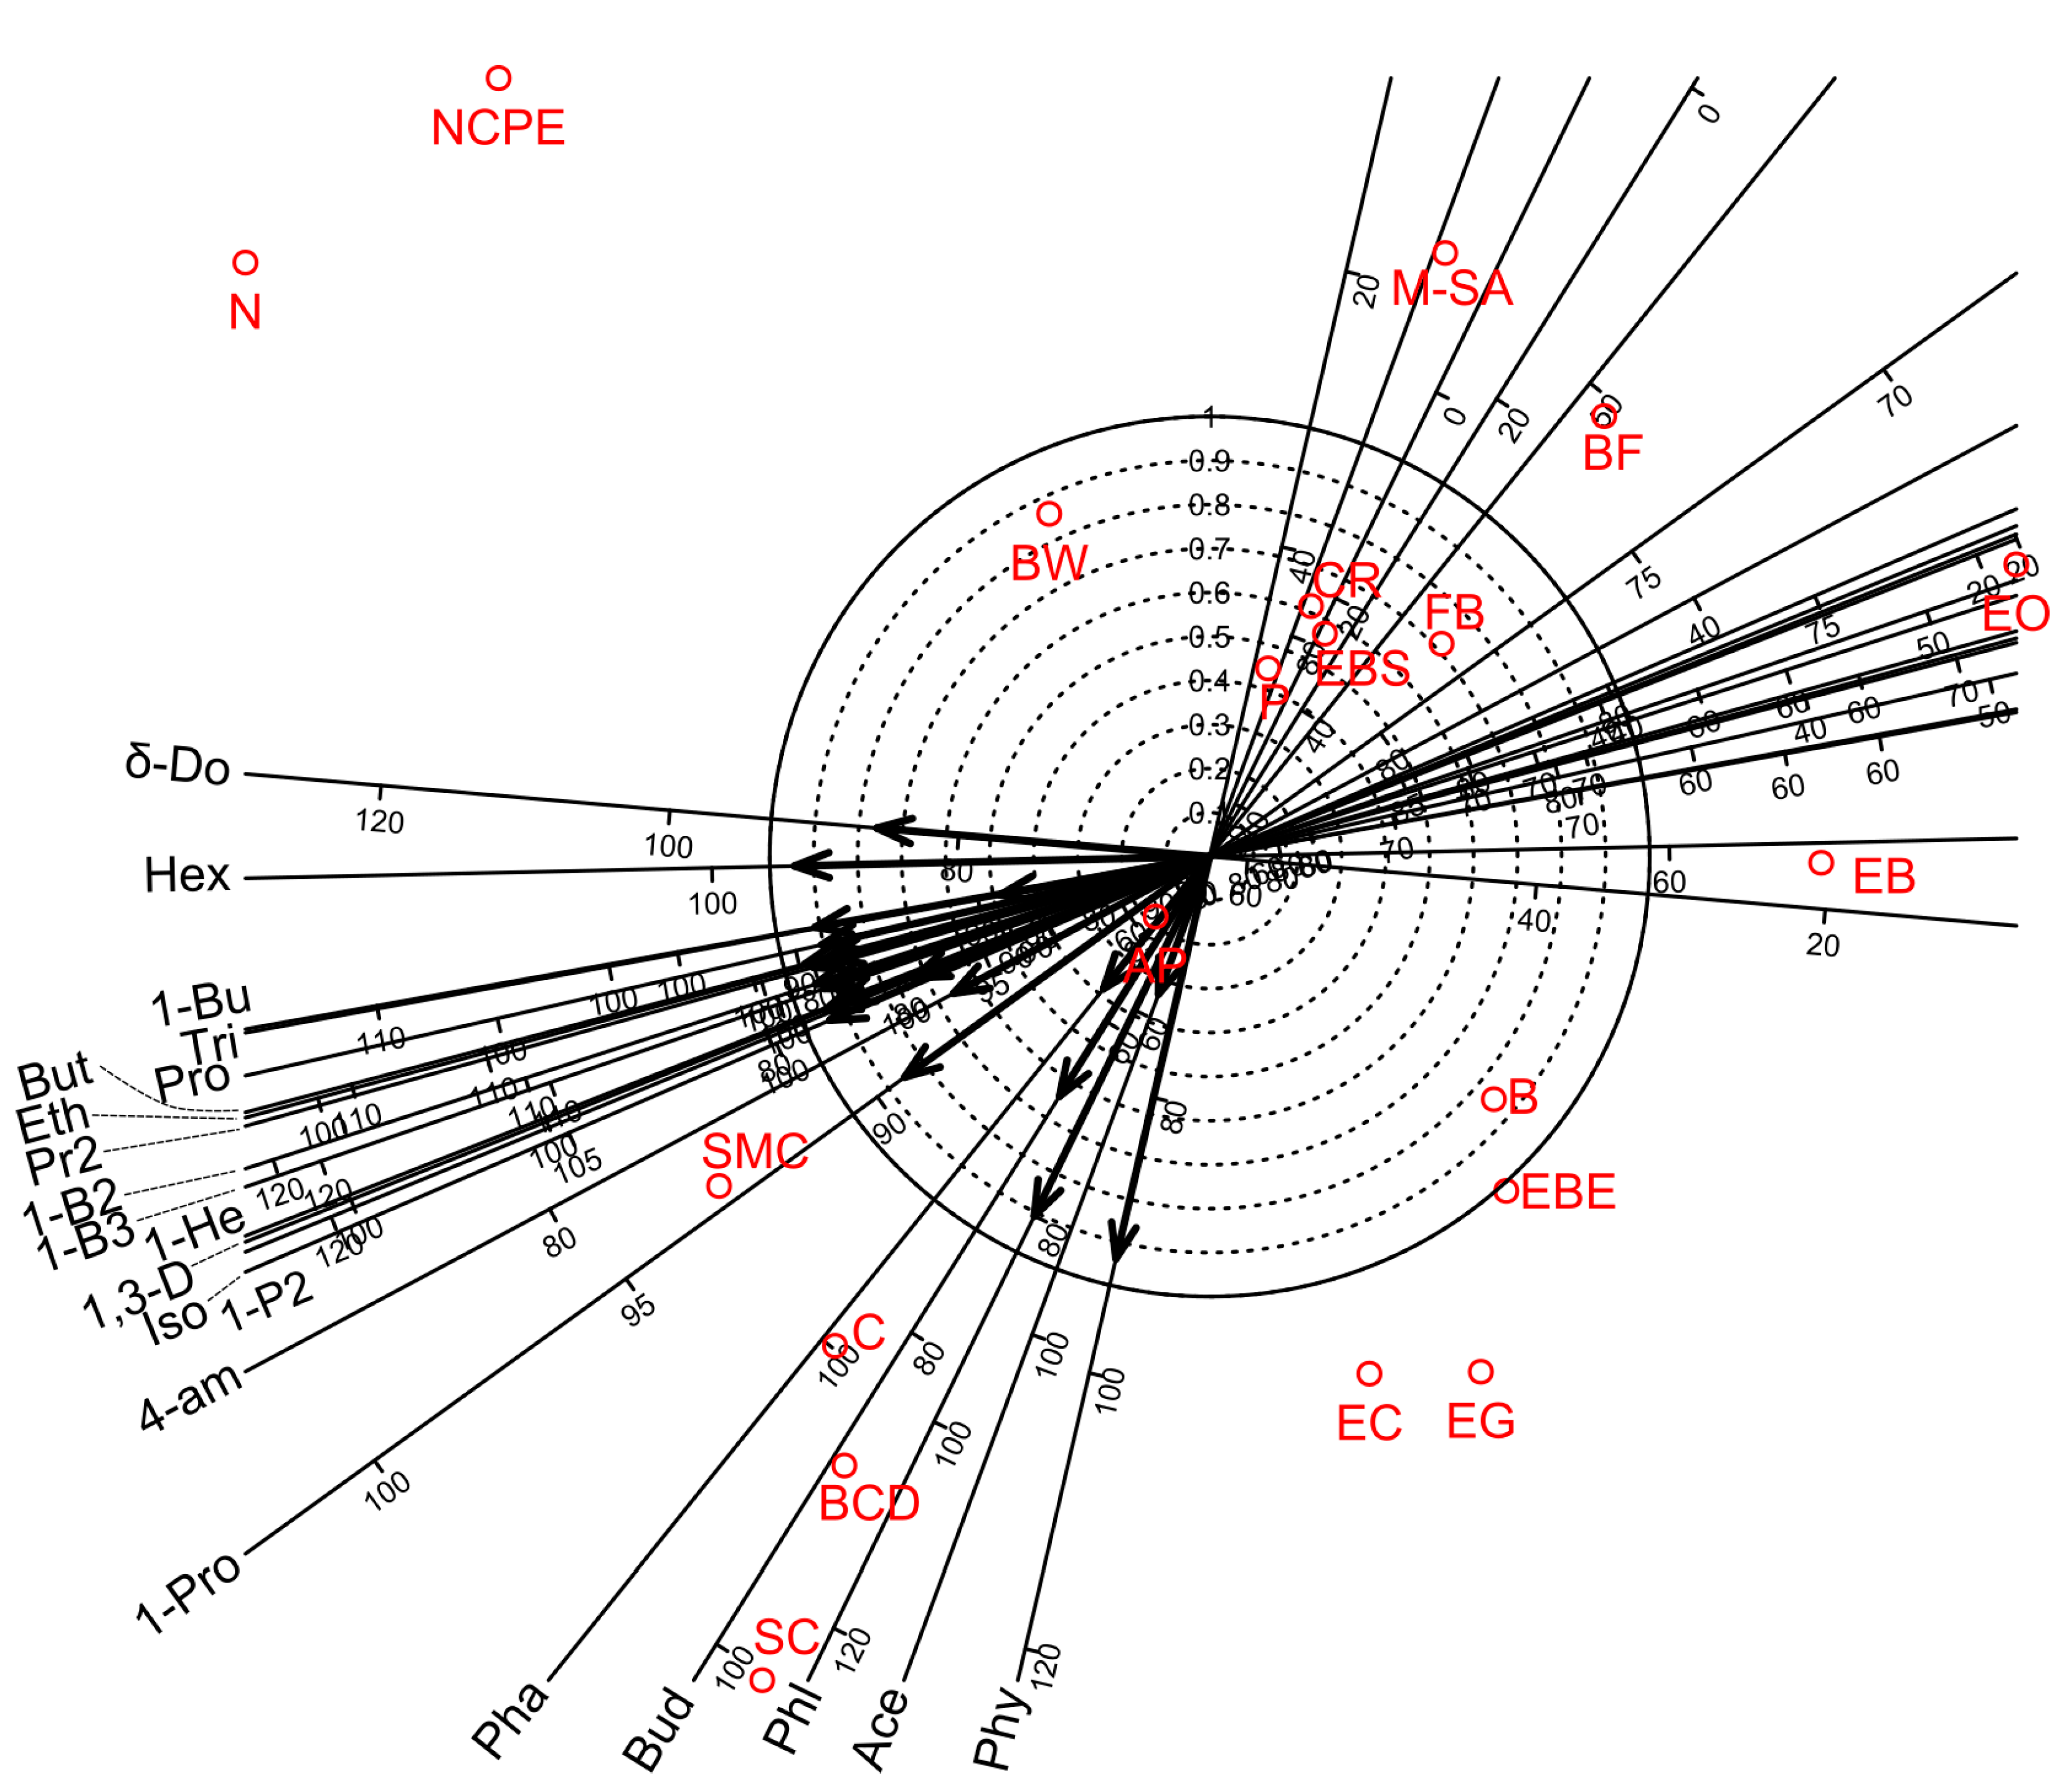
3.5.3. Pearson Correlation and Factor Analyses for Volatile Organic Compounds (VOCs)

When the data set of the twenty-one VOCs of the white wine samples was analyzed for all bentonit products together, 214 parameter pairs were correlated. Of the 214 pairs, 134 correlated significantly at p = 0.05 probability level (Table 12). All the 134 pairs were correlated positively, indicating a strong connection among most VOCs (Table 12).
Factor analyses for the twenty-one VOCs of wine showed that four factors were sufficient to account for 86.9% of the total variance. Factors 1, 2, 3, and 4 accounted for 67.3, 9.6, 5.6, and 4.5% of the total variance, respectively (Table 13). Factor 3 provided a separate group of VOCs while Factors 1 and 4 partially overlapped with Factor 2. Factor 1 gave high positive loadings for 13 VOCs (1-Propanol, Ethyl Acetate, 1-Propanol, 2-methyl-, Propanoic acid, ethyl ester, 1,3-Dioxolane, 2,4,5-trimethyl-, 1-Butanol, 3-methyl-, 1-Butanol, 2-methyl-, (S)-, Propanoic acid, 2-methyl-, ethyl ester, Butanoic acid, ethyl ester, 1-Hexanol, 1-Butanol, 3-methyl-, acetate, Hexanoic acid, ethyl ester and Octanoic acid, ethyl ester). Factor 2 showed high positive loadings for 7 VOCs (1-Butanol, 3-methyl-, Butanoic acid, ethyl ester, 1-Hexanol, 2-Butanone, Triethyl borate, Phenylethyl Alcohol, and Butanedioic acid, diethyl ester). Factors 3 and 4 gave high positive loadings for two (Phenol, 2-methyl-, Phenol, 2-methoxy-) and two (Phenylethyl Alcohol, Acetic acid) VOCs, respectively. The biplot diagram for the first two factors also demonstrated the above relationships among the VOCs measurements and the bentonite product treatments (Figure 3).

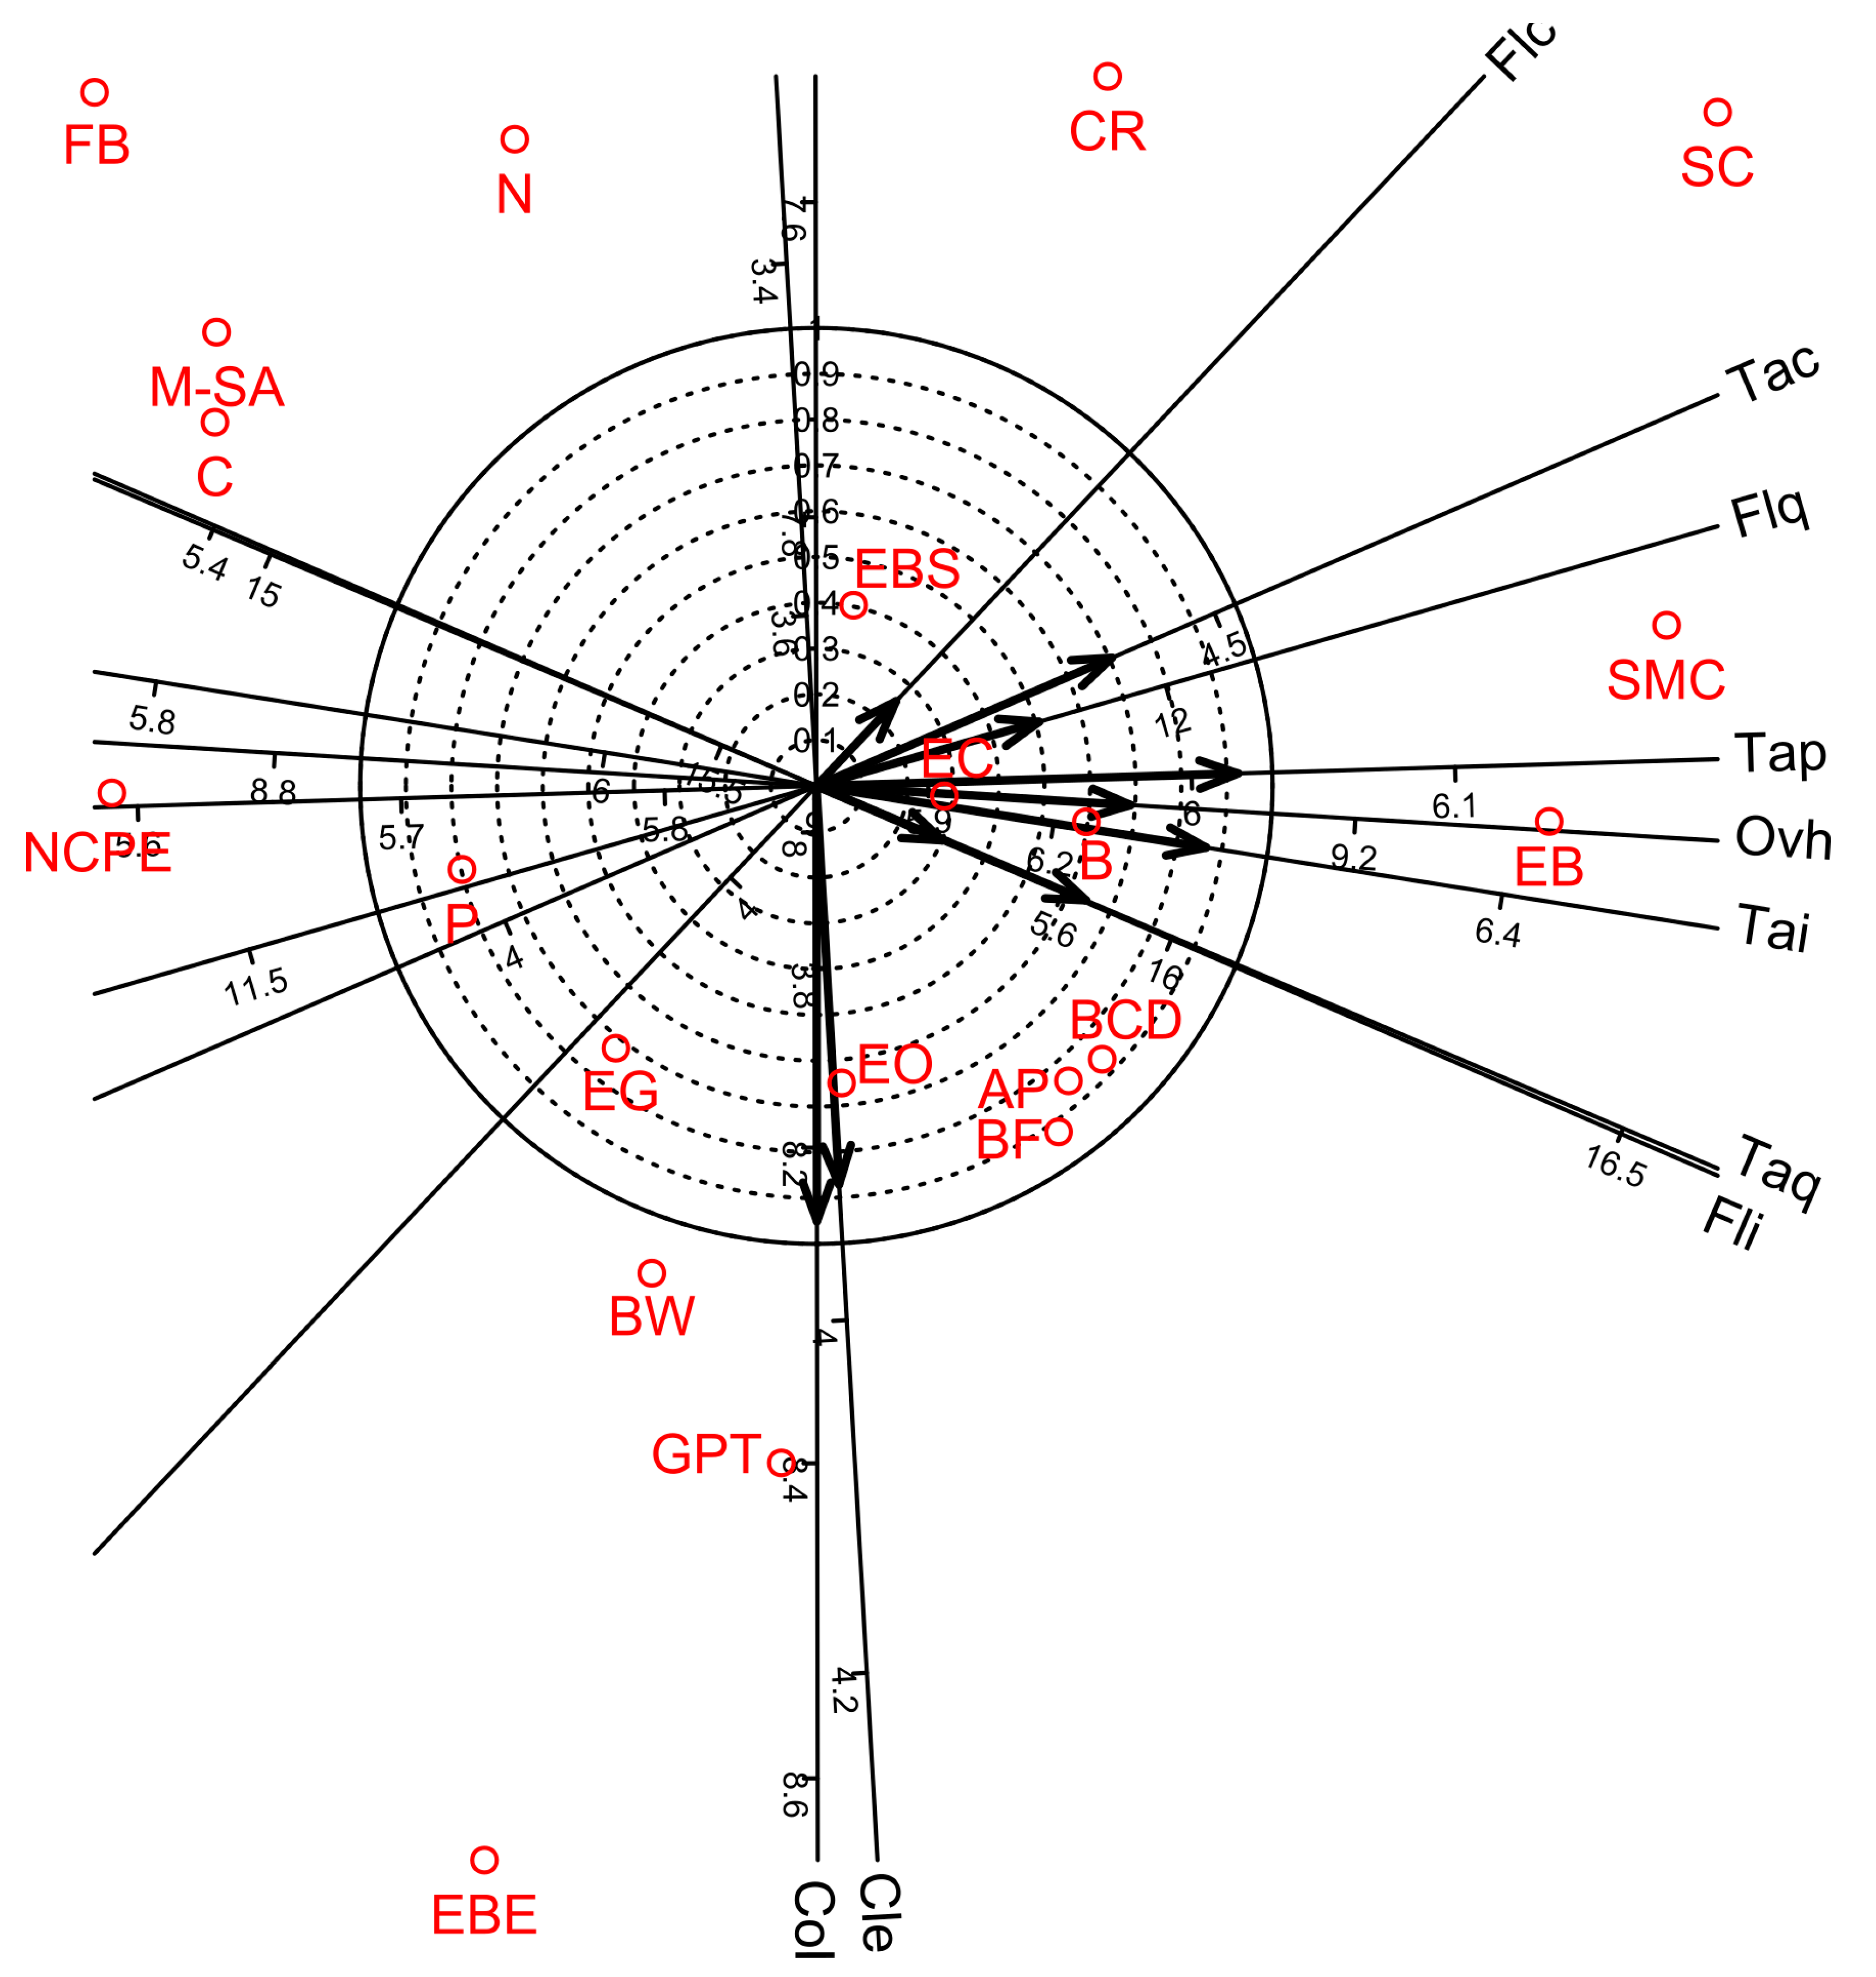
3.5.4. Pearson Correlation and Factor Analyses for Organoleptic Parameters

When the data set of the 10 organoleptic parameters of wine were analyzed for all bentonit products together, 46 parameter pairs were correlated. Of the 46 pairs, 14 correlated significantly at p = 0.05 probability level (Table 14).
All these 14 pairs were correlated positively (clearness vs. colour, flavour intensity vs. flavour character, flavour intensity vs. flavour quality, flavour character vs. flavour quality, flavour character vs. overall harmony, flavour quality vs. taste intensity, flavour quality vs. overall harmony, taste intensity vs. taste character, taste intensity vs. taste quality, taste intensity vs. taste persistency, taste intensity vs. overall harmony, taste character vs. taste persistency, taste quality vs. overall harmony, and taste persistency vs. overall harmony) (Table 14).
Factor analyses for the 10 organoleptic parameters of wine showed that four factors were sufficient to account for 87.5% of the total variance. Factors 1, 2, 3, and 4 accounted for 47.2, 21.2, 11.3, and 8.0% of the total variance, respectively (Table 15). Factors 1–3 provided separate groups of organoleptic parameters. Factor 1 gave high negative loadings for flavour quality, taste intensity, taste character, taste quality, taste persistency and overall harmony; Factor 2 showed high positive loadings for clearness and colour; and Factor 3 gave high positive loadings for flavour intensity and flavour character. Factor 4 overlapped with Factor 1 and gave high negative loadings for taste quality. In addition, biplot diagram of Factor 1 vs. Factor 2 visualised the distribution among the organoleptic parameters and the bentonite product treatments (Figure 4).

4. Discussion

Our study demonstrated that several oenological parameters, elemental compositions, aroma compounds and organoleptic parameters of white wine were affected by the selected eighteen bentonite products as fining agents. In addition, Pearson correlation and factor analyses demonstrated large numbers of significant intercorrelations among oenological, elemental, volatile, and organoleptic properties.
Our study confirmed that most of the bentonite products affected most of the oenological parameters of white wine (Table 3). In addition, this study showed that none of the bentonite products differed from the control treatment for the contents of ethyl-alcohol, tartaric acid and volatile acid in the wine samples (Table 3). Our results were confirmed by previous studies [16,37] in the case of ethyl-alcohol and volatile acidity contents, and the obtained values of ethyl-alcohol and volatile acidity contents were in the ranges given by the wine production regulations [44]. In addition, similar ranges of ethyl-alcohol, total acidity and volatile acidity values were reported by other white wine studies [45,46], where no bentonite fining was applied. Cheng and Watrelot [15] also reported that titratable acidity, ethanol, and tartaric acid contents were not different between the bentonite and control treatments during wine bottling. However, in contrast with our results, the study of Maslov-Bandic et al. [16] demonstrated that the sugar content of wine samples was significantly lower in the bentonite treatments compared to the control. In addition, different results were also reported by Cheng and Watrelot [15], who showed that malic acid contents were significantly lower in the bentonite treatment compared to the control treatment during wine bottling. The different results of previous studies from this study may be due to the fact that various bentonite products, various geographical origins of grape productions, various grape cultivars and/or various analytical methods were used in previous bentonite fining studies. Although various bentonite products can cause differences in oenological parameters, this bentonite fining study showed that the relationships are strong among most of the oenological parameters independently on bentonite products (18 pairs out of 55 ones were significant in correlation analyses and seven parameters out of 10 showed strong significant correlations for Factor 1, Table 8 and Table 9). This clearly indicates that various bentonite products not only change single oenological parameters but that strong intercorrelative changes can be expected among the parameters (e.g., among sugar, acidity malic acid, citric acid, volatile acid and total phenol) if we apply bentonite finings.
Similar to several previous studies, results of this work showed that bentonite fining affects the amounts of macro- and micro-elements (Table 4 and Table 5). The bentonite products, applied in the wine samples, caused changes in the amounts of Al, Ba, Ca, Cu, Fe, K, Mg, Mn, Na, Ni and Pb in this study (Table 4 and Table 5), which were in agreement with several previous studies [23,27,46,47,48,49,50,51,52,53]. Bentonite fining of wine increased the amounts of Na, Al and Ca in previous studies (e.g., [10,17,18,19,20]), which corresponded well to results of this study. In addition, Fe, Sr and Ba contents were also shown to increase in red wine samples by bentonite fining [21], which was also confirmed by this study in white wine samples. Previous wine studies showed that Cu, K and Zn contents [22] and also B content [23] decreased in the bentonite treatments compared to the control. The decrease of K and Zn contents by bentonite fining was not confirmed by this study, as most bentonite products caused a significant increase of K and Zn contents in the white wine samples (Table 4 and Table 5). In addition, the decrease of B content by bentonite fining was not in line with this study, as similar B quantities were measured in both the bentonite-treated and nontreated white wine samples (Table 4). The largest decrease was achieved for Cu (−43%) in the study of Nicolini et al. [22], which was confirmed by this study for the bentonite products of NCPE and GPT (Table 5). The different results of previous studies from this study may be due to the fact that various concentrations of bentonite products are applied and/or the used bentonite products contained various amounts of mineral composition, which contaminated differently the treated white samples. In addition, this bentonite fining study showed that the relationships among elements are clustered in Factors 1, 2, 3, and 4 (e.g., in Factor 1, B, Ca, K, Mg and P or in Factor 3, Co, Ni, Fe, Cr and Na, Table 11). This suggests that various bentonite products can cause intercorrelative changes among attached elemental groups in various level if bentonite fining is applied.
This study showed that bentonite fining significantly decreased the amounts of several VOCs in white wine samples compared to the control treatment but that the level of decrease was dependent on the types of VOCs and bentonite products (Table 6). On the other hand, bentonite fining was able to increase significantly several VOCs depending on the types of bentonite products (Table 6). The recent study of Horvat et al. [14] also demonstrated that bentonite negatively affected wine quality by changing some key fermentation volatiles compared to treatments without bentonite fining. Some previous studies showed that bentonite fining may reduce aroma and flavour compounds in the wine due to direct adsorption and deproteinization [28,29,30,31,32,33]. The aroma loss was verified after multiple treatments in various wine types [32,34]. Lira et al. [37] showed that the possible loss of volatile compounds may be due to adsorption on bentonite. The results of Sanborn et al. [35] also indicated that fining agents can perform unpredictably and may result in various levels of wine-quality reductions [35]. This phenomenon was supposed to be due to the fact that bentonite can connect with volatile components by chemical bindings such as van der Waals or hydrogen bonds [32,54,55,56]. In addition, this study showed that intercorrelations among many VOCs are strong already in the Factor 1, which accounted for a large amounts of variance (Table 13, Figure 3). This phenomenon indicates that bentonite fining has a strong influence on most of the VOCs independently of the type of the bentonite products used.
Several studies showed that the loss of aroma compounds in wine after bentonite treatments severely affects the sensory attributes of the wine too [28,29,32,33,34]. In this study, the organoleptic parameters were variously affected by bentonite fining compared to the control treatment; for example, organoleptic parameters were not affected (e.g., EBS vs. all organoleptic parameters), or were significantly decreased (e.g., EBE vs. flavour intensity) or significantly increased (e.g., EBE vs. colour) by various bentonite products (Table 7). The various effects could be explained by the various origins of bentonite products which differently affected the taste parameters due to their various mineral compositions. In addition, this study also showed that some flavour and taste parameters are well attached to each other, for example in Factor 1 (Table 15). This phenomenon was true in the overall inter-correlation analyses of all bentonite products, which indicates that organoleptic parameters are highly affected by bentonite finings. These influences are strongly connected to the changes of quality compositions of the wine, which was due to the used bentonite product.

5. Conclusions

This study clearly showed that oenological parameters, elemental compositions, aroma compounds and organoleptic parameters of the white wine samples were affected variously by the selected eighteen bentonite products as fining agents. In addition, analyses of inter-correlations showed a large number of significant intercorrelations among individual properties of oenological, elemental, volatile, and organoleptic attributes.
Bentonite fining will affect several wine-quality attributes (such oenological, elemental, volatile and organoleptic) alone and also in association with each other, which should be considered when we select a bentonite product for fining. This suggests that the right choice of bentonite products is essential (e.g., in relation to type of wine, inner content of wine, geographical origin) but that complex and intercorrelative effects of bentonite fining on all quality attributes of the wine can be expected, whatever products are used for bentonite fining.
It is complicated to select one product which is generally suitable for bentonite fining. In our specific case, the AP treatment seemed to be the most suitable for bentonite fining of our white wine samples. However, this study also demonstrated that several bentonite products are suitable for good fine toning of the wine according to the quality attributes of the wine or in the practice of organoleptic evaluations. It needs to be emphasized that all these phenomenon cannot be simply deduced from the direct changes of elemental and/or direct or indirect change of volatile compositions and that the complexity of the changes always has to be taken into consideration.

Author Contributions

Conceptualization, N.R., Z.K. and I.J.H.; methodology, N.R., Z.K., B.K. and I.J.H.; software, S.S.; I.J.H.; validation, I.J.H.; formal analysis, I.J.H., S.S., G.A.; investigation, N.R. and I.J.H.; resources, I.J.H.; data curation, N.R. and I.J.H.; writing—original draft preparation, N.R. and I.J.H.; writing—review and editing, I.J.H.; visualization, I.J.H.; supervision, I.J.H.; project administration, N.R. and I.J.H.; funding acquisition, I.J.H. All authors have read and agreed to the published version of the manuscript.

Funding

This research was funded by the Hungarian Scientific Research Funds (K 131478), cofinanced by the European Social Fund in the framework of TÁMOP-4.2.4.A/2-11/1-2012-0001 ‘National Excellence Program’ under project number A2-SZJ-TOK-13-0061, by the Thematic Excellence Programme (TKP2020-NKA-04) of the Ministry for Innovation and Technology in Hungary, within the framework of the space sciences and the climate change thematic programmes of the University of Debrecen.

Institutional Review Board Statement

The study was conducted in accordance with Helsinki declaration, and approved by the Ethics Committee of University of Debrecen (project identification code: EFOP-3.6.1-16-2016-00022-wine, date of approval: 10 October 2017).

Informed Consent Statement

Written informed consent has been obtained from the patients to publish this paper.

Data Availability Statement

Data is contained within the article.

Acknowledgments

We thank Sándor Kovács for the technical support.

Conflicts of Interest

The authors declare no conflict of interest.

References

  1. Fermo, P.; Comite, V.; Sredojević, M.; Ćirić, I.; Gašić, U.; Mutić, J.; Baošić, R.; Tešić, Ž. Elemental analysis and phenolic profiles of selected Italian wines. Foods 2021, 10, 158. [Google Scholar] [CrossRef] [PubMed]
  2. Snopek, L.; Mlcek, J.; Sochorova, L.; Baron, M.; Hlavacova, I.; Jurikova, T.; Kizek, R.; Sedlackova, E.; Sochor, J. Contribution of red wine consumption to human health protection. Molecules 2018, 23, 1684. [Google Scholar] [CrossRef] [PubMed] [Green Version]
  3. Pavlidou, E.; Mantzorou, M.; Fasoulas, A.; Tryfonos, C.; Petridis, D.; Giaginis, C. Wine: An aspiring agent in promoting longevity and preventing chronic diseases. Diseases 2018, 6, 73. [Google Scholar] [CrossRef] [PubMed] [Green Version]
  4. Minzer, S.; Estruch, R.; Casas, R. Wine intake in the framework of a Mediterranean diet and chronic non-communicable diseases: A short literature review of the last 5 years. Molecules 2020, 25, 5045. [Google Scholar] [CrossRef]
  5. Castillo-Muñoz, N.; Gómez-Alonso, S.; García-Romero, E.; Hermosín-Gutiérrez, I. Flavonol profiles of Vitis vinifera white grape cultivars. J. Food Compos. Anal. 2010, 23, 699–705. [Google Scholar] [CrossRef]
  6. Benmezane, F.; Cadot, Y.; Djama, R.; Djermoun, L. Determination of major anthocyanin pigments and flavonols in red grape skin of some table grape varieties (Vitis vinifera sp.) by highperformance liquid chromatography–photodiode array detection (HPLC-DAD). OENO ONE 2016, 50, 125–135. [Google Scholar] [CrossRef] [Green Version]
  7. Panceri, C.P.; Gomes, T.M.; De Gois, J.S.; Borges, D.L.G.; Bordignon-Luiz, M.T. Effect of dehydration process on mineral content, phenolic compounds and antioxidant activity of Cabernet Sauvignon and Merlot grapes. Food Res. Int. 2013, 54, 1343–1350. [Google Scholar] [CrossRef]
  8. Šuković, D.; Knežević, B.; Gašić, U.; Sredojević, M.; Ćirić, I.; Todić, S.; Mutić, J.; Tešić, Ž. Phenolic profiles of leaves, grapes and wine of grapevine variety Vranac (Vitis vinifera L.) from Montenegro. Foods 2020, 9, 138. [Google Scholar] [CrossRef] [Green Version]
  9. Bora, F.D.; Rîpanu, O.; Donici, A.; Bunea, C.I.; Pop, N.; Lung, M.L.; Popescu, D. Influence of micro-, macroelements and heavy metals on wine quality. Annu. Food Sci. Technol. 2016, 17, 1–10. [Google Scholar]
  10. Pohl, P. What do metals tell us about wine? Trends Anal. Chem. 2007, 26, 941–949. [Google Scholar] [CrossRef]
  11. Ma, T.-Z.; Gong, P.-F.; Lu, R.-R.; Zhang, B.; Morata, A.; Han, S.-Y. Effect of different clarification treatments on the volatile composition and aromatic attributes of ‘Italian Riesling’ icewine. Molecules 2020, 25, 2657. [Google Scholar] [CrossRef]
  12. Durán-Guerrero, E.; Castro, R. Novel analysis on aroma compounds of wine, vinegar and derived products. Foods 2021, 10, 1245. [Google Scholar] [CrossRef]
  13. Saywell, L.G. Clarification of wine. Ind. Eng. Chem. 1934, 26, 981–982. [Google Scholar] [CrossRef]
  14. Horvat, I.; Radeka, S.; Plavša, T.; Luki´c, I. Bentonite fining during fermentation reduces the dosage required and exhibits significant side-effects on phenols, free and bound aromas, and sensory quality of white wine. Food Chem. 2019, 285, 305–315. [Google Scholar] [CrossRef]
  15. Cheng, Y.; Watrelot, A.A. Effects of Saignée and bentonite treatment on phenolic compounds of Marquette red wines. Molecules 2022, 27, 3482. [Google Scholar] [CrossRef]
  16. Maslov-Bandić, L.; Puhelek, I.; Jeromel, A.; Jagatić Korenika, A.M.; Mihaljević Žulj, M. The effect of bentonite agents on the aroma composition of Sauvignon Blanc wines. Agric. Conspect. Sci. 2022, 87, 51–60. [Google Scholar]
  17. Sauvage, L.; Frank, D.; Stearne, J.; Millikan, M.B. Trace metal studies of selected white wines: An alternative approach. Anal. Chim. Acta 2002, 458, 223–230. [Google Scholar] [CrossRef]
  18. Díaz, C.; Conde, J.E.; Estévez, D.; Pérez Olivero, S.J.; Pérez Trujillo, J.P. Application of multivariate analysis and artificial neural networks for the differentiation of red wines from the Canary islands according to the island of origin. J. Agric. Food Chem. 2003, 51, 4303–4307. [Google Scholar] [CrossRef]
  19. Lara, R.; Cerutti, S.; Salonia, J.A.; Olsina, R.A.; Martinez, L.D. Trace element determination of Argentine wines using ETAAS and USN-ICP-OES. Food Chem. Toxicol. 2005, 43, 293–297. [Google Scholar] [CrossRef]
  20. McKinnon, A. Size fractionation of metals in wine using ultrafiltration. Talanta 1997, 44, 1649–1658. [Google Scholar] [CrossRef]
  21. Rakonczás, N.; Juhászné Tóth, R.; Soós, Á.; Kállai, Z.; Kovács, B.; Holb, I.J.; Kovács, S. Could bentonite product choice fit the desired wine style? Mitt. Klosterneubg. 2020, 70, 87–101. [Google Scholar]
  22. Nicolini, G.; Larcher, R.; Pangrazzi, P.; Bontempo, L. Changes in the contents of micro- and trace elements in wine due to winemaking treatments. Vitis 2004, 43, 41–45. [Google Scholar]
  23. Catarino, S.; Madeira, M.; Monteiro, F.; Rocha, F.; Curvelo-Garcia, A.S.; De Sousa, R.B. Effect of bentonite characteristics on the elemental composition of wine. J. Agric. Food Chem. 2008, 56, 158–165. [Google Scholar] [CrossRef] [Green Version]
  24. Reynolds, A.G. Managing Wine Quality, 2nd ed.; Oenology and Wine Quality; Elsevier Science, Woodhead Publication: Amsterdam, The Netherlands, 2021; Volume 2, pp. 1–886. [Google Scholar]
  25. Dordoni, R.; Colangelo, D.; Giribaldi, M.; Giuffrida, M.G.; De Faveri, D.M.; Lambri, M. Effect of bentonite characteristics on wine proteins, polyphenols, and metals under conditions of different pH. Am. J. Enol. Viticul. 2015, 66, 518–530. [Google Scholar] [CrossRef]
  26. Gómez, M.M.C.; Brandt, R.; Jakubowski, N.; Anderson, J.T. Changes of the metal composition in German white wines through the winemaking process. A study of 63 elements by inductively coupled plasma-mass spectrometry. J. Agric. Food Chem. 2004, 52, 2953–2961. [Google Scholar]
  27. Catarino, S.; Madeira, M.; Monteiro, F.; Curvelo-Garcia, A.S.; Bruno de Sousa, R. Release of contaminant elements from bentonites to wine: A contribution to achieve a test solution. Ciência Téc. Vitiv. 2006, 21, 17–31. [Google Scholar]
  28. Miller, G.C.; Amon, J.M.; Gibson, R.L.; Simpson, R.F. Loss of wine aroma attributable to protein stabilization with bentonite or ultrafiltration. Aust. Grape Grow. Winemak. 1985, 256, 46–50. [Google Scholar]
  29. Voilley, A.; Lamer, C.; Dubois, P.; Feuillat, M. Influence of macromolecules and treatments on the behavior of aroma compounds in a model wine. J. Agric. Food Chem. 1990, 38, 251–258. [Google Scholar] [CrossRef]
  30. Moio, L.; Ugliano, M.; Gambuti, A.; Genovese, A.; Piombino, P. Influence of clarification treatment on concentrations of selected free varietal aroma compounds and glycoconjugates in Falanghina (Vitis vinifera L.) must and wine. Am. J. Enol. Vitic. 2004, 55, 7–12. [Google Scholar] [CrossRef]
  31. Armada, L.; Falqué, E. Repercussion of the clarification treatment agents before the alcoholic fermentation on volatile composition of white wines. Eur. Food Res. Technol. 2007, 225, 553–558. [Google Scholar] [CrossRef]
  32. Lambri, M.; Dordoni, R.; Silva, A.; De Faveri, D.M. Effect of bentonite fining on odor-active compounds in two different white wine styles. Am. J. Enol. Viticult. 2010, 61, 225–233. [Google Scholar] [CrossRef]
  33. Sommer, S.; Tondini, F. Sustainable replacement strategies for bentonite in wine using alternative protein fining agents. Sustainability 2021, 13, 1860. [Google Scholar] [CrossRef]
  34. Lambri, M.; Dordoni, R.; Giribaldi, M.; Violetta, M.R.; Giuffrida, M.G. Heat-unstable protein removal by different bentonite labels in white wines. LWT-Food Sci. Technol. 2012, 46, 460–467. [Google Scholar] [CrossRef]
  35. Sanborn, M.; Edwards, C.G.; Ross, C.F. Impact of fining on chemical and sensory properties of Washington State chardonnay and Gewürztraminer wines. Am. J. Enol. Vitic. 2010, 61, 31–41. [Google Scholar] [CrossRef]
  36. Ubeda, C.; Lambert-Royo, M.I.; Gil-Cortiella, M.; Del Barrio-Galán, R.; Peña-Neira, Á. Chemical, physical, and sensory effects of the use of bentonite at different stages of the production of traditional sparkling wines. Foods 2021, 10, 390. [Google Scholar] [CrossRef]
  37. Lira, E.; Rodríguez-Bencomo, J.J.; Salazar, F.N.; Orriols, I.; Fornos, D.; López, F. Impact of bentonite additions during vinification on protein stability and volatile compounds of Albariño wines. J. Agric. Food Chemist. 2015, 63, 3004–3011. [Google Scholar] [CrossRef]
  38. Saracino, F.; Brinco, J.; Gago, D.; Gomes da Silva, M.; Boavida Ferreira, R.; Ricardo-da-Silva, J.; Chagas, R.; Ferreira, L.M. DCMC as a promising alternative to bentonite in white wine stabilization. impact on protein stability and wine aromatic fraction. Molecules 2021, 26, 6188. [Google Scholar] [CrossRef]
  39. Jackson, R.S. Wine Science: Principles and Applications, 3rd ed.; Elsevier Academic Press: Amsterdam, The Netherlands, 2008; pp. 1–751. [Google Scholar]
  40. Hopfer, H.; Heymann, H. Judging wine quality: Do we need experts, consumers or trained panelists? Food Qual. Prefer. 2014, 32, 221–233. [Google Scholar] [CrossRef]
  41. Kaiser, H.F. The varimax criterion for analytic rotation in factor analysis. Psychometrika 1958, 23, 187–200. [Google Scholar] [CrossRef]
  42. R Core Team. R: A Language and Environment for Statistical Computing. 2022. Available online: https://www.gbif.org/tool/81287/r-a-language-and-environment-for-statistical-computing (accessed on 3 March 2022).
  43. Vicente-Villardon, J.L. MultBiplotR: Multivariate Analysis Using Biplots in R. R Package Version 1.3.30. 2021. Available online: https://CRAN.R-project.org/package=MultBiplotR (accessed on 12 July 2021).
  44. Regulations of the Wine Production (2/2005). Available online: https://narodne-novine.nn.hr/clanci/sluzbeni/2005_01_2_17.html (accessed on 20 December 2019).
  45. Jagatić Korenika, A.-M.; Biloš, J.; Kozina, B.; Tomaz, I.; Preiner, D.; Jeromel, A. Effect of different reducing agents on aromatic compounds, antioxidant and chromatic properties of Sauvignon Blanc wine. Foods 2020, 9, 996. [Google Scholar] [CrossRef]
  46. Lukić, K.; Ćurko, N.; Tomašević, M.; Kovačević Ganić, K. Phenolic and aroma changes of red and white wines during aging induced by high hydrostatic pressure. Foods 2020, 9, 1034. [Google Scholar] [CrossRef] [PubMed]
  47. Postel, W.; Meier, B.; Markert, R. Einfluss verschiedener Behand-lungsstoffe auf den Gehalt des Weins an Mengen- und Spurenelementen. I. Bentonit. Mitt. Klosterneubg. 1986, 36, 20–27. [Google Scholar]
  48. McKinnon, A.J.; Cattrall, R.W.; Scollary, G.R. Aluminum in wine. Its measurement and identification of major sources. Am. J. Enol. Vitic. 1992, 43, 166–170. [Google Scholar]
  49. Leske, P.A.; Bruer, N.G.C.; Capdeboscq, V. An evaluation of some characteristics of commercial bentonites. Wine Ind. J. 1995, 10, 73–77. [Google Scholar]
  50. Gössinger, M.; Schödl, H.; Steidl, R.; Meier, W. Comparison of commercial must and wine bentonites. Mitt. Klosterneubg. 1997, 47, 1–7. [Google Scholar]
  51. Molina, R.; Mingot, J.; Giner, N.; Revenga, E. Influencia de la clarificación con bentonita sobre ciertos metales pesados en el vino. Tecnol. Vino 2001, 1, 39–47. [Google Scholar]
  52. Bauer, K.H.; Eschnauer, H.R.; Görtges, S. Indicator elements in wine analysis. In The Ultra-Trace Elements Beryllium and Zirconium; Ecole Européenne de Chemie Analytique, Ed.; Abstract Book 2nd Symp. “In Vino Analytica Scientia 2001”; Université Victor Segalen Bordeaux 2: Bordeaux, France, 2001. [Google Scholar]
  53. Catarino, S.; Soares, J.; Curvelo-Garcia, A.S.; Bruno de Sousa, R. Implicações da utilização de bentonites sobre a fracção mineral de vinhos: Potássio, sódio, cálcio, alumínio e chumbo. Efeito do pH. Ciência Téc. VitiV. 2004, 19, 29–45. [Google Scholar]
  54. Burin, V.M.; Caliari, V.; Bordignon-Luiz, M.T. Nitrogen compounds in must and volatile profile of white wine: Influence of clarification process before alcoholic fermentation. Food Chem. 2016, 202, 417–425. [Google Scholar] [CrossRef]
  55. Lira, E.; Salazar, F.N.; Rodr Iguez-Bencomo, J.J.; Vincenzi, S.; Curioni, A.; Opez, F.L. Effect of using bentonite during fermentation on protein stabilisation and sensory properties of white wine. Int. J. Food Sci. Technol. 2014, 49, 1070–1078. [Google Scholar] [CrossRef]
  56. Vincenzi, S.; Panighel, A.; Gazzola, D.; Flamini, R.; Curioni, A. Study of combined effect of proteins and bentonite fining on the wine aroma loss. J. Agric. Food Chem. 2015, 63, 2314–2320. [Google Scholar] [CrossRef]
Figure 1. Biplot diagrams of Factor 1 versus Factor 2 of Principal Axis Factor Analysis (Iterated Principal Factor) conducted for ten oenological measurements of white wine samples in twenty-one bentonite product treatments (Debrecen-Pallag, Hungary). Oenological parameters are Et-OH: Ethyl-alcohol, Sug: Sugar, Aci: Acidity, Taa: Tartaric acid, Maa: Malic acid, Laa: Lactic acid, Cia: Citric acid, Voa: Volatile acid, Suf: Sulphur-free, Sub: Sulphur-bound, Tph: Total phenol. Explanations for bentonite product name abbreviations (red colour) are given in Table 1.
Foods 12 00355 g001
Figure 2. Biplot diagrams of Factor 1 versus Factor 2 of Principal Axis Factor Analysis (Iterated Principal Factor) conducted for nineteen chemical elements of white wine samples in twenty-one bentonite product treatments (Debrecen-Pallag, Hungary). Explanations for bentonite product name abbreviations (red colour) are given in Table 1.
Foods 12 00355 g002
Figure 3. Biplot diagrams of Factor 1 versus Factor 2 of Principal Axis Factor Analysis (Iterated Principal Factor) conducted for twenty-two volatile organic compounds (VOCs) of white wine samples in twenty-one bentonite product treatments (Debrecen-Pallag, Hungary). Explanations for VOCs abbreviations are given in Table 12. Explanations for bentonite product name abbreviations (red colour) are given in Table 1.
Foods 12 00355 g003
Figure 4. Biplot diagrams of Factor 1 versus Factor 2 of Principal Axis Factor Analysis (Iterated Principal Factor) conducted for ten organoleptic parameters of white wine samples in twenty-one bentonite product treatments (Debrecen-Pallag, Hungary). Organoleptic parameters are Cle: Clearness, Col: Colour, Fli: Flavor intensity, Flc: Flavor character, Flq: Flavor quality, Tai: Taste intensity, Tac: Taste character, Taq: Taste quality, Tap: Taste persistency, Ovh: Overall harmony. Explanations for bentonite product name abbreviations (red colour) are given in Table 1.
Foods 12 00355 g004
Table 1. Abbreviation, active ingredients, producer suggested dosage, applied dosage and dissolved oxygen at bottling of the bentonite products in order to evaluate white wine from Debrecen-Pallag, Hungary. Manufacturers, town and country of the applied products are Perdomini-IOC S.p.a., San Martino, Italy for E-Benton Super, Mixgel-SA, Caseo-star, ALFA-P, Bentamin-100, Pentagel, Bentonite-Compact Due and E-Benton Extra; Ever s.r.l., Venezia, Italy for Fort Benton, Everclar Compact, Everclar Beta, Nucleobent, Everclar Omega, Everclar Gamma and Benton flash; Erbslöh Geisenheim Gmbh, Geisenheim, Germany for Na-Calit Poretec Erbslöh and Granubent Pore-Tec; Süd-Chemie Verwaltungs GmbH, München, Germany for BW 200.
Product NameAbbrev.Active IngredientsProducer Suggested Dosage (g/L)Applied
Dosage (g/L)
Dissolved
Oxygen at
Bottling (ppm)
ControlC---2.2
Sulfur ControlSC10 mg/L sulfitization--2.4
Sulfur + Mix ControlSMC10 mg/L sulfitization + intensive mixing--2.4
E-Benton SuperEBSactivated Na-bentonite30–80553.7
Fort BentonFBNa-bentonite50–100752.4
Mixgel-SAM-SAgelatine, kazeine, albumin, bentonite, colloidal silicium dioxide40–50451.9
Na-Calit Poretec ErbslöhNCPENa- Ca-bentonite50–1501002.4
Everclar CompactECNa- Ca-bentonite20–80502.7
Caseo-starCRK-casein, activated bentonite30–50401.7
BW 200BWbentonite40–120802.4
Everclar BetaEByeast cell wall, PVPP, silicate5–10–20–3017.51.8
ALFA-PAPgelatine, caseine, albumine, bentonite, colloidal silicium dioxide (“4”) + PVPP30–80552.6
Bentamin-100Bbentonite, silicium dioxide50–100752.6
NucleobentNbentonite20–40301.8
Granubent Pore-TecGPTbentonite--2.1
Everclar OmegaEObentonite, fish glue,20–50352.2
PentagelPactivated Na-bentonite10–20151.9
Bentonite-Compact DueBCDCa-, Na-bentonite70–150702.5
Everclar GammaEGmontmor., PVPP, selected silicate, special active carbon30–50402.0
E-Benton ExtraEBEactivated Na-bentonite50–100752.2
Benton flashBFactivated Na-bentonite20–80502.5
Table 2. Molecular formula, chemical group and retention time (RT) for twenty-two volatile organic compounds (VOCs) determined by gas chromatography from the white wine samples in twenty-one bentonite product treatments including three control treatments (Debrecen-Pallag, Hungary).
VOCsMolecular FormulaChemical GroupRT
Alcohols
1-PropanolC3H8Oprimary alcohols3.318
1-Propanol, 2-methyl-C4H10Oprimary alcohols4.396
1-Butanol, 3-methyl-C5H12Oprimary alcohols6.464
1-Butanol, 2-methyl-, (S)-C5H12Oprimary alcohols6.547
1-HexanolC6H14Oalcohol9.160
Esters
Ethyl AcetateC4H8O2carboxylic acid esters4.182
Propanoic acid, ethyl esterC5H10O2carboxylic acid esters6.012
Isobutyl acetateC6H12O2carboxylic acid esters7.269
1-Butanol, 3-methyl-, acetateC7H14O2carboxylic acid esters9.320
Propanoic acid, 2-methyl-, ethyl esterC6H12O2ethyl ester6.982
Butanoic acid, ethyl esterC6H12O2ethyl ester7.815
Hexanoic acid, ethyl esterC8H16O2ethyl ester11.587
Butanedioic acid, diethyl esterC8H14O4fatty acid esters14.582
Octanoic acid, ethyl esterC10H20O2fatty acid esters14.867
Triethyl borateC6H15BO3ester7.632
Acids
4-Amino-1,5-pentandioic acidC5H9NO4alpha-amino acid6.910
Acetic acidC2H4O2carboxylic acids3.566
Others
δ-DodecalactoneC10H18O2gamma butyrolactones5.900
1,3-Dioxolane, 2,4,5-trimethyl-C6H12O21,3-dioxolanes6.380
Phenol, 2-methyl-C7H8Oortho cresols12.635
Phenol, 2-methoxy-C7H8O2methoxyphenols13.410
Phenylethyl alcoholC8H10Obenzene13.829
Table 3. Quantities of nine basic wine parameters (ethyl-alcohol, sugar, acidity, tartaric acid, malic acid, lactic acid, citric acid, volatile acid, and total phenol) in white wine samples treated with twenty-one bentonite products including control treatments (Debrecen-Pallag, Hungary). Different letters within each column are significantly different among the bentonite product treatments at p = 0.05 according to LSD t-tests (LSD0.05). ns = nonsignificant. Explanations for bentonite product name abbreviations are given in Table 1.
Product NameEthyl-AlcoholSugarAcidityTartaric AcidMalic AcidLactic AcidCitric AcidVolatile AcidTotal PhenolSulphur FreeSulphur Bound
Abbreviationv/v%g/Lg/Lg/Lg/Lg/Lg/Lg/Lmg/Lmg/Lmg/L
C12.110.5ab5.60a2.10.8a1.6c0.26a0.3921.0d12cde21a
SC12.101.2e6.13ab2.22.1c1.5c0.49c0.3110.2a21h61fgh
SMC12.130.6bc6.20b2.22.0bc1.1b0.41bc0.3415.6b9bcd77j
EBS11.920.8d6.01ab2.02.0bc0.8a0.36ab0.3617.2bc2a58efg
FB12.040.5ab6.05ab2.11.8b0.9ab0.35ab0.3517.7c12ce54def
M-SA12.090.6bc6.13ab2.21.9bc0.9ab0.35ab0.3617.9c14e56def
NCPE12.090.4a6.14ab2.11.9bc0.9ab0.36ab0.3517.5bc13def66ghi
EC12.050.6bc6.16b2.11.8b0.9ab0.35ab0.3517.4bc13def53cdef
CR12.10.6bc6.16b2.21.9bc1.0ab0.37ab0.3417.3bc11cde54def
BW12.010.5ab6.07a2.11.8b0.9ab0.36ab0.3417.6c20gh69hij
EB12.110.6bc6.17b2.21.9bc0.9ab0.34ab0.3517.5bc6ab35b
AP12.090.5ab6.15b2.11.9bc0.9ab0.35ab0.3518.0c17fgh49cde
B12.050.6bc6.13a2.11.8b0.9ab0.36ab0.3517.4bc14ef56def
N12.070.5ab6.17b2.11.9bc0.9ab0.35ab0.3517.5bc17fgh52cdef
GPT12.070.5ab6.14ab2.11.9bc0.9ab0.36ab0.3618.0c8bcd58efg
EO12.080.6bc6.13ab2.21.9bc0.9ab0.36ab0.3517.8c12cde56def
P12.100.6bc6.17b2.21.9bc0.9ab0.35ab0.3517.3bc9bcd43bc
BCD12.060.5ab6.14ab2.21.8b0.9ab0.35ab0.3617.7c14def52cdef
EG12.020.7cd6.19b2.11.9bc0.9ab0.35ab0.3516.4bc8bc47cd
EBE12.070.5ab6.14ab2.11.9bc0.9ab0.36ab0.3517.6c16fg54def
BF12.050.5ab6.11ab2.11.9bc1.0ab0.36ab0.3516.9bc14ef52cdef
LSD0.05ns0.180.54ns0.260.220.11ns1.94.19.5
Table 4. Quantities (mg/L) of eight macro- and meso elements (P, K, Ca, Mg, S, Al, Na, and B) in white wine samples treated with twenty-one bentonite products including control treatments (Debrecen-Pallag, Hungary). Different letters within each column are significantly different among the bentonite product treatments at p = 0.05 according to LSD t-tests (LSD0.05). Explanations for bentonite product name abbreviations are given in Table 1.
Product NamePKCaMgSAlNaB
C66.7a432.7a41.22a41.8a5.845a0.270a7.75a0.526a
SC74.9cde479.3b–e41.87ab45.7b6.955def0.296ab8.82ab0.586bc
SMC73.6b–e470.5bcd45.81abc45.0ab6.563a–e0.302ab8.63ab0.572bc
EBS71.5bc488.0cde50.75cde46.3b7.358fg0.918gh14.28cde0.585bc
FB74.1cde474.2b–e48.12cd47.3b6.338a–d0.720ef17.97e0.587bc
M-SA74.9cde486.5b–e50.85cde46.8b7.811gh0.465b11.05a–d0.603c
NCPE72.8b–e485.5b–e50.02cde46.0b9.181i1.130i12.97bcd0.596bc
EC72.5b–e474.3b–e48.45cde45.7b6.525a–e0.701ef10.09abc0.578bc
CR71.9bcd491.5de49.80cd45.0ab7.198ef0.375abc10.31a–d0.588bc
BW72.6b–e488.8cde51.81de46.8b7.363fg1.465j21.21f0.599c
EB75.4de480.1b–e48.05cd45.9b6.213abc0.299ab8.945ab0.591bc
AP72.7bcd479.7b–e50.67cde45.7b8.438hi0.554de11.12a–d0.592bc
B72.3b–e475.8b–e49.77cde45.8b6.281a–d0.555de11.73a–d0.581bc
N73.4b–e466.3bc47.95cd45.5b6.811b–f0.739f12.71bcd0.574bc
GPT70.2ab496.2e47.02bcd45.8b6.538a–e1.088hi17.92ef0.588bc
EO75.9e477.7b–e47.55cd47.2b6.703b–f0.550cde13.67b–e0.595bc
P70.1ab463.5bcd47.65cd44.4b6.091ab0.419a–d10.15abc0.565b
BCD72.9b–e487.2cde53.30e46.7b7.865gh0.762fg12.25a–d0.595bc
EG72.8b–e478.5b–e48.85cde45.8b6.138abc0.427a–d11.21a–d0.584bc
EBE71.8bcd474.3b–e47.70cd45.4b8.283hi0.764fg13.51b–e0.575bc
BF74.1cde474.5b–e49.07cde46.5b6.823c–f0.752fg15.15de0.585bc
LSD0.053.7423.415.213.380.7310.1754.930.075
Table 5. Quantities (µg/L) of eleven micro elements (Cr, Mn, Fe, Co, Ni, Cu, Zn, Sr, Cd, Ba, and Pb) in white wine samples treated with twenty-one bentonite products including control treatments (Debrecen-Pallag, Hungary). Different letters within each column are significantly different among the bentonite product treatments at p = 0.05 according to LSD t-tests (LSD0.05). Explanations for bentonite product name abbreviations are given in Table 1. Order of used letter for significance differences: a, b, c, d, e, f, g, h, i, j, k, l, m.
Product NameCrMnFeCoNiCuZnSrCdBaPb
C1.58a725.7ab1047a1.56a12.5a14.2fgh209.5a316.2a0.198a39.67a2.27a
SC1.71abc747.1abc1111abc1.69ab14.7a–d23.2m248.2cde337.5ab0.243ab44.18a–d2.85abc
SMC1.63ab741.2abc1105ab1.72abc13.7ab16.4hij246.0cde340.5abc0.225ab48.05c2.63ab
EBS2.36f–i778.7bcd1416g2.02de14.7a–d11.3cde245.7cde376.3c–g0.301abc67.35h4.24hi
FB2.85j792.9cde1728k2.86h17.9e10.9bcd253.2cde363.5b–g0.291abc63.02gh4.07gh
M-SA2.24fgh744.2abc1474ij2.41fg16.2b–e12.9defg263.5e350.5a–f0.323bcd42.93ab2.81ab
NCPE2.38hi852.5f1469ij2.05de15.4a–e8.81b252.7cde431.3i0.311bcd55.85ef4.72ij
EC1.86a–e826.1de1256b–f1.80abcd14.2ab11.6cd236.0a–d386.3fgh0.278ab54.11e3.46def
CR1.93b–e764.2abc1220b–e2.02de15.7b–e18.6jkl244.7b–e371.0b–g0.413d47.78bcd3.49d–g
BW2.59ij781.2cd2132l2.82h16.1b–e9.41bc228.8abc357.5b–g0.318bcd74.32i6.13k
EB1.76a–d769.5abc1116abc1.92bcd14.3a–d18.9k258.2de349.3a–e0.225ab45.10bcd2.51ab
AP2.12efg886.2f1274d–g1.94bcd14.9a–d19.3l248.3cde388.2fgh0.290abc45.62bcd3.79e–h
B2.33f–i769.0abc1440hij2.24ef15.8b–e13.6efg250.0cde379.8d–g0.315bcd53.88e4.78ij
N1.83a–e759.5abc1259c–f1.84acd14.4a–d11.4cde244.7b–e359.3b–g0.251ab66.67h9.46m
GPT2.42hi849.0f1586jk1.99cde16.0b–e6.42a236.5a–e421.7hi0.385cd81.95j7.68l
EO2.39ghi788.9bcd1598jk2.57gh17.3de16.9ijk356.5de359.8b–g0.278ab56.25ef3.36cde
P1.75a–d765.2abc1132a–d1.73abc14.1ab15.2ghi232.7a–d341.2abc0.235ab43.25abc2.98bcd
BCD2.22fgh774.1bcd1606jk2.46fg15.8b–e11.5cde257.5de394.5ghi0.391cd56.35ef6.20k
EG2.07d–g718.5a1315e–h1.98cde14.5a–d13.2def217.5ab336.3ab0.245ab43.25abc2.51ab
EBE2.02c–f846.5ef1291e–h2.06de14.3abc12.1def251.2cde382.0eg0.313bcd48.70d5.16j
BF2.14e–h774.0bcd1380f–i2.26e17.2cde12.3def250.3cde373.8b–g0.321bcd60.71fg3.96fgh
LSD0.050.3454.91510.282.932.3227.338.10.1054.920.58
Table 6. Percentage contribution of twenty-two volatile organic compounds (VOCs) to control (C) treatment in white wine samples treated with twenty-one bentonite products including control treatments (Debrecen-Pallag, Hungary). The order of VOCs follows the increasing retention time (see Table 2), which corresponds to the elongation of the carbonic chain. The relative presence of VOCs is expressed in the percentage of control (C) treatment. Different letters within each column are significantly different among the bentonite product treatments at p= 0.05 according to LSD t-tests (LSD0.05). Order of used letter for significance differences: a, b, c, d, e, f, g, h, i, j, k, l, m. ‘-‘: the VOCs is not detected in the treatment. Explanations for bentonite product name abbreviations are given in Table 1.
Product Name1-Propanol1-Propanol, 2-Methyl-1-Butanol, 3-Methyl-1-Butanol, 2-Methyl-, (S)-1-HexanolEthyl
Acetate
Propanoic Acid, Ethyl EsterIsobutyl Acetate1-Butanol, 3-Methyl-, AcetatePropanoic Acid, 2-Methyl-, Ethyl EsterButanoic Acid, Ethyl Ester
C100e100cd100efg100e100hi100e–h100fgh100d–h100d–g100hi100de
SC94.9cde104.3e114.6g111.6g109.5i101.2fgh89.7e–h107.7fgh92.9c–g84.6f–i101.0de
SMC92.3cde103.6de105.2fg104.9fg73.4d–h102.7gh99.9fgh112.7gh108.3fg86.5ghi108.3e
EBS79.7b–e90.9b–e82.1def80.2b–e53.3a–f90.4c–h78.5c–f87.2c–h89.2c–f71.2b–i90.6cde
FB76.1bcd82.6ab61.3a–d65.7abc31.9ab79.2abc57.5abc67.3abc76.4bcd50.8a–e68.6abc
M-SA81.4b–e79.4ab69.5a–d71.6abc54.5a–f83.1b–e70.5b–e92.6c–h80.5b–e68.5b–i69.9abc
NCPE89.6cde101.3d103.9fg103.1fg85.5f–i99.3d–h104.0h114.1h89.8c–f79.0c–i96.4de
EC84.1b–e97.5cde77.5b–e79.7b–e63.7b–g89.6c–h73.6b–e80.6b–f79.2b–e55.4a–g82.1bcd
CR85.0b–e83.0ab77.1b–e77.4a–d51.4a–f88.2c–g67.8bcd99.0d–h77.4bcd50.3a–e81.2bcd
BW79.9b–e92.6b–e92.9ef92.7def77.2d–i93.5c–h83.5d–h54.3ab79.3b–e81.4d–i91.8de
EB84.1b–e73.6a52.2a56.9a24.2a69.6ab57.7abc82.9c–g62.8ab40.7ab57.8ab
AP83.2b–e92.4b–e94.8efg93.7d–g82.5e–i94.8c–h80.5def91.2c–h83.1b–f60.5a–g88.1cde
B75.9bcd80.6ab64.3a–d66.5abc50.2a82.5bcd55.4ab75.4b–e71.2ab48.2a–d77.8bcd
N80.0b–e99.6cde96.2efg99.7efg84.4f–i102.8gh88.5e–h105.7e–h117.3g83.5e–i110.4e
GPT49.3a94.8efg86.1c–g99.0hi106.5h102.1gh75.2bcd104.2efg101.8i109.1e
EO65.4ab72.2a54.7ab58.9a26.1a63.2ab44.1ab37.5a47.6a28.2a47.4a
P74.4bc80.4ab67.6a–d70.6abc46.7a–d83.9b–f71.3b–e79.9b–f75.8bcd52.1a–f77.8bcd
BCD97.2de102.2de109.1g108.4g97.6ghi100.9fgh80.4df112.3gh96.7c–g81.6d–i95.9de
EG82.9b–e86.2abc64.3a–d68.8abc43.4a–d82.6b–e75.3b–e96.4c–h71.7abc46.8abc76.8bcd
EBE82.5b–e89.6bcd80.5cde81.5b–e67.1c–h86.8b–g80.9d–g96.7c–h75.7bcd66.9b–h85.8cde
BF77.4bcd79.4ab57.6abc62.5ab34.8abc78abc63.7a–d87.1c–h70.9abc44.4ab65.7abc
LSD0.0522.414.223.120.534.117.421.530.426.133.725.8
Product NameHexanoic Acid, Ethyl EsterButanedi-oic Acid, Diethyl EsterOctanoic Acid, Ethyl EsterTriethyl Borate4-Amino-1,5-Pentandioic AcidAcetic Acidδ-Dodecalactone1,3-Dioxolane, 2,4,5-Trimethyl-Phenol, 2-Methyl-Phenol, 2-Methoxy-Phenylethyl Alcohol
C100ghi100f100fgh100fgh100f100e–h100ef100hi100def100fgh100jk
SC95.4e–h80.8ef94.2e–h64.6b–e81.4ef82.3c–g93.3def90.3ghi105.8ef123.1h102.8ijk
SMC97.7fgh93.9ef106.1gh68.1c–f80.2def118.6ghi72.1b–e86.2fgh110.9ef89.1e–h90.2f–k
EBS75.4b–g89.6ef78.4c–g85.7efg28.4a91.9c–h48.7ab34.7ab70.6bcd54.8a–e126.1k
FB66.5a–d38.2a45.4abc38.4ab57.8a–d41.2ab37.3ab27.1abc
M-SA67.9a–e53.8cd70.6b–f85.3efg39.7ab74.1b–f41.7ab46.9abc23.4a65.1d–h
NCPE107.1hi37.5abc110.1h104.3fgh65.1b–e55.7a–d134.1g76.5d–h19.0a25.9ab
EC79.5c–h73.8de65.9a–d129.6h58.9a–d97.7e–h30.1a59.3b–f52.4abc102.6fgh60.5b–f
CR74.1b–g51.4bcd72.4b–f85.9efg45.6abc169.8j115.9fg58.6b–f32.6a49.7a–d82.5e–i
BW90.7d–h79.5ef88.3e–h110.1fgh65.4b–e107.5fgh60.5a–d69.7c–g56.9a–e103.7ijk
EB51.0ab47.3ab35.8ab27.8a65.4a–e42.4ab38.7ab43.6abc24.2a
AP71.0a–f74.4de94.8e–h109.4fgh63.4b–e150.6ij110.1f59.7b–f50.9abc79.9c–g67.6e–i
B74.9b–g23.9a57.8a–d64.5b–e47.7a–d85.4c–h48.1ab46.6abc50.1ab74.6b–f52.2a–e
N126.4i94.7efgh88.9efg75.7c–f57.9a–d113.1fg77.6e–h32.3a28.4a98.5g–k
GPT81.1c–h49.4bc107.9gh78.4def99.9f91.7c–h97.8e117.1i86.2de117.7gh44.3a–d
EO45.9a37.9abc75.6c–f54.1abc21.8a18.5a19.4a
P70.2a–f74.3b–f50.2a–d37.7ab29.9ab57.1abc50.8b–e39.9ab39.9ab86.1e–j
BCD87.2d-h77.5ef87.4d–h124.6h70.7b–f93.4d–h85.5c–f77.2e–h123.1f107.1fgh62.3c–g
EG71.4a–f28.4ab49.3abc31.3a43.9abc72.7b–f49.4a–d50.1ab88.4d–h51.1a–e
EBE75.1b–g97.8f82.8d–h110.8gh65.1b–e121.1hi55.1abc53.9b–e83.4cde89.1e–h120.9jk
BF57.2abc25.9a65.2a–d58.9a–e28.4a40.5ab40.5ab35.2ab24.6a29.2a–d
LSD0.0527.823.129.832.233.138.233.227.732.738.836.2
Table 7. Effect of twenty-one bentonite product treatments including controls on ten organoleptic parameters in white wine samples (Debrecen-Pallag, Hungary). Different letters within each column are significantly different among the bentonite product treatments at p = 0.05 according to LSD t-tests (LSD0.05). Explanations for bentonite product name abbreviations are given in Table 1. Scales for the 10 parameters including the two anchors were as follows: skin and flesh colour: 0 = unacceptable, 9 = excellent; flavour intensity and character: 0 = very weak, 8 = very strong; flavour quality: 0 = unacceptable and 15 = excellent; taste intensity, character and persistency: 0 = very bad, 8 = excellent; taste quality: 0 = very bad, 20 = excellent and overall harmony: 0 = unacceptable, 10 = excellent.
Product NameClearnessColourFlavor
Intensity
Flavor
Character
Flavor QualityTaste
Intensity
Taste
Character
Taste
Quality
Taste
Persistency
Overall Harmony
C3.62bcd7.69ab5.46bcd4.31de12.00cde6.08a–d3.92ab15.08abc5.62a8.85abc
SC3.46abc7.54a5.85de4.23cde12.31de6.46d5.77f15.38a–d6.23c9.08abc
SMC3.77cde7.85abc5.15ab3.85abc11.85cde6.31cd4.46de16.92f6.15bc9.31bc
EBS3.69bcd7.85abc5.85de4.00bcd11.85cde6.00a–d4.00abc14.85ab5.92abc8.85abc
FB3.23a7.54a5.54bcd4.08bcd11.38abc5.69ab4.08a–d14.62a5.62a8.77ab
M-SA3.46abc7.69ab4.77a3.77ab10.77ab5.62a4.08a–d15.00ab5.62a8.77ab
NCPE3.54a–d8.00a–d5.54bcd4.00bcd11.69cde5.69ab4.00abc15.54a–e5.62a8.85abc
EC3.69bcd8.00abc5.08ab3.85abc11.54bcd6.08a–d3.92ab14.85ab5.92abc8.77ab
CR3.23a7.54a5.54bcd4.08bcd11.85cde6.15bcd4.31cde15.08abc6.00abc9.00abc
BW3.77cde8.31bcd5.92de4.23cde12.00cde6.08a–d4.23b–e15.77b–e5.85abc9.08abc
EB3.69bcd8.00a–d5.92de4.08bcd12.46e6.38cd4.46de16.46ef6.15bc9.31bc
AP3.77cde8.15a–d5.77cde4.52e12.46e6.38cd4.38cde16.46ef6.00bc9.54c
B3.62bcd8.00a–d5.31bc3.85abc11.83cde6.38cd4.46de16.23def5.85abc9.15abc
N3.38ab7.54a5.54bcd3.85abc12.00cde5.92abc3.92ab15.54a–e5.69abc8.92abc
GPT3.77cde8.46cd5.38bc4.00bcd12.15cde6.15bcd4.23b–e15.77b–e5.85abc9.00abc
EO3.85de8.15a–d5.92de4.00bcd11.85cde6.15bcd4.00abc16.00c–f5.85abc9.15abc
P3.85de8.00a–d5.46bcd4.00bcd12.31de6.08a–d4.08a–d14.85ab5.69abc8.77ab
BCD3.85de8.15a–d5.46bcd3.77ab11.69cde6.23cd3.92ab15.54a–e5.92abc9.00abc
EG3.69bcd8.15a–d5.46bcd4.08bcd11.54bcd6.08a–d4.08a–d16.23def5.77abc9.15abc
EBE4.62f8.62d5.31bc3.54a10.62a5.92abc3.77a14.62a5.69abc8.46a
BF4.08e8.15a–d6.15e4.23cde11.85cde6.15bcd4.54e16.92f6.00abc9.23bc
LSD0.050.360.680.460.420.880.510.380.960.480.71
Table 8. Pearson correlation coefficients (r) amongst ten oenological measurements of white wine in twenty-one bentonite product treatments (Debrecen-Pallag, Hungary). Bold figures represent the significant (p < 0.05) correlation coefficient values among parameter pairs.
SugarAcidityTartaric AcidMalic AcidLactic AcidCitric AcidVolatile AcidSulphur FreeSulphur BoundTotal
Phenol
Alcohol−0.1040.0500.723−0.1600.4320.078−0.1010.247−0.168−0.058
Sugar 0.0900.1940.3270.4210.7070.5880.0470.1140.824
Acidity 0.3110.9010.6240.5560.6410.0320.551−0.461
Tartaric acid 0.1730.2020.317−0.3310.1270.013−0.296
Malic acid −0.5490.7310.737−0.0110.6670.631
Lactic acid 0.126−0.0140.284−0.306−0.255
Citric acid 0.9140.2970.6660.953
Volatile acid −0.3990.5910.886
Sulphur free 0.205−0.281
Sulphur bound −0.469
Table 9. Factor loadings calculated from Principal Axis Factor Analysis (Varimax rotation) for ten oenological measurements of white wine samples in twenty-one bentonite product treatments (Debrecen-Pallag, Hungary). Factor loadings above 0.69 were significant at p = 0.05. Bold figures represent the significant (p < 0.05) factor loadings.
Factors1234
Alcohol0.06730.61230.7638−0.0124
Sugar0.70310.4352−0.5239−0.3815
Acidity0.7345−0.47230.4011−0.1427
Tartaric acid0.34220.42710.6021−0.2572
Malic acid0.8517−0.47370.0931−0.1582
Lactic acid−0.09320.9616−0.22180.1118
Citric acid0.97360.1725−0.12520.0731
Volatile acid0.9444−0.11380.0048−0.1352
Sulphur-free 0.26120.31320.09270.6927
Sulphur-bound0.7025−0.3529−0.01360.4438
Total phenol0.9138−0.30270.23610.0615
Variance5.052.541.581.05
Explained variance (%)45.422.714.49.5
Table 10. Pearson correlation coefficients (r) amongst nineteen chemical elements of white wine from Debrecen-Pallag, Hungary. Bold figures represent the significant (p < 0.05) correlation coefficient values among parameter pairs.
BCaKMgNaPSCrMnFeCoNiCuZnSrCdBaPb
Al0.4010.5060.4660.4520.853−0.740.4390.6840.5060.7890.5080.3810.588−0.0510.6390.4730.8250.659
B 0.6860.9010.9020.4350.7270.4990.5960.3150.5660.6100.675−0.0150.4470.4750.5490.3230.185
Ca 0.6450.6320.4280.2610.4930.5690.2960.5700.5830.455−0.5140.1350.5140.6170.3200.311
K 0.7430.4520.4560.4610.5390.3540.5030.4380.540−0.0780.2430.5940.7160.4470.276
Mg 0.5920.7650.3220.7280.2530.6790.7720.799−0.1310.5310.3950.4330.4590.241
Na 0.0690.1740.8380.3510.8890.7420.662−0.5180.0900.4180.4680.8480.569
P 0.1730.215−0.0250.1880.4220.5180.3160.6280.0070.017−0.011−0.081
S 0.2870.5910.2460.1980.151−0.0910.1610.6020.4510.0590.232
Cr 0.3690.8840.8610.805−0.4710.2910.5040.5310.6320.334
Mn 0.2310.1070.191−0.2580.1530.7980.3690.3340.329
Fe 0.8910.701−0.4690.2170.3630.5030.6930.439
Co 0.847−0.3510.4250.2140.4680.4510.222
Ni −0.1910.5370.3620.5730.4720.201
Cu 0.121−0.436−0.321−0.511−0.438
Zn 0.1310.1200.053−0.042
Sr 0.6810.5310.517
Cd 0.4530.427
Ba 0.761
Table 11. Factor loadings from principal axis factor analysis (Varimax rotation) for nineteen chemical elements of white wine in twenty-one bentonite product treatments (Debrecen-Pallag, Hungary). Factor loadings above 0.69 were significant at p = 0.05. Bold figures represent the significant (p < 0.05) factor loadings.
Factors1234
B0.97410.36560.50020.2957
Ca0.78160.38640.50560.4579
K0.84440.51440.46480.4279
Mg0.92520.27290.57570.3572
P0.7453−0.05170.1829−0.1635
S0.57150.40710.16220.1337
Mn0.22830.84710.30590.3751
Sr0.42710.93440.33250.5392
Cd0.29480.70190.3290.3692
Zn0.32110.09610.4952−0.0346
Co0.47170.21960.94050.5523
Ni0.45260.39920.87620.4516
Fe0.43030.37270.89130.7501
Cr0.42530.44860.87340.7054
Na0.39630.41830.78320.9104
Ba0.26590.45980.58430.9263
Pb0.1790.47710.33550.8211
Al0.38940.51090.64530.9368
Cu−0.1203−0.3699−0.32070.7051
Variance9.283.112.081.02
Explained variance (%)48.816.311.15.4
Table 12. Pearson correlation coefficients (r) amongst twenty-one volatile organic compounds (VOCs) of white wine from Debrecen-Pallag, Hungary. Bold figures represent the significant (p < 0.05) correlation coefficient values among parameter pairs. Ace: Acetic acid, Eth: Ethyl Acetate, 1-P2: 1-Propanol, 2-methyl, δ-Do: δ-Dodecalactone, Pro: Propanoic acid, ethyl ester, 1,3-D: 1,3-Dioxolane, 2,4,5-trimethyl-, 1-B3: 1-Butanol, 3-methyl-, 1-B2: 1-Butanol, 2-methyl-, (S)-, 4-Am: 4-Amino-1,5-pentandioic acid, Pr2: Propanoic acid, 2-methyl-, ethyl ester, Iso: Isobutyl acetate, Tri: Triethyl borate, But: Butanoic acid, ethyl ester, 1-He: 1-Hexanol, 1-Bu: 1-Butanol, 3-methyl-, acetate, Hex: Hexanoic acid, ethyl ester, Phl: Phenol, 2-methyl-, Phy: Phenol, 2-methoxy-, Pha: Phenylethyl Alcohol, Bud: Butanedioic acid, diethyl ester, Oct: Octanoic acid, ethyl ester.
AceEth1-P2δ-DoPro1,3-D1-B31-B24-AmPr2IsoTriBut1-He1-BuHexPhlPhyPhaBudOct
1-Propanol0.2430.2960.7770.3040.296−0.0120.4580.5400.0620.2410.6810.3430.2670.3380.2780.4250.3420.2050.2610.4630.324
Acetic acid 0.3540.2920.3980.2440.2450.3760.3420.2540.2330.2210.5110.3330.3320.1920.1230.3980.4590.4240.6660.345
Ethyl Acetate 0.9420.7590.9110.8410.9280.9050.6430.9120.6170.5950.9810.9210.9240.8490.6410.5510.3310.5750.921
1-Propanol, 2-methyl- 0.6110.8830.8730.9410.9490.6750.8590.6570.6210.9220.9020.8430.8520.6610.5870.3520.6370.806
δ-Dodecalactone 0.7050.6380.7570.7360.4840.6510.5920.5380.7230.7480.6640.6820.3170.1820.2080.3390.823
Propanoic acid, ethyl ester 0.8220.8590.8390.6410.9060.6160.4930.9050.8450.8350.7920.5410.4540.3370.5770.918
1,3-Dioxolane, 2,4,5-trimethyl- 0.7410.6750.7910.8610.3590.3490.8170.8330.7590.6260.5710.6140.1160.3890.755
1-Butanol, 3-methyl- 0.9920.7030.8650.5970.6130.8960.9480.8110.8090.6490.5320.3490.6490.844
1-Butanol, 2-methyl-, (S)- 0.6680.8340.6310.6110.8790.9210.8080.8370.6280.4860.3580.6290.819
4-Amino-1,5-pentandioic acid 0.7010.1480.3580.6390.7740.5560.5680.5510.5410.1780.4040.478
Propanoic acid, 2-methyl-, ethyl ester 0.4790.5260.9030.8910.8810.7810.5890.4920.3680.6010.863
Isobutyl acetate 0.3220.5940.5220.6410.5910.5110.2910.2760.3870.669
Triethyl borate 0.5260.6330.4410.4920.3210.3160.4220.6720.601
Butanoic acid, ethyl ester 0.8780.9340.8790.6560.5360.4160.5490.901
1-Hexanol 0.7830.7710.6550.6210.3380.6170.836
1-Butanol, 3-methyl-, acetate 0.8580.5770.3860.2870.4120.836
Hexanoic acid, ethyl ester 0.3910.2460.3220.3820.759
Phenol, 2-methyl- 0.8550.4740.6650.515
Phenol, 2-methoxy- 0.3250.6360.413
Phenylethyl Alcohol 0.6160.396
Butanedioic acid, diethyl ester 0.591
Table 13. Factor loadings for twenty-two volatile organic compounds (VOCs) of white wine calculated from principal axis factor analysis (Varimax rotation). Factor loadings above 0.695 were significant at p = 0.05. Bold figures represent the significant (p < 0.05) factor loadings.
Factors1234
1-Propanol0.81370.46640.5481−0.0027
Ethyl Acetate0.97680.70930.54310.0127
1-Propanol, 2-methyl-0.94660.68760.57010.0255
Propanoic acid, ethyl ester0.92830.66510.39960.0862
1,3-Dioxolane, 2,4,5-trimethyl-0.93120.58190.4663−0.0265
1-Butanol, 3-methyl-0.94950.70450.53920.0243
1-Butanol, 2-methyl-, (S)-0.95890.69160.52380.0128
Propanoic acid, 2-methyl-, ethyl ester0.92160.69460.45570.0717
Isobutyl acetate0.67080.3310.35240.1087
Butanoic acid, ethyl ester0.96320.70510.51970.0656
1-Hexanol0.93060.71860.58560.0681
1-Butanol, 3-methyl-, acetate0.85660.52360.4621−0.0448
Hexanoic acid, ethyl ester0.89660.57320.2664−0.0381
Octanoic acid, ethyl ester0.9050.66820.39750.1221
2-Butanone−0.45440.7175−0.3148−0.1189
Triethyl borate0.64470.79430.26950.2537
Phenylethyl Alcohol0.38160.72820.47800.7443
Butanedioic acid, diethyl ester0.65670.87820.63020.3334
4-Amino-1,5-pentandioic acid0.64290.53180.36030.1211
Phenol, 2-methyl-0.56150.57640.96250.2503
Phenol, 2-methoxy-0.42060.47870.96250.2478
Acetic acid0.03490.45830.25880.9789
Variance14.82.111.230.99
Explained variance (%)67.39.65.64.5
Table 14. Pearson correlation coefficients (r) amongst 10 organoleptic parameters of white wine from Debrecen-Pallag, Hungary. Bold figures represent the significant (p < 0.05) correlation coefficient values among parameter pairs.
ColourFlavor
Intesity
Flavor
Character
Flavor
Quality
Taste
Intensity
Taste
Character
Taste
Quality
Taste
Persistency
Overall
Harmony
Clearness0.8290.101−0.276−0.2440.154−0.2150.1470.036−0.111
Colour 0.101−0.159−0.1230.140−0.2800.245−0.0250.040
Flavor intensity 0.6120.5730.3690.3350.3490.3840.448
Flavor character 0.6710.3390.4120.3190.2580.581
Flavor quality 0.6670.4570.4320.5100.646
Taste intensity 0.5940.5710.8150.701
Taste character 0.3390.6990.469
Taste quality 0.5280.884
Taste persistency 0.654
Table 15. Factor loadings for ten organoleptic parameters of white wine calculated from principal axis factor analysis (Varimax rotation). Factor loadings above 0.69 were significant at p = 0.05. Bold figures represent the significant (p < 0.05) factor loadings.
Factors1234
Clearness0.09140.93070.04030.2415
Colour0.03450.93120.18140.0128
Flavor intensity−0.55370.08350.70220.3457
Flavor character−0.5728−0.31270.71560.0239
Flavor quality0.8235−0.19110.24710.0562
Taste intensity0.84870.2339−0.29790.1359
Taste character0.7128−0.2563−0.37740.3472
Taste quality0.73710.3428−0.06590.6991
Taste persistency0.81750.1148−0.45180.2159
Overall harmony0.89390.08290.0112−0.4292
Variance4.822.211.190.83
Explained variance (%)47.221.211.38.0
Disclaimer/Publisher’s Note: The statements, opinions and data contained in all publications are solely those of the individual author(s) and contributor(s) and not of MDPI and/or the editor(s). MDPI and/or the editor(s) disclaim responsibility for any injury to people or property resulting from any ideas, methods, instructions or products referred to in the content.

