
Chemical Analysis of Various Tea Samples Concerning Volatile Compounds, Fatty Acids, Minerals and Assessment of Their Thermal Behavior


Abstract
1. Introduction
2. Materials and Methods
2.1. Chemicals and Reagents
2.2. Tea Samples
2.3. Thermal Analysis
2.4. Oil Extraction from Teas
2.5. Volatile Composition
2.6. Mineral Profile
2.7. Cellulose, Hemicelluloses, and Lignin Content
2.8. Polyphenol Content
2.9. Statistical Analysis
3. Results and Discussions
3.1. Thermal Behavior
3.2. Cellulose, Hemicelluloses, and Lignin Content of Tea Samples
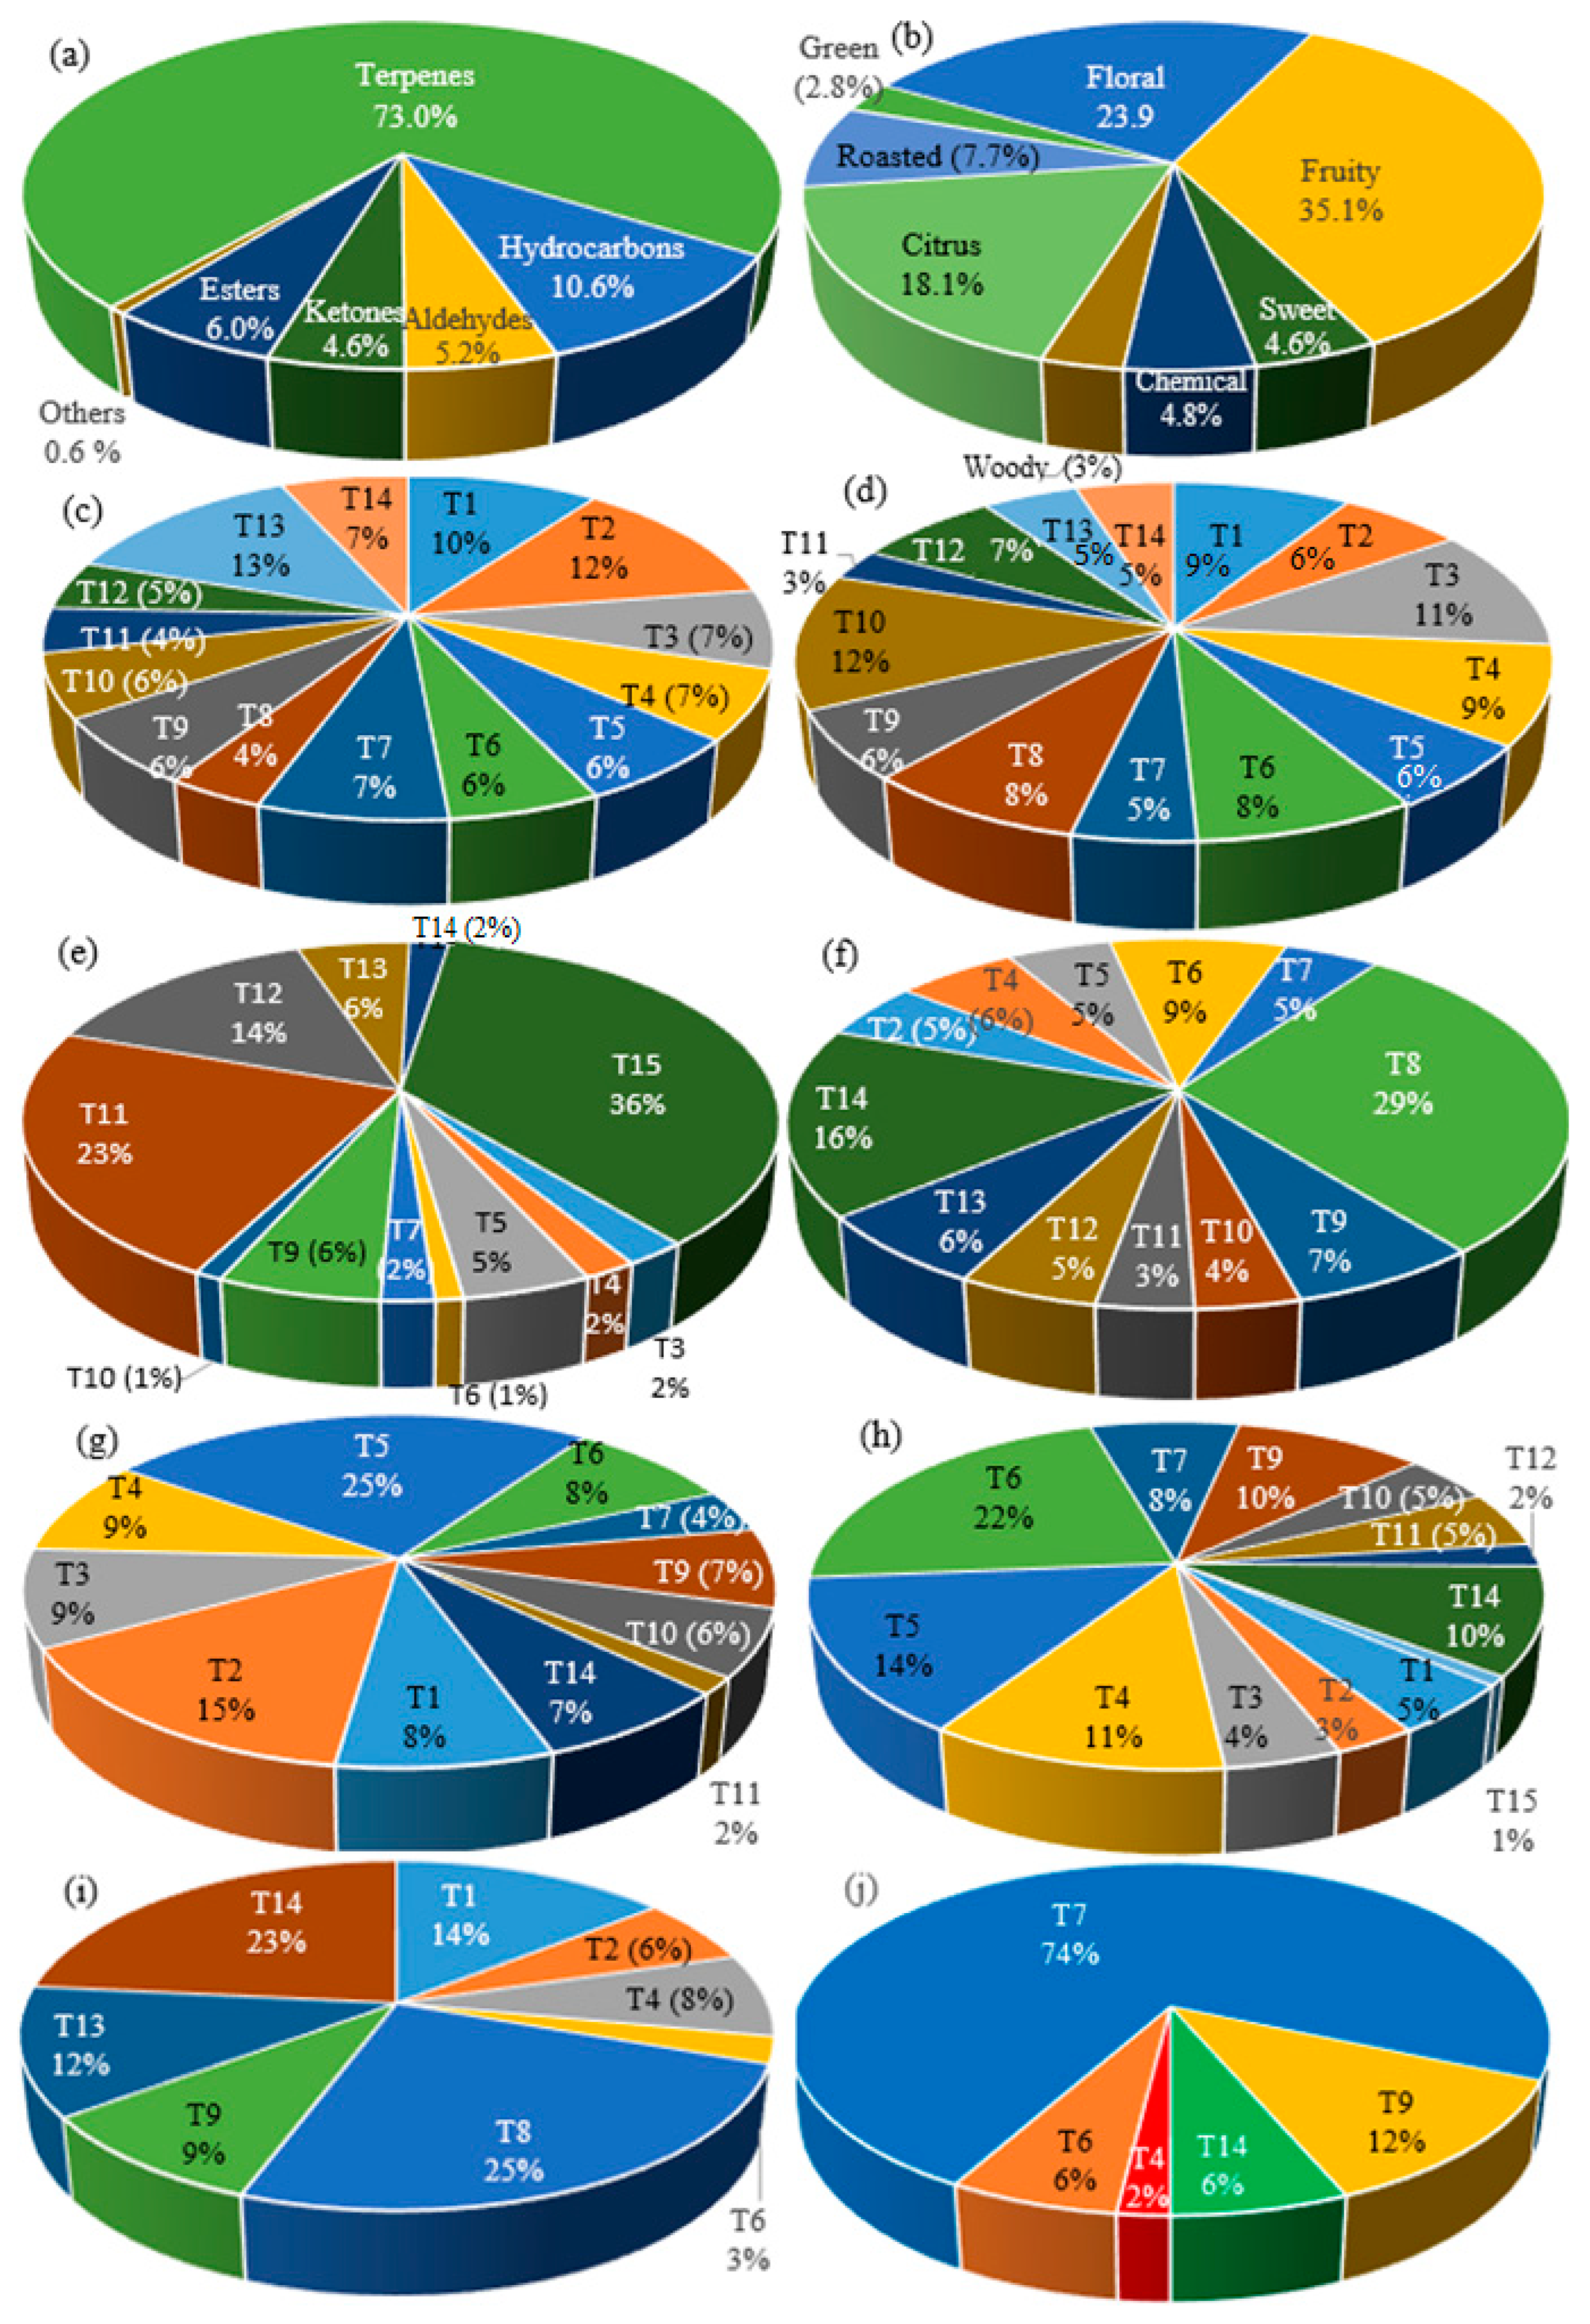
3.3. HS-SPME GC-MS Analysis of Volatile Organic Compounds
3.4. FAMEs Content of Tea Samples
3.5. Mineral Compositions and the Content of Total Polyphenols
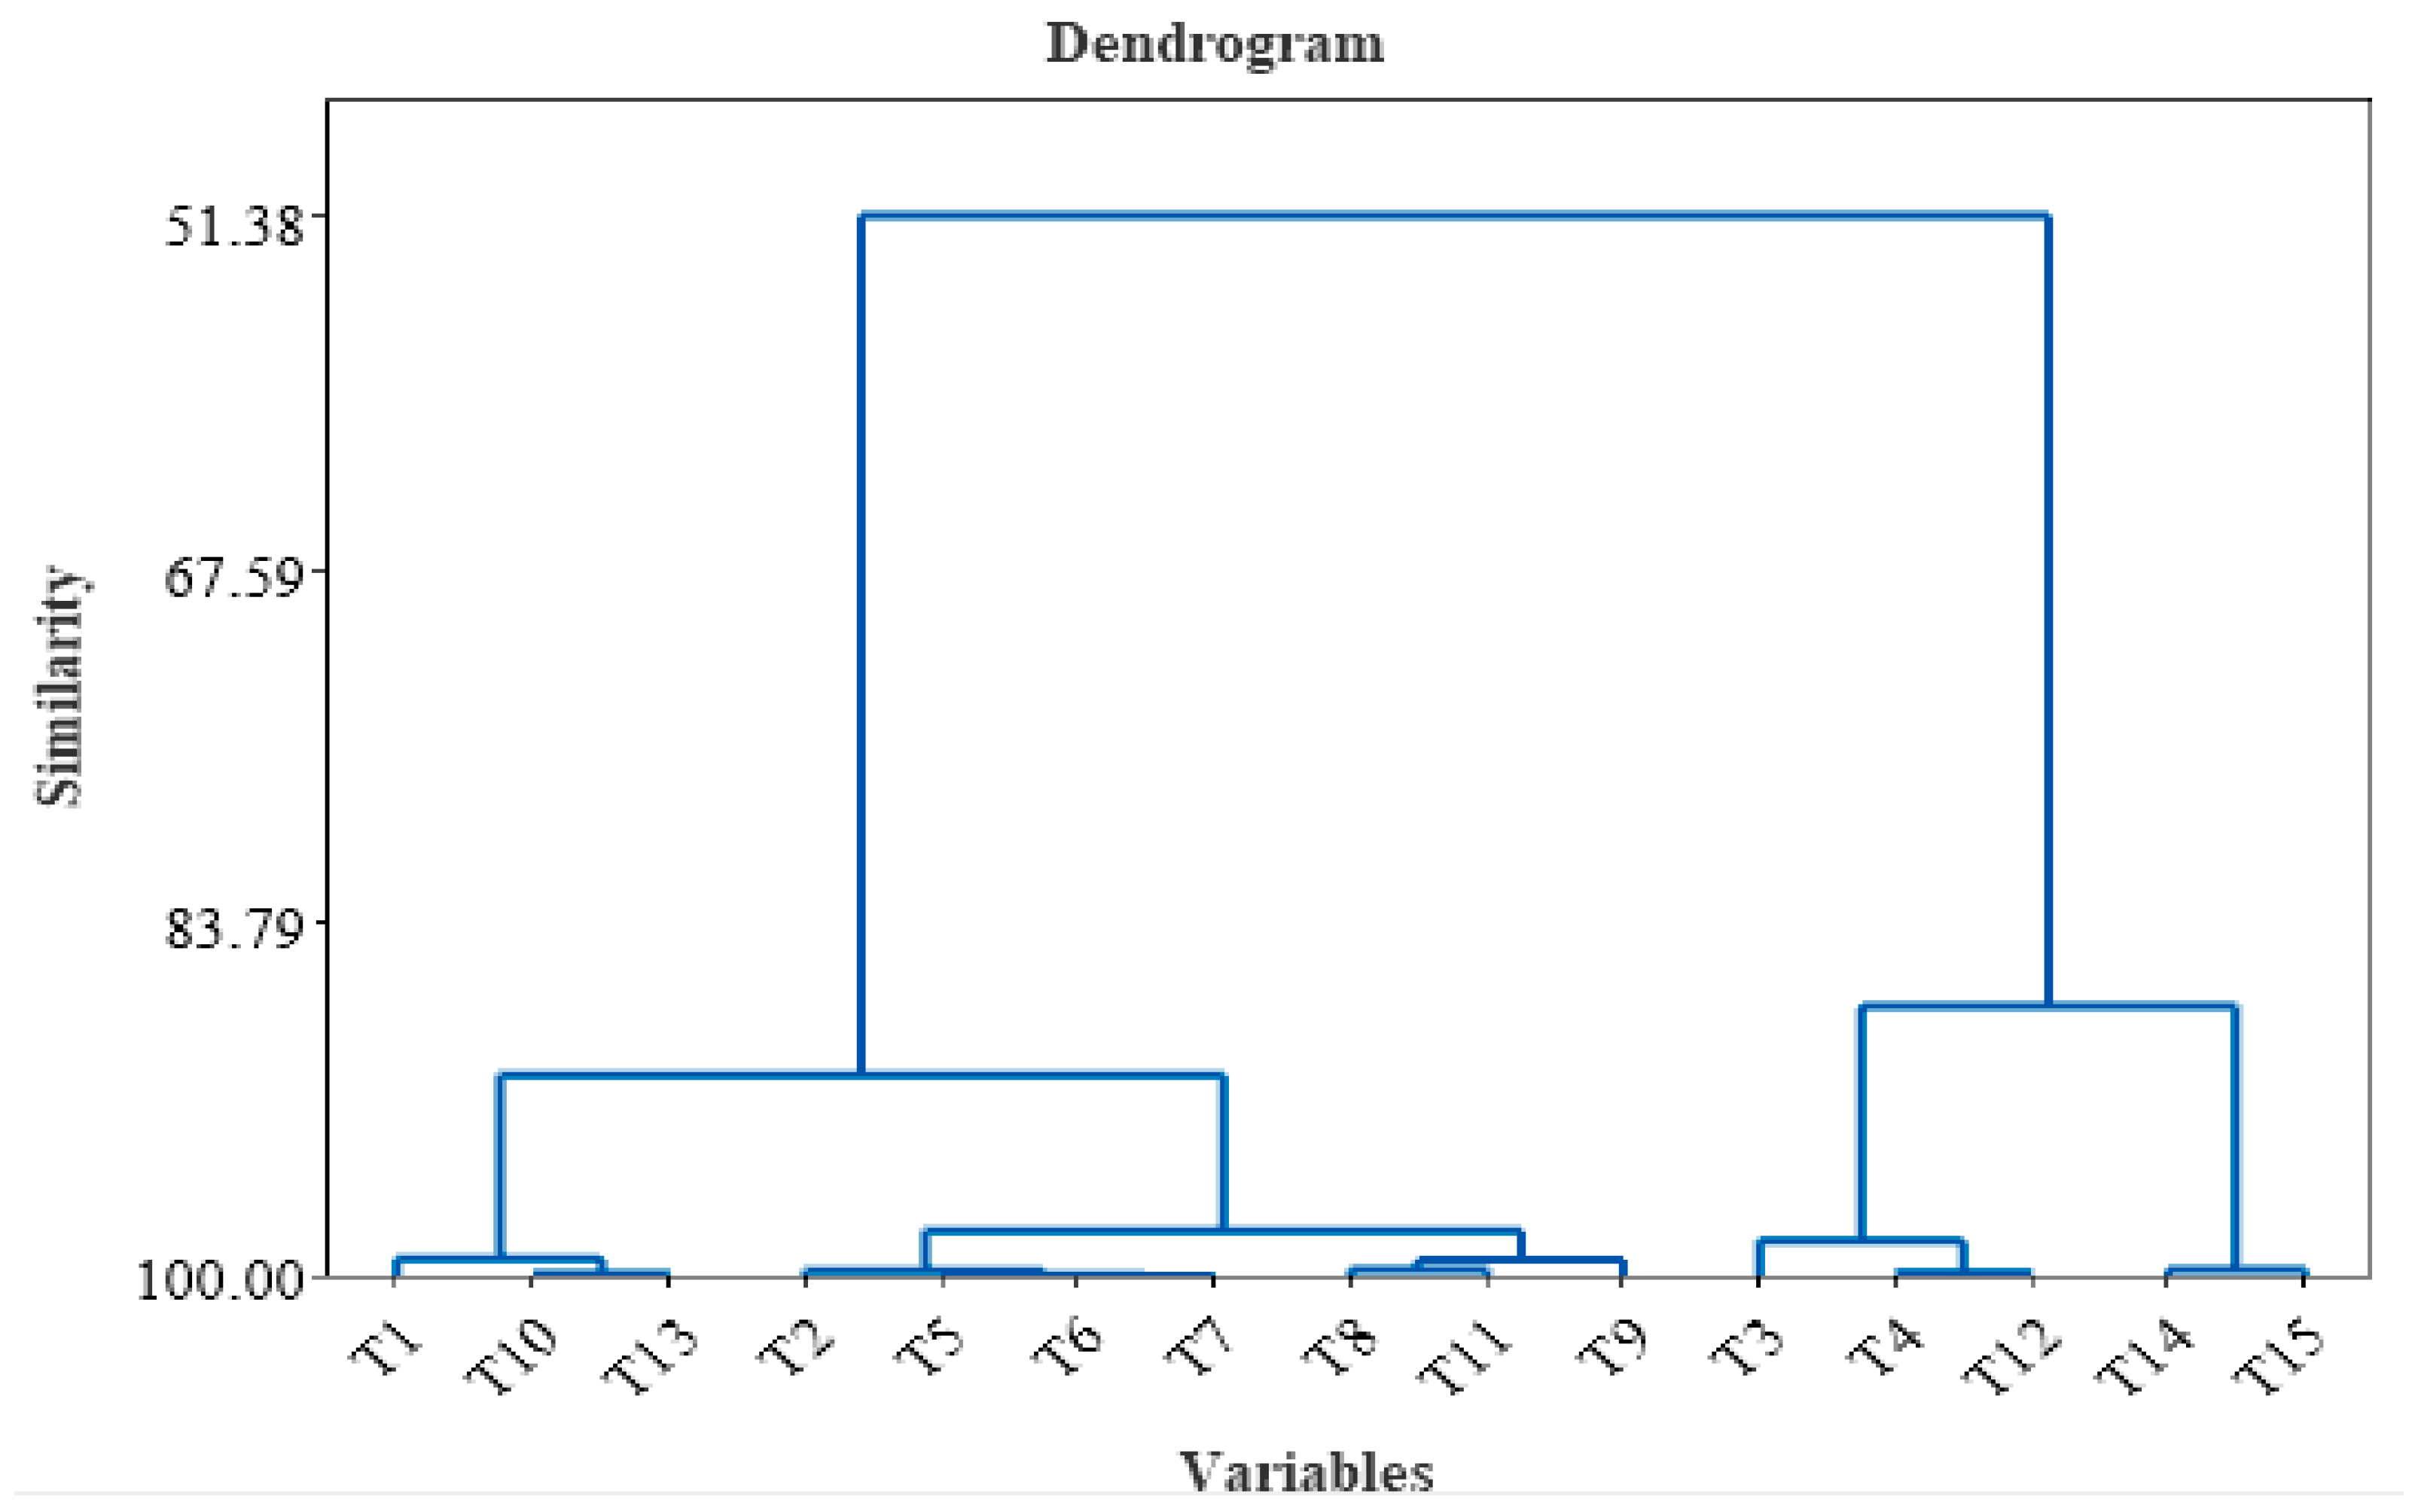
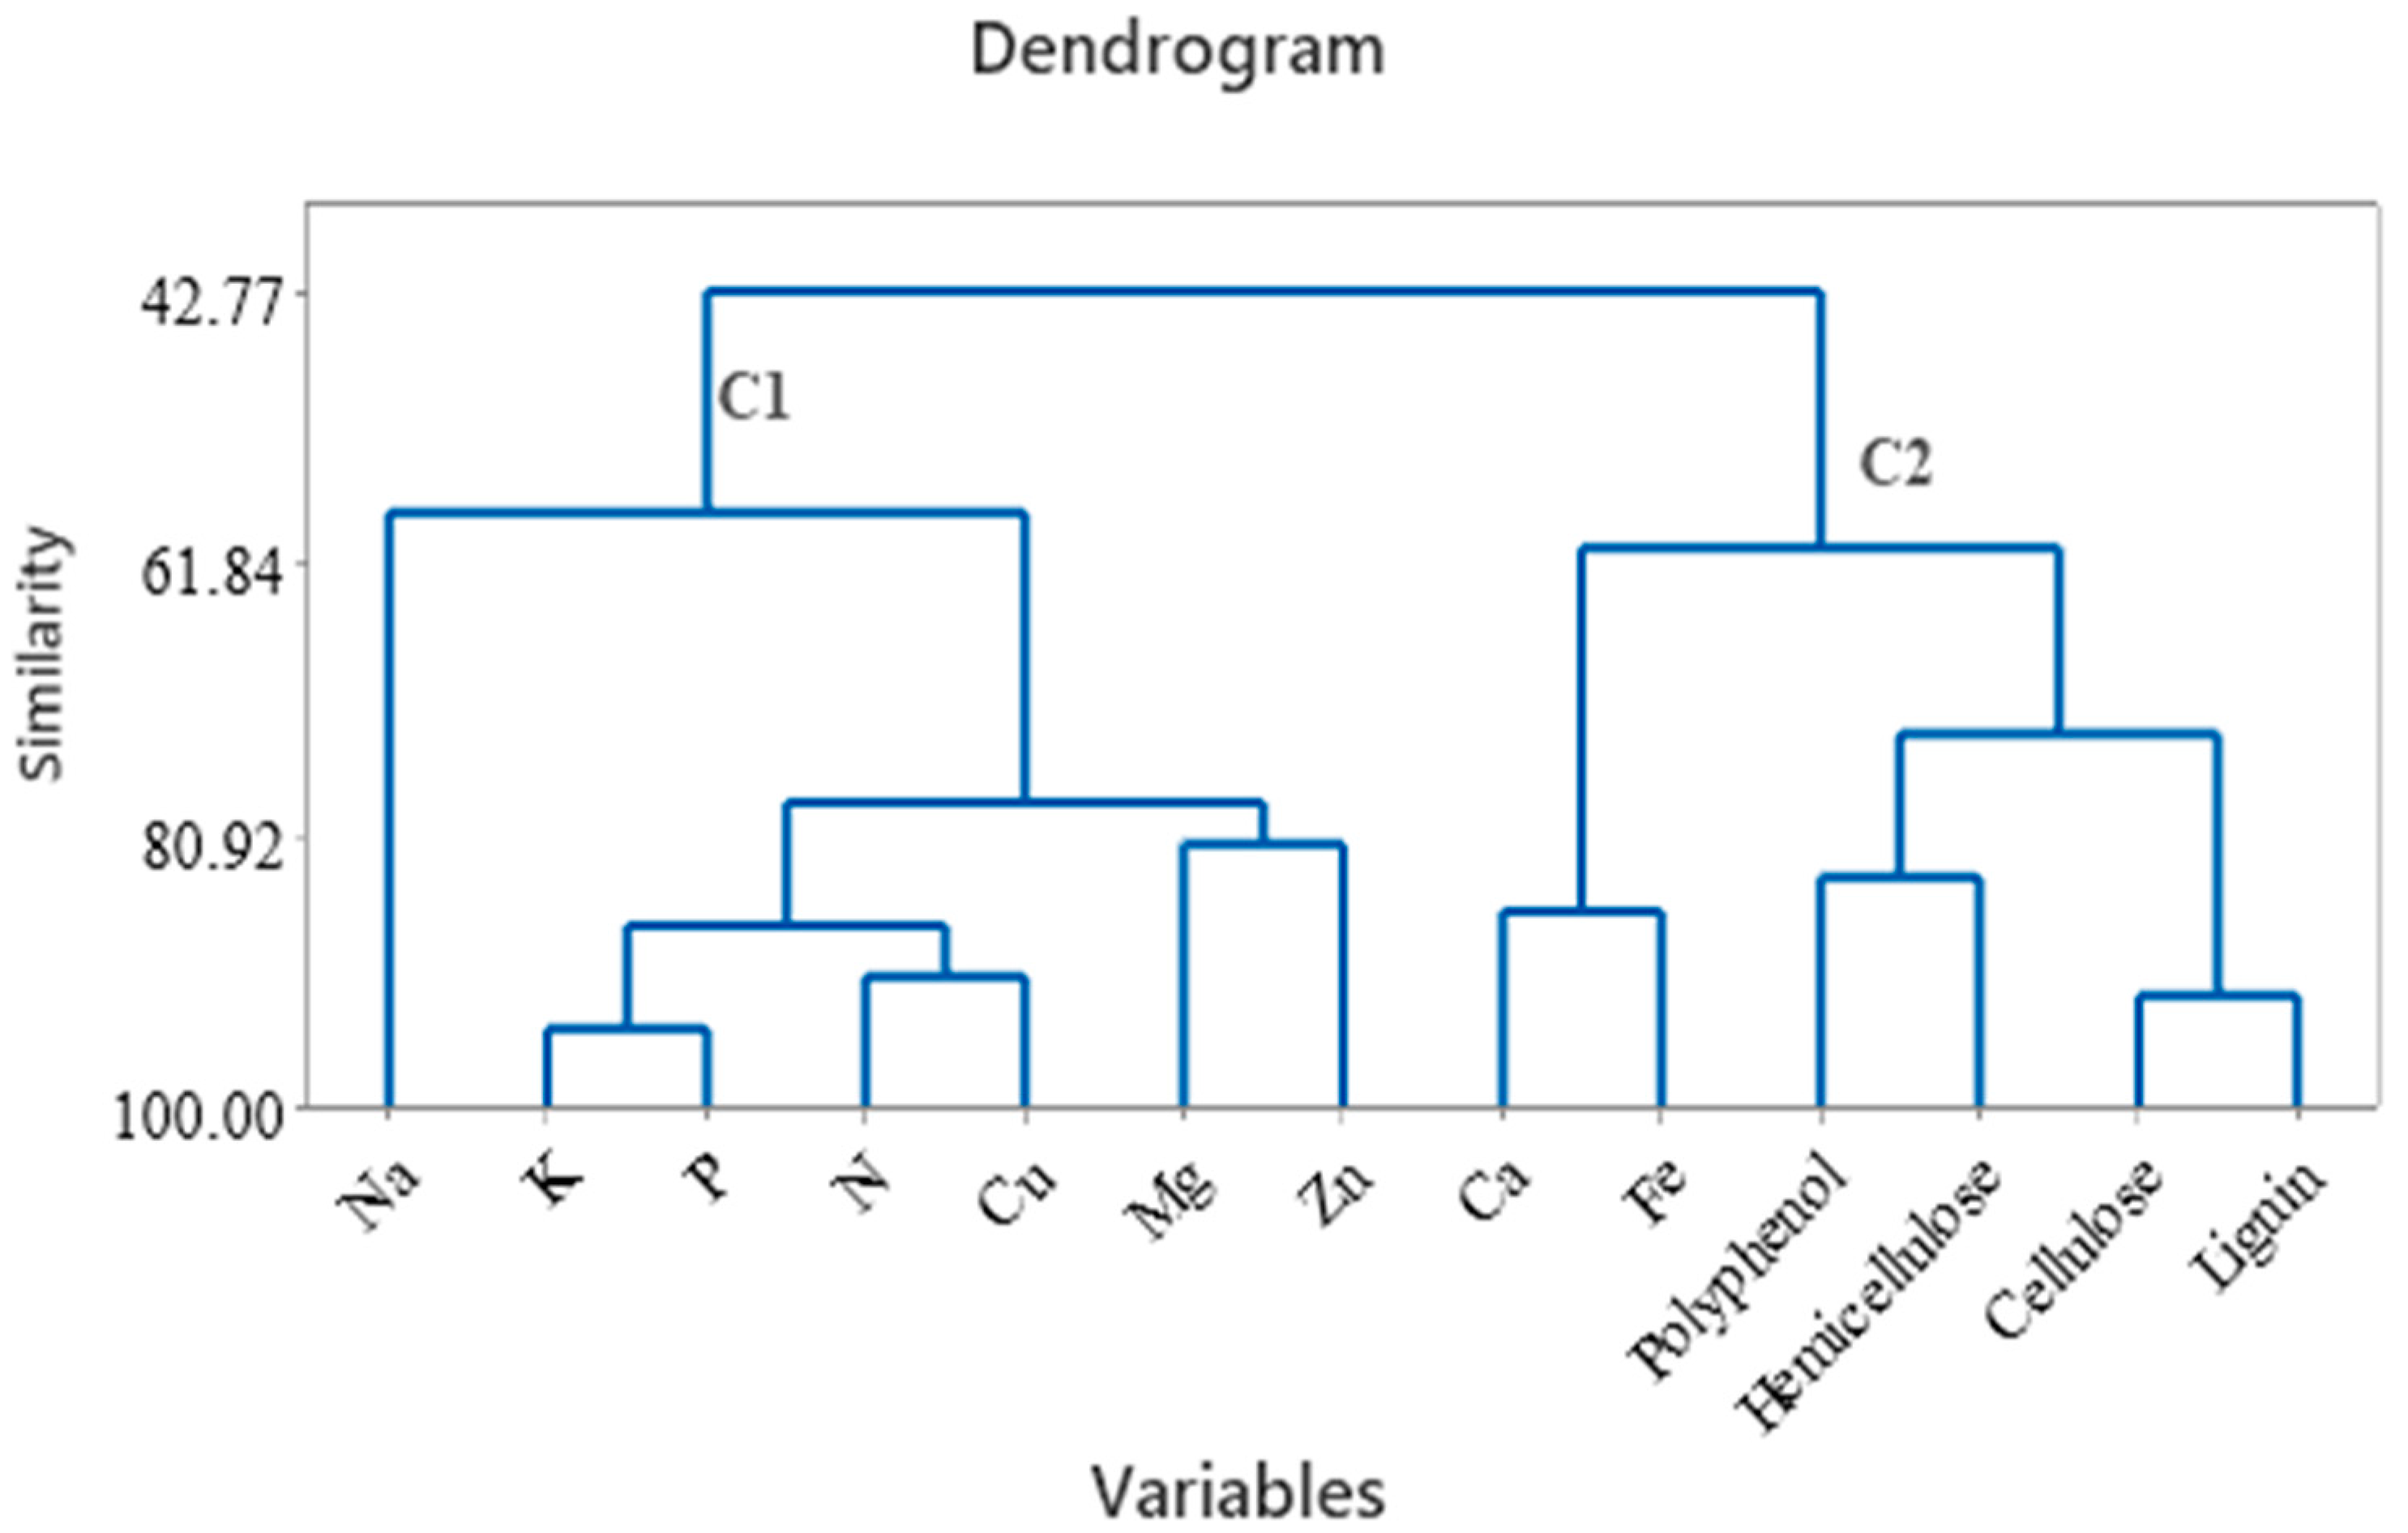
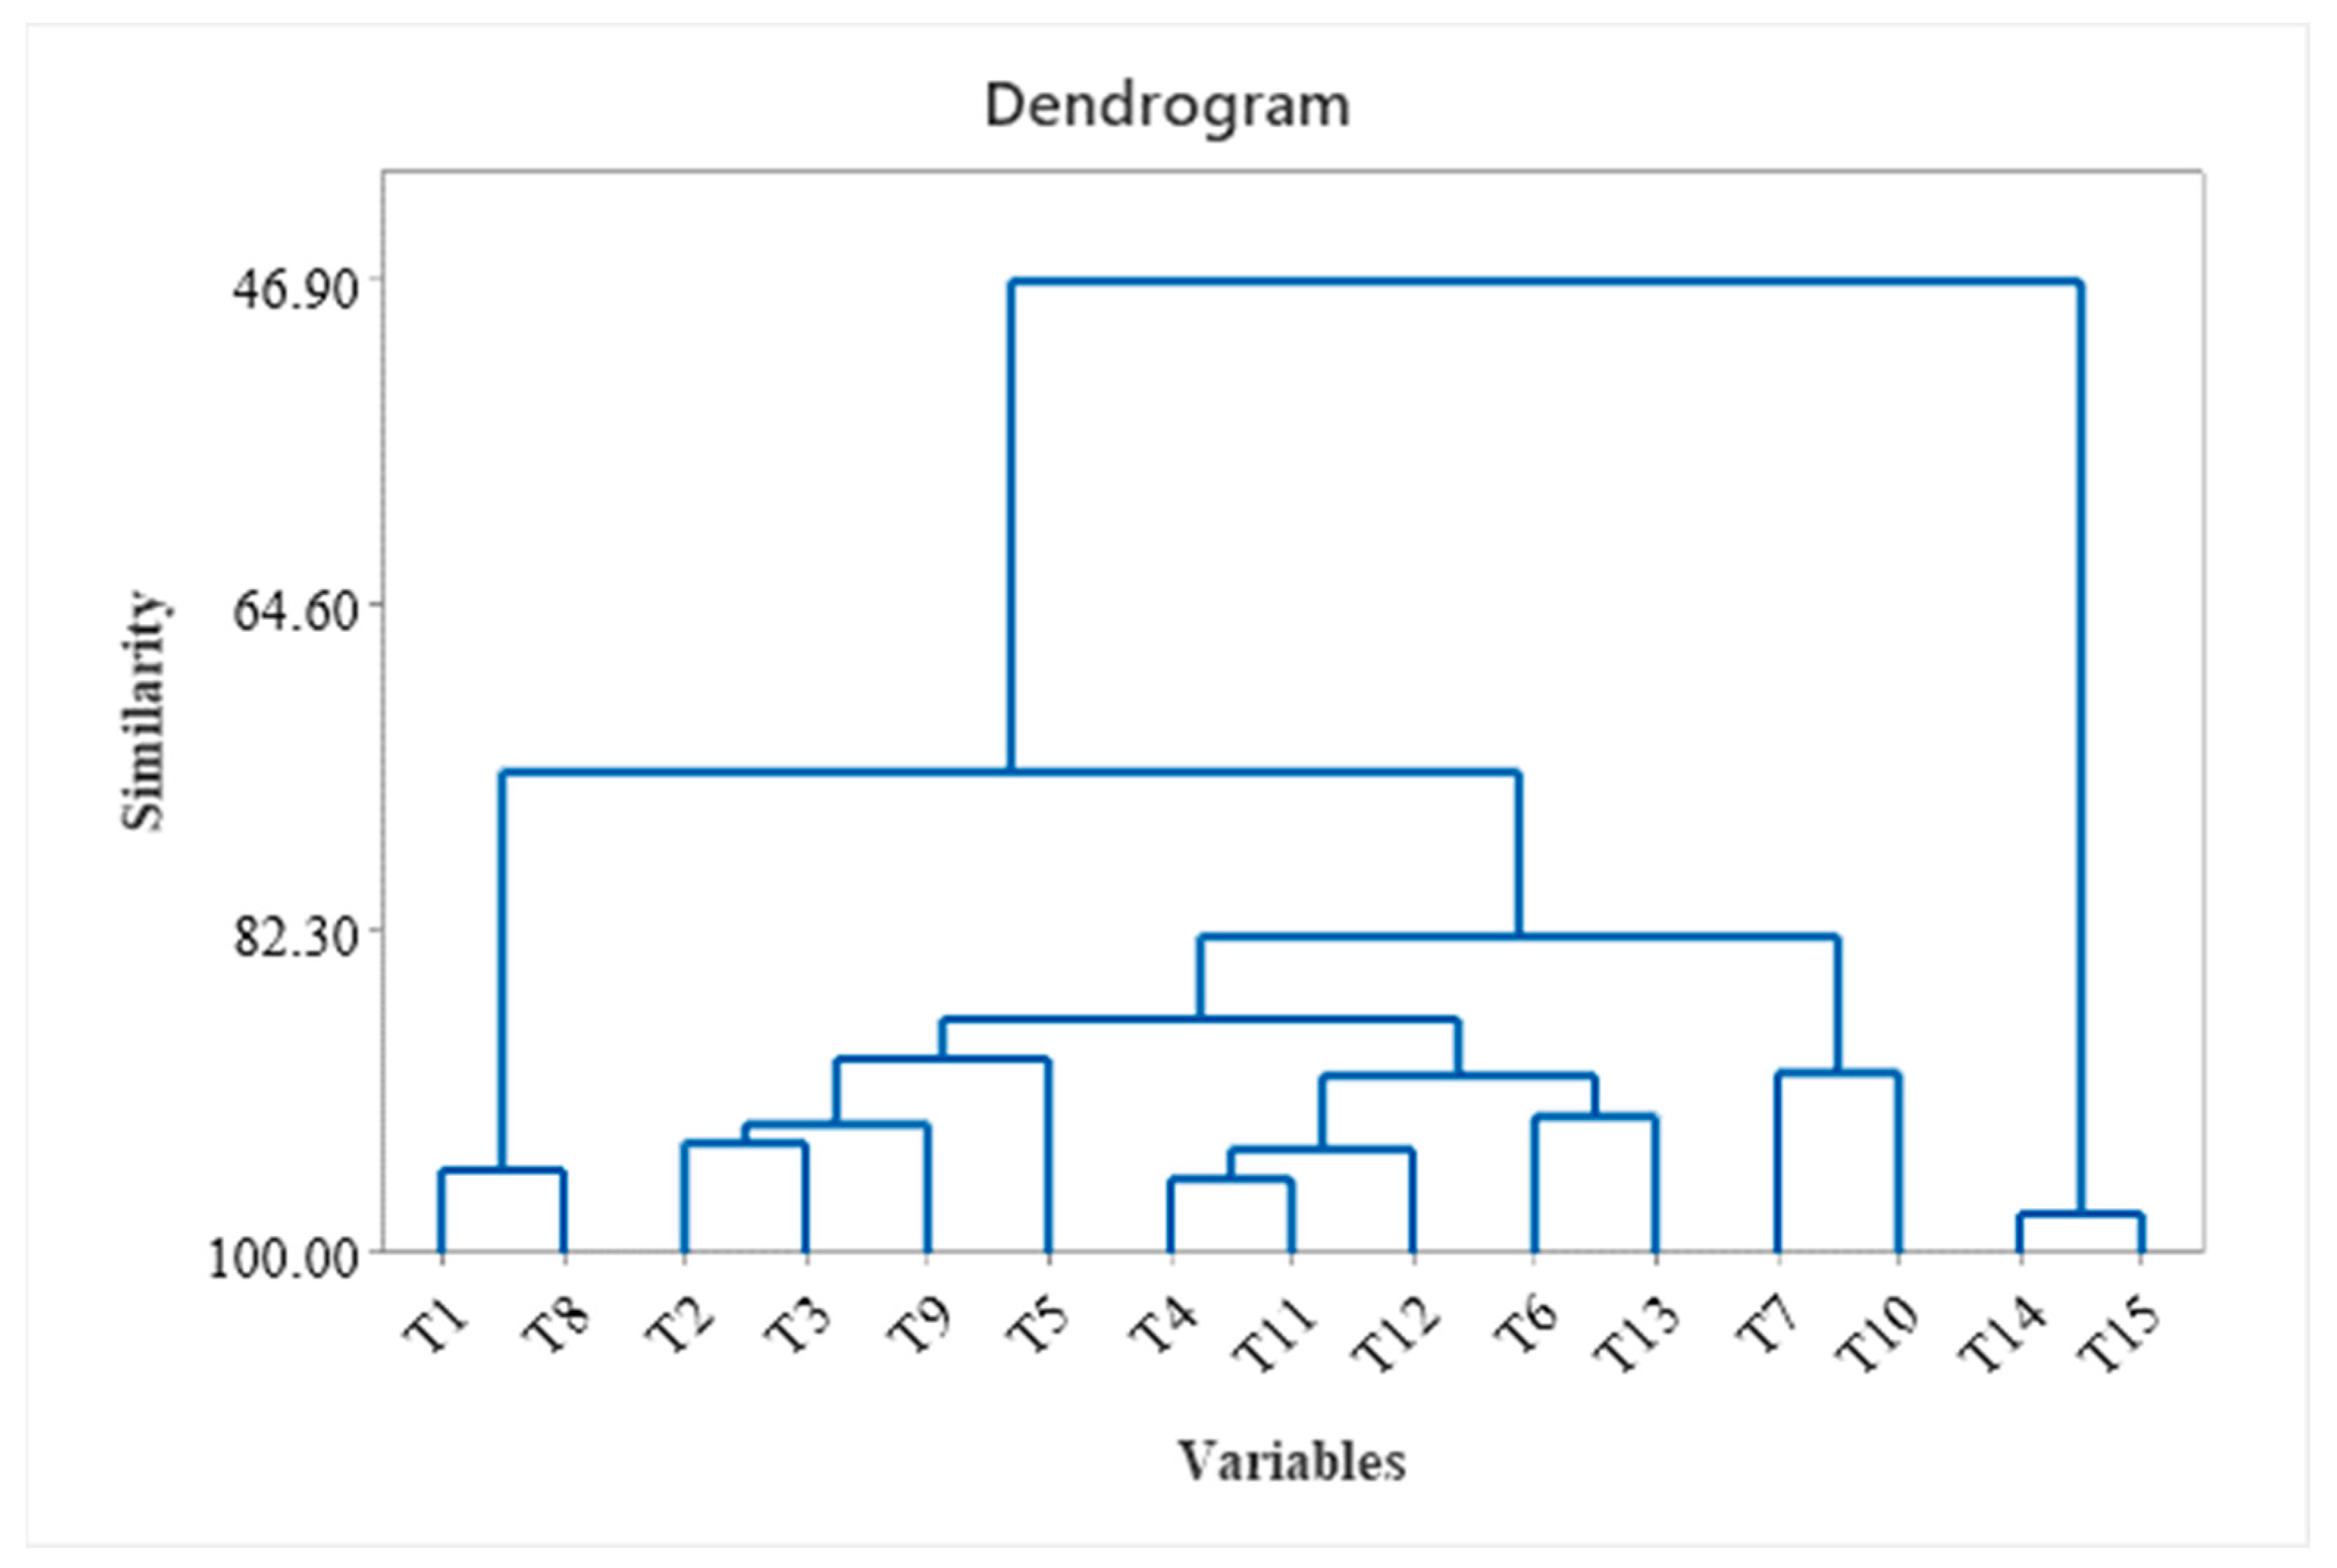
3.6. Multivariate Analysis
4. Conclusions
Author Contributions
Funding
Data Availability Statement
Acknowledgments
Conflicts of Interest
References
- Gomes, D.A.S.; Alves, J.P.S.; Silva, E.G.P.; Novaes, C.G.; Silva, D.S.; Aguiar, R.M.; Araújo, S.A.; Santos, A.C.L.; Bezerra, M.A. Evaluation of metal content in tea samples commercialized in sachets using multivariate data analysis techniques. Microchem. J. 2019, 151, 104248. [Google Scholar] [CrossRef]
- Guo, X.; Ho, C.-T.; Wan, X.; Zhu, H.; Liu, Q.; Wen, Z. Changes of volatile compounds and odor profiles in Wuyi rock tea during processing. Food Chem. 2021, 341, 128230. [Google Scholar] [CrossRef]
- Bora, P.; Bora, L.C. Microbial antagonists and botanicals mediated disease management in tea, Camellia sinensis (L.) O. Kuntze. An overview. Crop Prot. 2021, 148, 105711. [Google Scholar] [CrossRef]
- Zhou, B.; Ma, B.; Xu, C.; Wang, J.; Wang, Z.; Huang, Y.; Ma, C. Impact of enzymatic fermentation on taste, chemical compositions and in vitro antioxidant activities in Chinese teas using E-tongue, HPLC and amino acid analyzer. LWT-Food Sci. Technol. 2022, 163, 113549. [Google Scholar] [CrossRef]
- Li, M.; Feng, Z.; Wang, F.; Chen, J.; Fan, J.; Wang, J.; Liu, Z.; Yin, J. Effects of brewing water on the volatile composition of tea infusions. Food Chem. 2023, 429, 136971. [Google Scholar] [CrossRef] [PubMed]
- Yin, X.; Huang, J.; Huang, J.; Wu, W.; Tong, T.; Shujuan, L.; Zhou, L.; Liu, Z.; Zhang, S. Identification of volatile and odor-active compounds in Hunan black tea by SPME/GC-MS and multivariate analysis. LWT-Food Sci. Technol. 2022, 164, 113656. [Google Scholar] [CrossRef]
- Tian, L.; Shen, B.; Xu, H.; Li, F.; Wang, Y.; Singh, S. Thermal behavior of waste tea pyrolysis by TG-FTIR analysis. Energy 2016, 103, 533–542. [Google Scholar] [CrossRef]
- Feng, Z.; Li, Y.; Li, M.; Wang, Y.; Zhang, L.; Wan, X.; Yang, X. Tea aroma formation from six model manufacturing processes. Food Chem. 2019, 285, 347–354. [Google Scholar] [CrossRef]
- Liu, H.Y.; Liu, Y.; Li, M.Y.; Mai, Y.H.; Guo, H.; Wadood, S.A.; Raza, A.; Wang, Y.; Zhang, J.Y.; Li, H.B.; et al. The chemical, sensory, and volatile characteristics of instant sweet tea (Lithocarpus litseifolius) using electronic nose and GC-MS-based metabolomics analysis. LWT 2022, 163, 113518. [Google Scholar] [CrossRef]
- Zhang, L.; Zeng, Z.; Zhao, C.; Kong, H.; Lu, X.; Xu, G. A comparative study of volatile components in green, oolong and black teas by using comprehensive two-dimensional gas chromatography–time-of-flight mass spectrometry and multivariate data analysis. J. Chrom. A 2013, 1313, 245–252. [Google Scholar] [CrossRef]
- Fu, Z.; Chen, L.; Zhou, S.; Hong, Y.; Zhang, X.; Chen, H. Analysis of differences in the accumulation of tea compounds under various processing techniques, geographical origins, and harvesting seasons. Food Chem. 2023, 430, 137000. [Google Scholar] [CrossRef] [PubMed]
- Piyasena, K.G.N.P.; Hettiarachchi, L.S.K. Comparison of tea quality parameters of conventionally and organically grown tea, and effects of fertilizer on tea quality: A mini-review. Food Chem. Adv. 2023, 3, 100399. [Google Scholar] [CrossRef]
- Laza, D. Îndreptar profilactic și terapeutic de medicină naturistă. Păzitorul Adevărului 2000, 294. [Google Scholar]
- Cittan, M.; Altuntaş, E.; Ҫelik, A. Evaluation of antioxidant capacities and phenolic profiles in Tilia cordata fruit extracts: A comparative study to determine the efficiency of traditional hot water infusion method. Ind. Crops Prod. 2018, 122, 553–558. [Google Scholar] [CrossRef]
- Duan, X.; Li, J.; Cui, J.; Li, H.; Hasan, B.; Xin, X. Chemical component and in vitro protective effects of Matricaria chamomilla (L.) against lipopolysaccharide insult. J. Ethnopharmacol. 2022, 296, 115471. [Google Scholar] [CrossRef] [PubMed]
- El Mihyaoui, A.; Esteves da Silva, J.C.G.; Charfi, S.; Castillo, C.M.E.; Lamarti, A.; Arnao, M.B. Chamomile (Matricaria chamomilla L.): A Review of Ethnomedicinal Use. Phytochem. Pharmacol. Uses Life 2022, 12, 479. [Google Scholar] [CrossRef]
- Milevskaya, V.V.; Prasad, S.; Temerdashev, Z.A. Extraction and chromatographic determination of phenolic compounds from medicinal herbs in the Lamiaceae and Hypericaceae families: A review. Microchem. J. 2019, 145, 1036–1049. [Google Scholar] [CrossRef]
- Al-Mijalli, H.S.; ELsharkawy, E.R.; Abdallah, E.M.; Hamed, M.; El Omari, N.; Mahmud, S.; Alshahrani, M.M.; Mrabti, H.N.; Bouyahya, A. Determination of Volatile Compounds of Mentha piperita and Lavandula multifida and Investigation of Their Antibacterial, Antioxidant, and Antidiabetic Properties. Evid. Based Complement. Altern. Med. 2022, 14, 9306251. [Google Scholar] [CrossRef]
- Chen, Q.; Zhu, Y.; Dai, W.; Lv, H.; Mu, B.; Li, P.; Tan, J.; Ni, D.; Lin, Z. Aroma formation and dynamic changes during white tea processing. Food Chem. 2019, 274, 915–924. [Google Scholar] [CrossRef]
- Fang, X.; Liu, Y.; Xiao, J.; Ma, C.; Huang, Y. GC–MS and LC-MS/MS metabolomics revealed dynamic changes of volatile and non-volatile compounds during withering process of black tea. Food Chem. 2023, 410, 135396. [Google Scholar] [CrossRef]
- Ou, X.; Zhang, Y.; Li, S.; Ziong, Y.; Li, Q.; Huang, J.; Liu, Z. Study on the key volatile compounds and aroma quality of jasmine tea with different scenting technology. Food Chem. 2022, 385, 132718. [Google Scholar]
- Na, C.; Ziwen, Z.; Yeyun, L.; Xianchen, Z. Exogenously applied Spd and Spm enhance drought tolerance in tea plants by increasing fatty acid desaturation and plasma membrane H+-ATPase activity. Plant Physiol. Biochem. 2022, 170, 225–233. [Google Scholar] [CrossRef] [PubMed]
- Bora, S.; Adole, P.S.; Vinod, K.V.; Pillai, A.A. A validated and optimized method for separation and quantification of total fatty acids by gas chromatography-ion trap mass spectrometry in human plasma. J. Chromatogr. B 2022, 1210, 123473. [Google Scholar] [CrossRef]
- Gómez-Coca, R.B.; Pérez-Camino, M.C.; Brereton, P.; Bendini, A.; Toschi, T.G.; Moreda, W. Fatty acid ethyl esters (FAEE) in virgin olive oil: A shorter and full validated approach as an alternative to the EU Official Method. Food Chem. 2022, 394, 133300. [Google Scholar] [CrossRef] [PubMed]
- Román, G.C.; Jackson, R.E.; Gadhia, R.; Román, A.N.; Reis, J. Mediterranean diet: The role of long-chain ω-3 fatty acids in fish; polyphenols in fruits, vegetables, cereals, coffee, tea, cacao and wine; probiotics and vitamins in prevention of stroke, age-related cognitive decline, and Alzheimer disease. Rev. Neurol. 2019, 175, 724–741. [Google Scholar] [CrossRef]
- Mannion, D.T.; Furey, A.; Kilcawley, K.N. Comparison and validation of 2 analytical methods for the determination of free fatty acids in dairy products by gas chromatography with flame ionization detection. J. Dairy Sci. 2016, 99, 5047–5063. [Google Scholar] [CrossRef]
- Pruksatrakul, T.; Phoopraintra, P.; Wilairat, P.; Chaiyen, P.; Chantiwas, R. Development of a sequential injection-liquid microextraction procedure with GC-FID for analysis of short-chain fatty acids in palm oil mill effluent. Talanta 2017, 165, 612–618. [Google Scholar] [CrossRef]
- Shen, Q.; Song, G.; Wang, H.; Zhang, Y.; Cui, Y.; Xue, J.; Wang, H. Isolation and lipidomics characterization of fatty acids and phospholipids in shrimp waste through GC/FID and HILIC-QTrap/MS. J. Food Compos. Anal. 2021, 95, 103668. [Google Scholar] [CrossRef]
- Zhang, H.; Wang, Z.; Liu, O. Development and validation of a GC–FID method for quantitative analysis of oleic acid and related fatty acids. J. Phar. Anal. 2015, 5, 223–230. [Google Scholar] [CrossRef]
- Guo, L.; Chen, M.; Guo, Y.; Liu, Z. Variations in fatty acids affected their derivative volatiles during Tieguanyin tea processing. Foods 2022, 11, 1563. [Google Scholar] [CrossRef]
- Deng, Y.; Wang, W.; Zhao, S.; Yang, X.; Xu, W.; Guo, M.; Xu, E.; Ding, T.; Ye, X.; Liu, D. Ultrasound-assisted extraction of lipids as food components: Mechanism, solvent, feedstock, quality evaluation and coupled technologies—A review. Trends Food Sci. Technol. 2022, 122, 83–96. [Google Scholar] [CrossRef]
- Wang, X.; Zeng, Q.; Verardo, V.; Mar Contreas, M. Fatty acid and sterol composition of tea seed oils: Their comparison by the “FancyTiles” approach. Food Chem. 2017, 233, 302–310. [Google Scholar] [CrossRef] [PubMed]
- Özugul, F.; Aksun, E.T.; Öztekin, R.; Lorenzo, J.M. Effect of lavender and lemon balm extracts on fatty acid profile, chemical quality parameters and sensory quality of vacuum packaged anchovy (Engraulis encrasicolus) fillets under refrigerated condition. LWT-Food Sci. Technol. 2017, 84, 529–535. [Google Scholar] [CrossRef]
- Dai, H.; Ji, S.; Zhou, X.; Wi, B.; Cheng, S.; Zhang, F.; Wang, S.; Zhou, Q. Postharvest effects of sodium nitroprusside treatment on membrane fatty acids of blueberry (vaccinium corymbosum, cv. Bluecrop) fruit. Sci. Hortic. 2021, 288, 110307. [Google Scholar] [CrossRef]
- Qi, C.; Liu, G.; Ping, Y.; Yang, K.; Tan, Q.; Zhang, Y.; Chen, G.; Huang, X.; Xu, D. A comprehensive review of nano-delivery system for tea polyphenols: Construction, applications, and challenges. Food Chem. X 2023, 17, 100571. [Google Scholar] [CrossRef] [PubMed]
- Tolra, R.; Martos, S.; Hajiboland, R.; Poschenrieder, C. Aluminium alters mineral composition and polyphenol metabolism in leaves of tea plants (Camellia sinensis). J. Inorg. Biochem. 2020, 204, 110956. [Google Scholar] [CrossRef]
- Samynathan, R.; Venkidasamy, B.; Shanmugam, A.; Khaled, J.M.; Chung, M.; Thiruvengadam, M. Investigating the impact of tea mosquito bug on the phytochemical profile and quality of Indian tea cultivars using HPLC and LC-MS-based metabolic profiling. Ind. Crops Prod. 2023, 204, 117278. [Google Scholar] [CrossRef]
- Konieczynski, P.; Viapiana, A.; Wesolowski, M. Comparison of infusions from black and green teas (Camellia sinensis L. Kuntze) and Erva-mate (Ilex paraguariensis A. St.-Hil.) based on the content of essential elements, secondary metabolites, and antioxidant activity. Food Anal. Methods 2017, 10, 3063–3070. [Google Scholar] [CrossRef]
- Bai, F.; Chen, G.; Niu, H.; Zhu, H.; Huang, Y.; Zhao, M.; Hou, R.; Peng, C.; Li, H.; Wan, X.; et al. The types of brewing water affect tea infusion flavor by changing the tea mineral dissolution. Food Chem. X 2023, 18, 100681. [Google Scholar] [CrossRef]
- Wang, H.; Chen, K.; Cheng, J.; Jiang, L.; Yu, D.; Dai, Y.; Wang, L. Ultrasound-assisted three phase partitioning for the simultaneous extraction of oil, protein and polysaccharide from pumpkin seeds. LWT-Food Sci. Technol. 2021, 151, 112200. [Google Scholar] [CrossRef]
- Dippong, T.; Senila, L.; Muresan, L.E. Preparation and Characterization of the Composition of Volatile Compounds, Fatty Acids and Thermal Behavior of Paprika. Foods 2023, 12, 2041. [Google Scholar] [CrossRef] [PubMed]
- Nielsen, S.D.; Crafack, M.; Jespersen, L.; Jakobsen, M. The Microbiology of Cacao Fermentation. In Chocolate in Health and Nutrition; Humana Press: Totowa, NJ, USA, 2012; Volume 7, pp. 39–60. [Google Scholar]
- Cai, H.; Liu, J.; Xie, W.; Kuo, J.; Buyukada, M.; Evrendilek, F. Pyrolytic kinetics, reaction mechanisms and products of waste tea via TG-FTIR and Py-GC/MS. Energy Convers. Manag. 2019, 184, 436–447. [Google Scholar] [CrossRef]
- Lesage-Meessen, L.; Bou, M.; Sigoillot, J.-C.; Faulds, C.B.; Lomascolo, A. Essential oils and distilled straws of lavender and lavandin:a review of current use and potential application in white biotechnology. Appl. Microbiol. Biotechnol. 2015, 99, 3375–3385. [Google Scholar] [CrossRef]
- Wang, L.; Wen, M.; Chen, F.; Luo, Z.; Yin, J.; Chen, Y.; Huang, H. High oxygen atmospheric packaging (HOAP) reduces H2O2 production by regulating the accumulation of oxidative stress-related proteins in Chinese flowering cabbage. Postharvest Biol. Technol. 2020, 165, 111183. [Google Scholar] [CrossRef]
- Wang, B.; Qu, F.; Wang, P.; Zhao, L.; Wang, Z.; Han, Y.; Zhang, X. Characterization analysis of flavor compounds in green teas at different drying temperature. LWT—Food Sci. Technol. 2022, 161, 113394. [Google Scholar] [CrossRef]
- Burdock, G.A. Fenaroli’s Handbook of Flavor Ingredients, 6th ed.; CRC Press: Boca Raton, FL, USA, 2010. [Google Scholar]
- Schwab, W.; Davidovich-Rikanati, R.; Lewinsohn, E. Biosynthesis of plant-derived flavor compounds. Plant J. 2008, 54, 712–732. [Google Scholar] [CrossRef] [PubMed]
- Wang, C.; Li, J.; Wu, X.; Zhang, Y.; He, Z.; Zhang, Y.; Zhang, X.; Li, Q.; Huang, J.; Liu, Z. Pu-erh tea unique aroma: Volatile components, evaluation methods and metabolic mechanism of key odor-active compounds. Trends Food Sci. Technol. 2022, 124, 25–37. [Google Scholar] [CrossRef]
- Zeraatpisheh, Z.; Vatanparast, J. Eucalyptol induces hyperexcitability and epileptiform activity in snail neurons by inhibiting potassium channels. Eur. J. Pharmacol. 2015, 764, 70–78. [Google Scholar] [CrossRef]
- Shen, S.; Wu, H.; Li, T.; Sun, H.; Wang, Y.; Ning, J. Formation of aroma characteristics driven by volatile components during long-term storage of an tea. Food Chem. 2023, 411, 135487. [Google Scholar] [CrossRef] [PubMed]
- Su, D.; He, J.-J.; Zhou, Y.-Z.; Li, Y.-L.; Zhou, H.-J. Aroma effects of key volatile compounds in Keemun black tea at different grades: HS-SPME-GC-MS, sensory evaluation, and chemometrics. Food Chem. 2022, 373, 131587. [Google Scholar]
- Benson, N.; Ahmadu, O.H.F.; Olugbuyiro, J.A.O.; Anake, W.U.; Adedapo, A.E.; Olajire, A.A. Concentrations, sources and risk characterisation of polycyclic aromatic hydrocarbons (PAHs) in green, herbal and black tea products in Nigeria. J. Food Comp. Anal. 2018, 66, 13–22. [Google Scholar] [CrossRef]
- Wang, D.; Liu, Z.; Chen, W.; Lan, X.; Zhan, S.; Sun, Y.; Su, W.; Lin, C.-C.; Ni, L. Comparative study of the volatile fingerprints of roasted and unroasted oolong tea by sensory profiling and HS-SPME-GC-MS. Curr. Res. Food Sci. 2023, 6, 100442. [Google Scholar] [CrossRef]
- Naini, A.E.; Keyvandarian, N.; Mortazavi, M.; Taheri, S.; Hosseini, S.M. Effect of Omega-3 fatty acids on blood pressure and serum lipids in continuous ambulatory peritoneal dialysis patients. J. Res. Pharm. Pract. 2015, 4, 135–141. [Google Scholar] [PubMed]
- Maffei, M.; Scannerini, S. Seasonal variations in fatty acids from non-polar lipids of developing peppermint leaves. Phytochemistry 1992, 31, 479–484. [Google Scholar] [CrossRef]
- Deka, H.; Barman, T.; Sarmah, P.P.; Devi, A.; Tamuly, P.; Karak, T. Impact of processing method on selected trace elements content of green tea: Does CTC green tea infusion possess risk towards human health? Food Chem. X 2021, 12, 100173. [Google Scholar] [CrossRef]
- Gharibzahedi, S.M.T.; Jafari, S.M. The importance of minerals in human nutrition: Bioavailability, food fortification, processing effects and nanoencapsulation. Trends Food Sci. Technol. 2017, 62, 119–132. [Google Scholar] [CrossRef]
- Afuape, A.O.; Afolayan, A.J.; Buwa-Komoreng, L.V. Proximate, vitamins, minerals and anti-nutritive constituents of the leaf and stem of Helichrysum odoratissimum (L.) Sweet: A Folk Medicinal Plant in South Africa. Int. J. Plant Biol. 2022, 13, 463–472. [Google Scholar] [CrossRef]
- Siemińska-Kuczer, A.; Szymańska-Chargot, M.; Zdunek, A. Recent advances in interactions between polyphenols and plant cell wall polysaccharides as studied using an adsorption technique. Food Chem. 2022, 373, 131487. [Google Scholar] [CrossRef]
- Liu, D.; Martinez-Sanz, M.; Lopez-Sanchez, P.; Gilbert, E.P.; Gidley, M.J. The adsorption behavior of polyphenols on cellulose is affected by processing history. Food Hydrocoll. 2017, 63, 496–507. [Google Scholar] [CrossRef]


| Rt (min) | Volatile Compounds | Molecular Formula | Group | Odour Types | T1 | T2 | T3 | T4 | T5 | T6 | T7 | T8 | T9 | T10 | T11 | T12 | T13 | T14 | T15 |
|---|---|---|---|---|---|---|---|---|---|---|---|---|---|---|---|---|---|---|---|
| 5.1 | 2-methylbutan-1-ol | C5H12O | Alcohols | green | <0.03 | 0.9 ± 0.1 | <0.03 | <0.03 | <0.03 | <0.03 | <0.03 | <0.03 | <0.03 | <0.03 | <0.03 | <0.03 | <0.03 | <0.03 | <0.03 |
| 6.4 | isobutyl acetate | C6H12O2 | Esters | floral | <0.02 | <0.02 | <0.02 | <0.02 | <0.02 | <0.02 | <0.02 | <0.02 | 6.6 ± 0.7 | <0.02 | <0.02 | <0.02 | <0.02 | <0.02 | <0.02 |
| 6.5 | methyl isovalerate | C6H12O2 | Esters | fruity | <0.04 | 1.6 ± 0.1 | <0.04 | <0.04 | <0.04 | <0.04 | <0.04 | <0.04 | <0.04 | <0.04 | <0.04 | <0.04 | <0.04 | <0.04 | <0.04 |
| 7.0 | pentanal | C5H10O | Aldehydes | roasted | <0.02 | <0.02 | 2.7 ± 0.3 a | <0.02 | <0.02 | <0.02 | <0.02 | <0.02 | <0.02 | <0.02 | 1.5 ± 0.1 b | <0.02 | <0.02 | <0.02 | <0.02 |
| 7.4 | hexanal | C6H12O | Aldehydes | green | <0.01 | <0.01 | 2.7 ± 0.3 c | <0.01 | <0.01 | <0.01 | <0.01 | <0.01 | 8.2 ± 0.9 a | <0.01 | 5.1 ± 0.6 b | <0.01 | <0.01 | <0.01 | <0.01 |
| 9.2 | 3-benzyloxypropan-1-ol | C10H14O2 | Alcohols | alcohol | <0.02 | <0.02 | <0.02 | <0.02 | <0.02 | <0.02 | <0.02 | <0.02 | 1.2 ± 0.1 | <0.02 | <0.02 | <0.02 | <0.02 | <0.02 | <0.02 |
| 9.6 | 2-hexenal | C6H10O | Aldehydes | green | <0.02 | 0.4 ± 0.01 b | <0.02 | <0.02 | <0.02 | <0.02 | <0.02 | <0.02 | 9.9 ± 1.1 a | <0.02 | <0.02 | <0.02 | <0.02 | <0.02 | <0.02 |
| 9.6 | 2-methyl-4-pentanal | C6H10O | Aldehydes | green | <0.03 | 1.3 ± 0.08 a | <0.03 | <0.03 | <0.03 | <0.03 | <0.03 | <0.03 | <0.03 | <0.03 | <0.03 | 0.8 ± 0.08 b | <0.03 | <0.03 | <0.03 |
| 10.1 | 2-methyloctane | C9H20 | Hydrocarbons | chemical | <0.01 | <0.01 | <0.01 | <0.01 | <0.01 | 0.8 ± 0.02 b | <0.01 | <0.01 | <0.01 | 7.6 ± 0.8 a | <0.01 | 1.1 ± 0.1 b | <0.01 | <0.01 | <0.01 |
| 11.1 | styrene | C8H8 | Hydrocarbons | floral | <0.04 | <0.04 | 3.9 ± 0.4 b | <0.04 | <0.04 | <0.04 | <0.04 | <0.04 | <0.04 | <0.04 | 12.1 ± 1.3 a | <0.04 | <0.04 | <0.04 | <0.04 |
| 11.2 | 2-heptanone | C7H14O | Ketones | fruity | <0.03 | <0.03 | 5.9 ± 0.6 a | <0.03 | <0.03 | <0.03 | <0.03 | <0.03 | 3.8 ± 0.4 b | <0.03 | <0.03 | <0.03 | 1.2 ± 0.1 c | <0.03 | <0.03 |
| 11.5 | heptanal | C7H14O | Aldehydes | fruity | <0.05 | 4.0 ± 0.3 b | <0.05 | <0.05 | <0.05 | 2.1 ± 0.3 cd | <0.05 | 0.6 ± 0.1 d | <0.05 | 14.1 ± 1.5 a | 4.6 ± 0.5 b | 3.5 ± 0.4 bc | <0.05 | <0.05 | <0.05 |
| 11.7 | nonane | C9H20 | Hydrocarbons | chemical | <0.04 | <0.04 | 1.9 ± 0.01 | <0.04 | <0.04 | <0.04 | <0.04 | <0.04 | <0.04 | <0.04 | <0.04 | <0.04 | <0.04 | <0.04 | <0.04 |
| 11.9 | santolina triene | C9H14 | Hydrocarbons | fruity | <0.02 | 0.3 ± 0.01 c | 2.0 ± 0.2 b | <0.02 | 3.6 ± 0.4 a | <0.02 | <0.02 | <0.02 | <0.02 | <0.02 | <0.02 | 2.5 ± 0.3 b | <0.02 | <0.02 | <0.02 |
| 12.3 | 3-carene | C10H16 | Terpenes | sweet | 0.9 ± 0.02 c | 0.3 ± 0.01 d | <0.03 | 3.6 ± 0.4 a | <0.03 | 0.2 ± 0.1 d | <0.03 | <0.03 | <0.03 | <0.03 | <0.03 | <0.03 | 1.5 ± 0.1 b | <0.03 | <0.03 |
| 12.6 | 4-carene | C₁₀H₁₆ | Terpenes | fruity | <0.05 | 0.4 ± 0.01 b | <0.05 | 2.6 ± 0.3 ab | <0.05 | <0.05 | 17.8 ± 1.8 a | <0.05 | <0.05 | 0.9 ± 0.01 b | <0.05 | 4.6 ± 0.5 ab | 1.7 ± 0.1 b | <0.05 | <0.05 |
| 12.8 | α-pinene | C10H16 | Terpenes | floral | 2.7 ± 0.2 ef | 10.2 ± 1.2 c | 8.1 ± 0.9 cd | 8.6 ± 0.9 c | 7.6 ± 0.8 cd | 7.1 ± 0.7 cd | 7.9 ± 0.8 cd | 3.9 ± 0.4 e | 3.5 ± 0.3 e | 29.3 ± 3.1 a | 7.1 ± 0.7 cd | 13.4 ± 1.4 b | 5.4 ± 0.6 de | 0.7 ± 0.02 f | <0.03 |
| 13.4 | camphene | C10H16 | Terpenes | chemical | 5.6 ± 0.1 ab | 4.8 ± 0.6 ab | 3.3 ± 0.4 b | 17.9 ± 1.8 a | <0.03 | 5.6 ± 0.6 ab | <0.03 | 4.4 ± 0.5 ab | 2.8 ± 0.3 b | 0.8 ± 0.01 b | 5.2 ± 0.6 ab | 5.2 ± 0.6 ab | <0.03 | 1.1 ± 0.1 b | <0.03 |
| 13.8 | benzaldehyde | C₇H₆O | Aldehydes | roasted | <0.04 | 0.6 ± 0.02 b | <0.04 | <0.04 | <0.04 | <0.04 | <0.04 | 1.4 ± 0.2 c | 2.9 ± 0.3 a | <0.04 | <0.04 | 3.5 ± 0.4 ab | <0.04 | <0.04 | <0.04 |
| 14.3 | 3-methylnonane | C10H22 | Hydrocarbons | fruity | <0.02 | 2.4 ± 0.1 c | <0.02 | <0.02 | <0.02 | 1.4 ± 0.2 c | <0.02 | <0.02 | <0.02 | 7.1 ± 0.8 a | <0.02 | 4.2 ± 0.5 b | <0.02 | <0.02 | <0.02 |
| 14.3 | β-phellandrene | C10H16 | Terpenes | fruity | <0.02 | 3.2 ± 0.4 de | <0.02 | 4.5 ± 0.5 d | 18.2 ± 2.1 a | 3.8 ± 0.4 de | 3.4 ± 0.4 de | <0.02 | <0.02 | 1.7 ± 0.2 e | 6.7 ± 0.7 c | 10.9 ± 1.2 b | 4.7 ± 0.5 cd | <0.02 | <0.02 |
| 14.4 | carene 4.5-epoxy-trans | C10H16O | Terpenes | sweet | 1.1 ± 0.1 | <0.04 | <0.04 | <0.04 | <0.04 | <0.04 | <0.04 | <0.04 | <0.04 | <0.04 | <0.04 | <0.04 | <0.04 | <0.04 | <0.04 |
| 14.4 | β-pinene | C10H16 | Terpenes | roasted | <0.02 | 8.8 ± 0.9 c | 16.2 ± 1.7 b | 5.9 ± 0.6 cd | 33.5 ± 3.5 a | <0.02 | 7.4 ± 0.8 c | 2.8 ± 0.3 d | 2.5 ± 0.3 d | 5.8 ± 0.6 cd | <0.02 | <0.02 | 5.6 ± 0.6 cd | 2.8 ± 0.3 d | <0.02 |
| 14.9 | 7-octen-2-one | C8H14O | Ketones | fruity | <0.03 | 0.3 ± 0.01 d | 4.8 ± 0.5 ab | 3.0 ± 3.3 c | <0.03 | 5.8 ± 0.6 a | <0.03 | <0.03 | 1.3 ± 0.2 d | <0.03 | 4.6 ± 0.6 b | 5.4 ± 0.6 ab | <0.03 | <0.03 | <0.03 |
| 15.1 | β-myrcene | C10H16 | Terpenes | sweet | 1.3 ± 0.08 f | 14.8 ± 0.2 a | 6.9 ± 0.7 bc | 6.4 ± 0.7 bc | <0.04 | 2.8 ± 0.3 ef | <0.04 | 3.2 ± 0.4 ef | 5.4 ± 0.6 cd | 2.1 ± 0.2 ef | 6.9 ± 0.7 bc | 7.6 ± 0.8 b | <0.04 | 3.6 ± 0.4 b | 0.6 ± 0.01 de |
| 15.5 | 1,3,8-p-menthatriene | C10H14 | Terpenes | roasted | <0.02 | <0.02 | <0.02 | <0.02 | <0.02 | <0.02 | <0.02 | <0.02 | <0.02 | <0.02 | <0.02 | <0.02 | <0.02 | 1.1 ± 0.2 | <0.02 |
| 15.7 | terpinyl acetate | C12H20O2 | Terpenes | green | <0.04 | <0.04 | <0.04 | <0.04 | <0.04 | <0.04 | <0.04 | <0.04 | 13.1 ± 1.5 | <0.04 | <0.04 | <0.04 | <0.04 | <0.04 | <0.04 |
| 15.8 | n-hexyl acetate | C8H16O2 | Esters | fruity | <0.03 | <0.03 | <0.03 | <0.03 | <0.03 | <0.03 | <0.03 | <0.03 | 4.8 ± 0.5 | <0.03 | <0.03 | <0.03 | <0.03 | <0.03 | <0.03 |
| 15.9 | α-phellandrene | C10H16 | Terpenes | fruity | <0.03 | <0.03 | <0.03 | <0.03 | 2.6 ± 0.3 b | <0.03 | <0.03 | <0.03 | 7.2 ± 0.8 a | 0.6 ± 0.02 c | <0.03 | <0.03 | <0.03 | <0.03 | <0.03 |
| 16.0 | p-cymene | C10H14 | Hydrocarbons | citrus | <0.02 | <0.02 | <0.02 | <0.02 | <0.02 | 0.4 ± 0.1 b | <0.02 | <0.02 | <0.02 | <0.02 | 9.7 ± 1.1 a | <0.02 | <0.02 | <0.02 | <0.02 |
| 16.2 | m-cymene | C10H14 | Hydrocarbons | floral | <0.03 | 0.8 ± 0.02 d | 6.9 ± 0.8 c | <0.03 | <0.03 | 2.8 ± 0.3 d | 33.7 ± 3.5 a | 1.8 ± 0.2 d | 1.4 ± 0.2 d | 2.4 ± 0.3 d | <0.03 | 3.1 ± 0.4 d | 2.4 ± 0.3 d | 11.3 ± 1.3 b | <0.03 |
| 16.3 | limonene | C10H16 | Terpenes | citrus | <0.04 | 2.7 ± 0.2 e | 5.3 ± 0.6 de | 5.6 ± 0.6 de | <0.04 | 2.6 ± 0.3 e | 15.1 ± 1.6 cd | 2.7 ± 0.3 e | 5.2 ± 0.6 e | 0.9 ± 0.02 e | 6.2 ± 0.7 de | 5.1 ± 0.6 e | 23.8 ± 2.5 c | 61.2 ± 6.5 b | 97.8 ± 9.9 a |
| 16.4 | eucalyptol | C10H18O | Terpenes | fruity | 43.2 ± 5.1 b | 7.1 ± 0.7 ef | 11.7 ± 1.3 def | 14.5 ± 1.6 de | 14.5 ± 1.6 de | 27.6 ± 3.1 c | <0.02 | 62.8 ± 6.6 a | 6.3 ± 0.7 f | 4.5 ± 0.5 f | 16.4 ± 1.8 d | 8.7 ± 0.9 ef | 17.3 ± 1.9 d | <0.02 | <0.02 |
| 16.6 | decane | C10H22 | Hydrocarbons | floral | 0.4 ± 0.01 | <0.02 | <0.02 | <0.02 | <0.02 | <0.02 | <0.02 | <0.02 | <0.02 | <0.02 | <0.02 | <0.02 | <0.02 | <0.02 | <0.02 |
| 17.0 | β-ocimene | C10H16 | Terpenes | fruity | 0.3 ± 0.01 c | <0.03 | <0.03 | 1.9 ± 0.2 a | <0.03 | <0.03 | <0.03 | 0.9 ± 0.02 b | <0.03 | <0.03 | <0.03 | <0.03 | <0.03 | <0.03 | <0.03 |
| 17.4 | γ-terpinene | C10H16 | Terpenes | fruity | <0.02 | <0.02 | <0.02 | 2.1 ± 0.3 cd | 3.2 ± 0.4 bcd | <0.02 | 4.5 ± 0.5 b | <0.02 | <0.02 | 1.8 ± 0.1 cd | <0.02 | 3.2 ± 0.4 bcd | 3.3 ± 0.4 bc | 15.1 ± 1.6 a | 1.6 ± 0.1 d |
| 17.6 | 2-methyldecane | C11H24 | Hydrocarbons | chemical | <0.04 | 1.3 ± 0.1 b | <0.04 | <0.04 | <0.04 | <0.04 | <0.04 | <0.04 | <0.04 | 2.1 ± 0.3 a | <0.04 | <0.04 | <0.04 | <0.04 | <0.04 |
| 17.9 | verbenol | C10H16O | Terpenes | woody | 5.8 ± 0.6 | <0.02 | <0.02 | <0.02 | <0.02 | <0.02 | <0.02 | <0.02 | <0.02 | <0.02 | <0.02 | <0.02 | <0.02 | <0.02 | <0.02 |
| 18.4 | fenchone | C10H16O | Terpenes | fruity | 3.8 ± 0.2 | <0.03 | <0.03 | <0.03 | <0.03 | <0.03 | <0.03 | <0.03 | <0.03 | <0.03 | <0.03 | <0.03 | <0.03 | <0.03 | <0.03 |
| 18.4 | terpinolene | C10H16 | Terpenes | floral | <0.02 | <0.02 | <0.02 | <0.02 | <0.02 | <0.02 | <0.02 | <0.02 | <0.02 | <0.02 | <0.02 | <0.02 | <0.02 | 3.1 ± 0.4 | <0.02 |
| 18.7 | 3-methyl-2-(2methyl-2butenyl furan) | C10H14O | Furans | floral | <0.04 | <0.04 | <0.04 | <0.04 | <0.04 | 0.3 ± 0.1 | <0.04 | <0.04 | <0.04 | <0.04 | <0.04 | <0.04 | <0.04 | <0.04 | <0.04 |
| 18.8 | linalool | C10H18O | Terpenes | floral | 4.9 ± 0.5 c | 5.1 ± 0.6 c | 3.3 ± 0.4 d | 9.2 ± 1.0 a | <0.03 | 3.1 ± 0.4 de | <0.03 | 1.7 ± 0.1 e | 7.4 ± 0.8 b | 8.2 ± 0.9 ab | 3.6 ± 0.4 cd | 4.1 ± 0.5 cd | <0.03 | <0.03 | <0.03 |
| 19.1 | 1-octen-1ol-acetate | C10H18O2 | Esters | fruity | <0.02 | <0.02 | <0.02 | <0.02 | <0.02 | 2.9 ± 0.3 b | <0.02 | <0.02 | <0.02 | <0.02 | <0.02 | 3.6 ± 0.4 a | <0.02 | <0.02 | <0.02 |
| 19.3 | thujone | C10H16O | Terpenes | woody | <0.04 | 1.1 ± 0.1 c | 10.6 ± 1.1 a | <0.04 | 11.4 ± 1.2 a | <0.04 | <0.04 | <0.04 | <0.04 | 1.1 ± 0.1 c | 4.1 ± 0.5 b | 3.5 ± 0.4 b | <0.04 | <0.04 | <0.04 |
| 19.4 | cis-4-methoxythujane | C11H20O | Terpenes | woody | <0.03 | <0.03 | <0.03 | <0.03 | <0.03 | <0.03 | 5.4 ± 0.6 | <0.03 | <0.03 | <0.03 | <0.03 | <0.03 | <0.03 | <0.03 | <0.03 |
| 20.2 | bornanone | C10H16O | Ketones | citrus | 0.7 ± 0.01 c | <0.04 | <0.04 | 7.0 ± 0.8 b | <0.04 | 3.1 ± 0.4 c | <0.04 | <0.04 | <0.04 | <0.04 | <0.04 | <0.04 | 14.6 ± 1.5 a | <0.04 | <0.04 |
| 20.6 | 2-n-pentylthiophene | C₉H₁₄S | Tiofurans | roasted | <0.03 | 0.6 ± 0.01 b | <0.03 | <0.03 | <0.03 | <0.03 | <0.03 | <0.03 | <0.03 | <0.03 | 6.2 ± 0.6 a | <0.03 | <0.03 | <0.03 | <0.03 |
| 20.8 | i-menthone | C10H18O | Terpenes | fruity | <0.02 | <0.02 | <0.02 | <0.02 | <0.02 | <0.02 | <0.02 | <0.02 | <0.02 | <0.02 | <0.02 | <0.02 | 3.1 ± 0.3 | <0.02 | <0.02 |
| 21.1 | levomenthol | C10H20O | Terpenes | fruity | <0.03 | <0.03 | <0.03 | <0.03 | <0.03 | <0.03 | <0.03 | <0.03 | <0.03 | <0.03 | <0.03 | <0.03 | 3.8 ± 0.4 | <0.03 | <0.03 |
| 21.5 | 4-Terpineol | C10H18O | Terpenes | woody | 0.6 ± 0.01 | <0.05 | <0.05 | <0.05 | <0.05 | <0.05 | <0.05 | <0.05 | <0.05 | <0.05 | <0.05 | <0.05 | <0.05 | <0.05 | <0.05 |
| 21.7 | methyl salicilate | C8H8O3 | Esters | floral | <0.04 | <0.04 | <0.04 | <0.04 | <0.04 | <0.04 | <0.04 | <0.04 | 1.9 ± 0.2 | <0.04 | <0.04 | <0.04 | <0.04 | <0.04 | <0.04 |
| 22.1 | (+)-dihydrocarvone | C10H16O | Terpenes | floral | <0.05 | <0.05 | <0.05 | <0.05 | <0.05 | <0.05 | 4.8 ± 0.5 | <0.05 | <0.05 | <0.05 | <0.05 | <0.05 | <0.05 | <0.05 | <0.05 |
| 23.1 | neral | C10H16O | Aldehydes | fruity | <0.02 | <0.02 | <0.02 | <0.02 | <0.02 | 7.4 ± 0.8 | <0.02 | <0.02 | <0.02 | <0.02 | <0.02 | <0.02 | <0.02 | <0.02 | <0.02 |
| 23.2 | d-carvone | C10H14O | Terpenes | floral | <0.02 | <0.02 | <0.02 | <0.02 | <0.02 | 1.5 ± 0.2 b | <0.02 | <0.02 | <0.02 | <0.02 | <0.02 | <0.02 | 6.9 ± 0.7 a | <0.02 | <0.02 |
| 23.5 | linalyl acetate | C12H20O2 | Esters | floral | 28.3 ± 3.1 a | 0.8 ± 0.1 d | <0.03 | <0.03 | <0.03 | 7.7 ± 0.8 c | <0.03 | 13.8 ± 1.5 b | 4.6 ± 0.5 c | 0.4 ± 0.08 d | <0.03 | <0.03 | <0.03 | <0.03 | <0.03 |
| 24.4 | geranyl isovalerat | C15H26O2 | Esters | fruity | 0.4 ± 0.01 | <0.03 | 1.8 ± 0.1 | <0.03 | <0.03 | 7.1 ± 0.7 | <0.03 | <0.03 | <0.03 | <0.03 | <0.03 | <0.03 | <0.03 | <0.03 | <0.03 |
| 24.6 | medthyl-acetate | C12H22O2 | Esters | fruity | <0.04 | <0.04 | <0.04 | <0.04 | <0.04 | <0.04 | <0.04 | <0.04 | <0.04 | <0.04 | <0.04 | <0.04 | 2.9 ± 0.3 | <0.04 | <0.04 |
| 24.8 | 2 3-dimethylhydroquinone | C8H10O2 | Ketones | roasted | <0.02 | <0.02 | <0.02 | <0.02 | <0.02 | <0.02 | <0.02 | <0.02 | <0.02 | <0.02 | <0.02 | 3.3 ± 0.4 | <0.02 | <0.02 | <0.02 |
| 25.3 | thujopsene | C15H24 | Terpenes | floral | <0.03 | <0.03 | <0.03 | <0.03 | <0.03 | <0.03 | <0.03 | <0.03 | <0.03 | <0.03 | <0.03 | 2.7 ± 0.3 | <0.03 | <0.03 | <0.03 |
| 26.9 | genanyl propionate | C13H22O2 | Esters | fruity | <0.03 | <0.03 | <0.03 | <0.03 | <0.03 | <0.03 | <0.03 | <0.03 | <0.03 | 0.5 ± 0.01 | <0.03 | <0.03 | <0.03 | <0.03 | <0.03 |
| 27.2 | cis α-bergamonete | C15H24 | Hydrocarbons | fruity | <0.05 | <0.05 | <0.05 | 2.1 ± 0.3 | <0.05 | <0.05 | <0.05 | <0.05 | <0.05 | <0.05 | <0.05 | <0.05 | <0.05 | <0.05 | <0.05 |
| 28.1 | carophyllene | C15H24 | Terpenes | floral | <0.02 | <0.02 | 2.0 ± 0.2 cd | 2.2 ± 0.3 cd | 5.4 ± 0.6 a | 3.9 ± 0.4 b | <0.02 | <0.02 | <0.02 | 2.6 ± 0.3 c | <0.02 | <0.02 | 1.8 ± 0.2 d | <0.02 | <0.02 |
| 28.8 | cis-β-farnesene | C15H24 | Hydrocarbons | fruity | <0.04 | 22.7 ± 2.4 a | <0.04 | <0.04 | <0.04 | <0.04 | <0.04 | <0.04 | <0.04 | 2.1 ± 0.3 b | <0.04 | <0.04 | <0.04 | <0.04 | <0.04 |
| 29.5 | γ-muurolene | C15H24 | Terpenes | woody | <0.02 | <0.02 | <0.02 | <0.02 | <0.02 | <0.02 | <0.02 | <0.02 | <0.02 | 1.2 ± 0.2 | <0.02 | <0.02 | <0.02 | <0.02 | <0.02 |
| 29.7 | germacrene | C15H24 | Terpenes | floral | <0.03 | 3.5 ± 0.4 a | <0.03 | 2.9 ± 0.4 a | <0.03 | <0.03 | <0.03 | <0.03 | <0.03 | 1.7 ± 0.2 b | <0.03 | <0.03 | <0.03 | <0.03 | <0.03 |
| 30.6 | copaene | C15H24 | Hydrocarbons | woody | <0.03 | <0.03 | <0.03 | <0.03 | <0.03 | <0.03 | <0.03 | <0.03 | <0.03 | 0.5 ± 0.01 | <0.03 | <0.03 | <0.03 | <0.03 | <0.03 |
| Fatty Acid Name | Fatty Acid | T1 | T2 | T3 | T4 | T5 | T6 | T7 | T8 | T9 | T10 | T11 | T12 | T13 |
|---|---|---|---|---|---|---|---|---|---|---|---|---|---|---|
| caprylic acid | C8: 0 | <0.020 | <0.020 | <0.020 | <0.020 | <0.020 | <0.020 | <0.020 | <0.020 | <0.020 | <0.020 | <0.020 | <0.020 | 3.46 ± 0.18 |
| capric acid | C10: 0 | 3.28 ±0.10 b | <0.035 | <0.035 | <0.035 | 6.01 ± 0.26 a | <0.035 | <0.035 | <0.035 | <0.035 | <0.035 | <0.035 | <0.035 | 3.40 ± 0.34 b |
| lauric acid | C12: 0 | <0.020 | <0.020 | 5.16 ± 0.33 a | <0.020 | 4.86 ± 0.19 a | <0.020 | <0.020 | <0.020 | <0.020 | <0.020 | <0.020 | <0.020 | <0.020 |
| myristic acid | C14:0 | 3.49 ± 0.12 cde | 5.18 ± 0.41 ab | 5.72 ± 0.25 a | 4.69 ± 0.31 abcde | 5.66 ± 0.42 a | 4.27 ± 0.32 bcde | 4.80 ± 0.24 abc | <0.025 | 4.76 ± 0.27 abcd | 3.63 ± 0.22 cde | <0.025 | 3.41 ± 0.18 e | 3.45 ± 0.16 de |
| myristoleic acid | C14:1 (n-5) | <0.036 | <0.036 | <0.036 | 3.06 ± 0.15 a | <0.036 | <0.036 | <0.036 | <0.036 | 2.42 ± 0.14 b | <0.036 | <0.036 | <0.036 | <0.036 |
| pentadecanoic acid | C15:0 | <0.014 | <0.014 | <0.014 | 2.43 ± 0.09 a | <0.014 | <0.014 | <0.014 | <0.014 | 2.48 ± 0.10 a | <0.014 | <0.014 | 1.76 ± 0.08 b | <0.014 |
| cis-10-pentadecanoic acid | C15:1 (n-5) | 1.84 ± 0.09 | <0.018 | <0.018 | <0.018 | <0.018 | <0.018 | <0.018 | <0.018 | <0.018 | <0.018 | <0.018 | <0.018 | <0.018 |
| palmitic acid | C16:0 | 8.89 ± 0.30 de | 10.36 ± 1.00 de | 16.47 ± 1.10 a | 11.80 ± 0.95 cd | 11.76 ± 1.10 cd | 17.34 ± 1.12 a | 15.78 ± 1.10 ab | 14.80 ± 1.3 abc | 15.09 ± 1.21 abc | 10.15 ± 0.98 de | 12.22 ± 0.99 bcd | 7.20 ± 0.42 e | 10.62 ± 1.01 de |
| palmitoleic acid | C16:1 (n-7) | 2.15 ± 0.11 def | 2.70 ± 0.11 bcd | 3.02 ± 0.18 bc | 3.43 ± 0.21 b | 2.58 ± 0.14 cde | 2.23 ± 0.09 cdef | 2.52 ± 0.11 cdef | <0.020 | 2.60 ± 0.11 cde | 1.86 ± 0.08 ef | 4.72 ± 0.15 a | 1.72 ± 0.07 f | 1.90 ± 0.06 def |
| heptadecanoic acid | C17:0 | 2.34 ± 0.13 cde | 4.45 ± 0.23 a | <0.051 | <0.051 | 2.60 ± 0.11 bcd | 2.21 ± 0.10 de | 2.53 ± 0.13 bcde | 3.05 ± 0.18 bc | 2.64 ± 0.19 bcd | 2.15 ± 0.16 de | 3.28 ± 0.21 b | 1.76 ± 0.08 e | 1.88 ± 0.07 de |
| cis-10-heptadecenoic acid | C17:1 | 2.32 ± 0.11 a | <0.023 | <0.023 | <0.023 | <0.023 | <0.023 | <0.023 | <0.023 | <0.023 | 1.88± 0.18 ab | <0.023 | 1.74 ± 0.08 b | <0.023 |
| stearic acid | C18:0 | 6.53 ± 0.41 abc | 5.53 ± 0.33 bc | 6.86 ± 0.26 ab | 6.25 ± 0.24 abc | 5.87 ± 0.31 bc | 5.90 ± 0.24 bc | 6.36 ± 0.26 abc | 7.94 ± 0.52 a | 5.72 ± 0.32 bc | 4.96 ± 0.22 c | 6.65 ± 0.35 abc | 5.85 ± 0.28 bc | 4.96 ± 0.11 c |
| oleic acid +elaidic acid | C18:1 (cis + trans) (n-9) | 8.47 ± 0.32 cd | 8.21 ± 0.74 cd | 15.28 ± 1.2 a | 8.09 ± 0.34 cd | 9.01 ± 0.89 cd | 7.63 ± 0.51 cde | 9.63 ± 0.54 c | 9.68 ± 0.72 bc | 12.36 ± 1.23 b | 6.69 ± 0.42 de | 9.55 ± 0.35 cd | 5.29 ± 0.32 e | 7.08 ± 0.47 cde |
| linoleic acid + linolelaidic acid | C18:2 (cis + trans) (n-6) | 7.33 ± 0.14 cdef | 10.07 ± 0.99 ab | 9.34 ± 0.32 abcd | 6.29 ± 0.33 f | 11.52 ± 1.00 a | 9.85 ± 0.88 abc | 8.78 ± 0.65 bcde | 10.14 ± 0.98 ab | 9.64 ± 0.65 abc | 6.58 ± 0.36 ef | 6.97 ± 0.21 def | <0.050 | 7.78 ± 0.7 bcdef |
| γ-linolenic acid | C18:3 (n-6) | 9.04 ± 0.42 a | 6.16 ± 0.29 bc | 6.69 ± 0.18 b | <0.031 | 5.07 ± 0.19 bcd | 5.40 ± 0.32 bcd | <0.031 | 6.36 ± 0.32 bc | 4.75 ± 0.33 cd | <0.036 | <0.036 | 3.91 ± 0.20 d | 3.83 ± 0.98 d |
| α-linolenic acid | C18:3 (n-3) | 7.70 ± 0.14 c | 7.47 ± 0.55 c | 7.66 ± 0.51 c | 6.81 ± 0.30 cd | 4.45 ± 0.15 de | 17.15 ± 1.0 a | 7.11 ± 0.51 cd | 3.88 ± 0.21 e | 8.24 ± 0.52 c | 15.83 ± 1.02 ab | 3.77 ± 0.18 e | 6.08 ± 0.21 cde | 13.81 ± 0.98 b |
| arachidic acid | C20:0 | 8.15 ± 0.25 cde | 9.37 ± 0.63 bc | 6.61 ± 0.31 def | 7.97 ± 0.35 cde | 6.06 ± 0.48 ef | 19.13 ± 1.10 a | 9.15 ± 0.63 bcd | 6.31 ± 0.32 ef | 5.09 ± 0.32 fg | 10.55 ± 1.01 bc | 8.32 ± 0.35 bcde | 3.16 ± 0.09 g | 10.91 ± 0.97 b |
| gondoic acid | C20:1 (n-9) | 2.32 ± 0.14 a | <0.0052 | <0.0052 | <0.0052 | <0.0052 | <0.0052 | <0.0052 | <0.0052 | 2.51 ± 0.08 a | <0.0052 | <0.0052 | <0.0052 | <0.0052 |
| cis-11,14-eicosadienoic ac | C20:2 (n-6) | 4.40 ± 0.21 cdef | 3.12 ± 0.22 f | 3.71 ± 0.17 def | 6.16 ± 0.34 cd | 5.81 ± 0.32 cde | 2.79 ± 0.12 f | 3.28 ± 0.22 ef | 14.88 ± 1.10 b | 6.33 ± 0.18 cd | 2.70 ± 0.11 f | 6.75 ± 0.19 c | 24.04 ± 1.21 a | 2.42 ± 0.09 f |
| cis-8,11,14-Eicosatrienoic acid + heneicosanoic acid | C20:3 (n-6)+ C21:0 | 3.35 ± 0.18 b | <0.0061 | <0.0061 | <0.0061 | <0.0061 | <0.0061 | <0.0061 | <0.0061 | <0.0061 | <0.0061 | <0.0061 | 6.37 ± 0.15 a | <0.0061 |
| arachidonic acid | C20:4 (n-6) | 3.84 ± 0.14 a | <0.0058 | <0.0058 | 3.03 ± 0.33 b | 2.54 ± 0.08 b | <0.0058 | <0.0058 | <0.0058 | <0.0058 | <0.0058 | <0.0058 | <0.0058 | <0.0058 |
| cis-11,14,17-eicosatrienoic acid | C20:3 (n-3) | 1.68 ± 0.02 | <0.0061 | <0.0061 | <0.0061 | <0.0061 | <0.0061 | <0.0061 | <0.0061 | <0.0061 | <0.0061 | <0.0061 | <0.0061 | <0.0061 |
| eicosadienoic acid | C22:0 | 1.54 ± 0.08 de | <0.040 | <0.040 | 2.03 ± 0.09 cde | 2.10 ± 0.08 bcd | 1.78 ± 0.06 cde | <0.040 | <0.040 | 2.21 ± 0.09 bc | 1.50 ± 0.01 e | 2.68 ± 0.06 ab | 1.47 ± 0.09 e | 1.45 ± 0.09 e |
| erucic acid | C22:1 (n-9) | <0.0063 | 2.46 ± 0.08 a | 2.49 ± 0.11 a | <0.0063 | <0.0063 | <0.0063 | <0.0063 | <0.0063 | <0.0063 | <0.0063 | <0.0063 | <0.0063 | <0.0063 |
| cis-4,7,10,13, 16, 19-docosahexanoic acid | C22:2 (n-6) | 3.91 ± 0.11 e | 6.64 ± 0.32 bcd | 4.99 ± 0.18 cde | 8.02 ± 0.62 b | 9.11 ± 0.62 b | 4.34 ± 0.12 de | 3.23 ± 0.07 e | 17.70 ± 0.98 a | 4.26 ± 0.14 de | 2.63 ± 0.08 e | 16.85 ± 1.1 a | 7.63 ± 0.11 bc | 2.35 ± 0.05 e |
| tricosanoic acid | C23:0 | 5.68 ± 0.21 e | 11.79 ± 1.02 d | <0.056 | 19.93 ± 1.06 bc | <0.056 | <0.056 | 24.80 ± 1.78 ab | <0.056 | 6.58 ± 0.15 de | 26.97 ± 1.20 a | 18.23 ± 0.99 c | 18.60 ± 1.00 c | 20.68 ± 1.33 bc |
| lignoceric acid | C24:0 | 1.77 ± 0.09 b | <0.050 | <0.050 | <0.050 | 2.19 ± 0.08 ab | <0.050 | 2.02 ± 0.09 ab | 2.46 ± 0.01 a | 2.30 ± 0.08 ab | <0.050 | <0.050 | <0.050 | <0.050 |
| cis-4,7,10,13,16,19-docosa-hexanoic + nervonic acid | C22:6 (n-3) + C24:1 (n-9) | <0.0086 | 6.50 ± 0.31 a | 6.00 ± 0.41 a | <0.0086 | <0.0086 | <0.0086 | <0.0086 | <0.0086 | <0.0086 | <0.0086 | <0.0086 | <0.0086 | <0.0086 |
| Σ SFA | 45.0 ± 3.2 cde | 46.7 ± 3.2 bcde | 40.8 ± 2.8 de | 55.1 ± 4.12 abcd | 47.1 ± 3.25 bcde | 50.6 ± 3.21 abcde | 65.5 ± 4.23 a | 37.4 ± 2.11 e | 46.9 ± 3.2 bcde | 59.9 ± 3.1 abc | 51.4 ± 2.8 abcde | 49.6 ± 1.89 bcde | 60.8 ± 1.8 ab | |
| Σ MUFA | 17.1 ± 1.10 bc | 19.9 ± 1.20 b | 26.8 ± 1.86 a | 14.6 ± 1.00 cd | 11.6 ± 0.98 def | 9.9 ± 0.61 ef | 12.1 ± 0.98 def | 9.7 ± 0.31 f | 19.9 ± 1.00 b | 10.4 ± 0.99 def | 14.3 ± 0.98 cde | 8.8 ± 0.24 f | 9.0 ± 0.4 f | |
| Σ PUFA | 37.9 ± 2.87 bc | 39.9 ± 2.10 bc | 38.4 ± 2.64 bc | 30.3 ± 2.65 cd | 41.3 ± 3.21 b | 39.5 ± 1.25 bc | 22.4 ± 1.12 d | 53.0 ± 3.21 a | 33.2 ± 0.65 bcd | 29.7 ± 1.02 cd | 34.3 ± 1.25 bc | 41.7 ± 2.32 b | 30.2 ± 1.6 cd | |
| PUFA/MUFA | 2.22 ± 0.10 efg | 2.01 ± 0.14 efg | 1.43 ± 0.05 g | 2.08 ± 0.08 efg | 3.57 ± 0.18 cd | 4.01 ± 0.11 bc | 1.84 ± 0.06 fg | 5.47 ± 0.22 a | 1.67 ± 0.02 fg | 2.85 ± 0.08 de | 2.41 ± 0.07 ef | 4.76 ± 0.22 ab | 3.36 ± 0.1 cd | |
| Σ n-6 PUFA | 28.51 ± 1.78 bcde | 25.98 ± 1.89 cde | 24.74 ± 1.85 de | 23.49 ± 1.28 ef | 34.06 ± 2.15 bc | 22.38 ± 0.89 ef | 15.29 ± 1.13 fg | 49.08 ± 2.14 a | 24.98 ± 1.88 de | 11.91 ± 0.99 g | 30.57 ± 1.85 bcd | 35.58 ± 2.33 b | 16.39 ± 0.9 fg | |
| Σ n-3 PUFA | 12.73 ± 0.9 abc | 13.97 ± 1.02 ab | 13.65 ± 1.03 ab | 6.81 ± 0.25 d | 7.26 ± 0.26 cd | 17.15 ± 1.10 a | 7.11 ± 0.11 d | 3.88 ± 0.08 d | 8.24 ± 0.21 bcd | 17.76 ± 0.99 a | 3.77 ± 0.08 d | 12.46 ± 0.95 d | 13.81 ± 1.0 a | |
| Tea Samples | Major Elements | Trace Elements | Polyphenol g GA/kg | |||||||
|---|---|---|---|---|---|---|---|---|---|---|
| Na mg/kg | K mg/kg | Ca mg/kg | Mg mg/kg | N mg/kg | P mg/kg | Fe mg/kg | Cu mg/kg | Zn mg/kg | ||
| T1 | 24.8 ± 1.9 c | 5661 ± 71 f | 3610 ± 42 gh | 980 ± 20 e | 2.35 ± 0.11 e | 347 ± 28 ij | 10.9 ± 0.9 gh | 1.35 ± 0.12 f | 4.30 ± 0.36 gh | 19.3 ± 2.0 fg |
| T2 | 669 ± 35 a | 30,400 ± 717 a | 11,595 ± 366 bc | 2415 ± 40 bc | 5.56 ± 0.20 a | 5545 ± 229 a | 53.7 ± 4.9 ef | 5.41 ± 0.50 bcd | 42.6 ± 3.94 a | 9.5 ± 1.0 g |
| T3 | 71.6 ± 3.6 c | 4954 ± 173 fg | 10,935 ± 215 c | 1646 ± 56 de | 4.01 ± 0.13 bcd | 1117 ± 41 hi | 157 ± 12 b | 1.10 ± 0.10 fg | 12.2 ± 1.1 ef | 28.3 ± 2.9 ef |
| T4 | 36.5 ± 3.5 c | 15,036 ± 131 cd | 19,504 ± 474 a | 3036 ± 84 ab | 3.63 ± 0.13 cde | 2035 ± 81 efg | 391 ± 15 a | 4.15 ± 0.39 de | 41.7 ± 3.87 a | 53.3 ± 5.4 bc |
| T5 | 34.0 ± 3.2 c | 20,546 ± 342 b | 7632 ± 108 def | 2504 ± 68 bc | 5.11 ± 0.17 ab | 2079 ± 69 efg | 43.7 ± 3.4 efg | 6.79 ± 0.67 ab | 28.7 ± 2.4 b | 23.6 ± 2.4 efg |
| T6 | 43.6 ± 1.5 c | 28,376 ± 294 a | 11,243 ± 122 bc | 2909 ± 84 ab | 5.17 ± 0.30 ab | 3365 ± 132 c | 75.5 ± 5.5 de | 4.70 ± 0.42 cde | 21.3 ± 1.6 cd | 62.6 ± 6.4 bv |
| T7 | 50.4 ± 4.0 c | 17,230 ± 364 bc | 6842 ± 84 ef | 1725 ± 120 d | 4.79 ± 0.20 abc | 2387 ± 56 def | 134 ± 11 bc | 6.45 ± 0.64 ab | 11.2 ± 0.95 efg | 86.8 ± 8.8 a |
| T8 | 65.8 ± 6.6 c | 16,289 ± 370 bcd | 2588 ± 92 h | 1315 ± 38 de | 5.52 ± 0.23 a | 3111 ± 53 cd | 75.4 ± 6.8 de | 7.70 ± 0.74 a | 19.9 ± 1.76 d | 18.9 ± 1.9 fg |
| T9 | 55.4 ± 1.5 c | 21,190 ± 286 b | 5635 ± 75 fg | 3248 ± 60 a | 5.30 ± 0.20 a | 4528 ± 108 b | 44.3 ± 3.4 efg | 6.75 ± 0.63 ab | 17.7 ± 1.3 de | 44.5 ± 4.5 cd |
| T10 | 54.9 ± 3.0 c | 12,350 ± 110 cde | 10,170 ± 198 cd | 2925 ± 62 ab | 4.83 ± 0.22 abc | 2601 ± 40 cde | 63.7 ± 3.4 e | 5.90 ± 0.51 bc | 27.5 ± 2.29 bc | 44.7 ± 4.6 cd |
| T11 | 43.1 ± 2.5 c | 13,260 ± 205 cde | 1484 ± 20 h | 1872 ± 36 cd | 4.47 ± 0.23 abc | 1707 ± 45 fgh | 23.7 ± 2.2 fg | 1.20 ± 0.09 f | 8.91 ± 0.76 fg | 34.7 ± 3.5 de |
| T12 | 40.8 ± 3.3 c | 9527 ± 104 ef | 13,930 ± 69 b | 2442 ± 37 bc | 2.76 ± 0.14 de | 1541 ± 35 gh | 37.3 ± 1.6 efg | 1.75 ± 0.13 f | 17.6 ± 1.65 de | 61.8 ± 6.3 b |
| T13 | 290 ± 16 b | 12,130 ± 175 de | 9230 ± 128 cde | 3345 ± 73 a | 4.58 ± 0.21 abc | 2522 ± 43 de | 114 ± 10 cd | 3.65 ± 0.27 e | 7.90 ± 0.64 fg | 85.1 ± 8.6 a |
| T14 | 33.2 ± 2.7 c | 122 ± 8 gh | 1391 ± 59 h | 26.5 ± 2.2 f | 0.27 ± 0.02 f | 286 ± 8 j | <1.66 | <0.66 | <0.66 | 12.2 ± 1.3 gh |
| T15 | 62.0 ± 4.4 c | 29.3 ± 2.1 h | 1251 ± 43 h | 11.9 ± 1.1 f | 0.31 ± 0.02 f | 346 ± 11 ij | <1.66 | <0.66 | <0.66 | 15.2 ± 1.6 fg |
Disclaimer/Publisher’s Note: The statements, opinions and data contained in all publications are solely those of the individual author(s) and contributor(s) and not of MDPI and/or the editor(s). MDPI and/or the editor(s) disclaim responsibility for any injury to people or property resulting from any ideas, methods, instructions or products referred to in the content. |
© 2023 by the authors. Licensee MDPI, Basel, Switzerland. This article is an open access article distributed under the terms and conditions of the Creative Commons Attribution (CC BY) license (https://creativecommons.org/licenses/by/4.0/).
Share and Cite
Dippong, T.; Cadar, O.; Kovacs, M.H.; Dan, M.; Senila, L. Chemical Analysis of Various Tea Samples Concerning Volatile Compounds, Fatty Acids, Minerals and Assessment of Their Thermal Behavior. Foods 2023, 12, 3063. https://doi.org/10.3390/foods12163063
Dippong T, Cadar O, Kovacs MH, Dan M, Senila L. Chemical Analysis of Various Tea Samples Concerning Volatile Compounds, Fatty Acids, Minerals and Assessment of Their Thermal Behavior. Foods. 2023; 12(16):3063. https://doi.org/10.3390/foods12163063
Chicago/Turabian StyleDippong, Thomas, Oana Cadar, Melinda Haydee Kovacs, Monica Dan, and Lacrimioara Senila. 2023. "Chemical Analysis of Various Tea Samples Concerning Volatile Compounds, Fatty Acids, Minerals and Assessment of Their Thermal Behavior" Foods 12, no. 16: 3063. https://doi.org/10.3390/foods12163063
APA StyleDippong, T., Cadar, O., Kovacs, M. H., Dan, M., & Senila, L. (2023). Chemical Analysis of Various Tea Samples Concerning Volatile Compounds, Fatty Acids, Minerals and Assessment of Their Thermal Behavior. Foods, 12(16), 3063. https://doi.org/10.3390/foods12163063