
Non-Destructive Quality Evaluation of 80 Tomato Varieties Using Vis-NIR Spectroscopy

 , ,
, ,
Abstract
1. Introduction
2. Materials and Methods
2.1. Sampling
- red fruit varieties ‘Amaneta F1’, ‘Aurea F1’, ‘Bellastar F1’, ‘Berberana F1’, ‘Conchita F1’, ‘Elegance F1’, ‘Gardener’s Delight F1’, ’Gourmandia F1’, ‘Lancelot F1’, ’Pozano F1’, ‘Sunstream F1’, ‘Bolstar Gimli F1’, ‘Encore F1’, ‘Delizia F1’, ‘Belfast F1’, ‘Nectar F1’, ‘Cristal F1’, ‘Forticia F1’, ‘Nectar F1’, ‘Borsalina F1’, ‘Sandoline F1’, ‘Panekra F1’, ‘Sakura F1’, ‘Cocktail Crush F1’, ‘De Barao Krasny’, ‘Hector F1’, ‘Strabena’, ‘Cornue des Andes F1’, and ‘Brooklyn F1’,
- pink ‘Cipars F1’, ’Dimerosa F1’, ‘DRK936 F1’, ’Fuji Pink F1’, ‘Rosa Star F1’, ‘Rosetta F1’, ‘Pink Wonder F1’, ‘Pink Oxheart’, ‘Rhianna F1’, ‘Kongo F1’, ‘Gusto Pink F1’, ‘Pink Rock F1’, ‘Honey Moon F1’, and ‘Cassarosa F1’,
- orange—‘Apressa F1’, ’Beorange F1’, ‘Organza F1’, ‘Santorange F1’, ’Orange Wellington F1’, ‘Taijo F1’, ‘Orange Star F1’, ‘Kinkanstar F1’, and ‘Orange Queen’,
- yellow—’Bolzano F1’, ’Gualdino F1’, ‘Citrusovij Sad’, ‘Taiko’, and ‘Lemon Tree’,
- light green—‘Green Envy F1’ and ‘Limetto F1’,
- multicolored—‘Ananas’, ’Gargamel’, ‘Green Tiger’, ‘Pink Tiger’, ‘Blush Tiger’, and ‘Zebrino F1’,
- brown—‘Black Cherry F1’, ‘Bucanero F1’, ‘Chocostar F1’, ‘Chocomate F1’, ‘De Barao Chornij’, ‘Noire De Crimee’, and ‘Sacher F1’,
- and others (‘Ruskije Kolokola’, ‘Timenta’, ‘Sunstream’, ‘Toila’, ‘Pinedo’, ‘Luciestar’, ‘Delikates Moskvi’, and ‘Indigo Rose’) were included.
2.2. Non-Destructive Methods and Reference Analysis
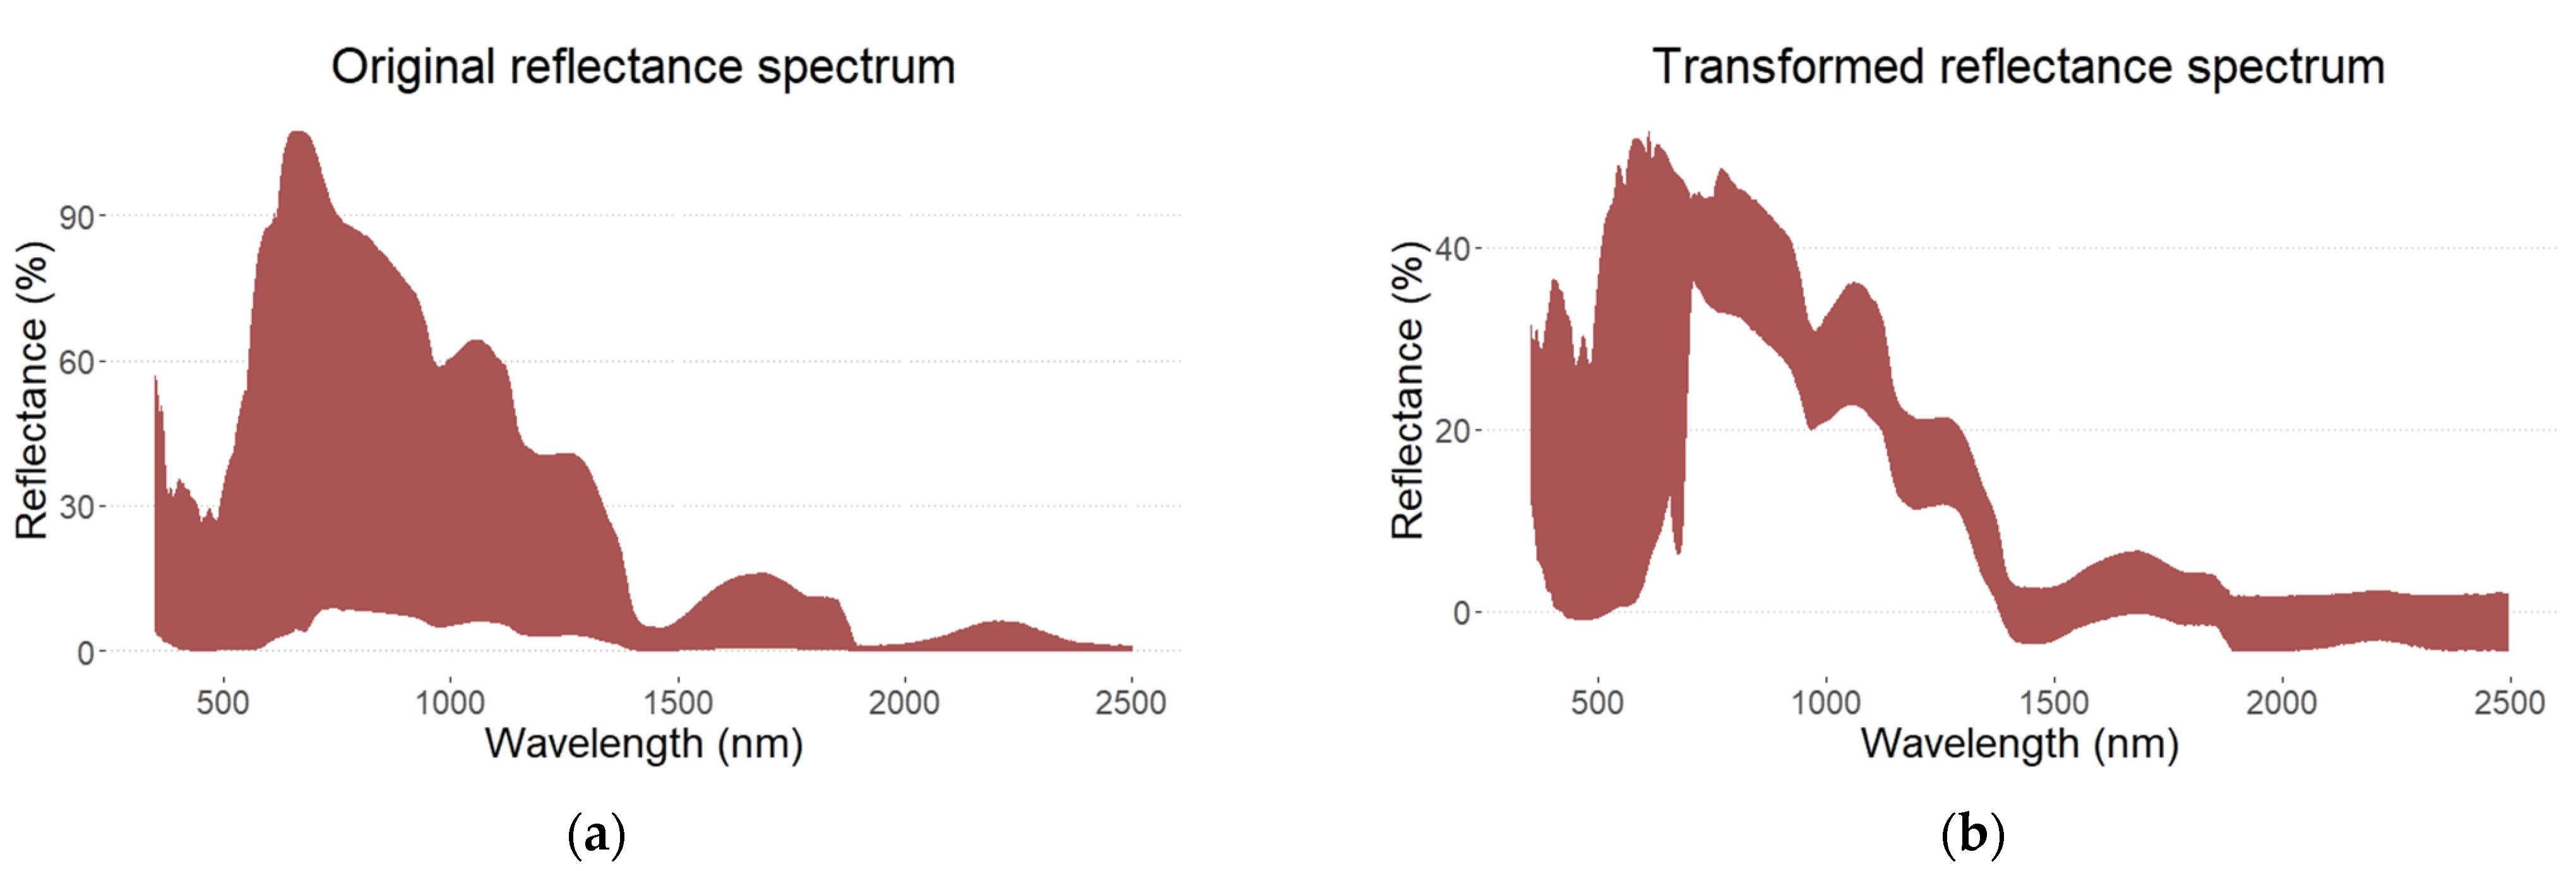
2.3. Mathematical Methods and Data Analysis
3. Results
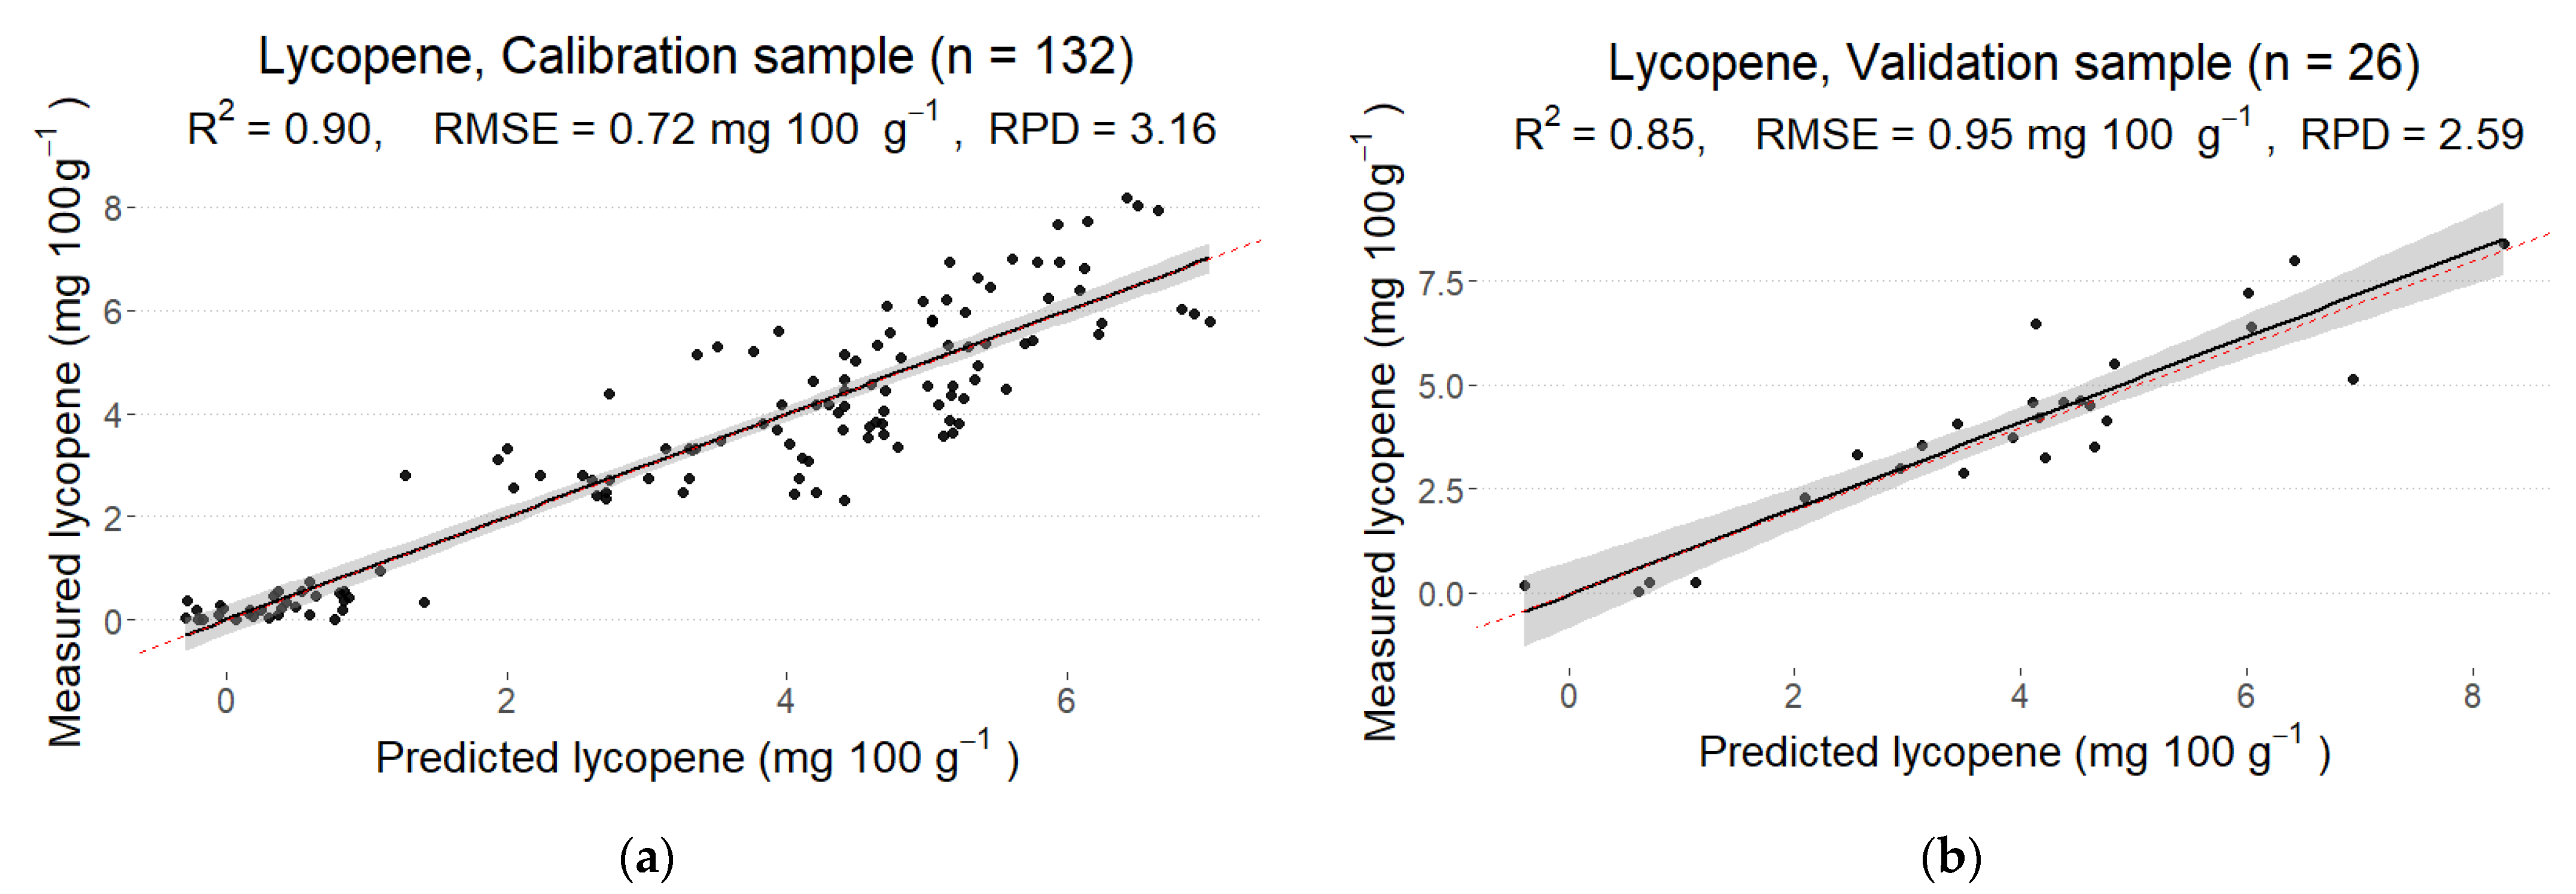
3.1. Lycopene
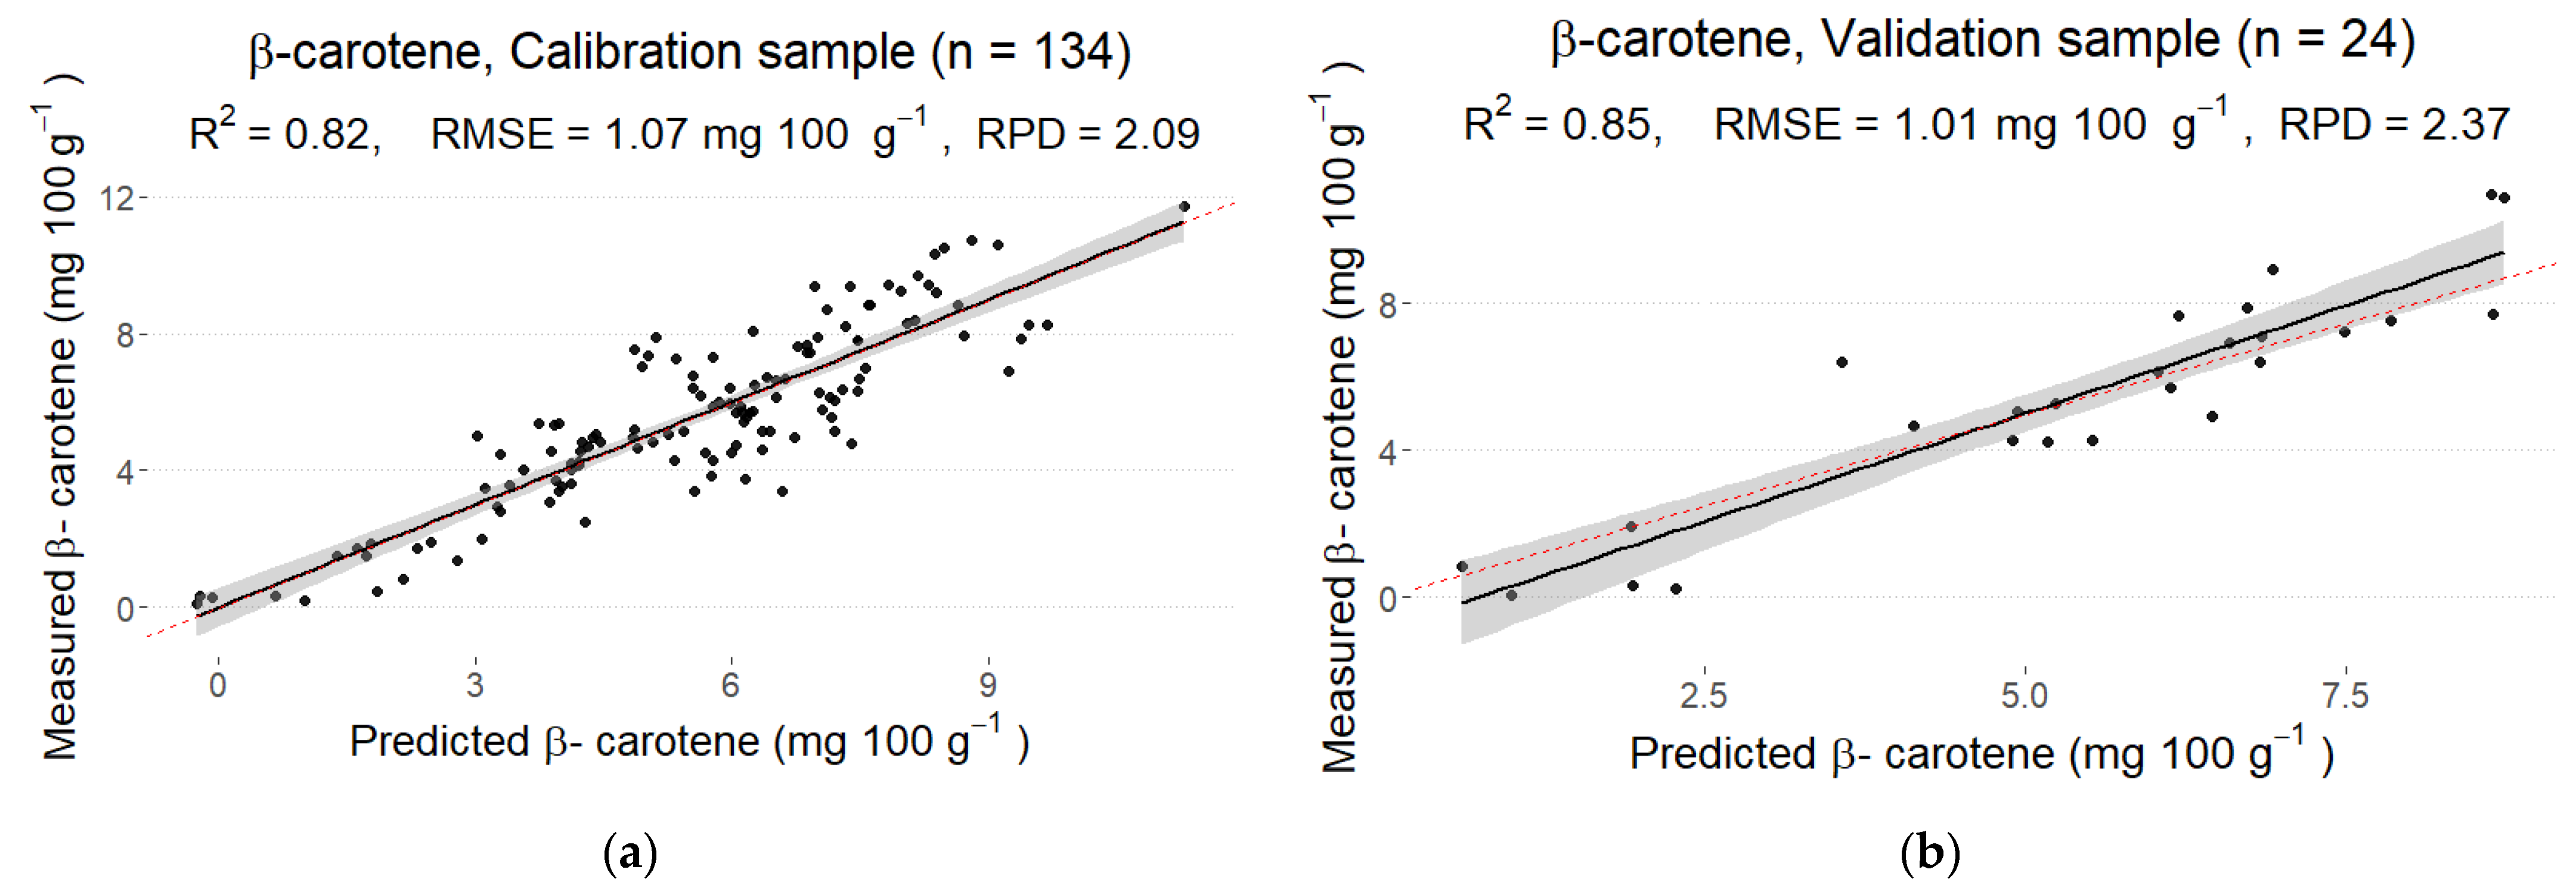
3.2. β-Carotene
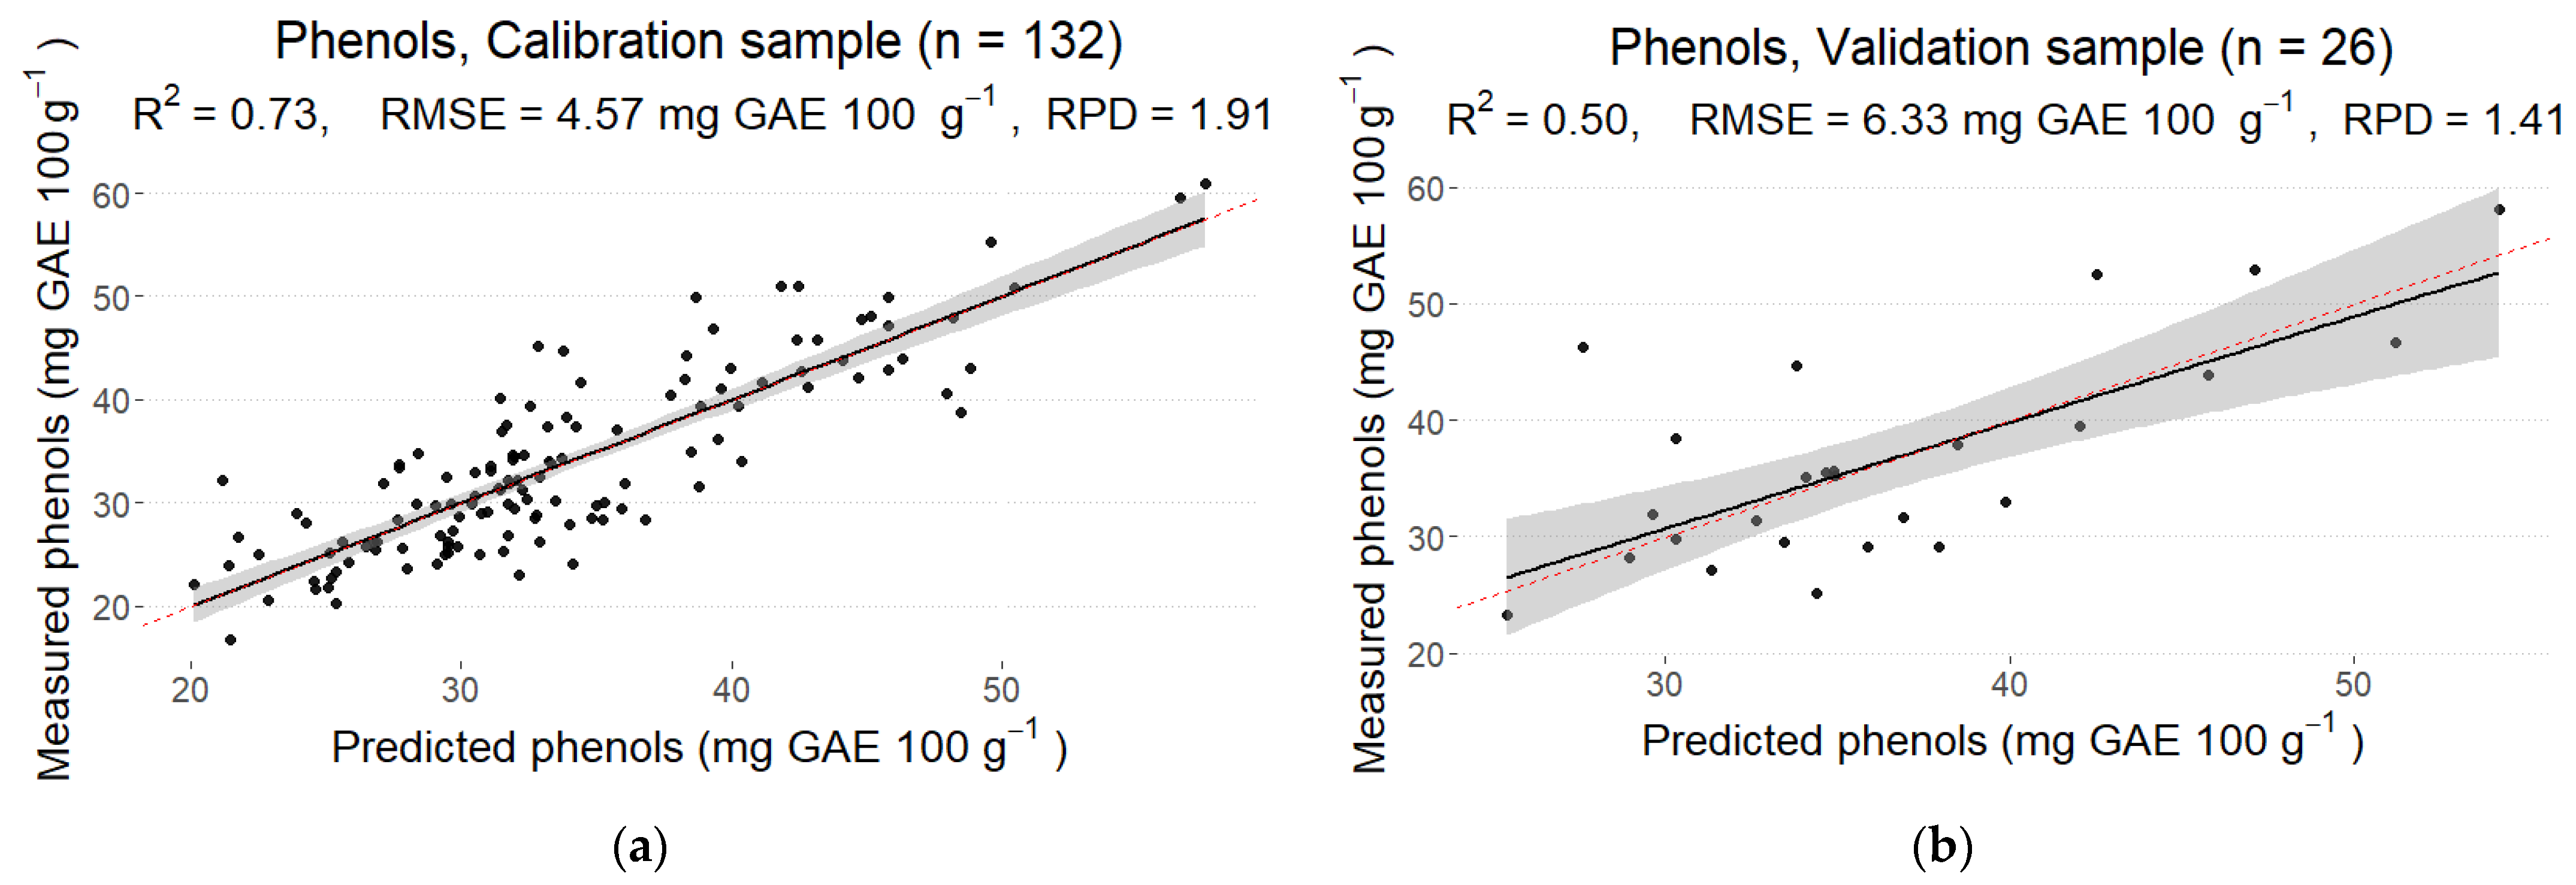
3.3. Total Phenols
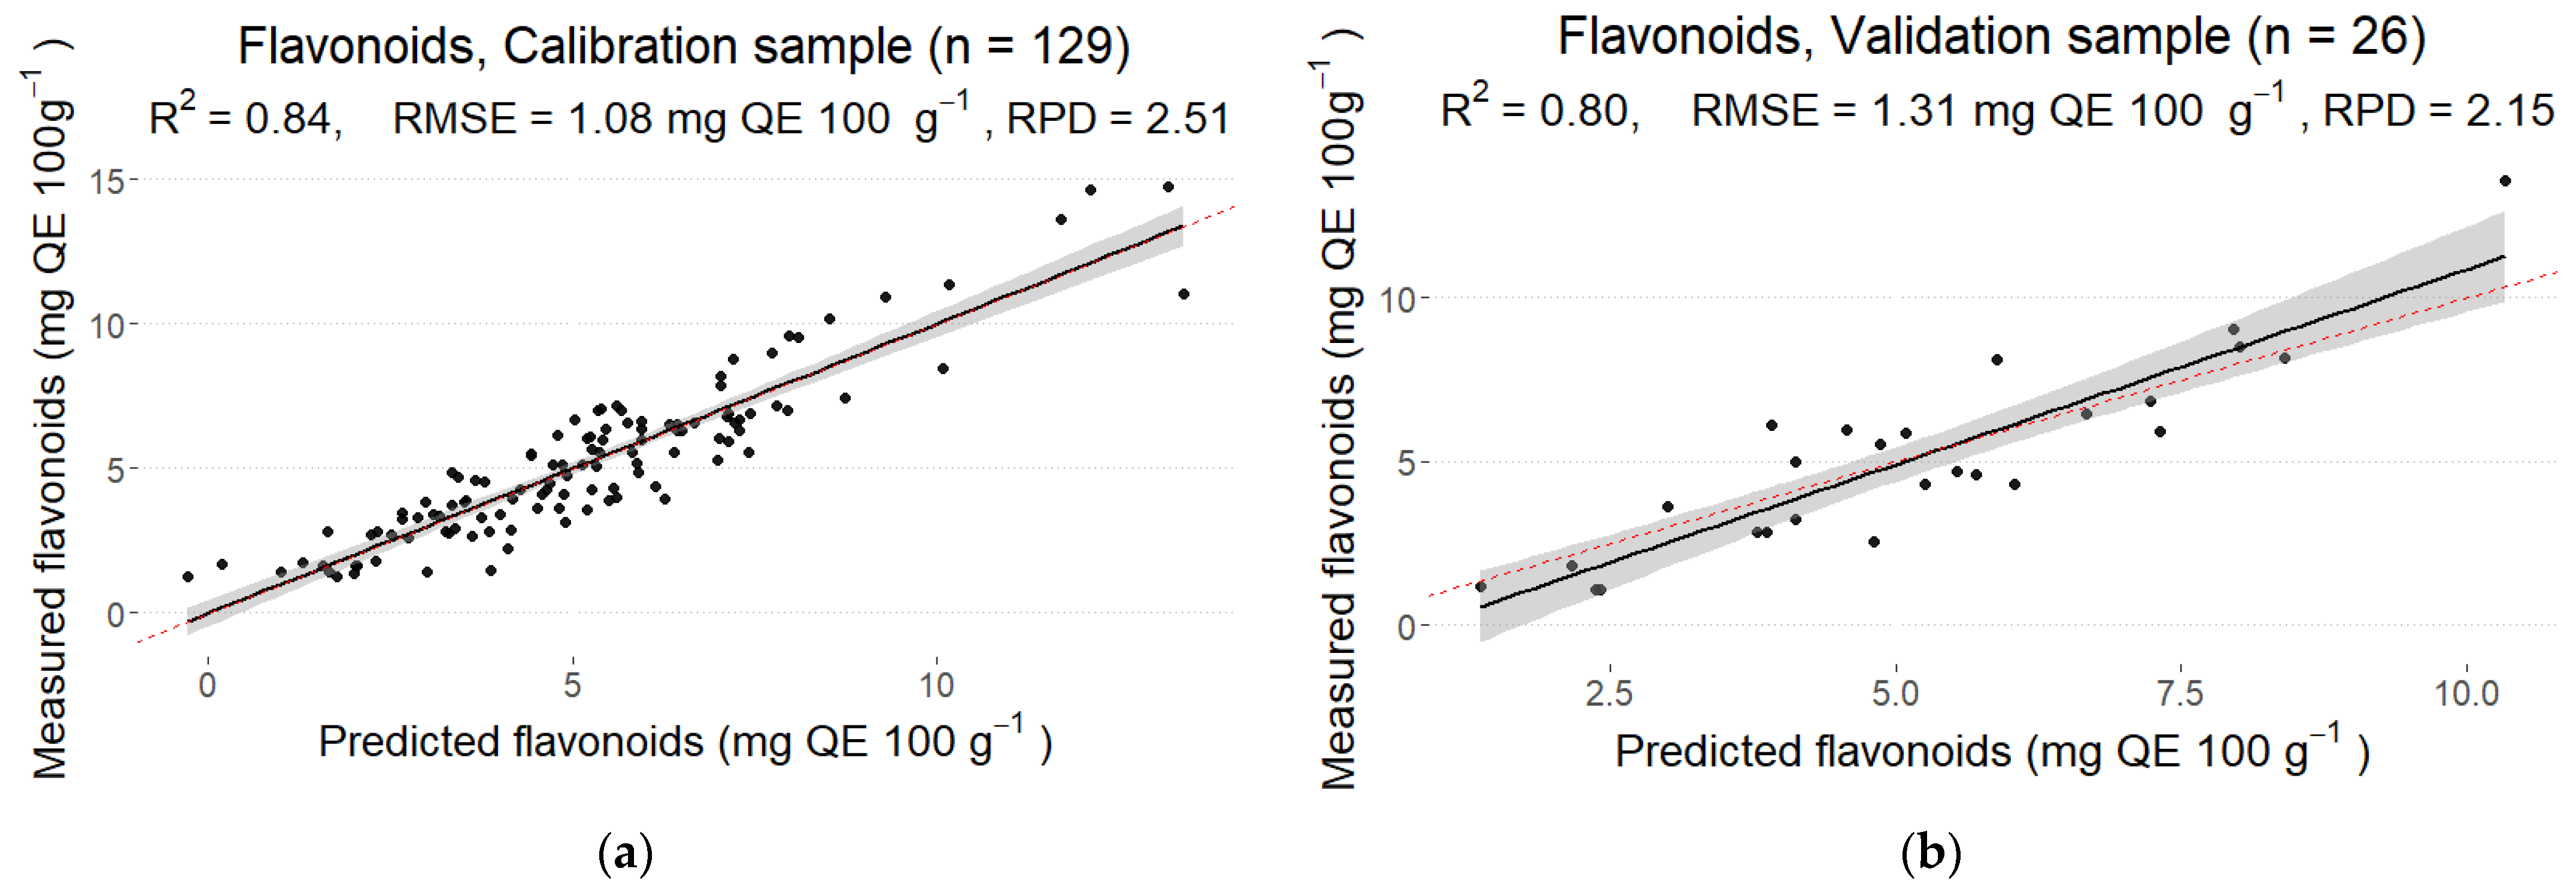
3.4. Flavonoids
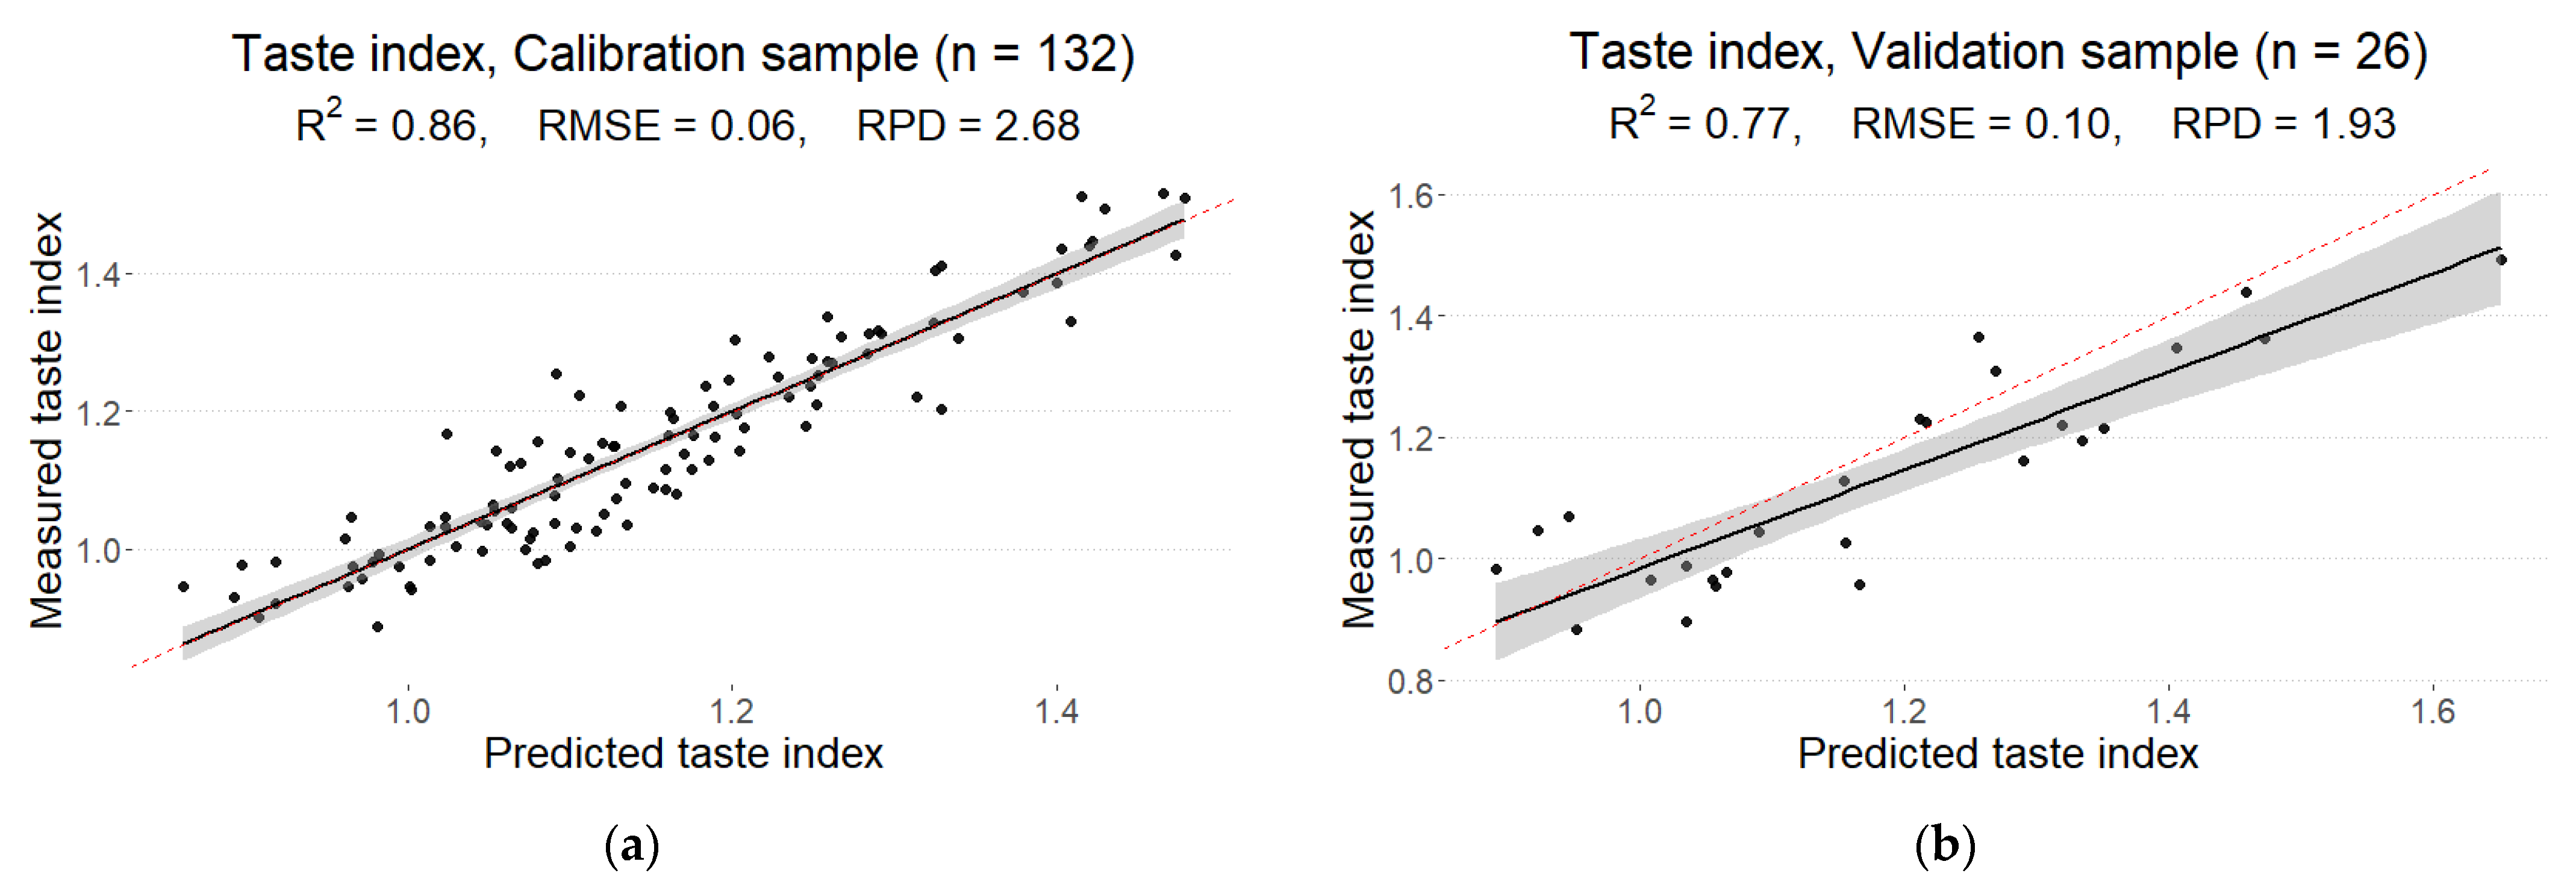
3.5. Taste Index
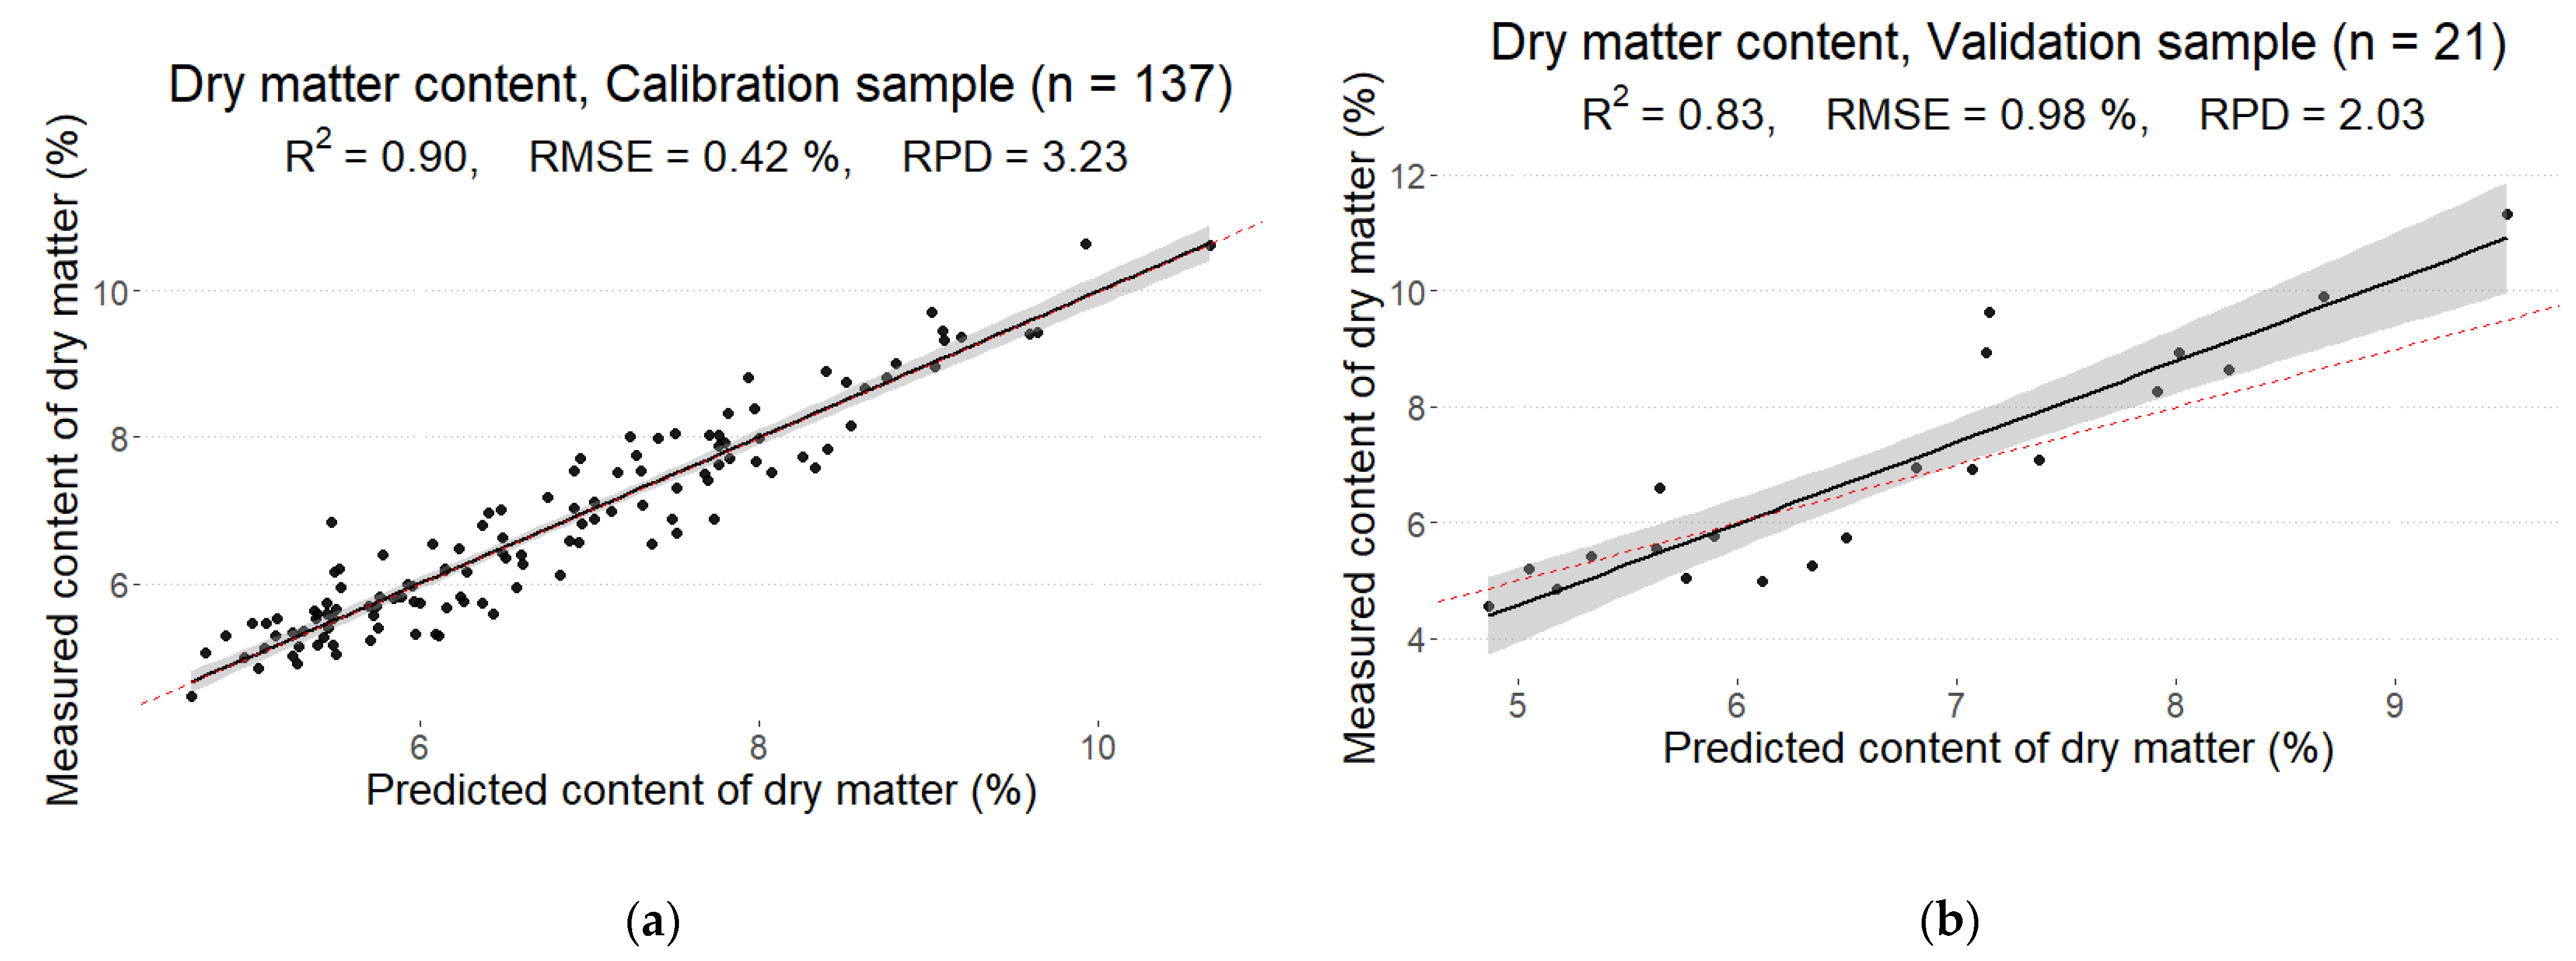
3.6. Dry Matter
4. Discussion
5. Conclusions
Author Contributions
Funding
Data Availability Statement
Conflicts of Interest
References
- FAOSTAT. Available online: https://www.fao.org/faostat/en/#data/QCL (accessed on 1 February 2023).
- Bauerfeind, J.; Hintze, V.; Kschonsek, J.; Killenberg, M.; Böhm, V. Use of photochemiluminescence for the determination of antioxidant activities of carotenoids and antioxidant capacities of selected tomato products. J. Agric. Food Chem. 2014, 62, 7452–7459. [Google Scholar] [CrossRef]
- Chaudhary, P.; Sharma, A.; Singh, B.; Nagpal, A.K. Bioactivities of phytochemicals present in tomato. J. Food Sci. Technol. 2018, 55, 2833–2849. [Google Scholar] [CrossRef]
- Puah, B.P.; Jalil, J.; Attiq, A.; Kamisah, Y. New Insights into Molecular Mechanism behind Anti-Cancer Activities of Lycopene. Molecules 2021, 26, 3888. [Google Scholar] [CrossRef]
- Tilesi, F.; Lombardi, A.; Mazzucato, A. Scientometric and Methodological Analysis of the Recent Literature on the Health-Related Effects of Tomato and Tomato Products. Foods 2021, 10, 1905. [Google Scholar] [CrossRef]
- Ercolano, M.R.; Carli, P.; Soria, A.; Cascone, A.; Fogliano, V.; Frusciante, L.; Barone, A. Biochemical, sensorial and genomic profiling of traditional Italian tomato varieties. Euphytica 2008, 164, 571–582. [Google Scholar] [CrossRef]
- Bai, Y.; Lindhout, P. Domestication and breeding of tomatoes: What have we gained and what can we gain in the future? Ann. Bot. 2007, 100, 1085–1094. [Google Scholar] [CrossRef]
- Bertin, N.; Génard, M. Tomato quality as influenced by preharvest factors. Sci. Hortic. 2018, 233, 264–276. [Google Scholar] [CrossRef]
- Sinesio, F.; Cammareri, M.; Cottet, V.; Fontanet, L.; Jost, M.; Moneta, E.; Palombieri, S.; Peparaio, M.; del Castillo, R.R.; Civitelli, E.S.; et al. Sensory Traits and Consumer’s Perceived Quality of Traditional and Modern Fresh Market Tomato Varieties: A Study in Three European Countries. Foods 2021, 10, 2521. [Google Scholar] [CrossRef]
- Davis, A.R.; Fish, W.W.; Perkins-Veazie, P. A rapid spectrophotometric method for analyzing lycopene content in tomato and tomato products. Postharvest. Biol. Technol. 2003, 28, 425–430. [Google Scholar] [CrossRef]
- Pedro, A.M.K.; Ferreira, M.M.C. Nondestructive Determination of Solids and Carotenoids in Tomato Products by Near-Infrared Spectroscopy and Multivariate Calibration. Anal. Chem. 2005, 77, 2505–2511. [Google Scholar] [CrossRef]
- Hussain, A.; Pu, H.; Sun, D.W. Innovative nondestructive imaging techniques for ripening and maturity of fruits–a review of recent applications. Trends Food Sci. Technol. 2018, 72, 144–152. [Google Scholar] [CrossRef]
- Wang, H.; Peng, J.; Xie, C.; Bao, Y.; He, Y. Fruit Quality Evaluation Using Spectroscopy Technology: A Review. Sensors 2015, 15, 11889–11927. [Google Scholar] [CrossRef]
- Zhang, D.; Yang, Y.; Chen, G.; Tian, X.; Wang, Z.; Fan, S.; Xin, Z. Nondestructive evaluation of soluble solids content in tomato with different stage by using Vis/NIR technology and multivariate algorithms. Spectrochim. Acta A Mol. Biomol. Spectrosc. 2021, 248, 119139. [Google Scholar] [CrossRef]
- Cortés, V.; Blasco, J.; Aleixos, N.; Cubero, S.; Talens, P. Monitoring strategies for quality control of agricultural products using visible and near-infrared spectroscopy: A review. Trends Food Sci. Technol. 2019, 85, 138–148. [Google Scholar] [CrossRef]
- Ignat, T.; Lurie, S.; Nyasordzi, J.; Ostrovsky, V.; Egozi, H.; Hoffman, A.; Friedman, H.; Weksler, A.; Schmilovitch, Z. Forecast of Apple Internal Quality Indices at Harvest and During Storage by VIS-NIR Spectroscopy. Food Bioprocess Technol. 2014, 7, 2951–2961. [Google Scholar] [CrossRef]
- Li, J.; Huang, W.; Zhao, C.; Zhang, B. A comparative study for the quantitative determination of soluble solids content, pH and firmness of pears by Vis/NIR spectroscopy. J. Food Eng. 2013, 116, 324–332. [Google Scholar] [CrossRef]
- Moghimi, A.; Aghkhani, M.H.; Sazgarnia, A.; Sarmad, M. Vis/NIR spectroscopy and chemometrics for the prediction of soluble solids content and acidity (pH) of kiwifruit. Biosyst. Eng. 2010, 106, 295–302. [Google Scholar] [CrossRef]
- Zude, M. Non-destructive prediction of banana fruit quality using VIS/NIR spectroscopy. Fruits 2003, 58, 135–142. [Google Scholar] [CrossRef]
- Hu, R.; Zhang, L.; Yu, Z.; Zhai, Z.; Zhang, R. Optimization of soluble solids content prediction models in ‘Hami’ melons by means of Vis-NIR spectroscopy and chemometric tools. Infrared Phys. Technol. 2019, 102, 102999. [Google Scholar] [CrossRef]
- Costa, G.; Noferini, M.; Fiori, G.; Torrigiani, P. Use of Vis/NIR Spectroscopy to Assess Fruit Ripening Stage and Improve Management in Post-Harvest Chain. Fresh Prod. 2009, 1, 35–41. [Google Scholar]
- Melado-Herreros, A.; Nieto-Ortega, S.; Olabarrieta, I.; Gutiérrez, M.; Villar, A.; Zufía, J.; Gorretta, N.; Roger, J.M. Postharvest ripeness assessment of ‘Hass’ avocado based on development of a new ripening index and Vis-NIR spectroscopy. Postharvest. Biol. Technol. 2021, 181, 111683. [Google Scholar] [CrossRef]
- Clément, A.; Dorais, M.; Vernon, M. Nondestructive Measurement of Fresh Tomato Lycopene Content and Other Physicochemical Characteristics Using Visible−NIR Spectroscopy. J. Agric. Food Chem. 2008, 56, 9813–9818. [Google Scholar] [CrossRef]
- Borba, K.R.; Aykas, D.P.; Milani, M.I.; Colnago, L.A.; Ferreira, M.D.; Rodriguez-Saona, L.E. Portable near Infrared Spectroscopy as a Tool for Fresh Tomato Quality Control Analysis in the Field. Appl. Sci. 2021, 11, 3209. [Google Scholar] [CrossRef]
- Najjar, K.; Abu-Khalaf, N. Non-destructive quality measurement for three varieties of tomato using Vis/NIR spectroscopy. Sustainability 2021, 13, 10747. [Google Scholar] [CrossRef]
- Alenazi, M.M.; Shafiq, M.; Alsadon, A.A.; Alhelal, I.M.; Alhamdan, A.M.; Solieman, T.H.I.; Ibrahim, A.A.; Shady, M.R.; Saad, M.A.O. Non-destructive assessment of flesh firmness and dietary antioxidants of greenhouse-grown tomato (Solanum lycopersicum L.) at different fruit maturity stages. Saudi J. Biol. Sci. 2020, 27, 2839–2846. [Google Scholar] [CrossRef] [PubMed]
- Goisser, S.; Wittmann, S.; Fernandes, M.; Mempel, H.; Ulrichs, C. Comparison of colorimeter and different portable food-scanners for non-destructive prediction of lycopene content in tomato fruit. Postharvest. Biol. Technol. 2020, 167. [Google Scholar] [CrossRef]
- Alsina, I.; Erdberga, I.; Duma, M.; Alksnis, R.; Dubova, L. Changes in Greenhouse Grown Tomatoes Metabolite Content Depending on Supplemental Light Quality. Front. Nutr. 2022, 9, 830186. [Google Scholar] [CrossRef]
- Soare, R.; Maria, D.; Alexandru-Ioan, A.; Soare, M. The evolution of some nutritional parameters of the tomato fruit during the harvesting stages. Hortic. Sci. 2019, 46, 132–137. [Google Scholar] [CrossRef]
- Singleton, V.L.; Orthofer, R.; Lamuela-Raventós, R.M. Analysis of total phenols and other oxidation substrates and antioxi-dants by means of Folin-Ciocalteu reagent. Methods Enzymol. 1999, 299, 152–178. [Google Scholar] [CrossRef]
- Kim, D.; Jeond, S.; Lee, C. Antioxidant capacity of phenolic phytochemicals from various cultivars of plums. Food Chem. 2003, 81, 321–326. [Google Scholar] [CrossRef]
- Oliveira, G.A.; Bureau, S.; Renard, C.M.G.C.; Pereira-Netto, A.B.; de Castilhos, F. Comparison of NIRS approach for prediction of internal quality traits in three fruit species. Food Chem. 2014, 143, 223–230. [Google Scholar] [CrossRef] [PubMed]
- Aruda de Brito, A.; Campos, F.; dos Reis Nascimento, A.; Damiani, C.; Alves da Silva, F.; de Almeida Teixeira, G.H.; Cunha Júnior, L.C. Non-destructive determination of color, titratable acidity, and dry matter in intact tomatoes using a portable Vis-NIR spectrometer. J. Food Compos. Anal. 2022, 107, 104288. [Google Scholar] [CrossRef]
- Wold, S.; Sjöström, M.; Eriksson, L. PLS-regression: A basic tool of chemometrics. Chemom. Intell. Lab. Syst. 2001, 58, 109–130. [Google Scholar] [CrossRef]
- Windig, W.; Shaver, J.; Bro, R. Loopy MSC: A simple way to improve multiplicative scatter correction. Appl. Spectrosc. 2008, 62, 1153–1159. [Google Scholar] [CrossRef]
- Lan, W.; Jaillais, B.; Chen, S.; Renard, C.M.G.C.; Leca, A.; Bureau, S. Fruit variability impacts puree quality: Assessment on individually processed apples using the visible and near infrared spectroscopy. Food Chem. 2022, 390, 133088. [Google Scholar] [CrossRef]
- Alsina, I.; Dubova, L.; Duma, M.; Erdberga, I.; Avotiņš, A.; Rakutko, S. Comparison of lycopene and β-carotene content in tomatoes determined with chemical and non-destructive methods. Agron. Res. 2019, 17, 343–348. [Google Scholar] [CrossRef]
- Li, X.; Tsuta, M.; Hayakawa, F.; Nakano, Y.; Kazami, Y.; Ikehata, A. Estimating the sensory qualities of tomatoes using visible and near-infrared spectroscopy and interpretation based on gas chromatography–mass spectrometry metabolomics. Food Chem. 2021, 343, 128470. [Google Scholar] [CrossRef]
- Khodabakhshian, R.; Emadi, B.; Khojastehpour, M.; Golzarian, M.R. A comparative study of reflectance and transmittance modes of Vis/NIR spectroscopy used in determining internal quality attributes in pomegranate fruits. J. Food Meas. Charact. 2019, 13, 3130–3139. [Google Scholar] [CrossRef]
- Tilahun, S.; Seo, M.H.; Hwang, I.G.; Kim, S.H.; Choi, H.R.; Jeong, C.S. Prediction of lycopene and β-carotene in tomatoes by portable chroma-meter and VIS/NIR spectra. Postharvest. Biol. Technol. 2018, 136, 50–56. [Google Scholar] [CrossRef]
- Li, T.; Zhong, C.; Lou, W.; Wei, M.; Hou, J. Optimization of Characteristic Wavelengths in Prediction of Lycopene in Tomatoes Using Near-Infrared Spectroscopy. J. Food Process. Eng. 2017, 40, e12266. [Google Scholar] [CrossRef]
- Baranska, M.; Schütze, W.; Schulz, H. Determination of lycopene and beta-carotene content in tomato fruits and related products: Comparison of FT-Raman, ATR-IR, and NIR spectroscopy. Anal. Chem. 2006, 78, 8456–8461. [Google Scholar] [CrossRef] [PubMed]
- Radzevičius, A.; Viškelis, J.; Karklelienė, R.; Juškevičienė, D.; Viškelis, P. Determination of tomato quality attributes using near infrared spectroscopy and reference analysis. Zemdirb.-Agric. 2016, 103, 91–98. [Google Scholar] [CrossRef]
- Acharya, U.K.; Subedi, P.P.; Walsh, K.B. Robustness of Tomato Quality Evaluation Using a Portable Vis-SWNIRS for Dry Matter and Colour. Int. J. Anal. Chem. 2017, 2017, 1–8. [Google Scholar] [CrossRef] [PubMed]
- Ibáñez, G.; Cebolla-Cornejo, J.; Martí, R.; Roselló, S.; Valcárcel, M. Non-destructive determination of taste-related compounds in tomato using NIR spectra. J. Food Eng. 2019, 263, 237–242. [Google Scholar] [CrossRef]
- Williams, P.; Manley, M.; Antoniszyn, J. Statistical terms for evaluation of accuracy and prediction. In Near Infrared Technology: Getting the Best out of Light; African Sun Media: Stellenbosch, South Africa, 2019; pp. 69–103. [Google Scholar]


| Parameters | Methods of Analyses | Reference |
|---|---|---|
| Lycopene | Solvent—tetrahydrofuran, spectrophotometry | [28] |
| β-carotene | Solvent—tetrahydrofuran, spectrophotometry | [28] |
| Total phenols | Solvent—methanol, spectrophotometry | [30] |
| Total flavonoids | Solvent—ethanol, spectrophotometry | [31] |
| Dry matter | Gravimetry | [28] |
| Soluble solids | Refractometry | [28] |
| Titratable acidity | Alkaline titration | [28] |
| Taste index | Calculations using soluble solids and titratable acidity | [29] |
Disclaimer/Publisher’s Note: The statements, opinions and data contained in all publications are solely those of the individual author(s) and contributor(s) and not of MDPI and/or the editor(s). MDPI and/or the editor(s) disclaim responsibility for any injury to people or property resulting from any ideas, methods, instructions or products referred to in the content. |
© 2023 by the authors. Licensee MDPI, Basel, Switzerland. This article is an open access article distributed under the terms and conditions of the Creative Commons Attribution (CC BY) license (https://creativecommons.org/licenses/by/4.0/).
Share and Cite
Duckena, L.; Alksnis, R.; Erdberga, I.; Alsina, I.; Dubova, L.; Duma, M. Non-Destructive Quality Evaluation of 80 Tomato Varieties Using Vis-NIR Spectroscopy. Foods 2023, 12, 1990. https://doi.org/10.3390/foods12101990
Duckena L, Alksnis R, Erdberga I, Alsina I, Dubova L, Duma M. Non-Destructive Quality Evaluation of 80 Tomato Varieties Using Vis-NIR Spectroscopy. Foods. 2023; 12(10):1990. https://doi.org/10.3390/foods12101990
Chicago/Turabian StyleDuckena, Lilija, Reinis Alksnis, Ieva Erdberga, Ina Alsina, Laila Dubova, and Mara Duma. 2023. "Non-Destructive Quality Evaluation of 80 Tomato Varieties Using Vis-NIR Spectroscopy" Foods 12, no. 10: 1990. https://doi.org/10.3390/foods12101990
APA StyleDuckena, L., Alksnis, R., Erdberga, I., Alsina, I., Dubova, L., & Duma, M. (2023). Non-Destructive Quality Evaluation of 80 Tomato Varieties Using Vis-NIR Spectroscopy. Foods, 12(10), 1990. https://doi.org/10.3390/foods12101990