
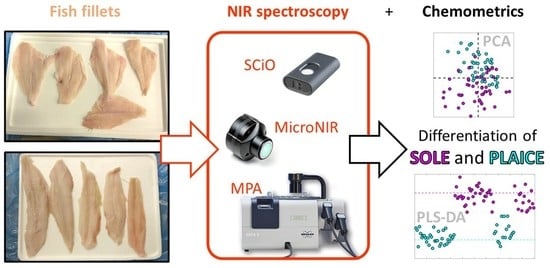
Chemometric Differentiation of Sole and Plaice Fish Fillets Using Three Near-Infrared Instruments

 ,
,  , , , , and
Abstract
:
1. Introduction
2. Materials and Methods
2.1. NIR Instruments
2.2. Specimens and Spectra Acquisition
2.3. Data Processing and Chemometric Modelling
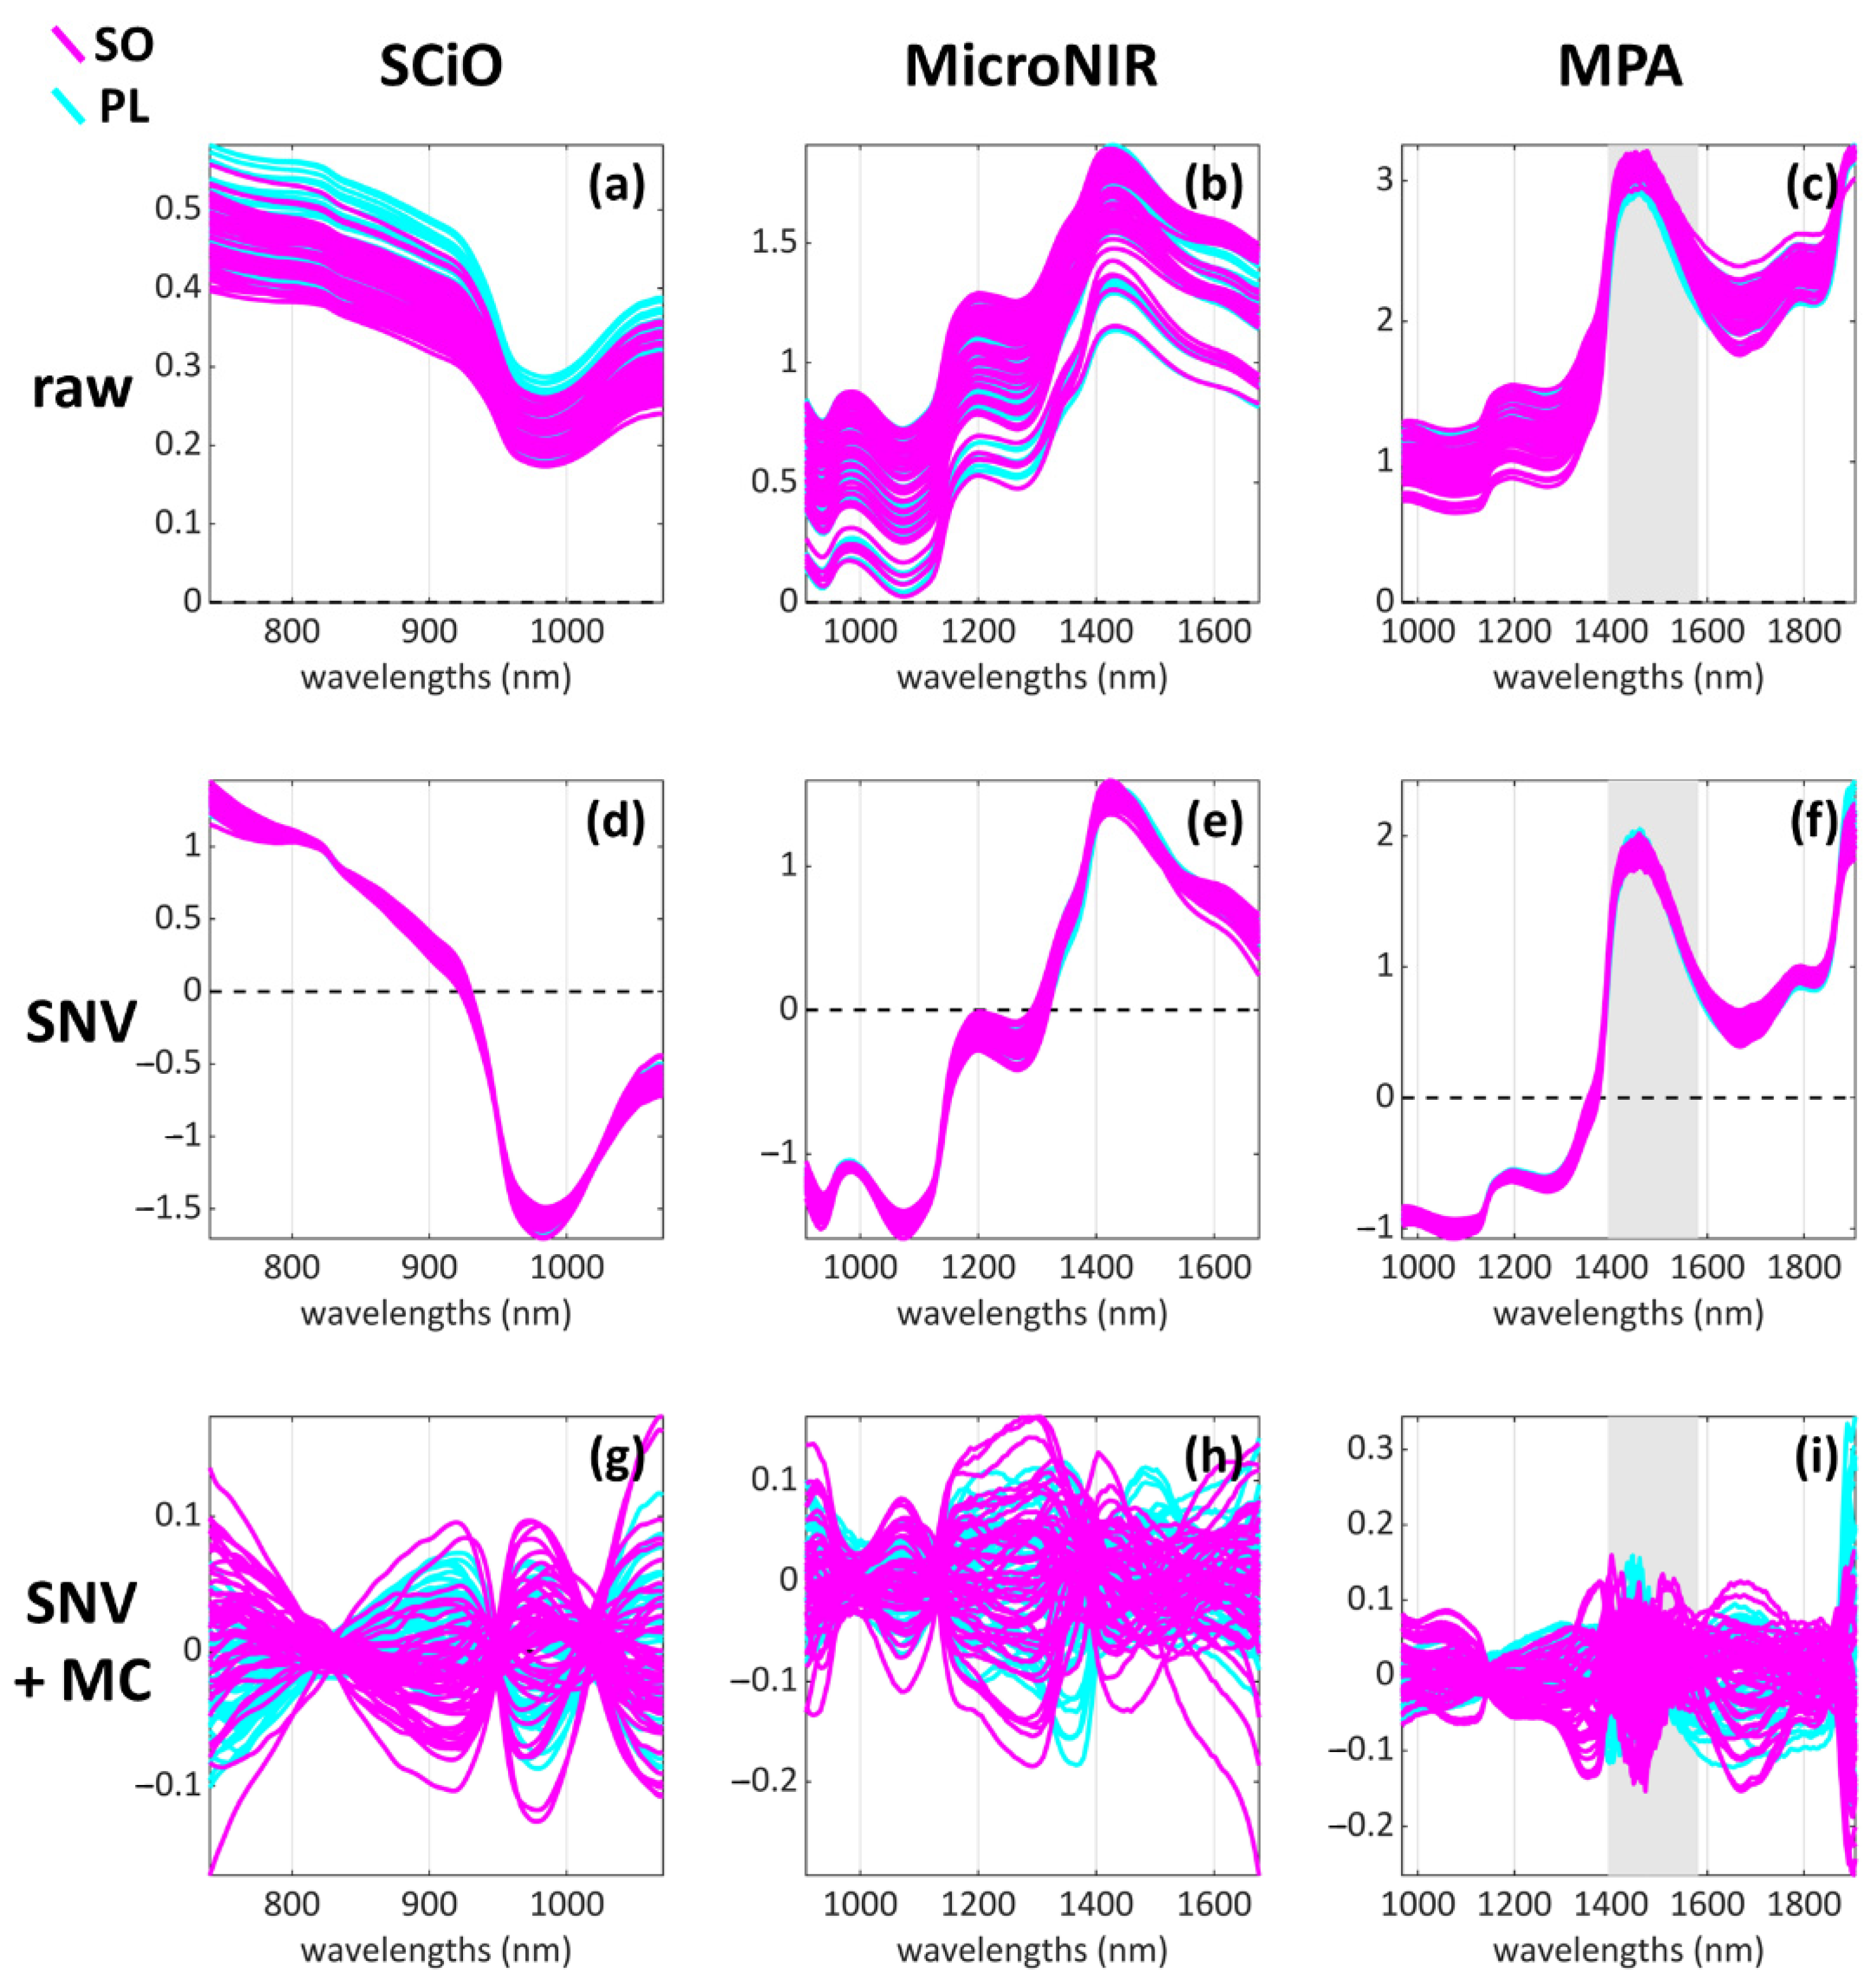
2.3.1. Raw Data Pre-Treatment and Assessment
2.3.2. Data Pre-Processing
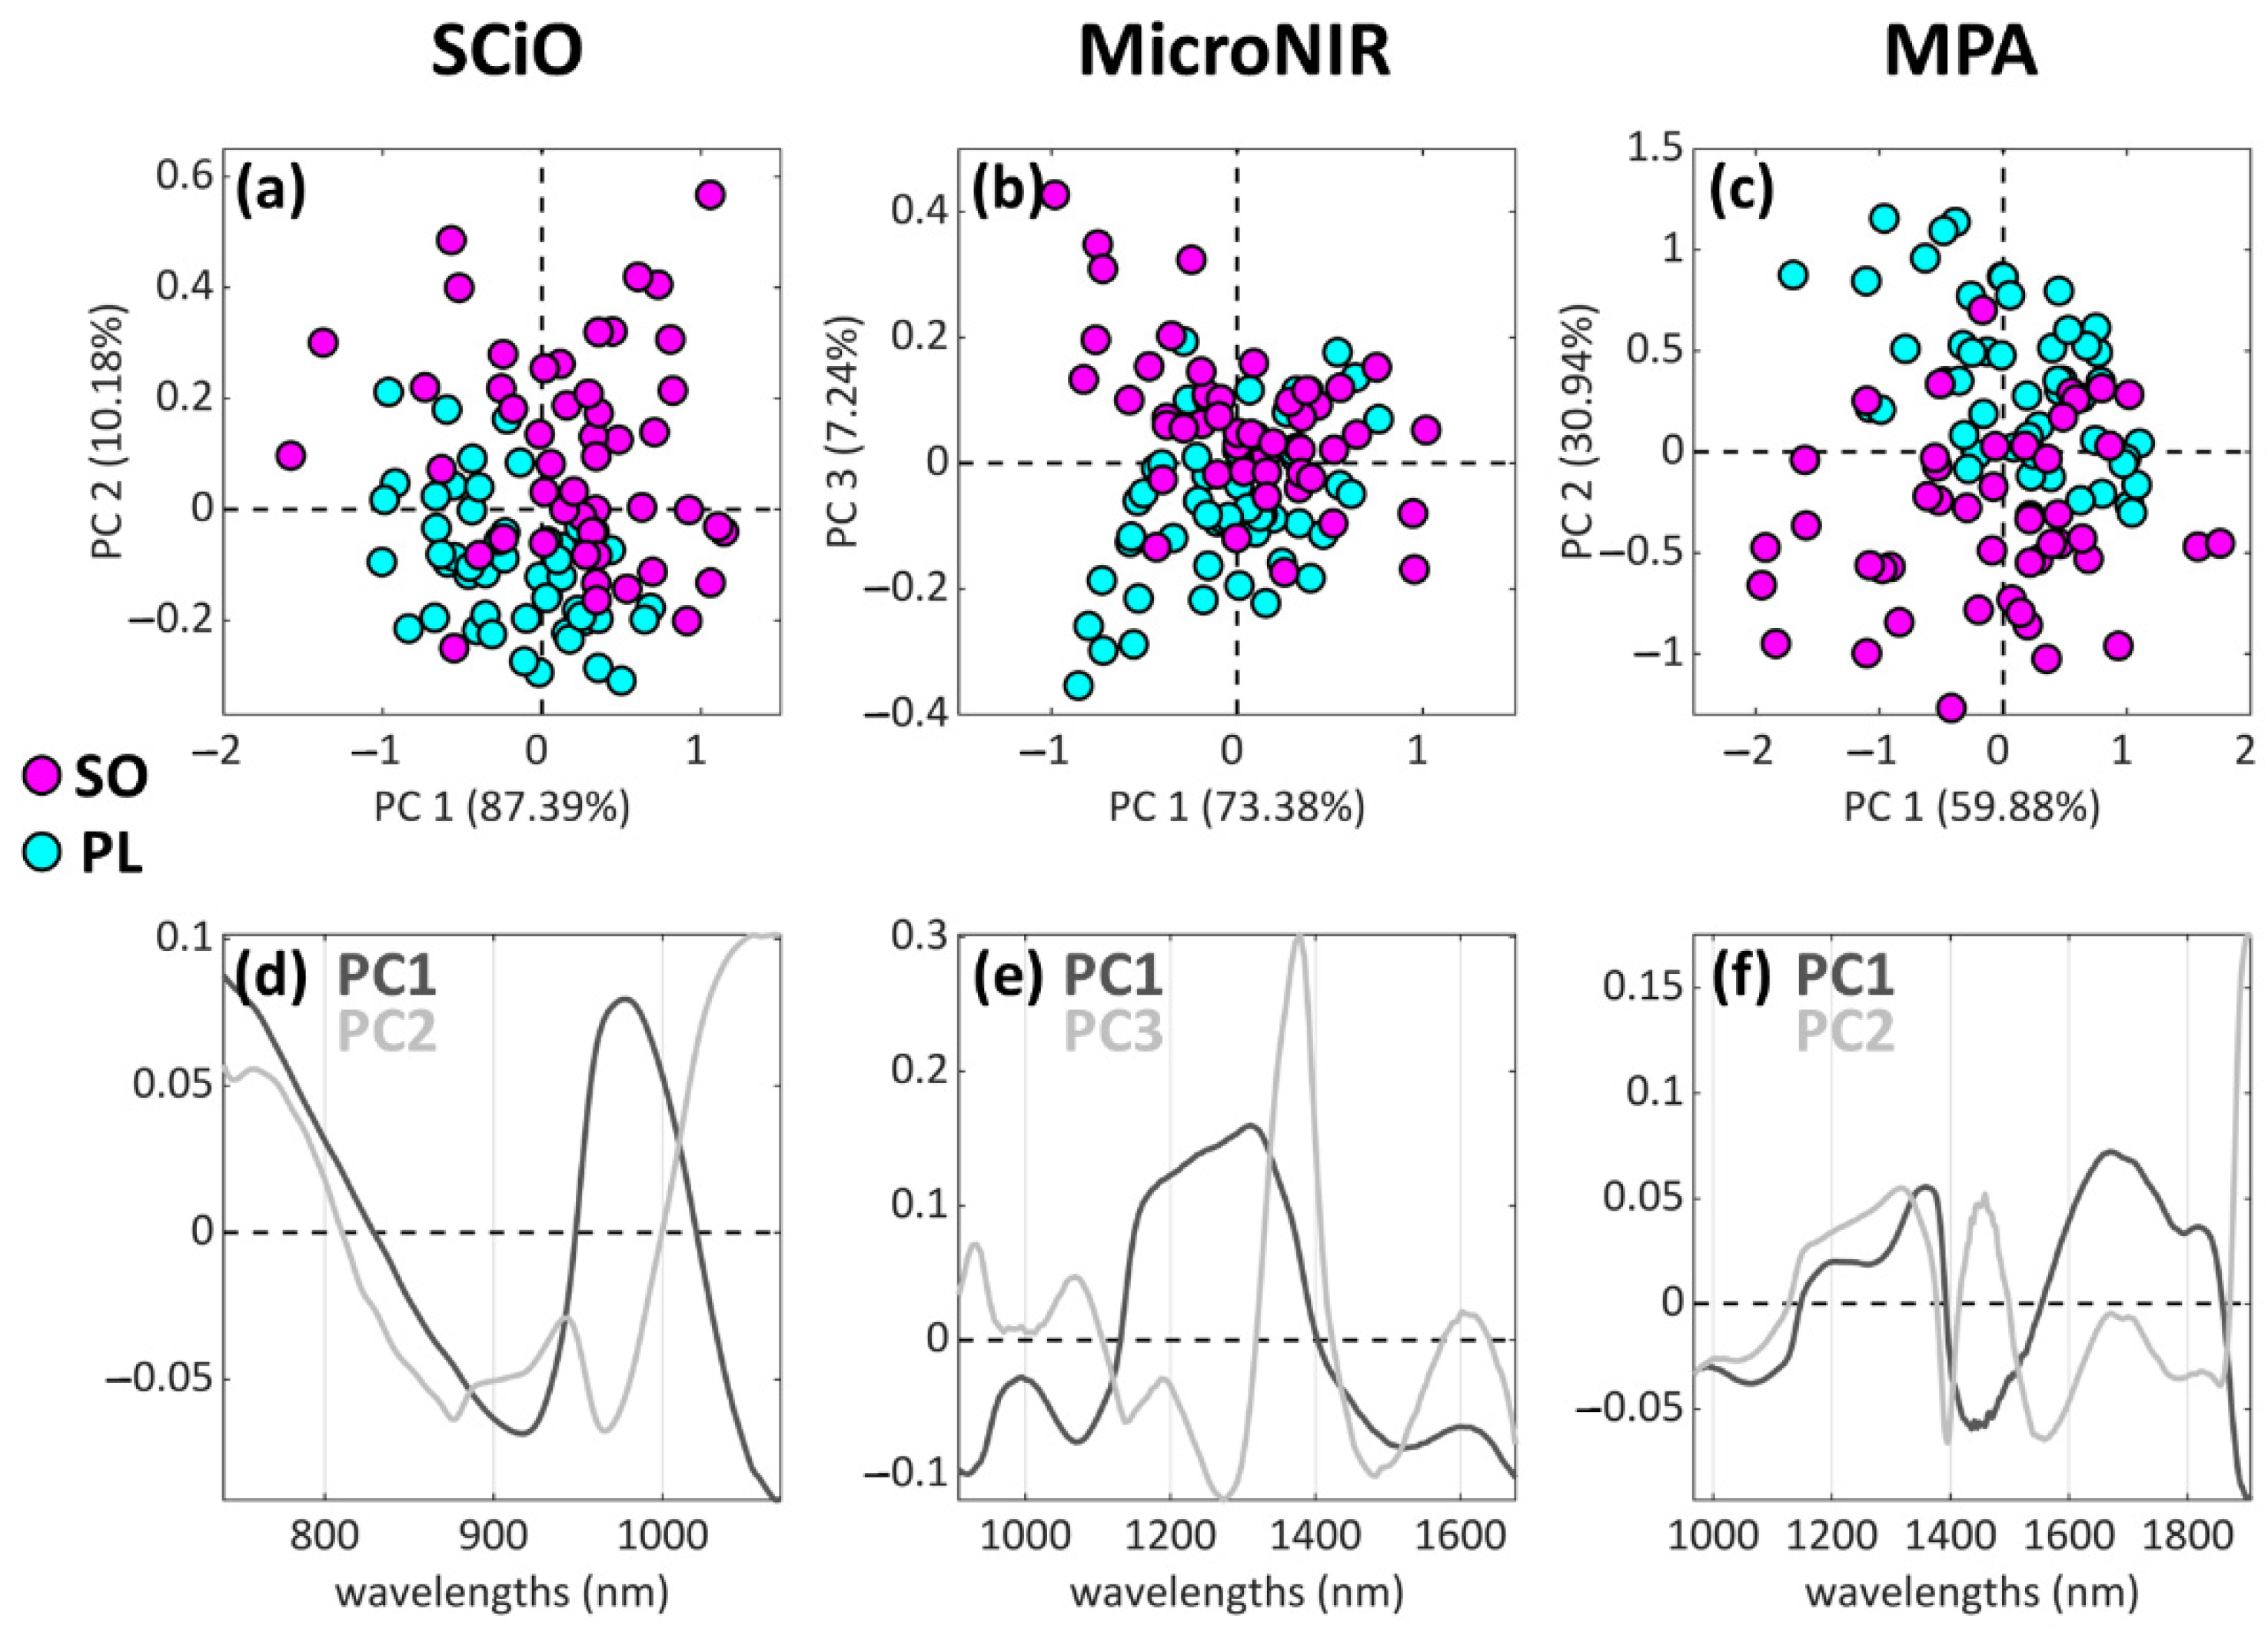
2.3.3. Exploratory Data Analysis
2.3.4. Classification Modelling
- Specificity (Spec): it is the ability to avoid false positives i.e., PL samples wrongly classified as SO.
- Sensitivity (Sens): it is the ability to avoid false negatives i.e., SO samples wrongly classified as PL.
- Non-error rate (NER): it is computed as the mean of the sensitivities (one for each class) and corresponds to the overall capability of the model to correctly classify the samples (i.e., both SO and PL).
- Accuracy (Acc): it is an estimation of the model error, and it is computed as the sum of the true positives (TP, correctly classified sole samples) and true negatives (TN, correctly classified plaice samples) divided by the total number of samples.
2.4. Software and Toolboxes
3. Results
3.1. Exploratory Analysis Results
3.2. Classification Analysis Results: Prediction of Sole (SO) vs. Plaice (PL) Samples
- SCiO dataset: 2 out of 34 (one PL predicted as SO, one SO predicted as PL).
- MicroNIR dataset: 2 out of 34 (2 PL predicted as SO).
- MPA dataset: 3 out of 33 (3 SO predicted as PL).
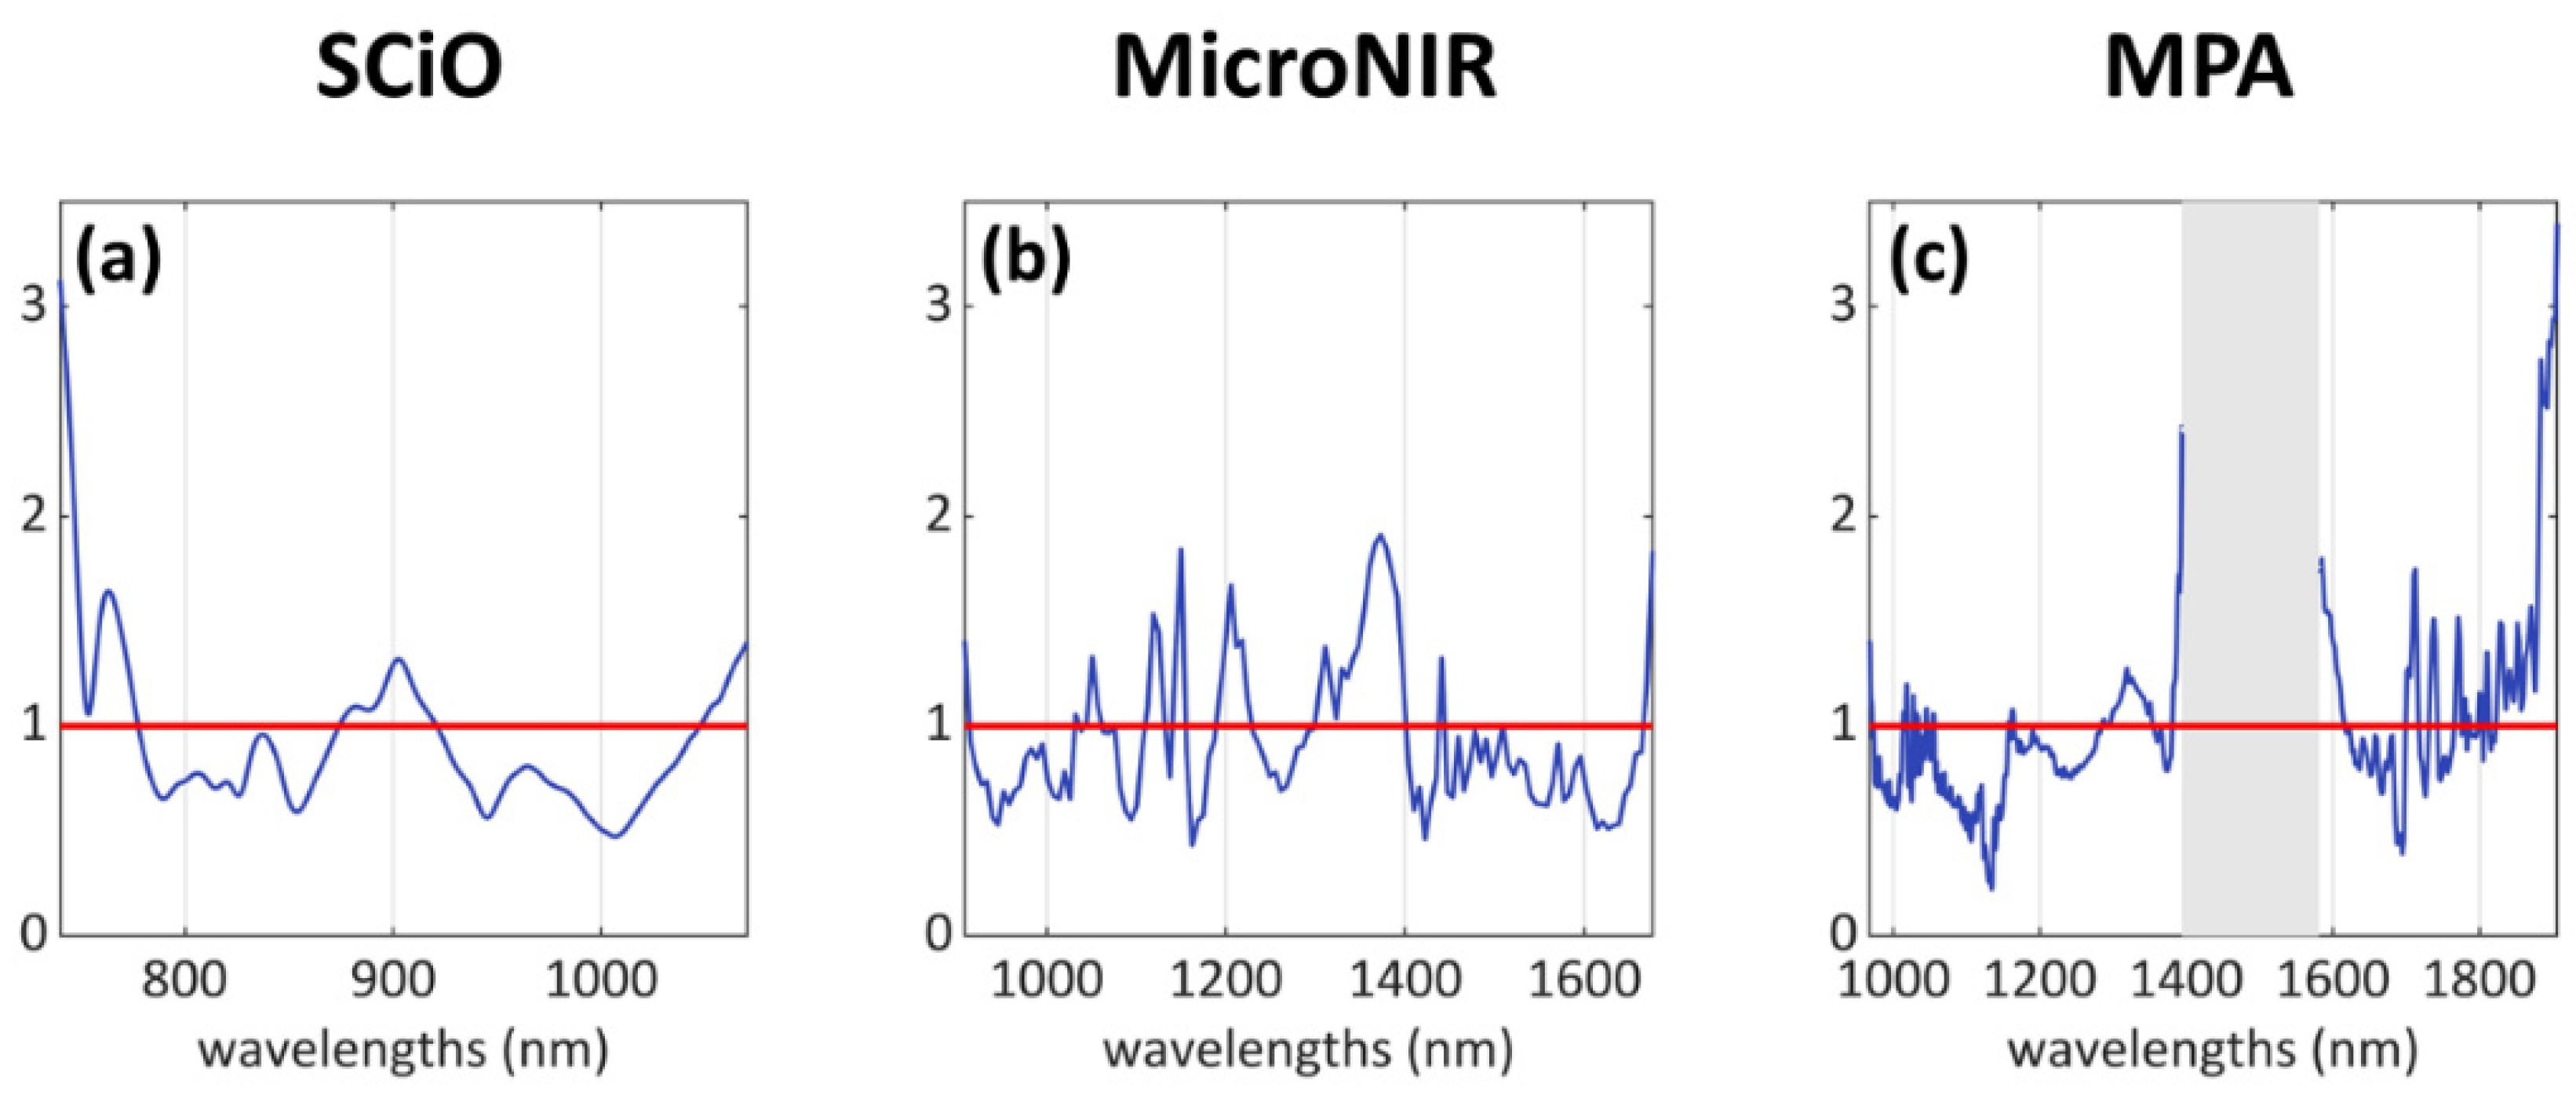
- SCiO dataset: mainly three areas, i.e., 740–780 nm, 875–920 nm, 1045–1070 nm.
- MicroNIR dataset: several individual peaks and bands, mostly along the wavelength range 1000–1400 nm.
- MPA dataset: several individual peaks in the intervals 1010–1060 nm, 1290–1350 nm, and 1700–1910 nm; a wide “missing” signal can be identified in the central region of the spectrum, within the range 1380–1615 nm, but this region was removed due to its high content of noisy signals.
4. Discussion
Classification Analysis Results: VIP Scores Interpretation
5. Conclusions
Supplementary Materials
Author Contributions
Funding
Institutional Review Board Statement
Informed Consent Statement
Data Availability Statement
Conflicts of Interest
References
- Reilly, A. Overview of Food Fraud in the Fisheries Sector; FAO: Rome, Italy, 2018. [Google Scholar]
- Calosso, M.C.; Claydon, J.A.B.; Mariani, S.; Cawthorn, D.M. Global footprint of mislabelled seafood on a small island nation. Biol. Conserv. 2020, 245, 108557. [Google Scholar] [CrossRef]
- Donlan, C.J.; Luque, G.M. Exploring the causes of seafood fraud: A meta-analysis on mislabeling and price. Mar. Policy 2019, 100, 258–264. [Google Scholar] [CrossRef]
- Carvalho, D.C.; Guedes, D.; da Gloria Trindade, M.; Coelho, R.M.S.; de Lima Araujo, P.H. Nationwide Brazilian governmental forensic programme reveals seafood mislabelling trends and rates using DNA barcoding. Fish. Res. 2017, 191, 30–35. [Google Scholar] [CrossRef]
- Di Pinto, A.; Mottola, A.; Marchetti, P.; Bottaro, M.; Terio, V.; Bozzo, G.; Bonerba, E.; Ceci, E.; Tantillo, G. Packaged frozen fishery products: Species identification, mislabeling occurrence and legislative implications. Food Chem. 2016, 194, 279–283. [Google Scholar] [CrossRef]
- Jacquet, J.L.; Pauly, D. Trade secrets: Renaming and mislabeling of seafood. Mar. Policy 2008, 32, 309–318. [Google Scholar] [CrossRef]
- European Union. European Parliament resolution of 12 May 2016 on traceability of fishery and aquaculture products in restaurants and retail (2016/2532(RSP)). Off. J. Eur. Union 2016, 63. [Google Scholar]
- Acutis, P.L.; Cambiotti, V.; Riina, M.V.; Meistro, S.; Maurella, C.; Massaro, M.; Stacchini, P.; Gili, S.; Malandra, R.; Pezzolato, M.; et al. Detection of fish species substitution frauds in Italy: A targeted National Monitoring Plan. Food Control 2019, 101, 151–155. [Google Scholar] [CrossRef]
- Civera, T. Species Identification and Safety of Fish Products. Vet. Res. Commun. 2003, 271, 481–489. [Google Scholar] [CrossRef]
- Alander, J.T.; Bochko, V.; Martinkauppi, B.; Saranwong, S.; Mantere, T. A Review of Optical Nondestructive Visual and Near-Infrared Methods for Food Quality and Safety. Int. J. Spectrosc. 2013, 2013, 341402. [Google Scholar] [CrossRef]
- Kaffka, K. How the NIR technology came to and spread in Europe for quality assessment and control in the food industry. Acta Aliment. 2008, 37, 141–145. [Google Scholar] [CrossRef]
- Pennisi, F.; Giraudo, A.; Cavallini, N.; Esposito, G.; Merlo, G.; Geobaldo, F.; Acutis, P.L.; Pezzolato, M.; Savorani, F.; Bozzetta, E. Differentiation between fresh and thawed cephalopods using nir spectroscopy and multivariate data analysis. Foods 2021, 10, 528. [Google Scholar] [CrossRef] [PubMed]
- Vincent, B.; Dardenne, P. Application of NIR in Agriculture. In Near-Infrared Spectroscopy; Springer: Singapore, 2021; pp. 331–345. [Google Scholar] [CrossRef]
- Yakubu, H.G.; Kovacs, Z.; Toth, T.; Bazar, G. The recent advances of near-infrared spectroscopy in dairy production—A review. Crit. Rev. Food Sci. Nutr. 2020, 62, 810–831. [Google Scholar] [CrossRef] [PubMed]
- Atalay, H.; Kahriman, F. Estimating Roughage Quality with Near Infrared Reflectance (NIR) Spectroscopy and Chemometric Techniques. Kocatepe Vet. J. 2020, 13, 234–240. [Google Scholar] [CrossRef]
- Balehegn, M.; Varijakshapanicker, P.; Zampaligre, N.; Blummel, M.; Ayantunde, A.; Jones, C.; Prasad, K.V.S.V.; Duncan, A.; Dejene, M.; Adesogan, A.T. Near-infrared reflectance spectroscopy for forage nutritive value analysis in sub-Saharan African countries. Agron. J. 2022, 114, 100–114. [Google Scholar] [CrossRef]
- Frempong, N.S.; Paulk, C.; Nortey, T.N.; Stark, C. Determining the Influence of Particle Size, Diets, Analytical Methods and Feed Form on the Predictability of the Near Infrared Reflectance Spectroscopy. J. Anim. Sci. Res. 2020, 4. [Google Scholar] [CrossRef]
- Biancolillo, A.; Marini, F. Chemometric methods for spectroscopy-based pharmaceutical analysis. Front. Chem. 2018, 6, 576. [Google Scholar] [CrossRef]
- Yan, H.; Siesler, H.W. Quantitative analysis of a pharmaceutical formulation: Performance comparison of different handheld near-infrared spectrometers. J. Pharm. Biomed. Anal. 2018, 160, 179–186. [Google Scholar] [CrossRef]
- Grassi, S.; Alamprese, C. Advances in NIR spectroscopy applied to process analytical technology in food industries. Curr. Opin. Food Sci. 2018, 22, 17–21. [Google Scholar] [CrossRef]
- Porep, J.U.; Kammerer, D.R.; Carle, R. On-line application of near infrared (NIR) spectroscopy in food production. Trends Food Sci. Technol. 2015, 46, 211–230. [Google Scholar] [CrossRef]
- Alamprese, C.; Casiraghi, E. Application of FT-NIR and FT-IR spectroscopy to fish fillet authentication. LWT Food Sci. Technol. 2015, 63, 720–725. [Google Scholar] [CrossRef]
- Fasolato, L.; Balzan, S.; Riovanto, R.; Berzaghi, P.; Mirisola, M.; Ferlito, J.C.; Serva, L.; Benozzo, F.; Passera, R.; Tepedino, V.; et al. Comparison of visible and near-infrared reflectance spectroscopy to authenticate fresh and frozen-thawed swordfish (Xiphias gladius L.). J. Aquat. Food Prod. Technol. 2012, 21, 493–507. [Google Scholar] [CrossRef]
- Liu, D.; Zeng, X.A.; Sun, D.W. NIR spectroscopy and imaging techniques for evaluation of fish quality—A review. J. Appl. Spectrosc. Rev. 2013, 48, 609–628. [Google Scholar] [CrossRef]
- Ottavian, M.; Fasolato, L.; Facco, P.; Barolo, M. Foodstuff authentication from spectral data: Toward a species-independent discrimination between fresh and frozen-thawed fish samples. J. Food Eng. 2013, 119, 765–775. [Google Scholar] [CrossRef]
- Kimiya, T.; Sivertsen, A.H.; Heia, K. VIS/NIR spectroscopy for non-destructive freshness assessment of Atlantic salmon (Salmo salar L.) fillets. J. Food Eng. 2013, 116, 758–764. [Google Scholar] [CrossRef]
- Ding, R.; Huang, X.; Han, F.; Dai, H.; Teye, E.; Xu, F. Rapid and nondestructive evaluation of fish freshness by near infrared reflectance spectroscopy combined with chemometrics analysis. Anal. Methods 2014, 6, 9675–9683. [Google Scholar] [CrossRef]
- Cheng, J.H.; Dai, Q.; Sun, D.W.; Zeng, X.A.; Liu, D.; Pu, H. Bin Applications of non-destructive spectroscopic techniques for fish quality and safety evaluation and inspection. Trends Food Sci. Technol. 2013, 34, 18–31. [Google Scholar] [CrossRef]
- Uddin, M.; Okazaki, E.; Turza, S.; Yumiko, Y.; Tanaka, M.; Fukuda, Y. Non-destructive Visible/NIR Spectroscopy for Differentiation of Fresh and Frozen-thawed Fish. J. Food Sci. 2005, 70, c506–c510. [Google Scholar] [CrossRef]
- Sivertsen, A.H.; Kimiya, T.; Heia, K. Automatic freshness assessment of cod (Gadus morhua) fillets by Vis/Nir spectroscopy. J. Food Eng. 2011, 103, 317–323. [Google Scholar] [CrossRef]
- Ottavian, M.; Fasolato, L.; Serva, L.; Facco, P.; Barolo, M. Data Fusion for Food Authentication: Fresh/Frozen-Thawed Discrimination in West African Goatfish (Pseudupeneus prayensis) Fillets. Food Bioprocess Technol. 2014, 7, 1025–1036. [Google Scholar] [CrossRef]
- Sannia, M.; Serva, L.; Balzan, S.; Segato, S.; Novelli, E.; Fasolato, L. Application of near-infrared spectroscopy for frozen-thawed characterization of cuttlefish (Sepia officinalis). J. Food Sci. Technol. 2019, 56, 4437–4447. [Google Scholar] [CrossRef]
- Gokoglu, N.; Topuz, O.K.; Yerlikaya, P.; Yatmaz, H.A.; Ucak, I. Effects of freezing and frozen storage on protein functionality and texture of some cephalopod muscles. J. Aquat. Food Prod. T 2018, 27, 211–218. [Google Scholar] [CrossRef]
- Qu, J.H.; Cheng, J.H.; Sun, D.W.; Pu, H.; Wang, Q.J.; Ma, J. Discrimination of shelled shrimp (Metapenaeus ensis) among fresh, frozen-thawed and cold-stored by hyperspectral imaging technique. LWT Food Sci. Technol. 2015, 62, 202–209. [Google Scholar] [CrossRef]
- Ye, R.; Chen, Y.; Guo, Y.; Duan, Q.; Li, D.; Liu, C. NIR Hyperspectral Imaging Technology Combined with Multivariate Methods to Identify Shrimp Freshness. Appl. Sci. 2020, 10, 5498. [Google Scholar] [CrossRef]
- Liu, Y.; Xu, L.; Zeng, S.; Qiao, F.; Jiang, W.; Xu, Z. Rapid detection of mussels contaminated by heavy metals using near-infrared reflectance spectroscopy and a constrained difference extreme learning machine. Spectrochim. Acta Part A Mol. Biomol. Spectrosc. 2022, 269, 120776. [Google Scholar] [CrossRef]
- Ballabio, D.; Consonni, V. Classification tools in chemistry. Part 1: Linear models. PLS-DA. Anal. Methods 2013, 5, 3790–3798. [Google Scholar] [CrossRef]
- Amigo, J.M. Data mining, machine learning, deep learning, chemometrics: Definitions, common points and trends (Spoiler Alert: VALIDATE your models!). Brazilian J. Anal. Chem. 2021, 8, 22–38. [Google Scholar] [CrossRef]
- Sun, D.-W.; Rinnan, Å.; Nørgaard, L.; van den Berg, F.; Thygesen, J.; Bro, R.; Engelsen, S.B. Data Pre-processing. In Infrared Spectroscopy for Food Quality Analysis and Control; Sun, D., Ed.; Elsevier: Amsterdam, The Netherlands, 2009; pp. 29–50. ISBN 9780123741363. [Google Scholar]
- Jolliffe, I.T. Principal Component Analysis, 2nd ed.; Springer: Cham, Switzerland, 2002; ISBN 9780387224404. [Google Scholar]
- Bro, R.; Smilde, A.K. Principal component analysis. Anal. Methods 2014, 6, 2812–2831. [Google Scholar] [CrossRef] [Green Version]
- Daszykowski, M.; Walczak, B.; Massart, D.L. Representative subset selection. Anal. Chim. Acta 2002, 468, 91–103. [Google Scholar] [CrossRef]
- Farrés, M.; Platikanov, S.; Tsakovski, S.; Tauler, R. Comparison of the variable importance in projection (VIP) and of the selectivity ratio (SR) methods for variable selection and interpretation. J. Chemom. 2015, 29, 528–536. [Google Scholar] [CrossRef]
- Grassi, S.; Casiraghi, E.; Alamprese, C. Handheld NIR device: A non-targeted approach to assess authenticity of fish fillets and patties. Food Chem. 2018, 243, 382–388. [Google Scholar] [CrossRef]


| Manufacturer | Size (cm, W × L × H) | Weight (g) | Cost ($) | Spectral Range (nm) | Spectral Range (cm–1) | |
|---|---|---|---|---|---|---|
| SCiO | Consumer Physics | 1.5 × 4 × 6.5 | <50 | <5000 | 740–1070 | 13,514–9346 |
| MicroNIR | VIAVI | 4.6 × 4.6 × 5 | 64 | ≈35,000 | 908–1676 | 11,013–5966 |
| MPA | Bruker Optics | 37.5 × 59.3 × 26.2 | 3500 | ≈150,000 | 800–2500 | 12,500–4000 |
| SCiO | MicroNIR | MPA | |||||||||||||
|---|---|---|---|---|---|---|---|---|---|---|---|---|---|---|---|
| LVs | Spec | Sens | NER | Acc | LVs | Spec | Sens | NER | Acc | LVs | Spec | Sens | NER | Acc | |
| Cal | 100 | 100 | 100 | 100 | 100 | 100 | 100 | 100 | 100 | 100 | 100 | 100 | |||
| CV | 7 | 100 | 97.1 | 98.5 | 98.5 | 11 | 94.1 | 96.9 | 95.5 | 95.4 | 11 | 91.2 | 93.5 | 92.4 | 92.3 |
| Test | 94.1 | 94.1 | 94.1 | 94.1 | 100 | 89.5 | 94.7 | 94.1 | 100 | 84.2 | 92.1 | 90.9 | |||
| SCiO | MicroNIR | MPA | |
|---|---|---|---|
| Water | 760 nm, 3rd overtone 1450 nm, 2nd overtone [22,24,44] | 1440 nm, 2nd overtone [22,24,44] | 1380–1615 nm, 2nd overtone |
| Proteins | 875–920 nm 1045–1070 nm | 1050 nm, RNH2 3rd overtone | 1010–1060 nm, RNH2 3rd overtone 1600 nm, N–H 1st and 2nd overtones + N–H and C=O combination band [24,44] |
| Aliphatic | / | 1120 nm, 1150 nm 1210 nm C–H stretching 2nd overtone [22,44] 1360 nm C–H stretching 2nd overtone | 1700–1910 nm 1st overtone C–H stretching [44] of fats [24] |
| Other | <750 nm, related to red adsorption | 1310 nm-unassigned | 1290–1350 nm-unassigned |
Publisher’s Note: MDPI stays neutral with regard to jurisdictional claims in published maps and institutional affiliations. |
© 2022 by the authors. Licensee MDPI, Basel, Switzerland. This article is an open access article distributed under the terms and conditions of the Creative Commons Attribution (CC BY) license (https://creativecommons.org/licenses/by/4.0/).
Share and Cite
Cavallini, N.; Pennisi, F.; Giraudo, A.; Pezzolato, M.; Esposito, G.; Gavoci, G.; Magnani, L.; Pianezzola, A.; Geobaldo, F.; Savorani, F.; et al. Chemometric Differentiation of Sole and Plaice Fish Fillets Using Three Near-Infrared Instruments. Foods 2022, 11, 1643. https://doi.org/10.3390/foods11111643
Cavallini N, Pennisi F, Giraudo A, Pezzolato M, Esposito G, Gavoci G, Magnani L, Pianezzola A, Geobaldo F, Savorani F, et al. Chemometric Differentiation of Sole and Plaice Fish Fillets Using Three Near-Infrared Instruments. Foods. 2022; 11(11):1643. https://doi.org/10.3390/foods11111643
Chicago/Turabian StyleCavallini, Nicola, Francesco Pennisi, Alessandro Giraudo, Marzia Pezzolato, Giovanna Esposito, Gentian Gavoci, Luca Magnani, Alberto Pianezzola, Francesco Geobaldo, Francesco Savorani, and et al. 2022. "Chemometric Differentiation of Sole and Plaice Fish Fillets Using Three Near-Infrared Instruments" Foods 11, no. 11: 1643. https://doi.org/10.3390/foods11111643
APA StyleCavallini, N., Pennisi, F., Giraudo, A., Pezzolato, M., Esposito, G., Gavoci, G., Magnani, L., Pianezzola, A., Geobaldo, F., Savorani, F., & Bozzetta, E. (2022). Chemometric Differentiation of Sole and Plaice Fish Fillets Using Three Near-Infrared Instruments. Foods, 11(11), 1643. https://doi.org/10.3390/foods11111643