
Storage Stability of Conventional and High Internal Phase Emulsions Stabilized Solely by Chickpea Aquafaba

 , and
, and
Abstract
:1. Introduction
2. Materials and Methods
2.1. Materials
2.2. Chickpea Aquafaba (CA) Production
2.3. CA Proximate Composition
2.4. Conventional Emulsions and HIPE Production
2.5. Conventional Emulsions and HIPE Characterization
2.5.1. Droplet Size
2.5.2. Optical and Fluorescence Microscopy
2.5.3. Rheological Measurements
2.5.4. Conventional Emulsions and HIPE Stability
2.6. Statistical Analyses
3. Results and Discussion
3.1. CA Proximate Composition
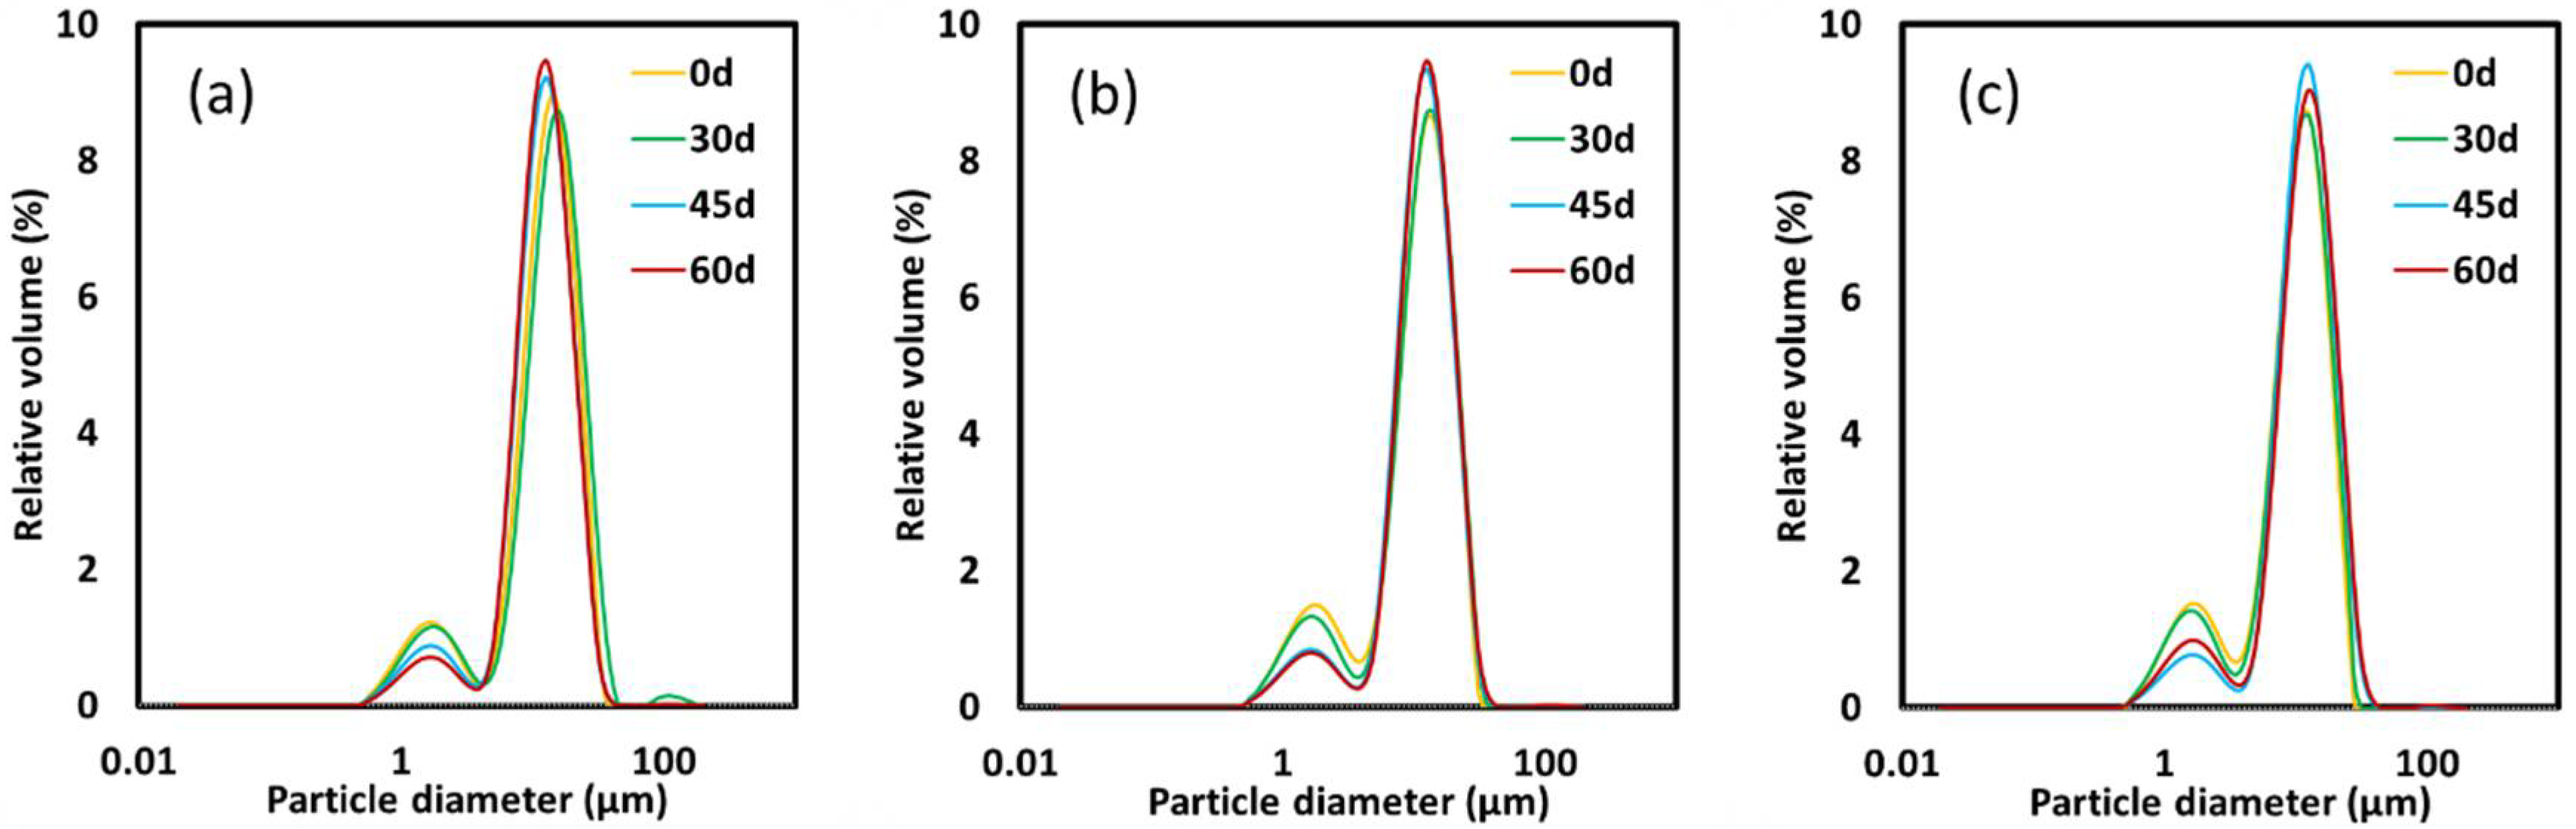
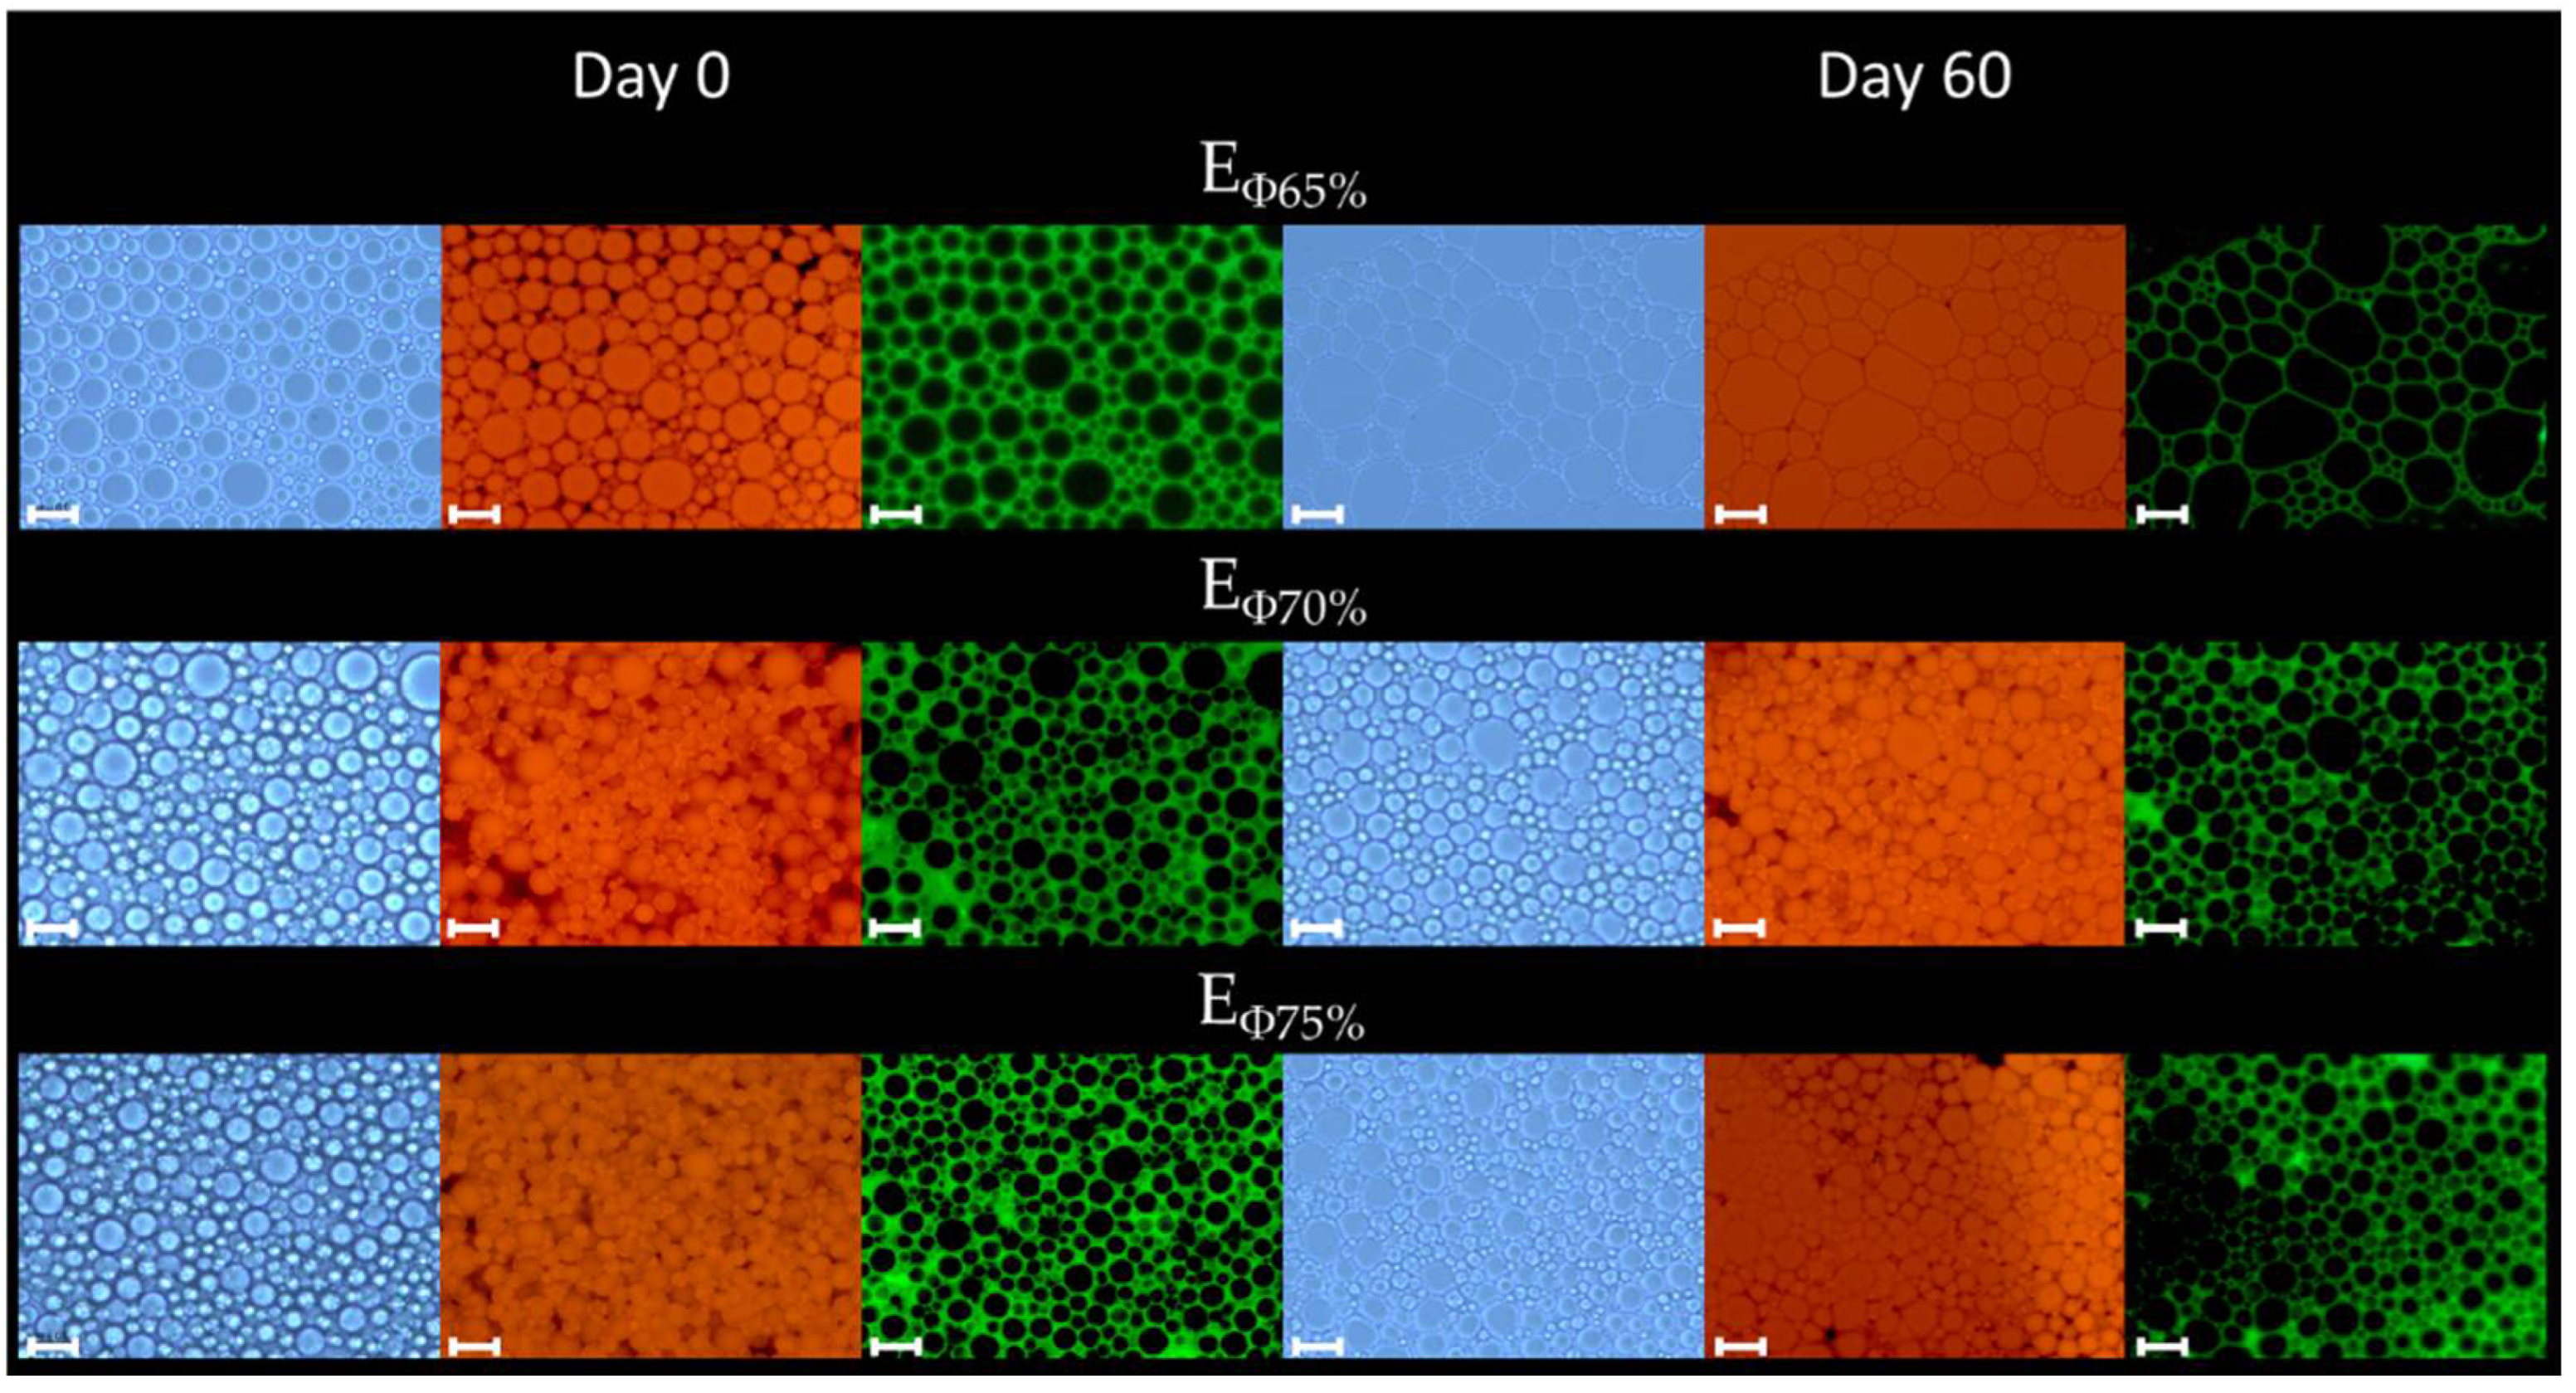
3.2. Droplet Size and Optical Microscopy
3.3. Rheological Properties
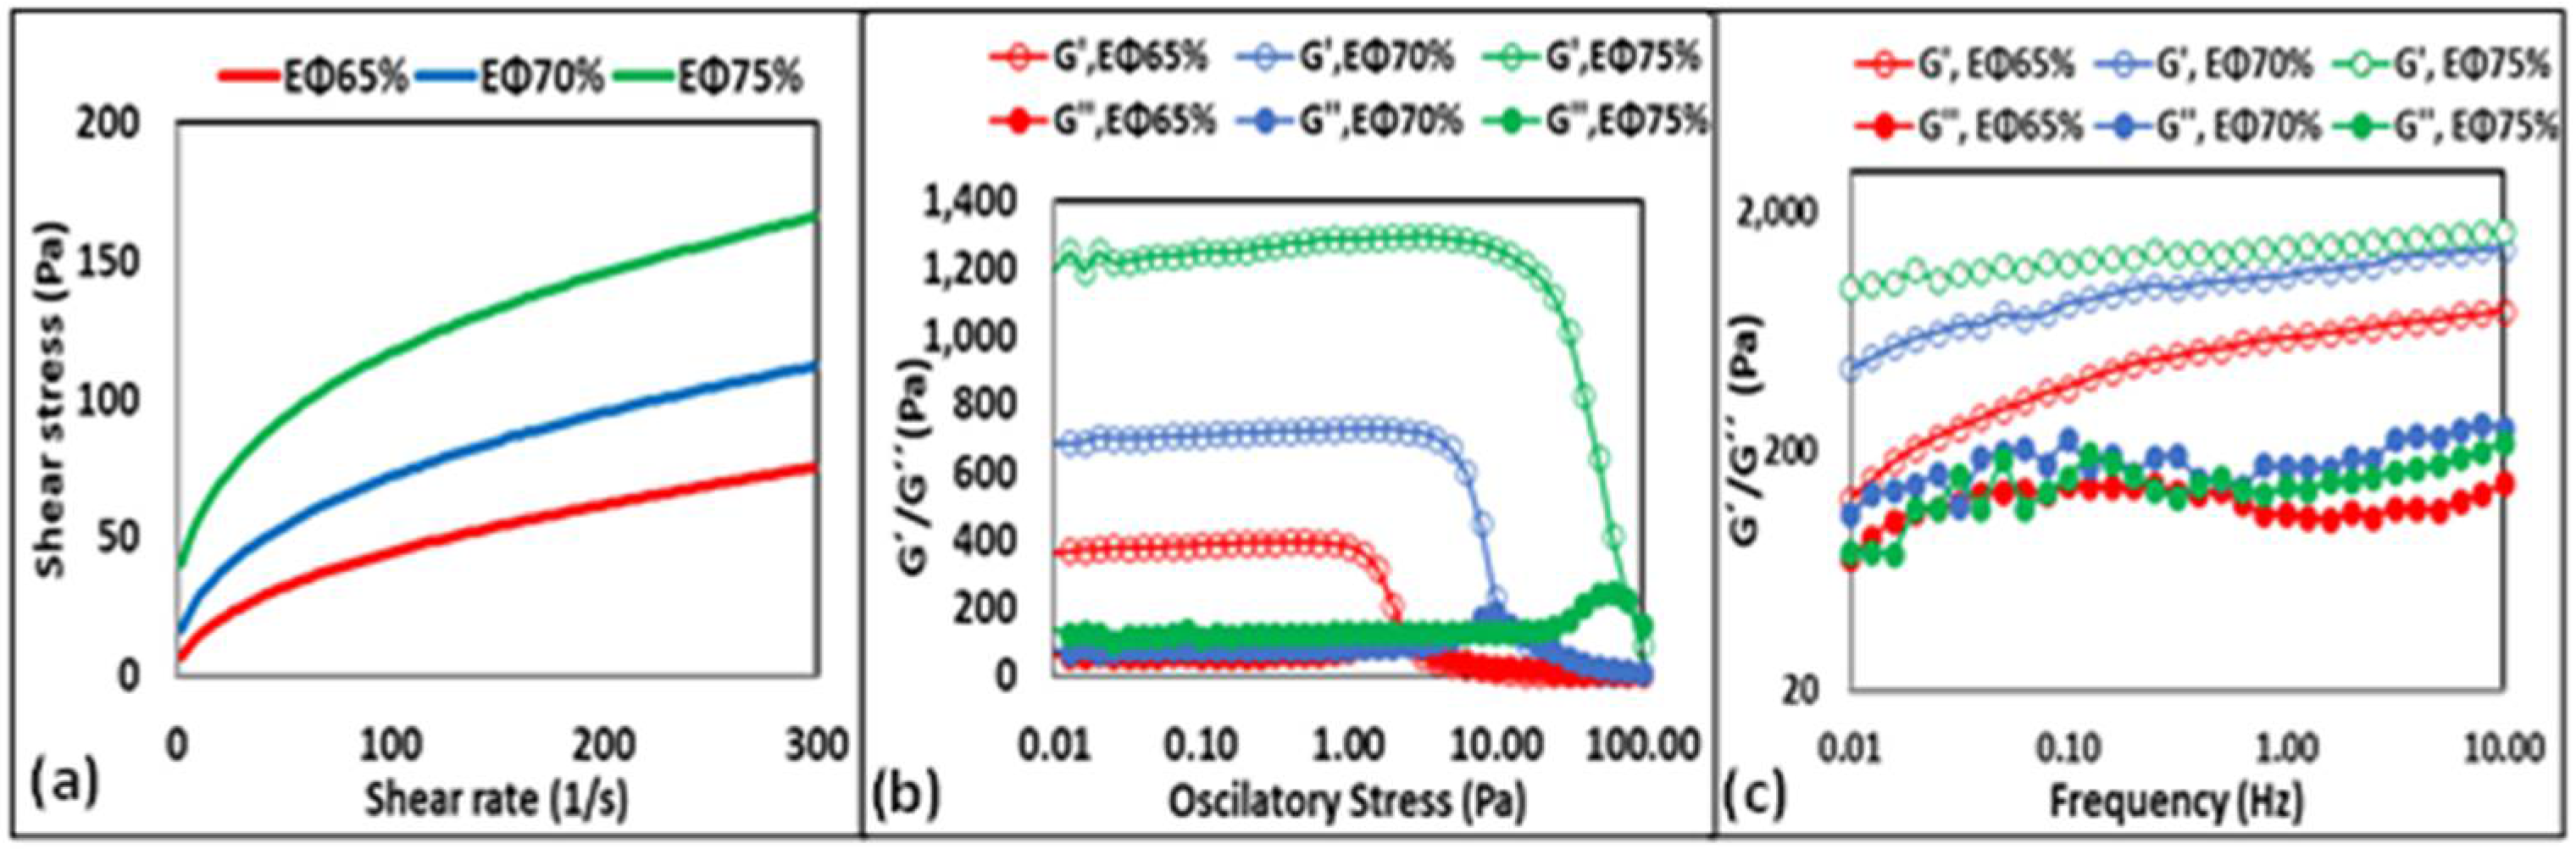
3.3.1. Steady-Shear Behavior
3.3.2. Oscillatory Shear Behavior
Amplitude Sweep
Frequency Sweep
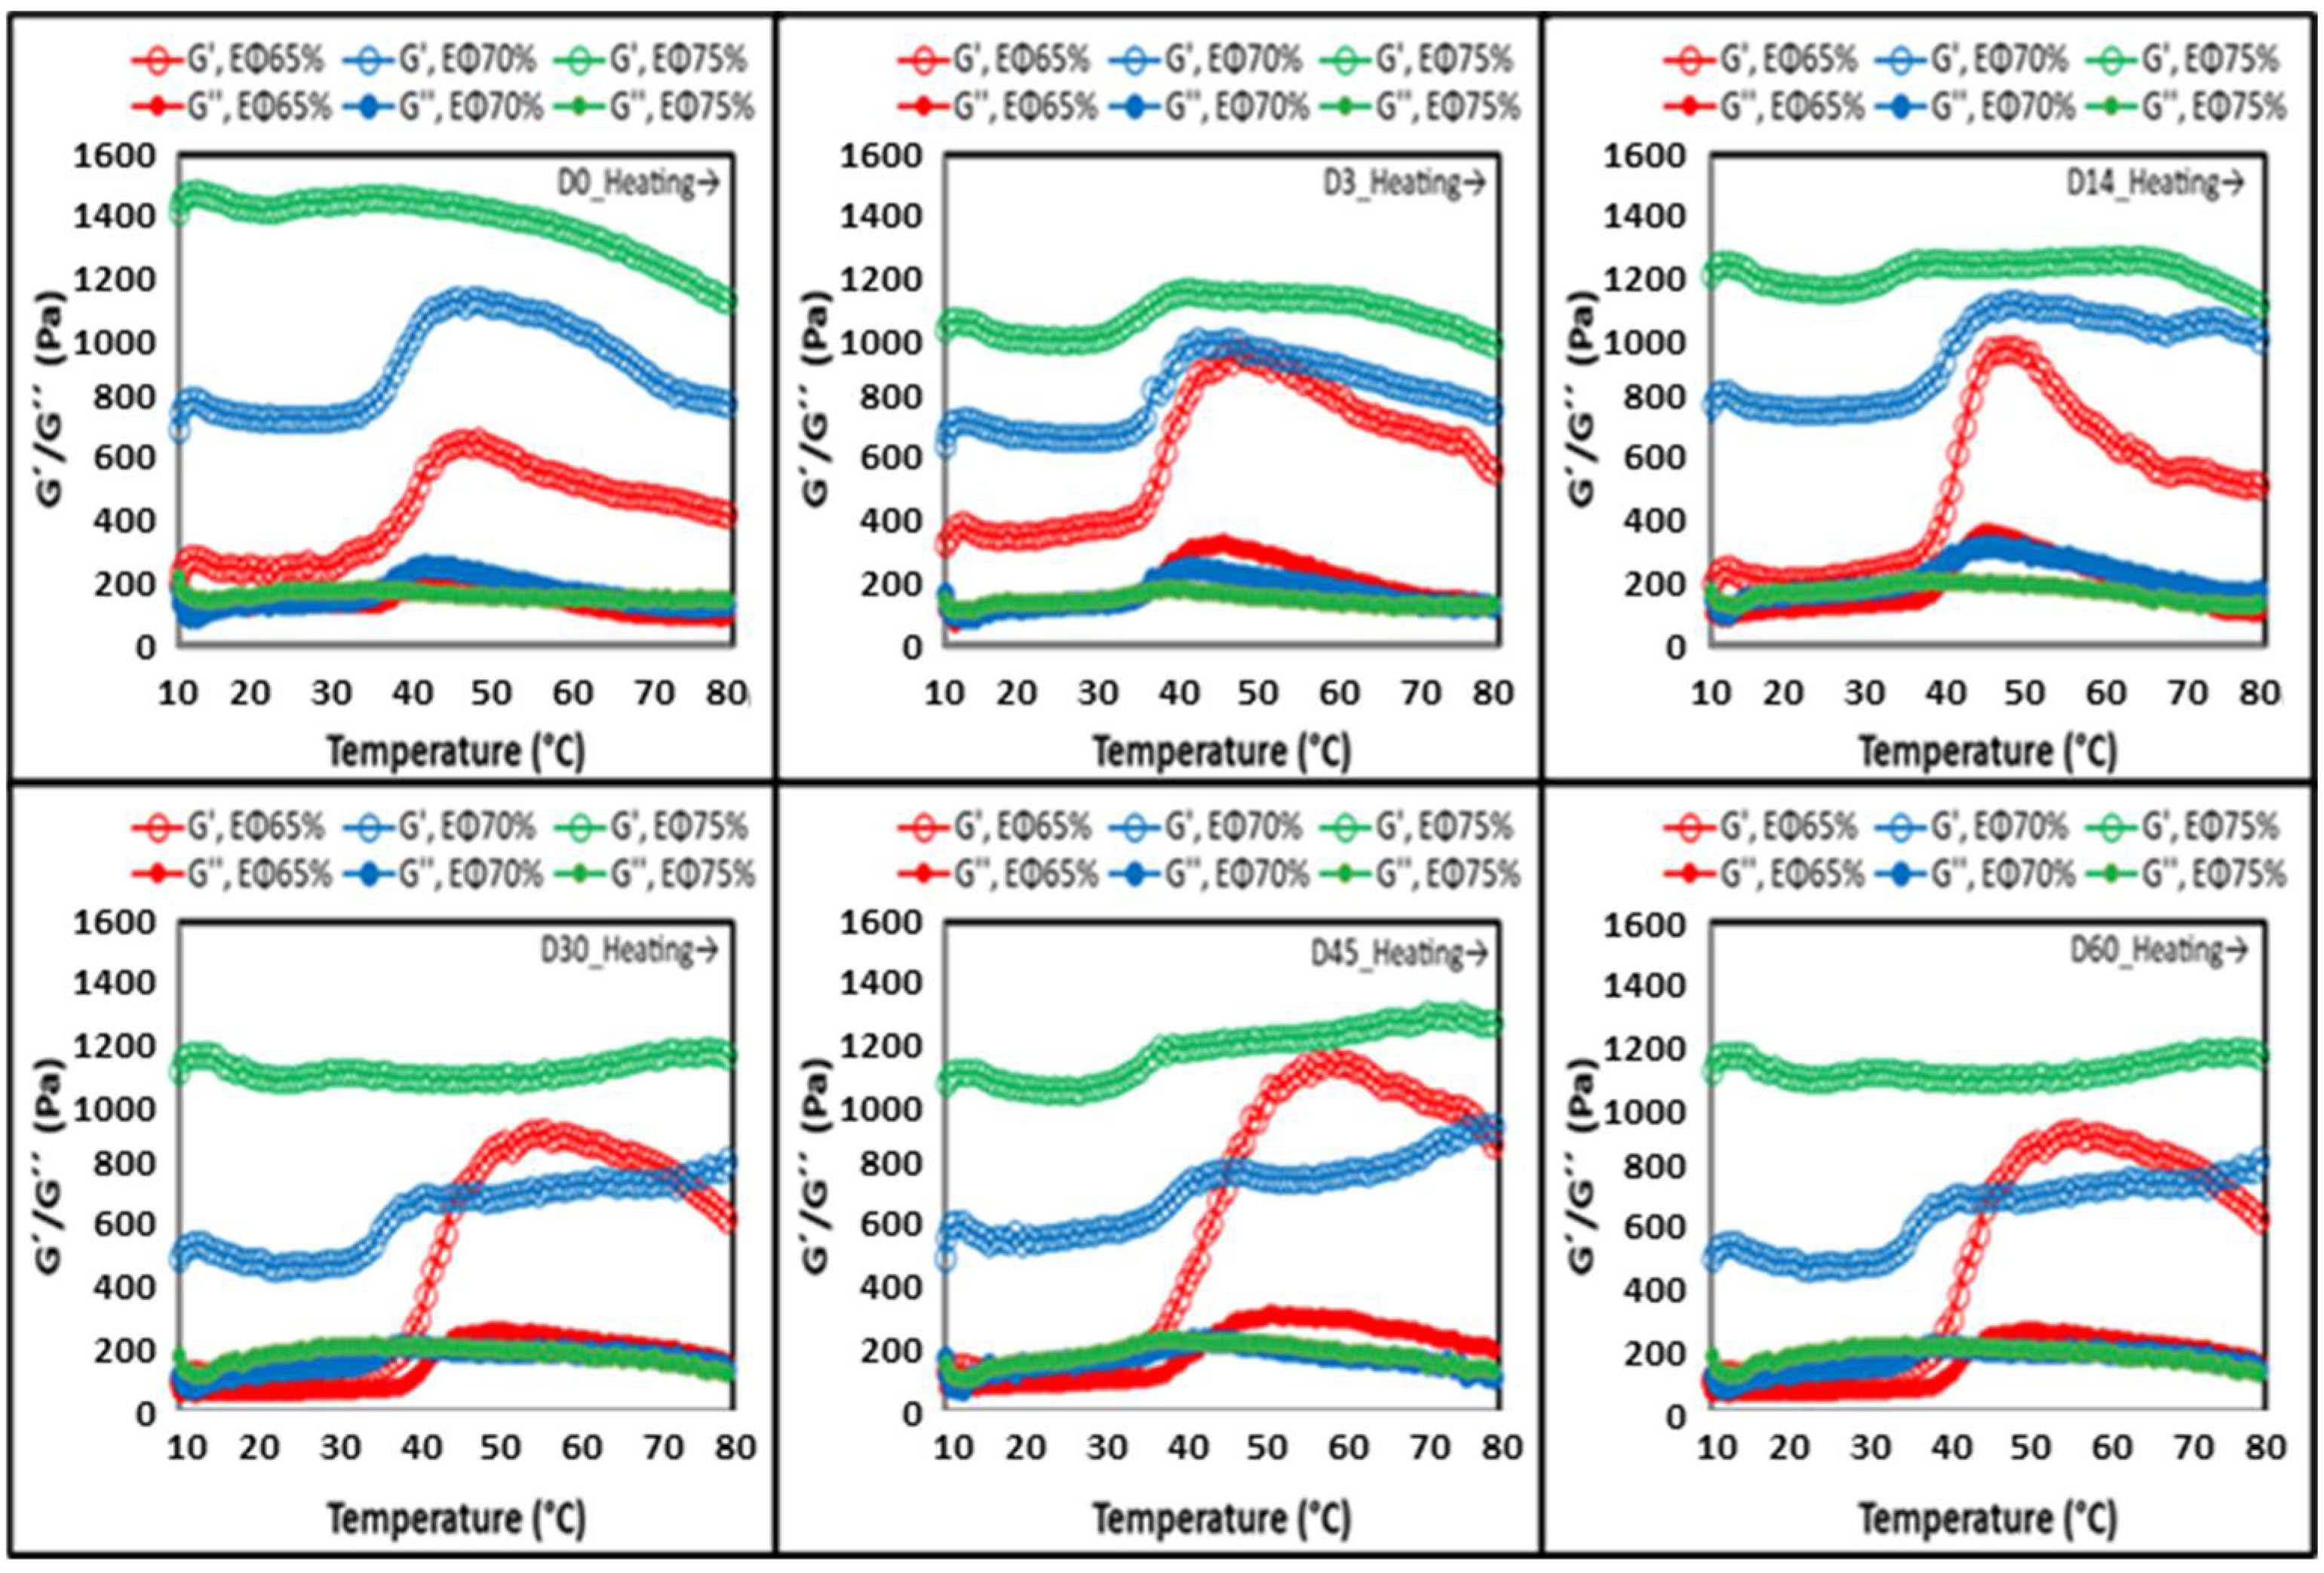
Temperature Sweep
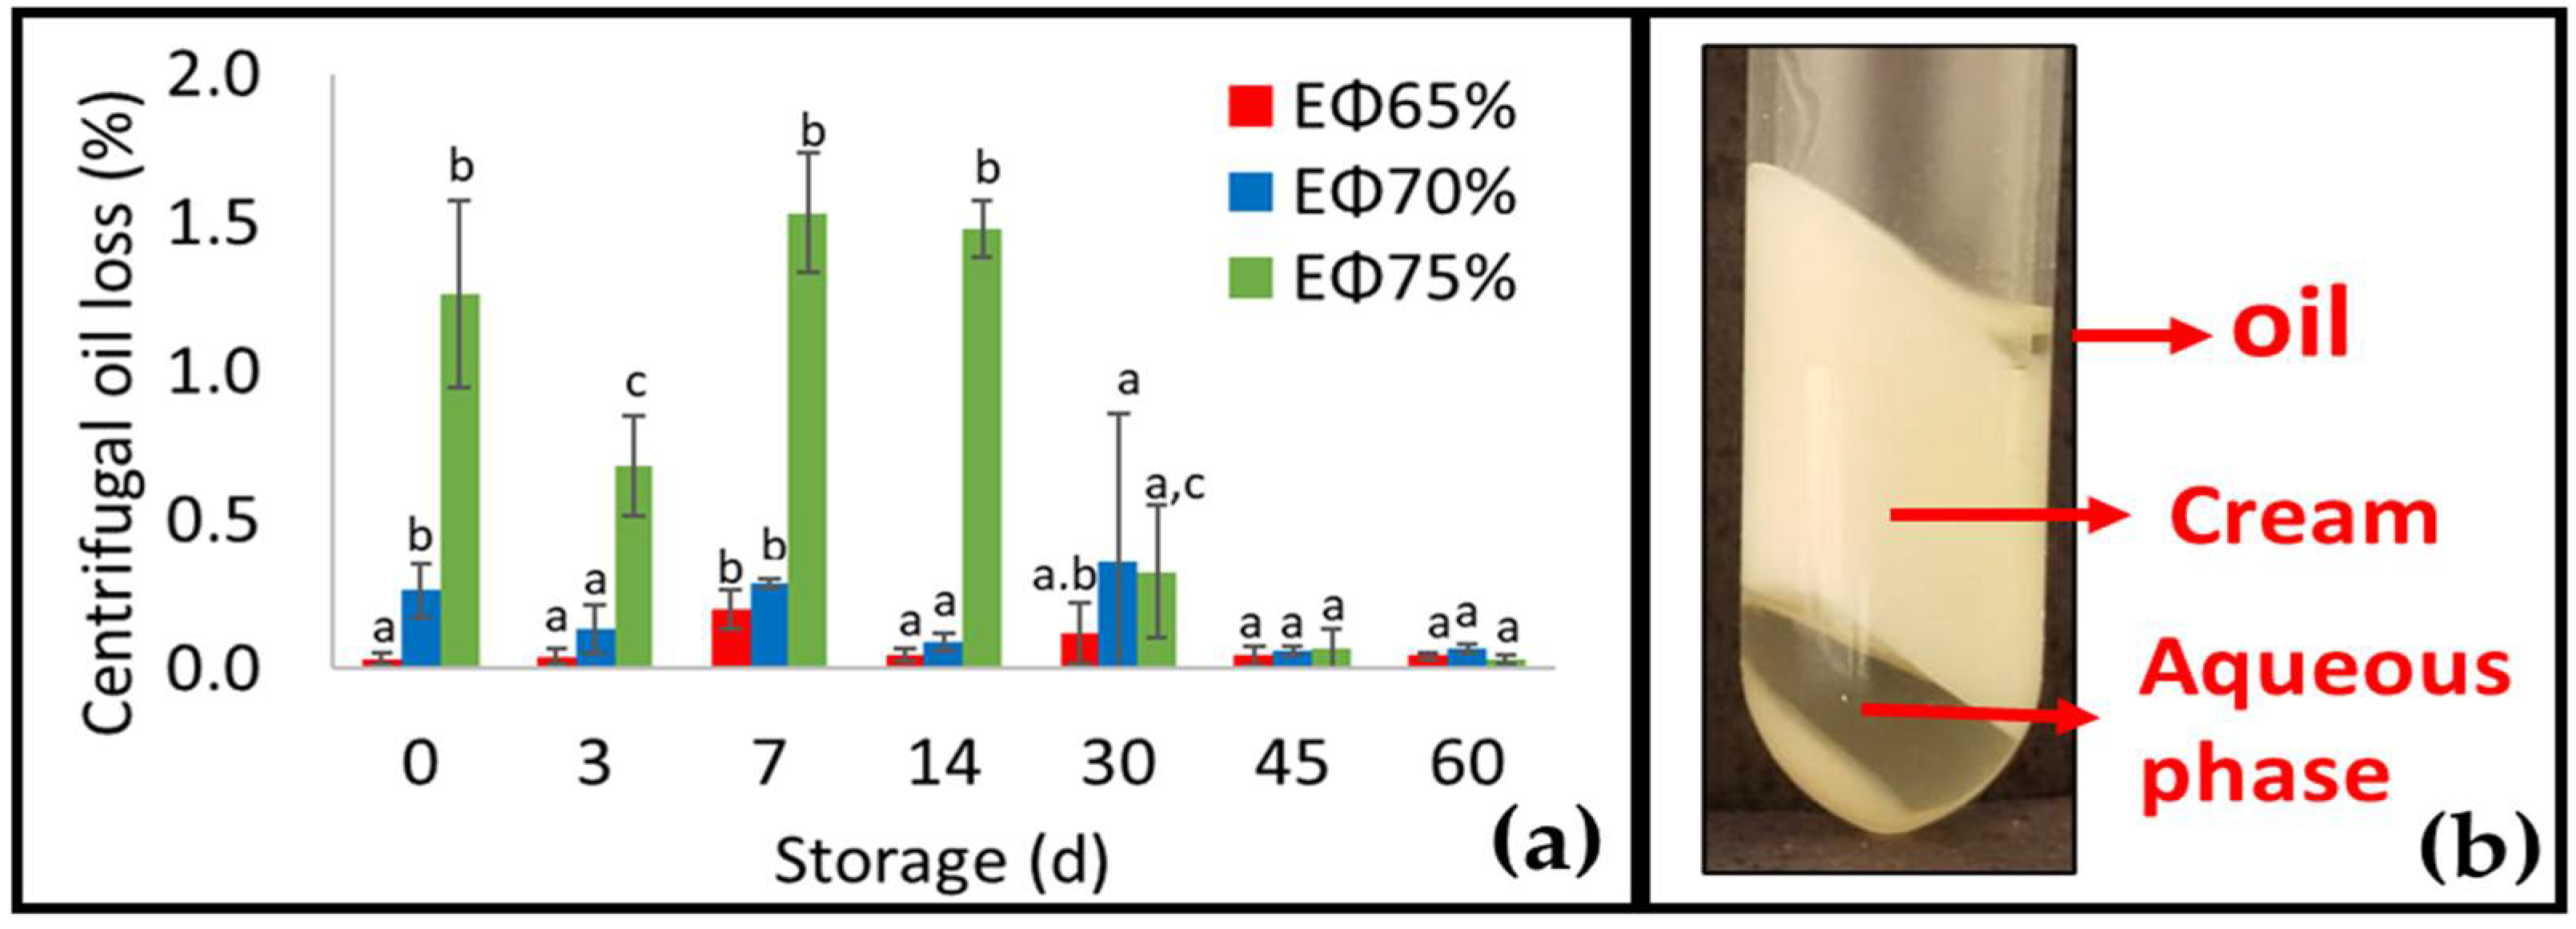
3.4. Conventional Emulsions and HIPE Stability
4. Conclusions
Author Contributions
Funding
Institutional Review Board Statement
Informed Consent Statement
Data Availability Statement
Acknowledgments
Conflicts of Interest
References
- He, Y.; Purdy, S.K.; Tse, T.J.; Taran, B.; Meda, V.; Reaney, M.J.T.; Mustafa, R. Standardization of Aquafaba Production and Application in Vegan Mayonnaise Analogs. Foods 2021, 10, 1978. [Google Scholar] [CrossRef] [PubMed]
- He, Y.; Shim, Y.Y.; Shen, J.; Kim, J.H.; Cho, J.Y.; Hong, W.S.; Meda, V.; Reaney, M.J.T. Aquafaba from Korean Soybean II: Physicochemical Properties and Composition Characterized by NMR Analysis. Foods 2021, 10, 2589. [Google Scholar] [CrossRef] [PubMed]
- Damian, J.J.; Huo, S.; Serventi, L. Phytochemical Content and Emulsifying Ability of Pulses Cooking Water. Eur. Food Res. Technol. 2018, 244, 1647–1655. [Google Scholar] [CrossRef]
- Stantiall, S.E.; Dale, K.J.; Calizo, F.S.; Serventi, L. Application of Pulses Cooking Water as Functional Ingredients: The Foaming and Gelling Abilities. Eur. Food Res. Technol. 2018, 244, 97–104. [Google Scholar] [CrossRef]
- Shim, Y.Y.; He, Y.; Kim, J.H.; Cho, J.Y.; Meda, V.; Hong, W.S.; Shin, W.-S.; Kang, S.J.; Reaney, M.J.T. Aquafaba from Korean Soybean I: A Functional Vegan Food Additive. Foods 2021, 10, 2433. [Google Scholar] [CrossRef]
- He, Y.; Shim, Y.Y.; Mustafa, R.; Meda, V.; Reaney, M.J.T. Chickpea Cultivar Selection to Produce Aquafaba with Superior Emulsion Properties. Foods 2019, 8, 685. [Google Scholar] [CrossRef] [Green Version]
- He, Y.; Meda, V.; Reaney, M.J.T.; Mustafa, R. Aquafaba, a New Plant-Based Rheological Additive for Food Applications. Trends Food Sci. Technol. 2021, 111, 27–42. [Google Scholar] [CrossRef]
- Alsalman, F.B.; Ramaswamy, H.S. Evaluation of Changes in Protein Quality of High-Pressure Treated Aqueous Aquafaba. Molecules 2021, 26, 234. [Google Scholar] [CrossRef]
- Alsalman, F.B.; Tulbek, M.; Nickerson, M.; Ramaswamy, H.S. Evaluation and Optimization of Functional and Antinutritional Properties of Aquafaba. Legume Sci. 2020, 2, e30. [Google Scholar] [CrossRef]
- Buhl, T.F.; Christensen, C.H.; Hammershøj, M. Aquafaba as an Egg White Substitute in Food Foams and Emulsions: Protein Composition and Functional Behavior. Food Hydrocoll. 2019, 96, 354–364. [Google Scholar] [CrossRef]
- Lafarga, T.; Villaró, S.; Bobo, G.; Aguiló-Aguayo, I. Optimisation of the PH and Boiling Conditions Needed to Obtain Improved Foaming and Emulsifying Properties of Chickpea Aquafaba Using a Response Surface Methodology. Int. J. Gastron. Food Sci. 2019, 18, 100177. [Google Scholar] [CrossRef]
- Huang, S.; Liu, Y.; Zhang, W.; Dale, K.J.; Liu, S.; Zhu, J.; Serventi, L. Composition of Legume Soaking Water and Emulsifying Properties in Gluten-Free Bread. Food Sci. Technol. Int. 2017, 24, 232–241. [Google Scholar] [CrossRef] [PubMed]
- Tan, C.; McClements, D.J. Application of Advanced Emulsion Technology in the Food Industry: A Review and Critical Evaluation. Foods 2021, 10, 812. [Google Scholar] [CrossRef] [PubMed]
- Xu, Y.-T.; Tang, C.-H.; Binks, B.P. High Internal Phase Emulsions Stabilized Solely by a Globular Protein Glycated to Form Soft Particles. Food Hydrocoll. 2020, 98, 105254. [Google Scholar] [CrossRef]
- Vélez-Erazo, E.M.; Bosqui, K.; Rabelo, R.S.; Kurozawa, L.E.; Hubinger, M.D. High Internal Phase Emulsions (HIPE) Using Pea Protein and Different Polysaccharides as Stabilizers. Food Hydrocoll. 2020, 105, 105775. [Google Scholar] [CrossRef]
- Zuo, Z.; Zhang, X.; Li, T.; Zhou, J.; Yang, Y.; Bian, X.; Wang, L. High Internal Phase Emulsions Stabilized Solely by Sonicated Quinoa Protein Isolate at Various PH Values and Concentrations. Food Chem. 2022, 378, 132011. [Google Scholar] [CrossRef]
- Horwitz, W. Official Method of Analysis, 13th ed.; Association of Analytical Chemists: Washington, DC, USA, 1980. [Google Scholar]
- Bligh, E.G.; Dyer, W.J. A Rapid Method of Total Lipid Extraction and Purification. Can. J. Biochem. Physiol. 1959, 37, 911–917. [Google Scholar] [CrossRef]
- Meurer, M.C.; de Souza, D.; Marczak, L.D.F. Effects of Ultrasound on Technological Properties of Chickpea Cooking Water (Aquafaba). J. Food Eng. 2020, 265, 109688. [Google Scholar] [CrossRef]
- Shim, Y.Y.; Mustafa, R.; Shen, J.; Ratanapariyanuch, K.; Reaney, M.J.T. Composition and Properties of Aquafaba: Water Recovered from Commercially Canned Chickpeas. J. Vis. Exp. 2018, 132, e56305. [Google Scholar] [CrossRef]
- Raikos, V.; Hayes, H.; Ni, H. Aquafaba from Commercially Canned Chickpeas as Potential Egg Replacer for the Development of Vegan Mayonnaise: Recipe Optimisation and Storage Stability. Int. J. Food Sci. Technol. 2020, 55, 1935–1942. [Google Scholar] [CrossRef]
- Mustafa, R.; He, Y.; Shim, Y.Y.; Reaney, M.J.T. Aquafaba, Wastewater from Chickpea Canning, Functions as an Egg Replacer in Sponge Cake. Int. J. Food Sci. Technol. 2018, 53, 2247–2255. [Google Scholar] [CrossRef]
- Raikos, V.; Juskaite, L.; Vas, F.; Hayes, H.E. Physicochemical Properties, Texture, and Probiotic Survivability of Oat-Based Yogurt Using Aquafaba as a Gelling Agent. Food Sci. Nutr. 2020, 8, 6426–6432. [Google Scholar] [CrossRef] [PubMed]
- Alajaji, S.A.; El-Adawy, T.A. Nutritional Composition of Chickpea (Cicer arietinum L.) as Affected by Microwave Cooking and Other Traditional Cooking Methods. J. Food Compos. Anal. 2006, 19, 806–812. [Google Scholar] [CrossRef]
- Guo, B.; Hu, X.; Wu, J.; Chen, R.; Dai, T.; Liu, Y.; Luo, S.; Liu, C. Soluble Starch/Whey Protein Isolate Complex-Stabilized High Internal Phase Emulsion: Interaction and Stability. Food Hydrocoll. 2021, 111, 106377. [Google Scholar] [CrossRef]
- Gomes, A.; Costa, A.L.R.; de Assis Perrechil, F.; da Cunha, R.L. Role of the Phases Composition on the Incorporation of Gallic Acid in O/W and W/O Emulsions. J. Food Eng. 2016, 168, 205–214. [Google Scholar] [CrossRef] [Green Version]
- Vélez-Erazo, E.M.; Bosqui, K.; Rabelo, R.S.; Hubinger, M.D. Effect of PH and Pea Protein: Xanthan Gum Ratio on Emulsions with High Oil Content and High Internal Phase Emulsion Formation. Molecules 2021, 26, 5646. [Google Scholar] [CrossRef]
- Hesarinejad, M.A.; Koocheki, A.; Razavi, S.M.A. Dynamic Rheological Properties of Lepidium Perfoliatum Seed Gum: Effect of Concentration, Temperature and Heating/Cooling Rate. Food Hydrocoll. 2014, 35, 583–589. [Google Scholar] [CrossRef]
- Yousefi, A.R.; Razavi, S.M.A. Dynamic Rheological Properties of Wheat Starch Gels as Affected by Chemical Modification and Concentration. Starch—Stärke 2015, 67, 567–576. [Google Scholar] [CrossRef]
- Domian, E.; Mańko-Jurkowska, D. The Effect of Homogenization and Heat Treatment on Gelation of Whey Proteins in Emulsions. J. Food Eng. 2022, 319, 110915. [Google Scholar] [CrossRef]
- Sridharan, S.; Meinders, M.B.J.; Sagis, L.M.C.; Bitter, J.H.; Nikiforidis, C. v Starch Controls Brittleness in Emulsion-Gels Stabilized by Pea Flour. Food Hydrocoll. 2022, 131, 107708. [Google Scholar] [CrossRef]
- Dos Santos Carvalho, J.D.; Rabelo, R.S.; Hubinger, M.D. Thermo-Rheological Properties of Chitosan Hydrogels with Hydroxypropyl Methylcellulose and Methylcellulose. Int. J. Biol. Macromol. 2022, 209, 367–375. [Google Scholar] [CrossRef] [PubMed]
- Wijaya, W.; van der Meeren, P.; Wijaya, C.H.; Patel, A.R. High Internal Phase Emulsions Stabilized Solely by Whey Protein Isolate-Low Methoxyl Pectin Complexes: Effect of PH and Polymer Concentration. Food Funct. 2017, 8, 584–594. [Google Scholar] [CrossRef] [PubMed]
- Zhou, F.-Z.; Huang, X.-N.; Wu, Z.; Yin, S.-W.; Zhu, J.; Tang, C.-H.; Yang, X.-Q. Fabrication of Zein/Pectin Hybrid Particle-Stabilized Pickering High Internal Phase Emulsions with Robust and Ordered Interface Architecture. J. Agric. Food Chem. 2018, 66, 11113–11123. [Google Scholar] [CrossRef] [PubMed]


| D[4,3] (µm) | D[3,2] (µm) | |||||
|---|---|---|---|---|---|---|
| Day | EΦ65% | EΦ70% | EΦ75% | EΦ65% | EΦ70% | EΦ75% |
| 0 | 14.1 ± 0.1 aA | 12.3 ± 0.3 aB | 11.0 ± 0.2 aC | 6.5 ± 0.1 aA | 5.9 ± 0.1 abB | 5.5 ± 0.0 bC |
| 3 | 15.3 ± 0.5 bcA | 12.5 ± 0.2 abB | 11.4 ± 0.1 abC | 7.0 ± 0.2 bA | 6.0 ± 0.1 bcB | 5.4 ± 0.0 abC |
| 7 | 14.4 ± 0.8 abA | 12.8 ± 0.6 abB | 11.4 ± 0.2 abC | 6.3 ± 0.4 aA | 5.9 ± 0.4 abB | 5.4 ± 0.1 abC |
| 30 | 15.9 ± 1.3 cA | 12.9 ± 0.6 bB | 11.5 ± 0.2 bC | 7.0 ± 0.2 bA | 6.2 ± 0.2 cB | 5.7 ± 0.1 bC |
| 45 | 14.6 ± 0.4 abA | 12.5 ± 0.4 abB | 11.5 ± 0.3 abC | 6.6 ± 0.2 acA | 5.7 ± 0.1 aB | 5.4 ± 0.0 aC |
| 60 | 14.8 ± 0.6 abA | 13.0 ± 0.3 bB | 12.8 ± 0.8 cB | 6.9 ± 0.1 bcA | 5.9 ± 0.1 abB | 5.7 ± 0.1 cC |
| Experimental Parameters | ||||||
|---|---|---|---|---|---|---|
| Storage (d) | k (Pa·sn) | n | η5 (Pa·s) | η300 (Pa·s) | σ0 (Pa) | |
| EΦ65% | ||||||
 | 0 | 4.75 ± 0.15 ab | 0.48 ± 0.01 abc | 1.83 ± 0.03 ab | 0.25 ± 0.00 a | 6.54 ± 0.26 a |
| 3 | 5.81 ± 0.21 a | 0.47 ± 0.00 c | 2.27 ± 0.15 ab | 0.28 ± 0.01 ab | 8.47 ± 0.68 a | |
| 7 | 5.84 ± 0.52 a | 0.47 ± 0.01 ac | 2.34 ± 0.27 b | 0.29 ± 0.02 b | 8.50 ± 0.96 a | |
| 14 | 5.19 ± 0.62 ab | 0.48 ± 0.01 abc | 2.14 ± 0.25 ab | 0.27 ± 0.01 a b | 7.86 ± 0.92 a | |
| 30 | 4.75 ± 0.60 ab | 0.49 ± 0.01 ab | 1.94 ± 0.22 b | 0.26 ± 0.01 ab | 7.03 ± 1.15 a | |
| 45 | 4.80 ± 0.24 ab | 0.49 ± 0.00 ab | 1.95 ± 0.15 ab | 0.27 ± 0.01 ab | 7.17 ± 0.73 a | |
| 60 | 4.40 ± 0.04 b | 0.50 ± 0.00 b | 1.80 ± 0.06 a | 0.26 ± 0.00 ab | 6.41 ± 0.28 a | |
| EΦ70% | ||||||
 | 0 | 10.86 ± 0.65 a | 0.41 ± 0.00 ab | 4.02 ± 0.24 a | 0.37 ± 0.02 a | 16.47 ± 1.17 a |
| 3 | 13.12 ± 0.26 cd | 0.40 ± 0.00 ac | 4.82 ± 0.36 a | 0.43 ± 0.02 b | 20.25 ± 1.04 bc | |
| 7 | 13.49 ± 0.44 d | 0.39 ± 0.00 c | 4.83 ± 0.43 a | 0.43 ± 0.02 b | 20.44 ± 1.00 c | |
| 14 | 11.95 ± 0.66 abcd | 0.40 ± 0.00 abc | 4.47 ± 0.39 a | 0.40 ± 0.01 ab | 18.55 ± 1.58 abc | |
| 30 | 10.94 ± 0.71 ab | 0.41 ± 0.00 b | 4.13 ± 0.31 a | 0.39 ± 0.02 ab | 16.65 ± 1.47 ab | |
| 45 | 12.63 ± 1.00 bcd | 0.41 ± 0.00 abc | 4.62 ± 0.49 a | 0.43 ± 0.02 b | 18.59 ± 2.06 abc | |
| 60 | 11.74 ± 0.24 abc | 0.41 ± 0.01 ab | 4.16 ± 0.21 a | 0.41 ± 0.01 ab | 16.67 ± 0.48 ab | |
| EΦ75% | ||||||
 | 0 | 26.69 ± 2.93 a | 0.32 ± 0.01 abc | 8.96 ± 0.86 a | 0.55 ± 0.06 a | 40.67 ± 4.33 a |
| 3 | 33.93 ± 3.09 ab | 0.31 ± 0.00 a | 11.31 ± 1.30 a | 0.65 ± 0.07 ab | 50.55 ± 5.73 ab | |
| 7 | 31.28 ± 3.19 ab | 0.31 ± 0.01 abc | 10.07 ± 1.20 a | 0.63 ± 0.03 ab | 46.28 ± 4.77 ab | |
| 14 | 35.74 ± 3.98 b | 0.31 ± 0.01 ab | 11.27 ± 1.22 a | 0.69 ± 0.04 b | 53.37 ± 5.72 b | |
| 30 | 28.54 ± 1.10 ab | 0.32 ± 0.01 abc | 9.42 ± 0.23 a | 0.61 ± 0.04 ab | 42.90 ± 1.20 ab | |
| 45 | 31.02 ± 1.92 ab | 0.32 ± 0.00 bc | 10.37 ± 0.61 a | 0.66 ± 0.02 ab | 44.55 ± 2.67 ab | |
| 60 | 30.45 ± 1.41 ab | 0.33 ± 0.01 c | 9.88 ± 0.51 a | 0.66 ± 0.01 ab | 42.45 ± 2.22 ab | |
| Sample | Storage (d) | G′LVR (Pa) | G″LVR(Pa) | OSL(Pa) | tanδLVR | FPOS(Pa) | FPG(Pa) |
|---|---|---|---|---|---|---|---|
| 0 | 380.94 ± 37.04 ac | 58.70 ± 5.42 ab | 1.26 ± 0.00 a | 0.15 ± 0.00 a | 2.64 ± 0.34 cd | 105.27 ± 34.63 a | |
| 3 | 426.55 ± 43.31 a | 72.01 ± 7.90 bc | 1.26 ± 0.00 a | 0.17 ± 0.02 a | 4.03 ± 0.65 e | 74.56 ± 21.71 a | |
| 7 | 452.70 ± 8.89 a | 72.63 ± 1.66 bc | 1.26 ± 0.00 a | 0.16 ± 0.00 a | 2.84 ± 0.00 d | 107.11 ± 28.33 a | |
| EΦ65% | 14 | 415.05 ± 50.79 ac | 81.13 ± 7.37 c | 1.00 ± 0.00 e | 0.20 ± 0.02 ab | 2.45 ± 0.34 bcd | 115.47 ± 26.41 a |
| 30 | 318.57 ± 47.74 bc | 59.10 ± 10.2 ab | 0.74 ± 0.09 d | 0.19 ± 0.02 ab | 1.61 ± 0.26 ab | 79.37 ± 35.80 a | |
| 45 | 243.02 ± 34.13 b | 53.62 ± 1.02 a | 0.63 ± 0.00 c | 0.22 ± 0.03 b | 1.32 ± 0.17 a | 81.25 ± 8.28 a | |
| 60 | 215.58 ± 30.05 b | 47.46 ± 5.58 a | 0.50 ± 0.00 b | 0.22 ± 0.01 b | 1.79 ± 0.00 abc | 58.21 ± 5.13 a | |
| 0 | 695.53 ± 39.37 a | 76.11 ± 3.66 b | 5.01 ± 0.00 e | 0.11 ± 0.00 a | 10.52 ± 1.34 bc | 181.60 ± 17.44 ab | |
| 3 | 742.63 ± 27.58 a | 84.90 ± 2.52 ab | 5.01 ± 0.00 e | 0.11 ± 0.00 ab | 12.27 ± 1.69 c | 147.08 ± 7.24 a | |
| 7 | 753.74 ± 50.41 a | 97.10 ± 12.31 a | 3.98 ± 0.00 d | 0.13 ± 0.01 bc | 8.36 ± 1.07 abc | 203.23 ± 12.49 ab | |
| EΦ70% | 14 | 764.28 ± 42.70 a | 99.46 ± 4.70 a | 3.71 ± 0.47 cd | 0.13 ± 0.00 cd | 6.56 ± 2.74 ab | 227.96 ± 34.67 b |
| 30 | 749.47 ± 26.23 a | 91.81 ± 3.21 ab | 3.16 ± 0.00 bc | 0.12 ± 0.00 abc | 7.13 ± 0.00 ab | 241.78 ± 43.84 b | |
| 45 | 661.30 ± 38.73 a | 95.45 ± 5.11 a | 2.73 ± 0.38 ab | 0.14 ± 0.00 d | 5.49 ± 0.92 a | 205.81 ± 29.12 ab | |
| 60 | 532.30 ± 38.38 b | 89.48 ± 4.75 ab | 2.03 ± 0.46 a | 0.17 ± 0.01 e | 5.27 ± 0.67 a | 144.58 ± 13.76 a | |
| 0 | 1377.74 ± 69.46 c | 120.09 ± 25.22 a | 19.95 ± 0.00 d | 0.10 ± 0.01 a | 65.56 ± 27.44 b | 318.96 ± 39.47 a | |
| 3 | 1142.70 ± 21.02 a | 114.06 ± 2.20 a | 15.85 ± 0.00 c | 0.10 ± 0.00 a | 41.88 ± 5.34 ab | 241.61 ± 44.11 ab | |
| 7 | 1087.21 ± 27.81 a | 103.38 ± 6.76 a | 12.59 ± 0.00 b | 0.09 ± 0.01 a | 34.35 ± 2.36 a | 257.43 ± 17.40 ab | |
| EΦ75% | 14 | 1190.30 ± 71.31 a | 117.95 ± 10.63 a | 12.59 ± 0.00 b | 0.10 ± 0.00 a | 35.72 ± 0.00 ab | 279.65 ± 54.68 ab |
| 30 | 1073.52 ± 37.48 a | 101.29 ± 4.07 a | 7.94 ± 0.00 a | 0.09 ± 0.00 a | 41.88 ± 5.34 ab | 170.20 ± 13.41 b | |
| 45 | 1157.35 ± 68.12 a | 114.39 ± 1.69 a | 7.94 ± 0.00 a | 0.10 ± 0.00 a | 25.45 ± 2.92 a | 293.23 ± 61.55 a | |
| 60 | 928.37 ± 41.38 b | 105.39 ± 6.47 a | 7.40 ± 0.94 a | 0.11 ± 0.01 a | 20.99 ± 2.68 a | 247.10 ± 44.41 ab |
| Experimental Parameters | |||||||
|---|---|---|---|---|---|---|---|
| Samples | Storage (d) | k′ (Pa·sn) | n′ | R2 | G′ (Pa) | G″ (Pa) | tanδ |
| 0 | 394 ± 32 ab | 0.18 ± 0.02 a | 0.96 | 599 ± 54 a | 109 ± 12 abc | 0.18 ± 0.01 a | |
| 3 | 461 ± 4 abc | 0.22 ± 0.05 a | 0.97 | 718 ± 11 a | 134 ± 8 c | 0.19 ± 0.01 a | |
| 7 | 489 ± 27 c | 0.18 ± 0.03 a | 0.96 | 723 ± 53 a | 119 ± 6 bc | 0.16 ± 0.00 a | |
| EΦ65% | 14 | 487 ± 30 bc | 0.19 ± 0.02 a | 0.97 | 654 ± 89 a | 130 ± 13 c | 0.20 ± 0.04 a |
| 30 | 367 ± 46 a | 0.17 ± 0.01 a | 0.96 | 546 ± 55 ab | 96 ± 11 ab | 0.18 ± 0.02 a | |
| 45 | 273 ± 36 d | 0.19 ± 0.02 a | 0.96 | 425 ± 36 b | 92 ± 14 ab | 0.22 ± 0.05 a | |
| 60 | 266 ± 31 d | 0.19 ± 0.02 a | 0.96 | 408 ± 49 b | 79 ± 13 a | 0.19 ± 0.03 a | |
| 0 | 846 ± 58 ab | 0.14 ± 0.02 ab | 0.98 | 1097 ± 42 a | 172 ± 12 a | 0.16 ± 0.01 ab | |
| 3 | 914 ± 20 b | 0.17 ± 0.01 b | 0.99 | 1396 ± 163 c | 250 ± 40 b | 0.18 ± 0.03 b | |
| 7 | 810 ± 56 ab | 0.13 ± 0.02 ab | 0.95 | 1069 ± 37 ab | 145 ± 27 a | 0.14 ± 0.02 ab | |
| EΦ70% | 14 | 828 ± 53 ab | 0.14 ± 0.02 ab | 0.97 | 1105 ± 109 a | 174 ± 36 a | 0.16 ± 0.02 ab |
| 30 | 731 ± 40 ac | 0.12 ± 0.00 a | 0.96 | 972 ± 43 ab | 115 ± 6 a | 0.12 ± 0.01 a a | |
| 45 | 709 ± 71 ac | 0.14 ± 0.01 ab | 0.97 | 968 ± 79 ab | 151 ± 18 a | 0.16 ± 0.01 ab | |
| 60 | 617 ± 22 c | 0.15 ± 0.01 ab | 0.97 | 845 ± 38 b | 130 ± 8 a | 0.15 ± 0.00 ab | |
| 0 | 1252 ± 97 a | 0.07 ± 0.01 a | 0.97 | 1357 ± 51 a | 120 ± 29 a | 0.09 ± 0.02 ab | |
| 3 | 1244 ± 18 a | 0.08 ± 0.00 a | 0.91 | 1447 ± 17 ab | 122 ± 5 a | 0.08 ± 0.00 a | |
| 7 | 1207 ± 98 a | 0.09 ± 0.02 ab | 0.96 | 1419 ± 80 ab | 165 ± 36 ab | 0.12 ± 0.03 abc | |
| EΦ75% | 14 | 1326 ± 43 a | 0.09 ± 0.00 ab | 0.96 | 1502 ± 162 ab | 182 ± 46 ab | 0.12 ± 0.02 abc |
| 30 | 1128 ± 82 a | 0.08 ± 0.01 a | 0.97 | 1342 ± 87 a | 124 ± 19 a | 0.09 ± 0.01 abc | |
| 45 | 1183 ± 26 a | 0.11 ± 0.01 b | 0.98 | 1698 ± 224 b | 226 ± 19 b | 0.13 ± 0.01 bc | |
| 60 | 1122 ± 76 a | 0.11 ± 0.01 b | 0.96 | 1375 ± 89 ab | 187 ± 28 ab | 0.14 ± 0.01 c | |
Publisher’s Note: MDPI stays neutral with regard to jurisdictional claims in published maps and institutional affiliations. |
© 2022 by the authors. Licensee MDPI, Basel, Switzerland. This article is an open access article distributed under the terms and conditions of the Creative Commons Attribution (CC BY) license (https://creativecommons.org/licenses/by/4.0/).
Share and Cite
Grossi Bovi Karatay, G.; Medeiros Theóphilo Galvão, A.M.; Dupas Hubinger, M. Storage Stability of Conventional and High Internal Phase Emulsions Stabilized Solely by Chickpea Aquafaba. Foods 2022, 11, 1588. https://doi.org/10.3390/foods11111588
Grossi Bovi Karatay G, Medeiros Theóphilo Galvão AM, Dupas Hubinger M. Storage Stability of Conventional and High Internal Phase Emulsions Stabilized Solely by Chickpea Aquafaba. Foods. 2022; 11(11):1588. https://doi.org/10.3390/foods11111588
Chicago/Turabian StyleGrossi Bovi Karatay, Graziele, Andrêssa Maria Medeiros Theóphilo Galvão, and Miriam Dupas Hubinger. 2022. "Storage Stability of Conventional and High Internal Phase Emulsions Stabilized Solely by Chickpea Aquafaba" Foods 11, no. 11: 1588. https://doi.org/10.3390/foods11111588
APA StyleGrossi Bovi Karatay, G., Medeiros Theóphilo Galvão, A. M., & Dupas Hubinger, M. (2022). Storage Stability of Conventional and High Internal Phase Emulsions Stabilized Solely by Chickpea Aquafaba. Foods, 11(11), 1588. https://doi.org/10.3390/foods11111588