
Analysis of Volatile Compounds in Coffee Prepared by Various Brewing and Roasting Methods


Abstract
1. Introduction
2. Materials and Methods
2.1. Chemical Reagents and Materials
2.2. Sample Preparation
2.3. Analysis of Volatile Compounds
2.4. Statistical Analysis
3. Results
3.1. Analysis of Volatile Compounds in Coffee
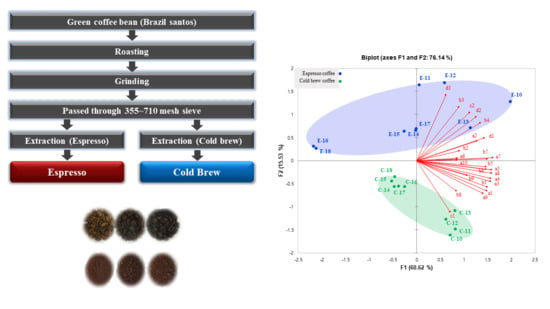
3.2. Principal Component Analysis (PCA) for Volatile Compounds in a Coffee Model System
4. Discussion
Author Contributions
Funding
Acknowledgments
Conflicts of Interest
References
- Simões, J.; Maricato, É.; Nunes, F.M.; Domingues, M.R.; Coimbra, M.A. Thermal stability of spent coffee ground polysaccharides: Galactomannans and arabinogalactans. Carbohydr. Polym. 2014, 101, 256–264. [Google Scholar] [CrossRef]
- Albouchi, A.; Murkovic, M. Formation kinetics of furfuryl alcohol in a coffee model system. Food Chem. 2018, 243, 91–95. [Google Scholar] [CrossRef] [PubMed]
- Moon, J.-K.; Shibamoto, T. Role of Roasting Conditions in the Profile of Volatile Flavor Chemicals Formed from Coffee Beans. J. Agric. Food Chem. 2009, 57, 5823–5831. [Google Scholar] [CrossRef]
- Herawati, D.; Giriwono, P.E.; Dewi, F.N.A.; Kashiwagi, T.; Andarwulan, N. Critical roasting level determines bioactive content and antioxidant activity of Robusta coffee beans. Food Sci. Biotechnol. 2019, 28, 7–14. [Google Scholar] [CrossRef]
- Seok, Y.-J.; Lee, K.-G. Analysis of furan in semi-solid and paste type foods. Food Sci. Biotechnol. 2020, 29, 293–301. [Google Scholar] [CrossRef] [PubMed]
- Lee, S.J.; Kim, M.K.; Lee, K.-G. Effect of reversed coffee grinding and roasting process on physicochemical properties including volatile compound profiles. Innov. Food Sci. Emerg. Technol. 2017, 44, 97–102. [Google Scholar] [CrossRef]
- Severini, C.; Derossi, A.; Ricci, I.; Fiore, A.G.; Caporizzi, R. How Much Caffeine in Coffee Cup? Effects of Processing Operations, Extraction Methods and Variables; Intechopen: London, UK, 2017; Volume 69002, pp. 45–85. [Google Scholar]
- Park, S.-H.; Jo, A.; Lee, K.-G. Effect of various roasting, extraction and drinking conditions on furan and 5-hydroxymethylfurfural levels in coffee. Food Chem. 2021, 358, 129806. [Google Scholar] [CrossRef]
- Kwon, J.; Ahn, H.; Lee, K.-G. Analysis of α-dicarbonyl compounds in coffee (Coffea arabica) prepared under various roasting and brewing methods. Food Chem. 2021, 343, 128525. [Google Scholar] [CrossRef]
- Cameron, M.I.; Morisco, D.; Hofstetter, D.; Uman, E.; Wilkinson, J.; Kennedy, Z.; Fontenot, S.A.; Lee, W.; Hendon, C.H.; Foster, J.M. Systematically Improving Espresso: Insights from Mathematical Modeling and Experiment. Matter 2020, 2, 631–648. [Google Scholar] [CrossRef]
- Severini, C.; Ricci, I.; Marone, M.; DeRossi, A.; De Pilli, T. Changes in the Aromatic Profile of Espresso Coffee as a Function of the Grinding Grade and Extraction Time: A Study by the Electronic Nose System. J. Agric. Food Chem. 2015, 63, 2321–2327. [Google Scholar] [CrossRef] [PubMed]
- Navarini, L.; Rivetti, D. Water quality for Espresso coffee. Food Chem. 2010, 122, 424–428. [Google Scholar] [CrossRef]
- Cammenga, H.; Zielasko, B. Kinetics and development of boiler scale formation in commercial coffee brewing machines. In Proceedings of the COLLOQUE Scientifique International sur le Café, Nairobi, Kenya, 20–25 July 1997. [Google Scholar]
- Dórea, J.G.; da Costa, T.H.M. Is coffee a functional food? Br. J. Nutr. 2005, 93, 773–782. [Google Scholar] [CrossRef]
- Petracco, M. Technology IV: Beverage Preparation: Brewing Trends for the New Millennium. In COFFEE Recent Developments; Blackwell Science Ltd.: London, UK, 2001. [Google Scholar]
- Andueza, S.; De Peña, M.-P.; Cid, C. Chemical and Sensorial Characteristics of Espresso Coffee as Affected by Grinding and Torrefacto Roast. J. Agric. Food Chem. 2003, 51, 7034–7039. [Google Scholar] [CrossRef] [PubMed]
- Salamanca, C.A.; Fiol, N.; González, C.; Saez, M.; Villaescusa, I. Extraction of espresso coffee by using gradient of temperature. Effect on physicochemical and sensorial characteristics of espresso. Food Chem. 2017, 214, 622–630. [Google Scholar] [CrossRef] [PubMed]
- Andueza, S.; Maeztu, L.; Pascual, L.; Ibáñez, C.; De Peña, M.-P.; Cid, C. Influence of extraction temperature on the final quality of espresso coffee. J. Sci. Food Agric. 2003, 83, 240–248. [Google Scholar] [CrossRef]
- Angeloni, G.; Guerrini, L.; Masella, P.; Innocenti, M.; Bellumori, M.; Parenti, A. Characterization and comparison of cold brew and cold drip coffee extraction methods. J. Sci. Food Agric. 2018, 99, 391–399. [Google Scholar] [CrossRef]
- Perez, M. Cold Brew might Save the Coffee Market. Available online: https://www.bloomberg.com/news/articles/2017-07-19/hot-sales-of-cold-brew-might-just-be-what-coffee-market-needs (accessed on 2 February 2021).
- Fuller, M.; Rao, N.Z. The Effect of Time, Roasting Temperature, and Grind Size on Caffeine and Chlorogenic Acid Concentrations in Cold Brew Coffee. Sci. Rep. 2017, 7, 16206. [Google Scholar] [CrossRef]
- Shin, K.-S. The Chemical Characteristics and Immune-Modulating Activity of Polysaccharides Isolated from Cold-Brew Coffee. Prev. Nutr. Food Sci. 2017, 22, 100–106. [Google Scholar]
- Burdock, G.A. Fenaroli’s Handbook of Flavor Ingredients; CRC Press: Boca Raton, FL, USA, 2016. [Google Scholar]
- Flament, I. Coffee Flavor Chemistry; John Wiley & Sons: Hoboken, NJ, USA, 2001. [Google Scholar]
- Mottram, D.S. The Maillard Reaction: Source of Flavour in Thermally Processed Foods. In Flavours and Fragrances; Springer: Berlin/Heidelberg, Germany, 2007; pp. 269–283. [Google Scholar]
- Sekiwa, Y.; Kubota, K.; Kobayashi, A. Characteristic Flavor Components in the Brew of Cooked Clam (Meretrix lusoria) and the Effect of Storage on Flavor Formation. J. Agric. Food Chem. 1997, 45, 826–830. [Google Scholar] [CrossRef]
- Vorotnikov, V.; Mpourmpakis, G.; Vlachos, D.G. DFT Study of Furfural Conversion to Furan, Furfuryl Alcohol, and 2-Methylfuran on Pd(111). ACS Catal. 2012, 2, 2496–2504. [Google Scholar] [CrossRef]
- Bhumiratana, N.; Adhikari, K.; Chambers, E. Evolution of sensory aroma attributes from coffee beans to brewed coffee. LWT 2011, 44, 2185–2192. [Google Scholar] [CrossRef]
- Derossi, A.; Ricci, I.; Caporizzi, R.; Fiore, A.; Severini, C. How grinding level and brewing method (Espresso, American, Turkish) could affect the antioxidant activity and bioactive compounds in a coffee cup. J. Sci. Food Agric. 2018, 98, 3198–3207. [Google Scholar] [CrossRef] [PubMed]
- Jeong, D.-W.; Heo, S.; Lee, B.; Lee, H.; Jeong, K.; Her, J.-Y.; Lee, K.-G.; Lee, J.-H. Effects of the predominant bacteria from meju and doenjang on the production of volatile compounds during soybean fermentation. Int. J. Food Microbiol. 2017, 262, 8–13. [Google Scholar] [CrossRef]
- Lee, H.J.; Cho, I.H.; Lee, K.E.; Kim, Y.-S. The Compositions of Volatiles and Aroma-Active Compounds in Dried Omija Fruits (Schisandra chinensis Baillon) According to the Cultivation Areas. J. Agric. Food Chem. 2011, 59, 8338–8346. [Google Scholar] [CrossRef] [PubMed]
- Kim, M.K.; Kim, M.-Y.; Lee, K.-G. Categorization of fruits according to their content of polyphenols and vitamin C, antiradical activity, and quality parameters. J. Food Process. Preserv. 2017, 42, e13421. [Google Scholar] [CrossRef]
 ) and C-4 (
 ): roasted at 235 °C for 13 min; E-13 (
 ) and C-13 (
 ): roasted at 240 °C for 15 min; E-22 (
 ) and C-22 (
 ): roasted at 245 °C for 17 min); (b) grind size (E-10 (
 ) and C-10 (
 ): 355 μm; E-13 (
 ) and C-13 (
 ): 500 μm; E-16 (
 ) and C-16 (
 ): 710 μm); (c) types of water (E-13 (
 ) and C-13 (
 ): filtered water; E-14 (
 ) and C-14 (
 ): tap water; E-15 (
 ) and C-15 (
 ): bottled water). Different letters (a, b, c) represented significant differences.
) and C-4 (): roasted at 235 °C for 13 min; E-13 () and C-13 (): roasted at 240 °C for 15 min; E-22 () and C-22 (): roasted at 245 °C for 17 min); (b) grind size (E-10 () and C-10 (): 355 μm; E-13 () and C-13 (): 500 μm; E-16 () and C-16 (): 710 μm); (c) types of water (E-13 () and C-13 (): filtered water; E-14 () and C-14 (): tap water; E-15 () and C-15 (): bottled water). Different letters (a, b, c) represented significant differences.
): bottled water). Different letters (a, b, c) represented significant differences.
) and C-4 (): roasted at 235 °C for 13 min; E-13 () and C-13 (): roasted at 240 °C for 15 min; E-22 () and C-22 (): roasted at 245 °C for 17 min); (b) grind size (E-10 () and C-10 (): 355 μm; E-13 () and C-13 (): 500 μm; E-16 () and C-16 (): 710 μm); (c) types of water (E-13 () and C-13 (): filtered water; E-14 () and C-14 (): tap water; E-15 () and C-15 (): bottled water). Different letters (a, b, c) represented significant differences.


| No. | Compounds | Retention Time | R.I | R.I (Ref) | Co- Injection | Mass Spectrum |
|---|---|---|---|---|---|---|
| a1 | 2-Methylpyrazine | 25.99 | 1289 | 1288 | o | o |
| a2 | 2,3-Dimethylpyrazine | 29.87 | 1370 | 1371 | o | o |
| a3 | 2,5-Dimethylpyrazine | 28.73 | 1346 | 1348 | o | o |
| a4 | 2,6-Dimethylpyrazine | 29.02 | 1352 | 1354 | o | o |
| a5 | 2-Ethylpyrazine | 29.23 | 1356 | 1359 | o | o |
| a6 | 2,6-Diethylpyrazine | 33.83 | 1456 | 1444 | o | |
| a7 | 2-Ethyl-3-methylpyrazine | 32.54 | 1427 | 1422 | o | o |
| a8 | 2-Ethyl-5-methylpyrazine | 31.64 | 1407 | 1415 | o | |
| a9 | 3-Ethyl-2,5-dimethylpyrazine | 34.32 | 1467 | 1452 | o | o |
| a10 | Isopropenyl pyrazine | 40.82 | 1619 | o | ||
| b1 | 2-Acetylfuran | 36.74 | 1522 | 1527 | o | o |
| b2 | 2,2′-Bifuran | 40.47 | 1610 | 1614 | o | |
| b3 | 2,2′-Methylenebisfuran | 40.93 | 1622 | 1615 | o | |
| b4 | 2,2′-[Oxybis(methylene)]bisfuran | 57.71 | 1997 | 1986 | o | |
| b5 | Furfuryl alcohol | 42.84 | 1669 | 1666 | o | o |
| b6 | Furfuryl acetate | 37.82 | 1547 | 1552 | o | o |
| b7 | Furfuryl propionate | 40.36 | 1607 | 1603 | o | o |
| b8 | Furfural | 34.81 | 1477 | 1482 | o | o |
| b9 | 5-Methylfurfural | 39.63 | 1590 | 1596 | o | o |
| c1 | 1-Methylpyrrole | 19.30 | 1147 | 1140 | o | o |
| c2 | 1-Furfurylpyrrole | 49.66 | 1841 | 1833 | o | o |
| d1 | Guaiacol (2-Methoxyphenol) | 51.10 | 1874 | 1872 | o | o |
| d2 | 4-Ethylguaiacol | 59.93 | 2052 | 2054 | o | o |
| d3 | 2-Methoxy-4-vinylphenol | 64.80 | 2156 | o | o |
| Compounds | 235 °C, 13 min | |||||||||||||||||
|---|---|---|---|---|---|---|---|---|---|---|---|---|---|---|---|---|---|---|
| 355 μm | 500 μm | 710 μm | ||||||||||||||||
| Filtered Water | Tap Water | Bottled Water | Filtered Water | Tap Water | Bottled Water | Filtered Water | Tap Water | Bottled Water | ||||||||||
| E-1 | C-1 | E-2 | C-2 | E-3 | C-3 | E-4 | C-4 | E-5 | C-5 | E-6 | C-6 | E-7 | C-7 | E-8 | C-8 | E-9 | C-9 | |
| 2-Methylpyrazine | 0.382 b | 0.885 a | 0.941 a | 0.615 b | 0.852 a | 0.596 b | 0.338 | 0.641 a | 0.288 | 0.505 b | 0.324 | 0.520 b | 0.190 b | 0.605 a | 0.436 a | 0.591 a | 0.186 b | 0.493 b |
| 2,3-Dimethylpyrazine | 0.048 b | 0.070 b | 0.068 ab | 0.087 ab | 0.056 a | 0.098 a | 0.040 | 0.097 a | 0.031 | 0.075 b | 0.041 | 0.056 c | 0.019 b | 0.056 a | 0.032 a | 0.046 b | 0.022 b | 0.039 b |
| 2,5-Dimethylpyrazine | 0.237 b | 0.523 a | 0.553 a | 0.371 b | 0.518 a | 0.346 b | 0.213 | 0.383 a | 0.188 | 0.304 b | 0.205 | 0.302 b | 0.104 b | 0.352 a | 0.224 a | 0.340 a | 0.102 b | 0.269 b |
| 2,6-Dimethylpyrazine | 0.215 b | 0.438 a | 0.451 a | 0.292 b | 0.435 a | 0.298 b | 0.184 | 0.302 | 0.164 | 0.245 | 0.182 | 0.253 | 0.090 b | 0.279 a | 0.187 a | 0.266 ab | 0.093 b | 0.213 b |
| 2-Ethylpyrazine | 0.189 b | 0.338 a | 0.372 a | 0.252 b | 0.366 a | 0.243 b | 0.161 | 0.258 a | 0.143 | 0.197 b | 0.153 | 0.206 b | 0.072 b | 0.218 | 0.148 a | 0.209 | 0.074 b | 0.174 |
| 2,6-Diethylpyrazine | 0.082 b | 0.219 | 0.100 ab | 0.213 | 0.125 a | 0.209 | 0.057 | 0.199 a | 0.052 | 0.163 b | 0.061 | 0.172 a | 0.032 | 0.114 a | 0.035 | 0.104 a | 0.044 | 0.079 b |
| 2-Ethyl- 3-methylpyrazine | 0.247 b | 0.402 | 0.489 a | 0.312 | 0.482 a | 0.316 | 0.211 | 0.312 a | 0.196 | 0.245b | 0.219 | 0.263 b | 0.096 b | 0.297 a | 0.189 a | 0.297 a | 0.099 b | 0.231 b |
| 2-Ethyl- 5-methylpyrazine | 0.317 b | 0.326 a | 0.384 ab | 0.256 b | 0.393 a | 0.278 ab | 0.262 | 0.259 | 0.213 | 0.217 | 0.225 | 0.217 | 0.104 | 0.237 ab | 0.141 | 0.257 a | 0.140 | 0.205 b |
| 3-Ethyl- 2,5-imethylpyrazine | 0.422 b | 0.753 a | 1.059 a | 0.587 b | 1.027 a | 0.613 ab | 0.336 a | 0.588 | 0.297 b | 0.491 | 0.347 a | 0.522 | 0.139 b | 0.500 a | 0.398 a | 0.462 a | 0.145 b | 0.399 b |
| Isopropenyl pyrazine | 0.048 b | 0.104 | 0.120 a | 0.100 | 0.115 a | 0.100 | 0.043 | 0.098 | 0.047 | 0.093 | 0.052 | 0.098 | 0.026 b | 0.106 a | 0.038 a | 0.105 a | 0.019 b | 0.082 b |
| 2-Acetylfuran | 0.308 b | 0.738 a | 0.643 a | 0.551 b | 0.632 a | 0.541 b | 0.239 | 0.475 | 0.229 | 0.380 | 0.264 | 0.392 | 0.133 b | 0.382 a | 0.238 a | 0.354 ab | 0.147 b | 0.260 b |
| 2,2′-Bifuran | 0.086 b | 0.088 | 0.267 a | 0.092 | 0.222 a | 0.092 | 0.069 ab | 0.077 a | 0.062 b | 0.060 b | 0.077 a | 0.067 ab | 0.045 b | 0.056 ab | 0.127 a | 0.062 a | 0.061 b | 0.045 b |
| 2,2′-Methylenebisfuran | 0.078 b | 0.086 | 0.225 a | 0.086 | 0.193 a | 0.092 | 0.072 b | 0.052 | 0.071 b | 0.043 | 0.081a | 0.046 | 0.047 b | 0.041 a | 0.103 a | 0.041 a | 0.054 b | 0.031 b |
| 2,2′-[Oxybis (methylene)]bisfuran | 0.124 b | 0.235 | 0.591 a | 0.238 | 0.612 a | 0.259 | 0.117 a | 0.811 b | 0.087 b | 0.964 ab | 0.112ab | 1.063 a | 0.081 c | 0.247 | 0.244 a | 0.226 | 0.154 b | 0.215 |
| Furfuryl alcohol | 1.656 b | 2.758 a | 2.710 a | 1.967 b | 2.514 a | 1.813 b | 1.405 | 1.729 ab | 1.335 | 1.495 b | 1.355 | 1.788 a | 0.728 b | 1.479 | 1.379 a | 1.553 | 0.768 b | 1.349 |
| Furfuryl acetate | 0.891 b | 1.916 | 2.194 a | 1.545 | 2.321 a | 1.532 | 0.706 ab | 1.190 a | 0.636 b | 0.832 b | 0.731a | 0.937 b | 0.289 b | 0.749 | 0.715 a | 0.775 | 0.332 b | 0.627 |
| Furfuryl propionate | 0.058 b | 0.103 | 0.091 a | 0.083 | 0.103 a | 0.084 | 0.043 ab | 0.055 | 0.039 b | 0.045 | 0.050a | 0.045 | 0.013 b | 0.037 a | 0.033 a | 0.036 a | 0.010 b | 0.028b |
| Furfural | 2.604 b | 4.906 a | 5.492 a | 3.746 b | 4.828 a | 3.665 b | 2.015 | 4.096 a | 1.850 | 3.236 b | 1.990 | 3.381 ab | 1.196 b | 3.500 | 2.338 a | 3.577 | 1.124 b | 2.823 |
| 5-Methylfurfural | 2.716 b | 6.897 a | 7.229 a | 5.392 b | 6.608 a | 5.268 b | 2.236 | 4.682 a | 2.051 | 3.700 b | 2.210 | 4.190 ab | 1.176 b | 3.503 | 2.429 a | 3.559 | 1.168 b | 3.106 |
| 1-Methylpyrrole | 0.076 b | 0.167 | 0.114 a | 0.134 | 0.147 a | 0.128 | 0.055 | 0.156 a | 0.056 | 0.113 b | 0.064 | 0.121 b | 0.024 b | 0.133 ab | 0.075 a | 0.140 a | 0.025 b | 0.103 b |
| 1-Furfurylpyrrole | 1.548 a | 0.761 a | 1.204 b | 0.612 b | 1.087 b | 0.643 ab | 1.062 | 0.565 | 1.210 | 0.471 | 1.258 | 0.495 | 0.599 | 0.395 | 0.490 | 0.401 | 0.510 | 0.357 |
| Guaiacol | 0.108 b | 0.352 a | 0.184 a | 0.248 b | 0.165 a | 0.249 b | 0.090 | 0.257 | 0.083 | 0.232 | 0.089 | 0.229 | 0.055 | 0.055 | 0.064 | 0.051 | 0.056 | 0.045 |
| 4-Ethylguaiacol | 0.337 b | 0.366 | 0.976 a | 0.336 | 0.944 a | 0.357 | 0.334 | 0.242 b | 0.321 | 0.242 b | 0.344 | 0.340 a | 0.190 b | 0.444 | 0.404 a | 0.456 | 0.168 b | 0.429 |
| 2-Methoxy- 4-vinylphenol | 3.612 a | 1.367 | 2.937 b | 1.388 | 2.851 b | 1.412 | 3.253 b | 1.520 b | 3.348 b | 1.576 b | 3.735a | 1.727 a | 1.647 a | 1.311 b | 1.469 b | 1.431 a | 1.286 c | 1.477 a |
| Compounds | 240 °C, 15 min | |||||||||||||||||
|---|---|---|---|---|---|---|---|---|---|---|---|---|---|---|---|---|---|---|
| 355 μm | 500 μm | 710 μm | ||||||||||||||||
| Filtered Water | Tap Water | Bottled Water | Filtered Water | Tap Water | Bottled Water | Filtered Water | Tap Water | Bottled Water | ||||||||||
| E-10 | C-10 | E-11 | C-11 | E-12 | C-12 | E-13 | C-13 | E-14 | C-14 | E-15 | C-15 | E-16 | C-16 | E-17 | C-17 | E-18 | C-18 | |
| 2-Methylpyrazine | 0.712 a | 0.727 | 0.445 b | 0.718 | 0.476 b | 0.645 | 0.601 | 0.688 a | 0.48 | 0.496 b | 0.427 | 0.477 b | 0.245 b | 0.514 | 0.566 a | 0.504 | 0.221 b | 0.476 |
| 2,3-Dimethylpyrazine | 0.072 | 0.057 | 0.085 | 0.076 | 0.074 | 0.064 | 0.114 a | 0.081 a | 0.072 b | 0.042 b | 0.072 b | 0.044 b | 0.023 b | 0.046 | 0.054 a | 0.043 | 0.028 b | 0.045 |
| 2,5-Dimethylpyrazine | 0.391 a | 0.375 | 0.258 b | 0.366 | 0.281 b | 0.345 | 0.313 a | 0.363 a | 0.250 b | 0.242 b | 0.258 ab | 0.237 b | 0.119 b | 0.254 | 0.279 a | 0.249 | 0.128 b | 0.241 |
| 2,6-Dimethylpyrazine | 0.393 a | 0.349 | 0.272 b | 0.350 | 0.283 b | 0.327 | 0.324 a | 0.382 a | 0.284 a | 0.277 b | 0.240 b | 0.268 b | 0.109 b | 0.267 | 0.273 a | 0.263 | 0.119 b | 0.256 |
| 2-Ethylpyrazine | 0.337 a | 0.274 | 0.224 b | 0.257 | 0.226 b | 0.242 | 0.271 a | 0.308 a | 0.224 b | 0.212 b | 0.196 b | 0.205 b | 0.084 b | 0.223 | 0.227 a | 0.220 | 0.089 b | 0.209 |
| 2,6-Diethylpyrazine | 0.106 ab | 0.101 | 0.040 b | 0.118 | 0.140 a | 0.104 | 0.224 a | 0.126 a | 0.128 b | 0.082 b | 0.121 b | 0.081 b | 0.071 | 0.088 | 0.056 | 0.091 | 0.071 | 0.084 |
| 2-Ethyl- 3-methylpyrazine | 0.419 a | 0.332 | 0.309 b | 0.347 | 0.341 b | 0.320 | 0.386 a | 0.386 a | 0.302 b | 0.267 b | 0.310 b | 0.265 b | 0.144 b | 0.262 | 0.270 a | 0.259 | 0.139 b | 0.257 |
| 2-Ethyl- 5-methylpyrazine | 0.327 a | 0.280 | 0.225 b | 0.263 | 0.247 b | 0.266 | 0.261 a | 0.307 a | 0.208 b | 0.193 b | 0.192 b | 0.192 b | 0.078 b | 0.227 | 0.186 a | 0.208 | 0.099 b | 0.204 |
| 3-Ethyl- 2,5-imethylpyrazine | 0.675 a | 0.660 | 0.436 b | 0.807 | 0.516 b | 0.674 | 0.593 a | 0.602 a | 0.418 b | 0.490 b | 0.397 b | 0.414 b | 0.181c | 0.526 | 0.379 a | 0.519 | 0.244 b | 0.478 |
| Isopropenyl pyrazine | 0.137 b | 0.143 | N.D c | 0.095 | 0.213 a | 0.117 | 0.164 a | 0.112 a | 0.111 b | 0.078 b | 0.097 b | 0.080 b | 0.076 | 0.106 | 0.065 | 0.095 | 0.065 | 0.094 |
| 2-Acetylfuran | 0.577 a | 0.655 | 0.404 b | 0.626 | 0.441 b | 0.587 | 0.557 a | 0.553 a | 0.365 b | 0.361 b | 0.382 b | 0.338 b | 0.171 b | 0.389 | 0.349 a | 0.376 | 0.170 b | 0.375 |
| 2,2’-Bifuran | 0.214 a | 0.107 | N.D c | 0.096 | 0.086 b | 0.109 | 0.197 a | 0.137 | 0.116 b | 0.065 | 0.112 b | 0.063 | 0.083 b | 0.068 | 0.177 a | 0.069 | 0.081 b | 0.051 |
| 2,2’-Methylenebisfuran | 0.841 a | 0.248 | 0.486 b | 0.224 | 0.529 b | 0.242 | 0.516 a | 0.304 | 0.356 b | 0.262 | 0.379 b | 0.249 | 0.223 b | 0.245 | 0.699 a | 0.247 | 0.235 b | 0.219 |
| 2,2’-[Oxybis (methylene)]bisfuran | 2.142 a | 0.905 | 1.454 b | 0.993 | 1.601 b | 0.988 | 1.243 a | 1.075 | 1.185 ab | 0.939 | 0.996 b | 0.951 | 0.322 b | 0.914 | 1.274 a | 0.920 | 0.341 b | 0.997 |
| Furfuryl alcohol | 2.653 | 2.279 | 2.333 | 2.807 | 2.742 | 2.888 | 2.327 | 2.308 a | 2.363 | 1.923 b | 1.985 | 1.898 b | 0.849 b | 2.193 | 1.957 a | 2.085 | 0.825 b | 2.114 |
| Furfuryl acetate | 4.393 a | 2.891 | 2.364 b | 2.677 | 2.450 b | 2.916 | 2.748 a | 3.004 | 2.075 b | 2.628 | 1.890 b | 2.673 | 0.736 b | 2.804 | 2.567 a | 2.405 | 0.688 b | 2.553 |
| Furfuryl propionate | 0.354 a | 0.197 | 0.202 b | 0.217 | 0.198 b | 0.221 | 0.257 a | 0.276 a | 0.184 b | 0.204 b | 0.174 b | 0.209 b | 0.058 b | 0.205 a | 0.251 a | 0.199 ab | 0.060 b | 0.190 b |
| Furfural | 1.044 a | 1.736 | 0.685 b | 1.58 | 0.702 b | 1.485 | 1.139 a | 0.708 a | 0.877 b | 0.527 b | 0.900 b | 0.511 b | 0.700 | 0.584 | 0.700 | 0.575 | 0.712 | 0.542 |
| 5-Methylfurfural | 2.313 a | 2.978 | 1.811 b | 3.360 | 1.905 b | 2.743 | 2.610 a | 1.514 a | 2.183 b | 1.214 b | 2.060 b | 1.204 b | 1.213 b | 1.333 | 1.441 a | 1.291 | 1.297 b | 0.944 |
| 1-Methylpyrrole | 0.213 a | 0.245 | N.D b | 0.198 | N.D b | 0.238 | 0.190 a | 0.377 a | 0.085 b | 0.252 b | 0.091 b | 0.251 b | N.D b | 0.273 | 0.214 a | 0.267 | N.D b | 0.229 |
| 1-Furfurylpyrrole | 1.570 | 0.913 | 1.368 | 0.964 | 1.306 | 0.978 | 1.506 a | 0.727 | 1.005 b | 0.605 | 0.987 b | 0.638 | 0.669 b | 0.795 a | 1.154 a | 0.705 b | 0.685 b | 0.760 a |
| Guaiacol | 0.732 | 0.385 | 0.570 | 0.395 | 0.519 | 0.389 | 0.397 a | 0.409 a | 0.339 ab | 0.318 b | 0.274 b | 0.330 b | 0.079 b | 0.340 | 0.412 a | 0.337 | 0.064 b | 0.352 |
| 4-Ethylguaiacol | 2.622 a | 1.127 | 2.062 b | 1.189 | 2.241 b | 1.159 | 1.644 a | 1.357 a | 1.381 b | 1.203 b | 1.422 b | 1.217 ab | 0.467 b | 1.155 | 1.421 a | 1.162 | 0.472 b | 1.219 |
| 2-Methoxy- 4-vinylphenol | 3.971 a | 1.150 | 4.232 a | 1.079 | 4.741 b | 1.112 | 3.998 a | 1.379 a | 3.752 ab | 1.192 b | 3.431 b | 1.119 b | 1.529 b | 1.591 | 1.951 a | 1.514 | 1.472 b | 1.499 |
| Compounds | 245 °C, 17 Min | |||||||||||||||||
|---|---|---|---|---|---|---|---|---|---|---|---|---|---|---|---|---|---|---|
| 355 μm | 500 μm | 710 μm | ||||||||||||||||
| Filtered Water | Tap Water | Bottled Water | Filtered Water | Tap Water | Bottled Water | Filtered Water | Tap Water | Bottled Water | ||||||||||
| E-19 | C-19 | E-20 | C-20 | E-21 | C-21 | E-22 | C-22 | E-23 | C-23 | E-24 | C-24 | E-25 | C-25 | E-26 | C-26 | E-27 | C-27 | |
| 2-Methylpyrazine | 0.807 | 0.353 | 0.635 | 0.320 | 0.653 | 0.319 | 0.397 a | 0.589 | 0.350 b | 0.529 | 0.369 ab | 0.489 | 0.388 | 0.519 a | 0.643 | 0.451 b | 0.188 | 0.451 b |
| 2,3-Dimethylpyrazine | 0.101 | 0.051 | 0.092 | 0.050 | 0.102 | 0.044 | 0.089 | 0.066 | 0.097 | 0.070 | 0.084 | 0.062 | 0.055 | 0.102 a | 0.057 | 0.090 a | 0.052 | 0.066 b |
| 2,5-Dimethylpyrazine | 0.336 | 0.162 | 0.276 | 0.147 | 0.286 | 0.149 | 0.190 | 0.255 | 0.166 | 0.224 | 0.175 | 0.218 | 0.167 a | 0.238 a | 0.094 b | 0.212 b | 0.090 b | 0.198 b |
| 2,6-Dimethylpyrazine | 0.396 | 0.203 | 0.322 | 0.193 | 0.333 | 0.190 | 0.229 | 0.305 | 0.207 | 0.287 | 0.216 | 0.271 | 0.198 a | 0.274 a | 0.105 b | 0.254 ab | 0.108 b | 0.246 b |
| 2-Ethylpyrazine | 0.254 | 0.162 | 0.222 | 0.153 | 0.224 | 0.151 | 0.170 | 0.219 | 0.158 | 0.208 | 0.155 | 0.199 | 0.140 a | 0.210 | 0.079 b | 0.197 | 0.082 b | 0.179 |
| 2,6-Diethylpyrazine | 0.148 a | 0.057 | 0.124 ab | 0.053 | 0.110 b | 0.054 | 0.070 | 0.062 | 0.040 | 0.056 | 0.059 | 0.057 | 0.021 b | 0.086 a | 0.029 a | 0.070 ab | 0.031 a | 0.064 b |
| 2-Ethyl- 3-methylpyrazine | 0.353 | 0.195 | 0.324 | 0.184 | 0.303 | 0.188 | 0.212 | 0.251 | 0.203 | 0.244 | 0.226 | 0.225 | 0.175 a | 0.241 | 0.094 b | 0.229 | 0.101 b | 0.223 |
| 2-Ethyl- 5-methylpyrazine | 0.199 | 0.112 | 0.167 | 0.113 | 0.168 | 0.116 | 0.111 | 0.132 | 0.107 | 0.128 | 0.118 | 0.128 | 0.095 a | 0.181 | 0.051 b | 0.166 | 0.061 b | 0.156 |
| 3-Ethyl- 2,5-imethylpyrazine | 0.514 a | 0.325 | 0.387 ab | 0.320 | 0.243 b | 0.285 | 0.334 a | 0.388 | 0.240 b | 0.394 | 0.326 a | 0.363 | 0.193 a | 0.388 | 0.138 b | 0.389 | 0.140 b | 0.363 |
| Isopropenyl pyrazine | 0.322 a | 0.087 | 0.243 ab | 0.093 | 0.219 b | 0.095 | N.D | 0.115 | 0.24 | 0.093 | N.D | 0.102 | 0.102 a | 0.096 a | 0.020 b | 0.073 b | 0.024 b | 0.065 b |
| 2-Acetylfuran | 0.788 | 0.302 | 0.638 | 0.310 | 0.651 | 0.287 | 0.415 | 0.485 | 0.368 | 0.435 | 0.381 | 0.417 | 0.254 a | 0.426 a | 0.158 b | 0.368 b | 0.161 b | 0.326c |
| 2,2’-Bifuran | 0.058 | 0.055 | 0.055 | 0.064 | 0.050 | 0.052 | 0.043 | 0.110 | 0.036 | 0.083 | 0.046 | 0.073 | 0.097 a | 0.069 a | 0.047 b | 0.047 b | 0.036 b | 0.040 b |
| 2,2’-Methylenebisfuran | 0.904 | 0.297 | 0.816 | 0.319 | 0.814 | 0.287 | 0.676 | 0.359 | 0.627 | 0.378 | 0.679 | 0.359 | 0.625 a | 0.326 | 0.558 b | 0.320 | 0.498 b | 0.294 |
| 2,2’-[Oxybis (methylene)]bisfuran | 1.376 | 0.932 | 1.364 | 0.974 | 1.365 | 0.933 | 1.508 | 0.867 | 1.430 | 0.944 | 1.718 | 0.952 | 1.172 a | 1.534 | 0.955 b | 1.735 | 0.959 b | 1.661 |
| Furfuryl alcohol | 1.973 | 0.775 | 1.646 | 0.857 | 1.872 | 0.888 | 1.254 ab | 1.198 a | 1.105 b | 1.032 b | 1.318 a | 0.970 b | 0.987 a | 1.717 | 0.734 b | 1.575 | 0.772 b | 1.616 |
| Furfuryl acetate | 2.977 | 1.540 | 2.633 | 1.536 | 2.386 | 1.492 | 2.096 a | 1.785 | 1.632 b | 1.760 | 2.016 a | 1.695 | 1.589 a | 2.280 | 1.017 b | 2.247 | 1.067 b | 2.061 |
| Furfuryl propionate | 0.242 | 0.158 | 0.228 | 0.153 | 0.192 | 0.142 | 0.204 a | 0.154 | 0.160 b | 0.164 | 0.202 a | 0.161 | 0.160 a | 0.196 a | 0.114 b | 0.184 ab | 0.108 b | 0.167 b |
| Furfural | 0.434 | 0.112 | 0.377 | 0.109 | 0.379 | 0.099 | 0.212 | 0.173 | 0.165 | 0.152 | 0.174 | 0.150 | 0.140 | 0.321 a | 0.138 | 0.252 b | 0.145 | 0.237 b |
| 5-Methylfurfural | 0.448 | 0.234 | 0.402 | 0.198 | 0.416 | 0.210 | 0.182 | 0.347 | 0.179 | 0.312 | 0.214 | 0.327 | 0.255 a | 0.793 | 0.205 b | 0.748 | 0.194 b | 0.747 |
| 1-Methylpyrrole | N.D c | 0.297 | 0.459 a | 0.300 | 0.363 b | 0.306 | 0.272 a | 0.461 | 0.214 b | 0.434 | 0.244 ab | 0.416 | 0.272 a | 0.377 | 0.126 b | 0.343 | 0.110 b | 0.308 |
| 1-Furfurylpyrrole | 0.915 | 0.544 b | 0.823 | 0.626 ab | 0.797 | 0.727 a | 1.293 | 0.600 | 1.123 | 0.649 | 1.378 | 0.591 | 0.811 | 0.640 | 0.819 | 0.555 | 0.834 | 0.555 |
| Guaiacol | 2.180 | 0.590 | 1.984 | 0.614 | 1.988 | 0.610 | 1.322 | 0.936 | 1.173 | 0.846 | 1.337 | 0.830 | 0.623 a | 0.567 a | 0.337c | 0.510 ab | 0.439 b | 0.486 b |
| 4-Ethylguaiacol | 4.936 | 2.002 | 4.545 | 2.037 | 4.498 | 1.945 | 4.220 a | 2.442 | 3.665 b | 2.424 | 4.255 a | 2.451 | 2.026 a | 1.944 | 1.381c | 1.774 | 1.583 b | 1.835 |
| 2-Methoxy- 4-vinylphenol | 1.736 a | 0.504 a | 1.562 b | 0.504 a | 1.689 ab | 0.413 b | 1.898 ab | 0.503 | 1.596 b | 0.510 | 2.018s | 0.485 | 0.948c | 1.192 a | 1.027 b | 0.923 b | 1.232 a | 0.877 b |
Publisher’s Note: MDPI stays neutral with regard to jurisdictional claims in published maps and institutional affiliations. |
© 2021 by the authors. Licensee MDPI, Basel, Switzerland. This article is an open access article distributed under the terms and conditions of the Creative Commons Attribution (CC BY) license (https://creativecommons.org/licenses/by/4.0/).
Share and Cite
Yu, J.-M.; Chu, M.; Park, H.; Park, J.; Lee, K.-G. Analysis of Volatile Compounds in Coffee Prepared by Various Brewing and Roasting Methods. Foods 2021, 10, 1347. https://doi.org/10.3390/foods10061347
Yu J-M, Chu M, Park H, Park J, Lee K-G. Analysis of Volatile Compounds in Coffee Prepared by Various Brewing and Roasting Methods. Foods. 2021; 10(6):1347. https://doi.org/10.3390/foods10061347
Chicago/Turabian StyleYu, Ja-Myung, Mingi Chu, Hyunbeen Park, Jooyeon Park, and Kwang-Geun Lee. 2021. "Analysis of Volatile Compounds in Coffee Prepared by Various Brewing and Roasting Methods" Foods 10, no. 6: 1347. https://doi.org/10.3390/foods10061347
APA StyleYu, J.-M., Chu, M., Park, H., Park, J., & Lee, K.-G. (2021). Analysis of Volatile Compounds in Coffee Prepared by Various Brewing and Roasting Methods. Foods, 10(6), 1347. https://doi.org/10.3390/foods10061347