
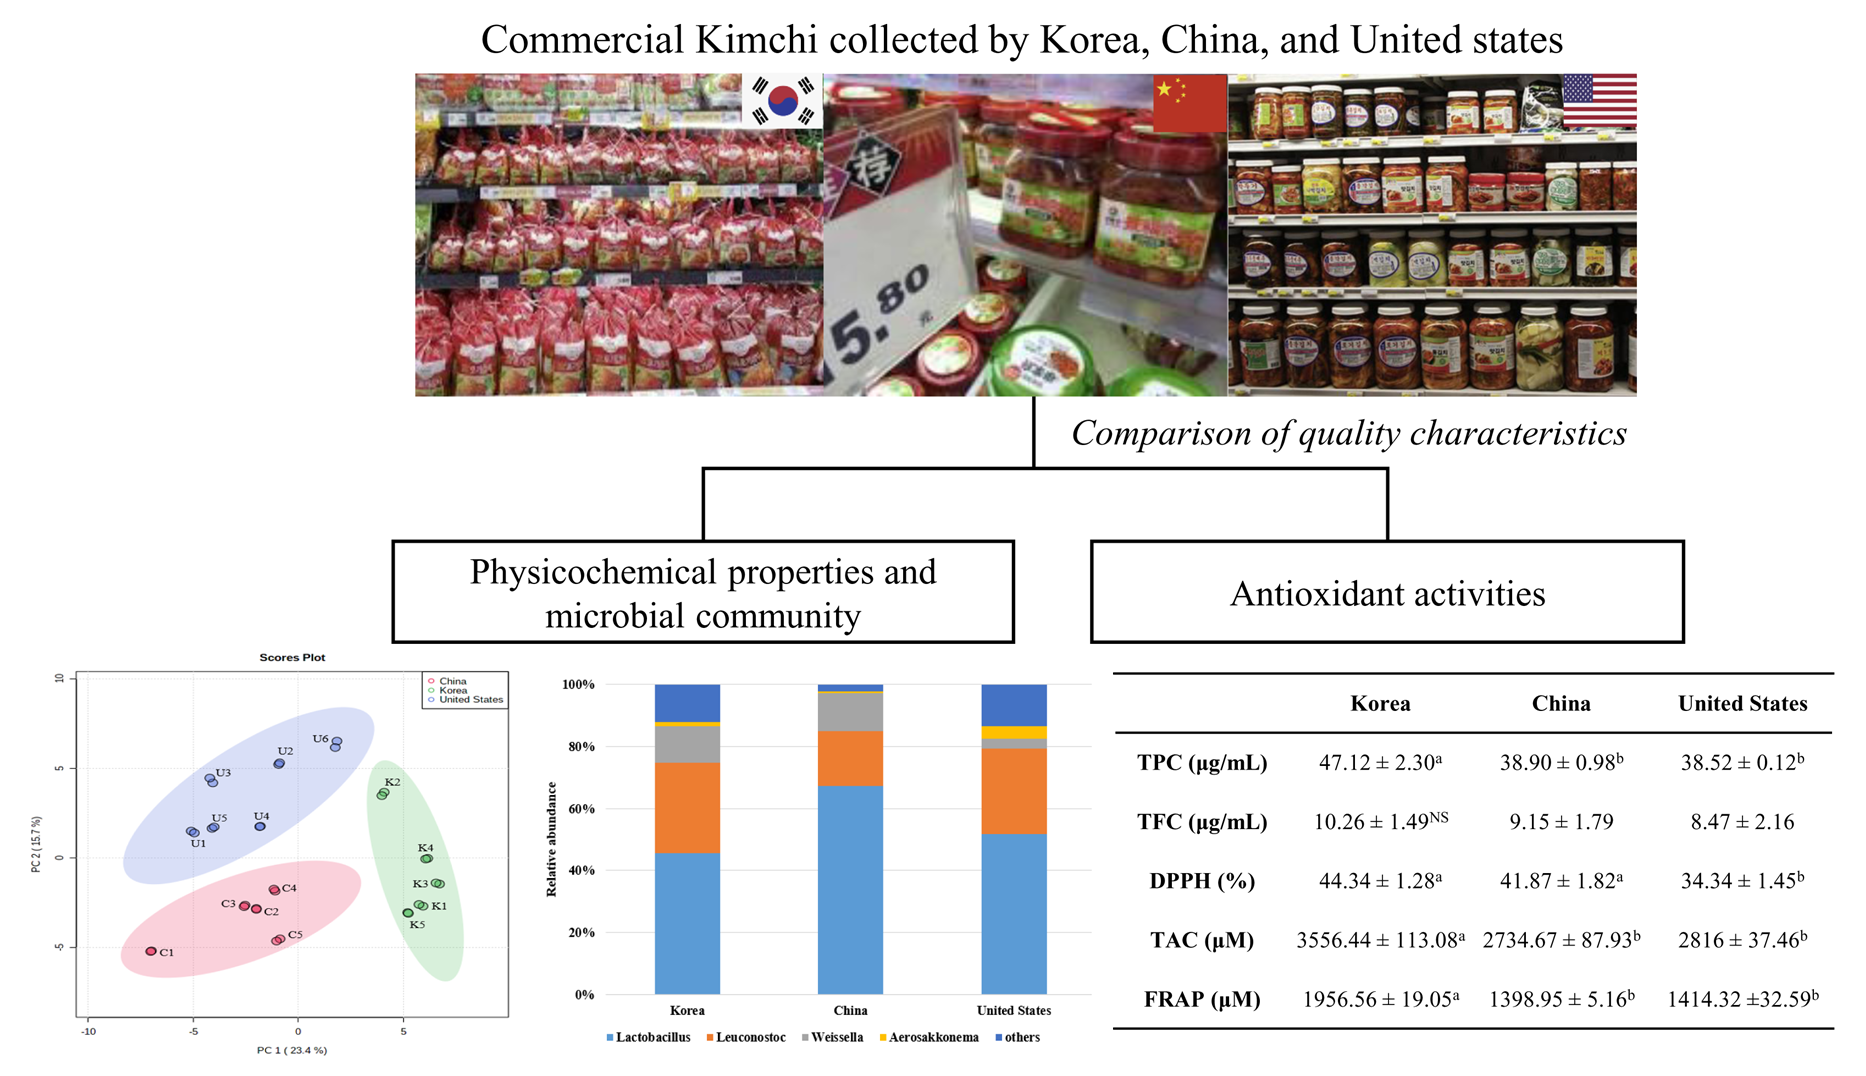
Comparison of Quality Characteristics of Commercial Kimchi Manufactured in Korea, China, and the United States

 ,
,
Abstract
:
1. Introduction
2. Materials and Methods
2.1. Materials
2.2. Commercial Kimchi Sample Collection
2.3. Salinity and Capsaicinoid Contents Analysis
2.4. Mineral Contents Analysis
2.5. Free Sugar Contents Analysis
2.6. Organic Acid Contents Analysis
2.7. Free Amino Acid Contents Analysis
2.8. Volatile Compounds Analysis
2.9. Microbial Community Analysis
2.10. Antioxidant Activity Analysis
2.11. Statistical Analysis
3. Results and Discussion
3.1. Salinity and Casaicinoid Contents of Commercial Kimchi Manufactured in Korea, China, and the United States
3.2. Mineral Contents of Commercial Kimchi Manufactured in Korea, China, and the United States
3.3. Free Sugar Contents of Commercial Kimchi Manufactured in Korea, China, and the United States
3.4. Organic Acid Contents of Commercial Kimchi Manufactured in Korea, China, and the United States
3.5. Free Amino Acid Contents of Commercial Kimchi Manufactured in Korea, China, and the United States
3.6. Volatile Compounds Contents of Commercial Kimchi Manufactured in Korea, China, and the United States
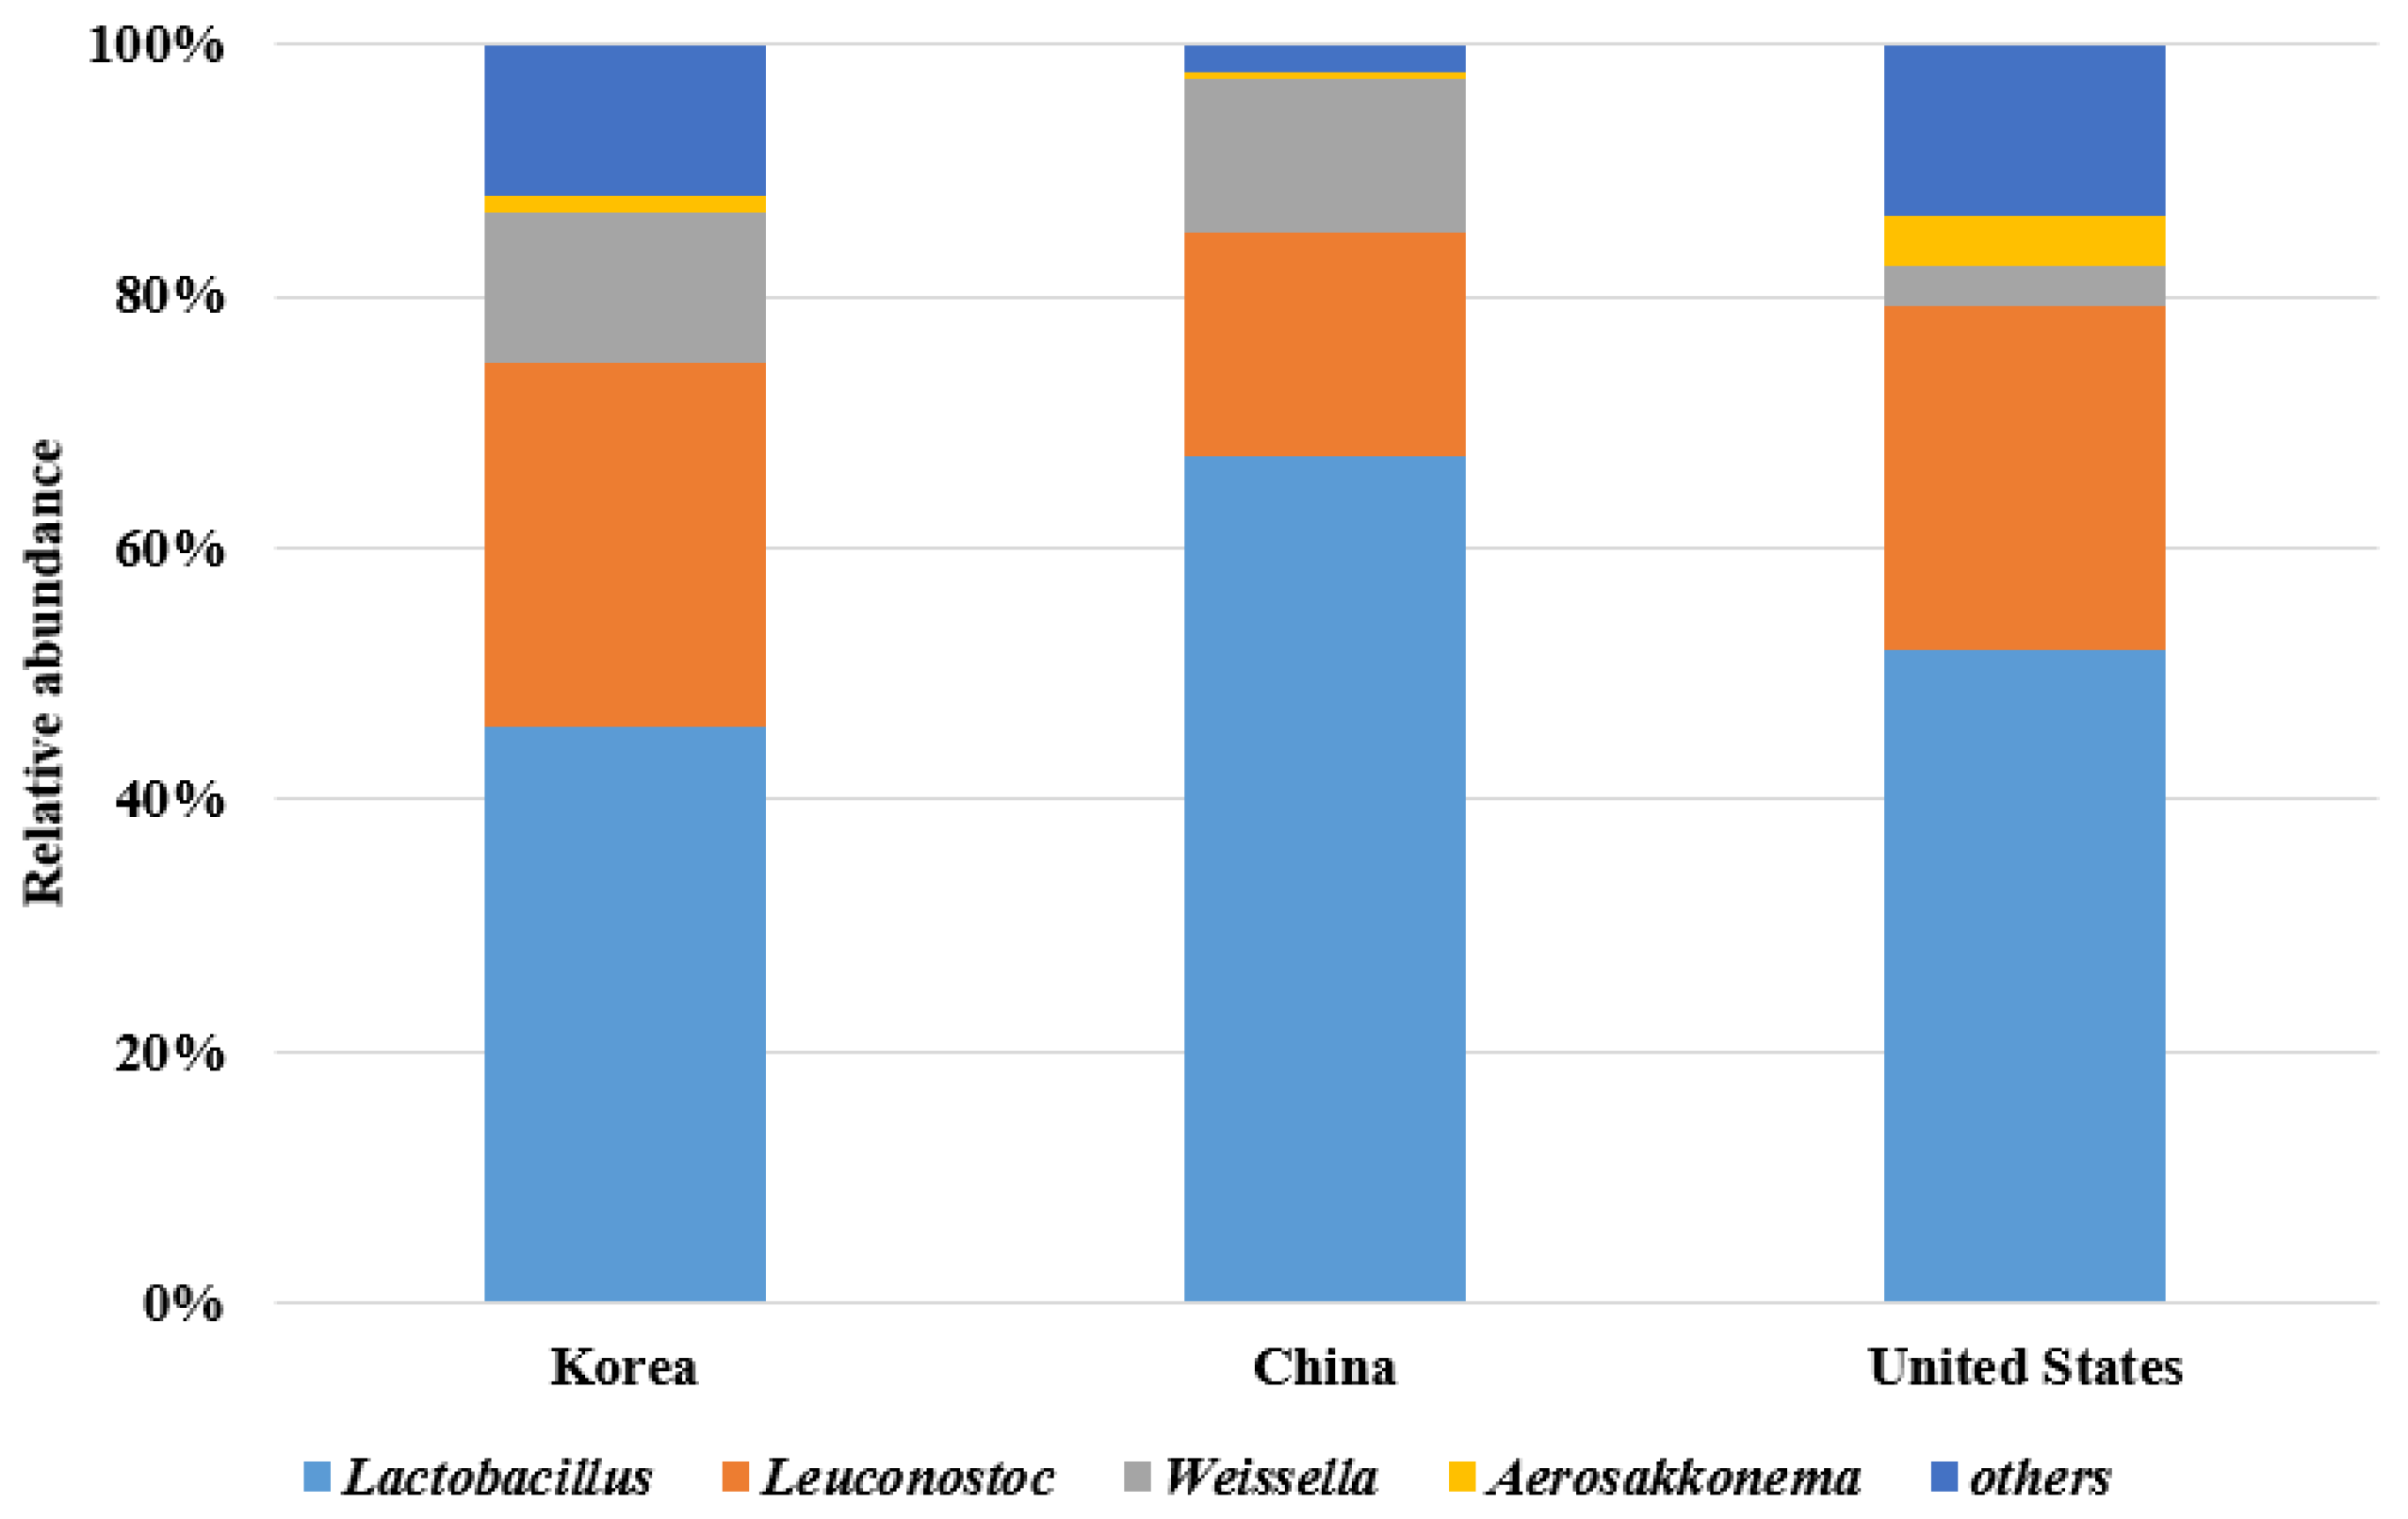
3.7. Microbial Community of Commercial Kimchi Manufactured in Korea, China, and the United States
3.8. Antioxidant Activity in Commercial Kimchi Manufactured in Korea, China, and the United States
4. Conclusions
Supplementary Materials
Author Contributions
Funding
Data Availability Statement
Conflicts of Interest
References
- FAO. 2001. Available online: http://www.fao.org/fao-who-codexalimentarius/sh-proxy/en//?lnk=1&url=https%253A%252F%252Fworkspace.fao.org%252Fsites%252Fcodex%252FStandards%252FCXS%2B223-2001%252FCXS_223e.pdf (accessed on 13 September 2021).
- MOFA. 2013. Available online: https://www.mofa.go.kr/eng/brd/m_5676/view.do?seq=313150&srchFr=&srchTo=&srchWord=&srchTp=&multi_itm_seq=0&itm_seq_1=0&itm_seq_2=0&company_cd=&company_nm= (accessed on 13 September 2021).
- Ryu, E.H.; Yang, J.S.; Lee, M.J.; Kim, S.H.; Seo, H.Y.; Jung, J.H. Antioxidant effects of kimchi supplemented with black raspberry during fermentation protect against liver cirrhosis-induced oxidative stress in rats. Nutr. Res. Pract. 2019, 13, 87–94. [Google Scholar] [CrossRef]
- Seong, G.U.; Hwang, I.W.; Chung, S.K. Antioxidant capacities and polyphenolics of Chinese cabbage (Brassica rapa L. ssp. Pekinensis) leaves. Food Chem. 2016, 199, 612–618. [Google Scholar] [CrossRef]
- Park, J.M.; Shin, J.H.; Gu, J.G.; Yoon, S.J.; Song, J.C.; Jeon, W.M.; Suh, H.J.; Chang, U.J.; Yang, C.Y.; Kim, J.M. Effect of antioxidant activity in kimchi during a short-term and over-ripening fermentation period. J. Biosci. Bioeng. 2011, 112, 356–359. [Google Scholar] [CrossRef] [PubMed]
- Lee, K.H.; Song, J.L.; Park, E.S.; Ju, J.; Kim, H.Y.; Park, K.Y. Anti-obesity effects of starter fermented kimchi on 3T3-L1 adipocytes. Prev. Nutr. Food Sci. 2015, 20, 298–302. [Google Scholar] [CrossRef] [Green Version]
- Yun, Y.R.; Park, S.H.; Kim, I.H. Antioxidant effect of Kimchi supplemented with Jeju citrus concentrate and its antiobesity effect on 3T3-L1 adipocytes. Food Sci. Nutr. 2019, 7, 2740–2746. [Google Scholar] [CrossRef] [PubMed] [Green Version]
- Yun, Y.R.; Kim, H.C.; Seo, H.Y. Antiobesity effects of kimchi added with Jeju citrus concentrate on high-fat diet-induced obese mice. Nutr. Res. 2021, 86, 50–59. [Google Scholar] [CrossRef]
- Youn, H.S.; Kim, J.H.; Lee, J.S.; Yoon, Y.Y.; Choi, S.J.; Lee, J.Y.; Kim, W.; Hwang, K.W. Lactobacillus plantarum reduces low-grade inflammation and glucose levels in a mouse model of chronic stress and diabetes. Infect. Immun. 2021, 17, IAI-00615. [Google Scholar] [CrossRef]
- Lee, E.; Jung, S.R.; Lee, S.Y.; Lee, N.K.; Paik, H.D.; Lim, S.I. Lactobacillus plantarum Strain Ln4 attenuates diet-induced obesity, insulin tesistance, and changes in hepatic mRNA levels associated with glucose and lipid metabolism. Nutrients 2018, 10, 643. [Google Scholar] [CrossRef] [Green Version]
- Song, G.H.; Park, E.S.; Lee, S.M.; Park, D.B.; Park, K.Y. Beneficial outcomes of kimchi prepared with amtak baechu cabbage and salting in brine solution: Anticancer effects in pancreatic and hepatic cancer cells. J. Environ. Pathol. Toxicol. Oncol. 2018, 37, 151–161. [Google Scholar] [CrossRef]
- Han, Y.M.; Kang, E.A.; Park, J.M.; Oh, J.Y.; Lee, D.Y.; Choi, S.H.; Hahm, K.B. Dietary intake of fermented kimchi prevented colitis-associated cancer. J. Clin. Biochem. Nutr. 2020, 67, 263–273. [Google Scholar] [CrossRef]
- Bousquet, J.; Cristol, J.P.; Czarlewski, W.; Anto, J.M.; Martineau, A.; Haahtela, T.; Fonseca, S.C.; Iaccarino, G.; Blain, H.; Fiocchi, A.; et al. Nrf2-interacting nutrients and COVID-19: Time for research to develop adaptation strategies. Clin. Transl. Allergy 2020, 10, 58. [Google Scholar] [CrossRef] [PubMed]
- Bousquet, J.; Anto, J.M.; Czarlewski, W.; Haahtela, T.; Fonseca, S.C.; Iaccarino, G.; Blain, H.; Vidal, A.; Sheikh, A.; Akdis, C.A.; et al. Cabbage and fermented vegetables: From death rate heterogeneity in countries to candidates for mitigation strategies of severe COVID-19. Allergy 2021, 76, 735–750. [Google Scholar] [CrossRef]
- Park, C.M.; Kim, G.M.; Cha, G.S. Biotransformation of flavonoids by newly isolated and characterized Lactobacillus pentosus NGI01 strain from kimchi. Microorganisms 2021, 9, 1075. [Google Scholar] [CrossRef]
- Kim, D.; Choi, Y.; Kim, S.; Ha, J.; Oh, H.; Lee, Y.; Kim, Y.; Seo, Y.; Park, E.; Kang, J.; et al. Lactobacillus fermentum SMFM2017-NK4 isolated from kimchi can prevent obesity by inhibiting fat accumulation. Foods 2021, 10, 772. [Google Scholar] [CrossRef]
- Kim, Y.; Yoon, S.; Shin, H.; Jo, M.; Lee, S.; Kim, S.H. Isolation of the cholesterol-assimilating strain Pediococcus acidilactici LRCC5307 and production of low-cholesterol butter. Food Sci. Anim. Resour. 2021, 41, 300–311. [Google Scholar] [CrossRef]
- KATI. 2021. Available online: https://www.kati.net/product/basisInfo.do?lcdCode=MD161 (accessed on 13 September 2021).
- Mannaa, M.; Seo, Y.S.; Park, I. Effect of Seafood (Gizzard Shad) supplementation on the chemical composition and microbial dynamics of radish kimchi during fermentation. Sci. Rep. 2019, 9, 17693. [Google Scholar] [CrossRef] [PubMed]
- Lee, M.; Song, J.H.; Park, J.M.; Chang, J.Y. Bacterial diversity in Korean temple kimchi fermentation. Food Res. Int. 2019, 126, 108592. [Google Scholar] [CrossRef] [PubMed]
- Kang, M.; Park, J.; Yoo, S. Effect of clove powder on quality characteristics and shelf life of kimchi paste. Food Sci. Nutr. 2019, 7, 537–546. [Google Scholar] [CrossRef]
- Lee, H.W.; Yoon, S.R.; Yang, J.S.; Lee, H.M.; Kim, S.J.; Lee, J.Y.; Hwang, I.M.; You, S.Y.; Ha, J.H. Proteomic evaluation of kimchi, a traditional Korean fermented vegetable, and comparison of kimchi manufactured in China and Korea. J. Food Sci. Technol. 2021, 58, 389–396. [Google Scholar] [CrossRef] [PubMed]
- Lee, H.J.; Lee, M.J.; Choi, Y.J.; Park, S.J.; Lee, M.A.; Min, S.G.; Park, S.H.; Seo, H.Y.; Yun, Y.R. Free amino acid and volatile compound profiles of jeotgal alternatives and its application to kimchi. Foods 2021, 10, 423. [Google Scholar] [CrossRef]
- Lee, J.J.; Choi, Y.J.; Lee, M.J.; Park, S.J.; Oh, S.J.; Yun, Y.R.; Min, S.G.; Seo, H.Y.; Park, S.H.; Lee, M.A. Effects of combining two lactic acid bacteria as a starter culture on model kimchi fermentation. Food Res. Int. 2020, 136, 109591. [Google Scholar] [CrossRef] [PubMed]
- Durazzo, A.; Turfani, V.; Azzini, E.; Maiani, G.; Carcea, M. Phenols, lignans and antioxidant properties of legume and sweet chestnut flours. Food Chem. 2013, 140, 666–671. [Google Scholar] [CrossRef]
- Chang, C.C.; Yang, M.H.; Wen, H.M.; Cherrn, J.C. Estimation of total flavonoid content in propolis by two complementary colorimetric methods. J. Food Drug Anal. 2002, 10, 178–182. [Google Scholar] [CrossRef]
- Blois, M.S. Antioxidant determinations by the use of a stable free radical. Nature 1958, 181, 1199–1200. [Google Scholar] [CrossRef]
- KS Standard. 2018. Available online: https://e-ks.kr/streamdocs/view/sd;streamdocsId=72059197478333381 (accessed on 13 September 2021).
- Yoon, S.R.; Dang, Y.M.; Kim, S.Y.; You, S.Y.; Kim, M.K.; Ha, J.H. Correlating capsaicinoid levels and physicochemical proper-ties of kimchi and its perceived spiciness. Foods 2021, 10, 86. [Google Scholar] [CrossRef]
- Kim, D.W.; Kim, B.M.; Lee, H.J.; Jang, G.J.; Song, S.H.; Lee, J.I.; Lee, S.B.; Shim, J.M.; Lee, K.W.; Kim, J.H.; et al. Effects of different salt treatments on the fermentation metabolites and bacterial profiles of kimchi. J. Food Sci. 2017, 82, 1124–1131. [Google Scholar] [CrossRef]
- Cheigh, H.S.; Park, K.Y. Biochemical, microbiological, and nutritional aspects of kimchi (Korean fermented vegetable products). Crit. Rev. Food Sci. Nutr. 1994, 34, 175–203. [Google Scholar] [CrossRef]
- Koo, O.K.; Lee, S.J.; Chung, K.R.; Jang, D.J.; Yang, H.J.; Kwon, D.Y. Korean traditional fermented fish products: Jeotgal. J. Ethn. Foods 2016, 3, 107–116. [Google Scholar] [CrossRef] [Green Version]
- Aarnikunnas, J.; Rönnholm, K.; Palva, A. The mannitol dehydrogenase gene (mdh) from Leuconostoc mesenteroides is distinct from other known bacterial mdh genes. Appl. Microbiol. Biotechnol. 2002, 59, 665–671. [Google Scholar] [CrossRef]
- Hawer, W.D.; Ha, J.H.; Seog, H.M.; Nam, Y.J.; Shin, D.W. Changes in the taste and flavour compounds of kimchi during fermentation. Korean J. Food Sci. Technol. 1988, 20, 511–517. [Google Scholar]
- Park, S.E.; Seo, S.H.; Kim, E.J.; Byun, S.; Na, C.S.; Son, H.S. Changes of microbial community and metabolite in kimchi inoculated with different microbial community starters. Food Chem. 2019, 274, 558–565. [Google Scholar] [CrossRef] [PubMed]
- Park, B.; Yang, J.S.; Moon, E.W.; Seo, H.Y.; Ha, J.H. Influence of capsaicinoids content on the microbial community during kimchi fermentation. J. Microbiol. Biotechnol. 2019, 29, 1580–1590. [Google Scholar] [CrossRef] [PubMed]
- Park, B.; Hwang, H.; Chang, J.Y.; Hong, S.W.; Lee, S.H.; Jung, M.Y.; Sohn, S.O.; Park, H.W.; Lee, J.H. Identification of 2-hydroxyisocaproic acid production in lactic acid bacteria and evaluation of microbial dynamics during kimchi ripening. Sci. Rep. 2017, 7, 10904. [Google Scholar] [CrossRef] [PubMed]
- Burdock, G.A. Encyclopedia of Food and Color Additives; CRC Press: Boca Raton, FL, USA, 1996; p. 2152. [Google Scholar]
- Surburg, H.; Panten, J. Common Fragrance and Flavor Materials: Preparation, Properties and Uses, 6th ed.; John Wiley & Sons: Hoboken, NJ, USA, 2016. [Google Scholar]
- Api, A.M.; Belsito, D.; Botelho, D.; Bruze, M.; Burton, G.A., Jr.; Buschmann, J.; Dagli, M.L.; Date, M.; Dekant, W.; Deodhar, C.; et al. RIFM fragrance ingredient safety assessment, 1-methoxyhexane, CAS Registry Number 4747-07-3. Food Chem Toxicol. 2018, 122 (Suppl. 1), S336–S341. [Google Scholar] [CrossRef]
- Jung, J.Y.; Lee, S.H.; Lee, H.J.; Seo, H.Y.; Park, W.S.; Jeon, C.O. Effects of Leuconostoc mesenteroides starter cultures on microbial communities and metabolites during kimchi fermentation. Int. J. Food Microbiol. 2012, 153, 378–387. [Google Scholar] [CrossRef] [PubMed]
- Jeong, S.H.; Lee, S.H.; Jung, J.Y.; Choi, E.J.; Jeon, C.O. Microbial succession and metabolite changes during long-term storage of Kimchi. J. Food Sci. 2013, 78, 763–769. [Google Scholar] [CrossRef]
- Jung, J.Y.; Lee, S.H.; Jeon, C.O. Kimchi microflora: History, current status, and perspectives for industrial kimchi production. Appl. Microbiol. Biotechnol. 2014, 98, 2385–2393. [Google Scholar] [CrossRef]
- Song, H.S.; Whon, T.W.; Kim, J.; Lee, S.H.; Kim, J.Y.; Kim, Y.B.; Choi, H.J.; Rhee, J.K.; Roh, S.W. Microbial niches in raw ingredients determine microbial community assembly during kimchi fermentation. Food Chem. 2020, 318, 126481. [Google Scholar] [CrossRef]
- Lee, M.E.; Jang, J.Y.; Lee, J.H.; Park, H.W.; Choi, H.J.; Kim, T.W. Starter cultures for kimchi fermentation. J. Microbiol. Biotechnol. 2015, 25, 559–568. [Google Scholar] [CrossRef]


| Korea | China | United States | |
|---|---|---|---|
| Salinity (%) | 2.00 ± 0.15 NS | 2.06 ± 0.29 | 2.31 ± 0.4 |
| Capsaicinoid (ppm) | 3.75 ± 2.22 NS | 6.15 ± 4.14 | 5.11 ± 5.31 |
| Korea | China | United States | |
|---|---|---|---|
| Na | 9039 ± 911 b | 8023 ± 765 b | 9262 ± 1542 a |
| K | 3677 ± 263 a | 2769 ± 384 b | 3082 ± 485 b |
| Mg | 271.3 ± 57.2 a | 214.9 ± 48.9 b | 226.6 ± 44.3 ab |
| Ca | 355.8 ± 40.1 NS | 341.7 ± 52.0 | 288.4 ± 87.6 |
| Fe | 0.42 ± 0.04 b | 0.48 ± 0.08 ab | 0.55 ± 0.14 a |
| P | 57.0 ± 5.8 a | 49.5 ± 3.8 ab | 44.4 ± 11.23 b |
| S | 47.2 ± 4.9 a | 40.9 ± 7.7 ab | 38.0 ± 7.2 b |
| Zn | 0.52 ± 0.04 a | 0.36 ± 0.05 b | 0.43 ± 0.10 b |
| Korea | China | United States | |
|---|---|---|---|
| Sucrose | 1031 ± 1197 a | 216 ± 241 b | 174 ± 211 b |
| Glucose | 10,239 ± 4934 NS | 5533 ± 4108 | 5962 ± 6321 |
| Fructose | 6733 ± 6148 a | 2916 ± 4333 ab | 1684 ± 3001 b |
| Galactose | 280 ± 88 a | 39 ± 57 b | 71 ± 107 b |
| Mannitol | 9329 ± 3398 b | 13,100 ± 2082 a | 12,158 ± 3879 ab |
| Sorbitol | 3375 ± 3454 a | 491 ± 862 b | 67 ± 25 b |
| Korea | China | United States | |
|---|---|---|---|
| Lactic acid | 7215 ± 1408 c | 15,266 ± 1655 a | 11,820 ± 4693 b |
| Acetic acid | 2998 ± 677 b | 4330 ± 793 a | 3690 ± 649 ab |
| Citric acid | - | - | 43.1 ± 71.9 |
| Fumaric acid | 16.33 ± 15.76 | - | - |
| Et-OH | 2629 ± 1449 b | 7750 ± 4009 a | 4101 ± 2440 b |
| Korea | China | United States | |
|---|---|---|---|
| Aspartic acid | 332.9 ± 74.3 a | 114.5 ± 76.6 b | 120.5 ± 74.8 b |
| Glutamic acid | 1777 ± 342 a | 308 ± 376 b | 357 ± 176 b |
| Asparagine | 552.9 ± 80.1 NS | 563.2 ± 188.3 | 488.8 ± 149.9 |
| Serine | 394.2 ± 55.0 a | 168.0 ± 74.6 b | 135.6 ± 106.2 b |
| Glutamine | 2054 ± 180 a | 1494 ± 322 ab | 1399 ± 774 b |
| Histidine | 215.1 ± 159.0 b | 154.3 ± 86.5 b | 464.4 ± 143.9 a |
| Glycine | 280.4 ± 117.2 a | 217.3 ± 84.2 a | 123.4 ± 46.6 b |
| Threonine | 281.5 ± 35.6 a | 186.7 ± 92.0 b | 190.7 ± 49.0 b |
| Citrulline | 55.0 ± 16.2 a | 46.0 ± 16.2 a | 15.6 ± 9.9 b |
| Arginine | 454.0 ± 325.0 a | 16.4 ± 9.3 b | 150.0 ± 197.1 b |
| Alanine | 1003.7 ± 141.8 a | 1042.0 ± 520.0 a | 648.5 ± 243.0 b |
| Taurine | 26.5 ± 7.7 a | 32.5 ± 15.7 a | 2.8 ± 4.7 b |
| GABA | 433.1 ± 114.7 b | 1406.0 ± 1014.0 a | 436.5 ± 69.3 b |
| Tyrosine | 103.2 ± 41.2 a | 29.4 ± 12.0 b | 36.1 ± 45.5 b |
| Valine | 334.0 ± 27.2 a | 358.9 ± 115.8 a | 249.5 ± 49.6 b |
| Methionine | 88.5 ± 10.6 NS | 100.0 ± 44.1 | 71.2 ± 25.3 |
| Tryptophane | 43.9 ± 7.2 NS | 41.0 ± 53.8 | 59.4 ± 10.0 |
| Phenylalanine | 196.8 ± 13.3 NS | 242.3 ± 97.3 | 186.4 ± 46.6 |
| Isoleucine | 223.8 ± 15.6 ab | 252.2 ± 92.0 a | 164.2 ± 36.8 b |
| Ornithine | 98.6 ± 119.1 NS | 26.9 ± 443.3 | 29.4 ± 32.6 |
| Leucine | 314.1 ± 14.6 NS | 403.5 ± 157.5 | 301.0 ± 79.9 |
| Lysine | 277.3 ± 28.7 a | 108.5 ± 82.1 b | 134.2 ± 60.0 b |
| Proline | 322.7 ± 56.4 b | 520.1 ± 92.3 a | 402.4 ± 98.4 b |
| HICA | 30.5 ± 11.01 NS | 27.0 ± 14.91 | 27.1 ± 20.7 |
| Korea | China | United States | |
|---|---|---|---|
| 1,2-Epithiopropane | 0.03 ± 0.01 b | 0.08 ± 0.08 a | 0.02 ± 0.021 b |
| 1-Methoxyhexane | - | 0.31 ± 0.53 | 0.21 ± 0.21 |
| 1-Pentene-3-ol | 0.08 ± 0.03 a | 0.01 ± 0.01 b | 0.05 ± 0.05 ab |
| 2,3-Butanediol | 0.37 ± 0.24 NS | 0.25 ± 0.12 | 0.31 ± 0.26 |
| 2-Ethyl-1-hexanol | 0.06 ± 0.00 NS | 0.10 ± 0.12 | 0.09 ± 0.03 |
| 3-Methyl-1-butanol | 0.86 ± 1.1 a | 0.38 ± 0.21 ab | 0.17 ± 0.18 b |
| 3-Pentenenitrile | 0.12 ± 0.03 ab | 0.08 ± 0.03 b | 0.15 ± 0.09 a |
| 5-Cyano-1-pentene | 0.50 ± 0.16 b | 0.35 ± 0.20 b | 0.96 ± 0.52 a |
| 6-Methyl-5-hepten-2-ol | 0.24 ± 0.36 NS | 0.04 ± 0.02 | 0.167 ± 0.09 |
| Acetic acid | 1.91 ± 0.40 b | 2.79 ± 0.63 a | 2.56 ± 0.60 a |
| Benzeneethanol | 0.55 ± 0.25 c | 1.50 ± 0.38 a | 1.13 ± 0.48 b |
| Benzenepropanenitrile | 3.77 ± 2.20 NS | 7.45 ± 5.19 | 6.77 ± 7.54 |
| cis-3-Hexene-1-ol | 0.03 ± 0.01 b | 0.05 ± 0.02 ab | 0.10 ± 0.11 a |
| cis-Geraniol | 0.27 ± 0.11 NS | 0.32 ± 0.09 | 0.49 ± 0.43 |
| Diallyl disulfide | 2.33 ± 1.76 a | 0.93 ± 0.86 b | 0.92 ± 1.58 b |
| Diallyl sulfide | 0.03 ± 0.01 NS | 0.02 ± 0.01 | 0.02 ± 0.03 |
| Dimethyl trisulfide | 0.31 ± 0.2 a | 0.24 ± 0.14 a | 0.03 ± 0.03 b |
| endo-Borneol | 0.09 ± 0.06 b | 0.10 ± 0.07 b | 0.21 ± 0.07 a |
| Ethanol | 6.1 ± 6.25 NS | 8.23 ± 3.86 | 5.33 ± 3.13 |
| Ethyl Acetate | 0.12 ± 0.11 NS | 0.16 ± 0.11 | 0.16 ± 0.08 |
| Eucalyptol | 0.02 ± 0.02 b | 0.03 ± 0.02 b | 0.08 ± 0.04 a |
| Eugenol | 0.04 ± 0.02 b | 0.29 ± 0.08 a | 0.09 ± 0.11 b |
| Linalool | 0.10 ± 0.04 NS | 0.14 ± 0.06 | 0.14 ± 0.07 |
| Linalyl_propionate | 0.05 ± 0.02 b | 0.07 ± 0.03 b | 0.15 ± 0.06 a |
| Methyl allylsulfide | 0.09 ± 0.05 a | 0.12 ± 0.06 a | 0.02 ± 0.02 b |
| Methyl disulfide | 1.14 ± 0.86 a | 0.48 ± 0.35 b | 0.04 ± 0.03 b |
| Octanoic acid | 0.44 ± 0.26 a | 0.11 ± 0.05 b | 0.14 ± 0.07 b |
| S-Methyl thioacetate | 0.07 ± 0.08 b | 0.43 ± 0.35 a | 0.03 ± 0.03 b |
| Zingiberene | 0.33 ± 0.66 NS | 0.02 ± 0.02 | 0.39 ± 0.24 |
| α-Curcumene | 0.13 ± 0.15 b | 0.05 ± 0.05 b | 0.18 ± 0.11 a |
| β-Bisabolene | 0.09 ± 0.09 ab | 0.02 ± 0.03 b | 0.13 ± 0.09 a |
| β-Phenethyl acetate | 5.05 ± 6.07 a | 0.31 ± 0.31 b | 0.03 ± 0.02 b |
| β-Phenethyl_isothiocyanate | 0.42 ± 0.24 b | 0.60 ± 0.43 ab | 0.88 ± 0.59 a |
| β-Sesquiphellandrene | 0.09 ± 0.11 ab | 0.08 ± 0.14 b | 0.15 ± 0.10 a |
| Korea | China | United States | |
|---|---|---|---|
| TPC (μg/mL) | 47.12 ± 2.30 a | 38.90 ± 0.98 b | 38.52 ± 0.12 b |
| TFC (μg/mL) | 10.26 ± 1.49 NS | 9.15 ± 1.79 | 8.47 ± 2.16 |
| DPPH (%) | 44.34 ± 1.28 a | 41.87 ± 1.82 a | 34.34 ± 1.45 b |
| TAC (μM) | 3556.44 ± 113.08 a | 2734.67 ± 87.93 b | 2816 ± 37.46 b |
| FRAP (μM) | 1956.56 ± 19.05 a | 1398.95 ± 5.16 b | 1414.32 ±32.59 b |
Publisher’s Note: MDPI stays neutral with regard to jurisdictional claims in published maps and institutional affiliations. |
© 2021 by the authors. Licensee MDPI, Basel, Switzerland. This article is an open access article distributed under the terms and conditions of the Creative Commons Attribution (CC BY) license (https://creativecommons.org/licenses/by/4.0/).
Share and Cite
Yun, Y.-R.; Lee, J.J.; Lee, H.J.; Choi, Y.-J.; Lee, J.-H.; Park, S.J.; Park, S.H.; Seo, H.-Y.; Min, S.G. Comparison of Quality Characteristics of Commercial Kimchi Manufactured in Korea, China, and the United States. Foods 2021, 10, 2488. https://doi.org/10.3390/foods10102488
Yun Y-R, Lee JJ, Lee HJ, Choi Y-J, Lee J-H, Park SJ, Park SH, Seo H-Y, Min SG. Comparison of Quality Characteristics of Commercial Kimchi Manufactured in Korea, China, and the United States. Foods. 2021; 10(10):2488. https://doi.org/10.3390/foods10102488
Chicago/Turabian StyleYun, Ye-Rang, Jin Ju Lee, Hye Jin Lee, Yun-Jeong Choi, Jong-Hee Lee, Sung Jin Park, Sung Hee Park, Hye-Young Seo, and Sung Gi Min. 2021. "Comparison of Quality Characteristics of Commercial Kimchi Manufactured in Korea, China, and the United States" Foods 10, no. 10: 2488. https://doi.org/10.3390/foods10102488
APA StyleYun, Y.-R., Lee, J. J., Lee, H. J., Choi, Y.-J., Lee, J.-H., Park, S. J., Park, S. H., Seo, H.-Y., & Min, S. G. (2021). Comparison of Quality Characteristics of Commercial Kimchi Manufactured in Korea, China, and the United States. Foods, 10(10), 2488. https://doi.org/10.3390/foods10102488