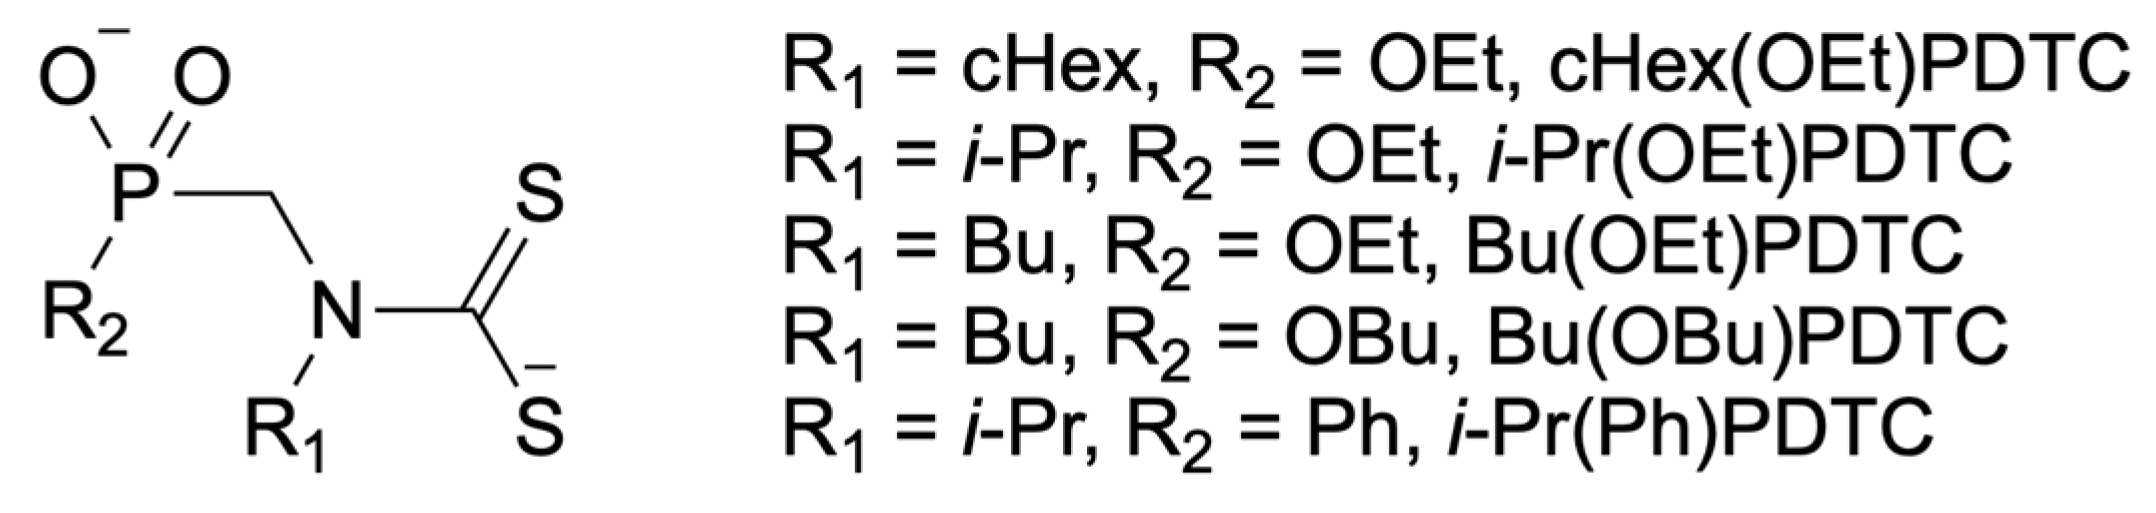
2.2. Copper(II) Complexes with PDTC
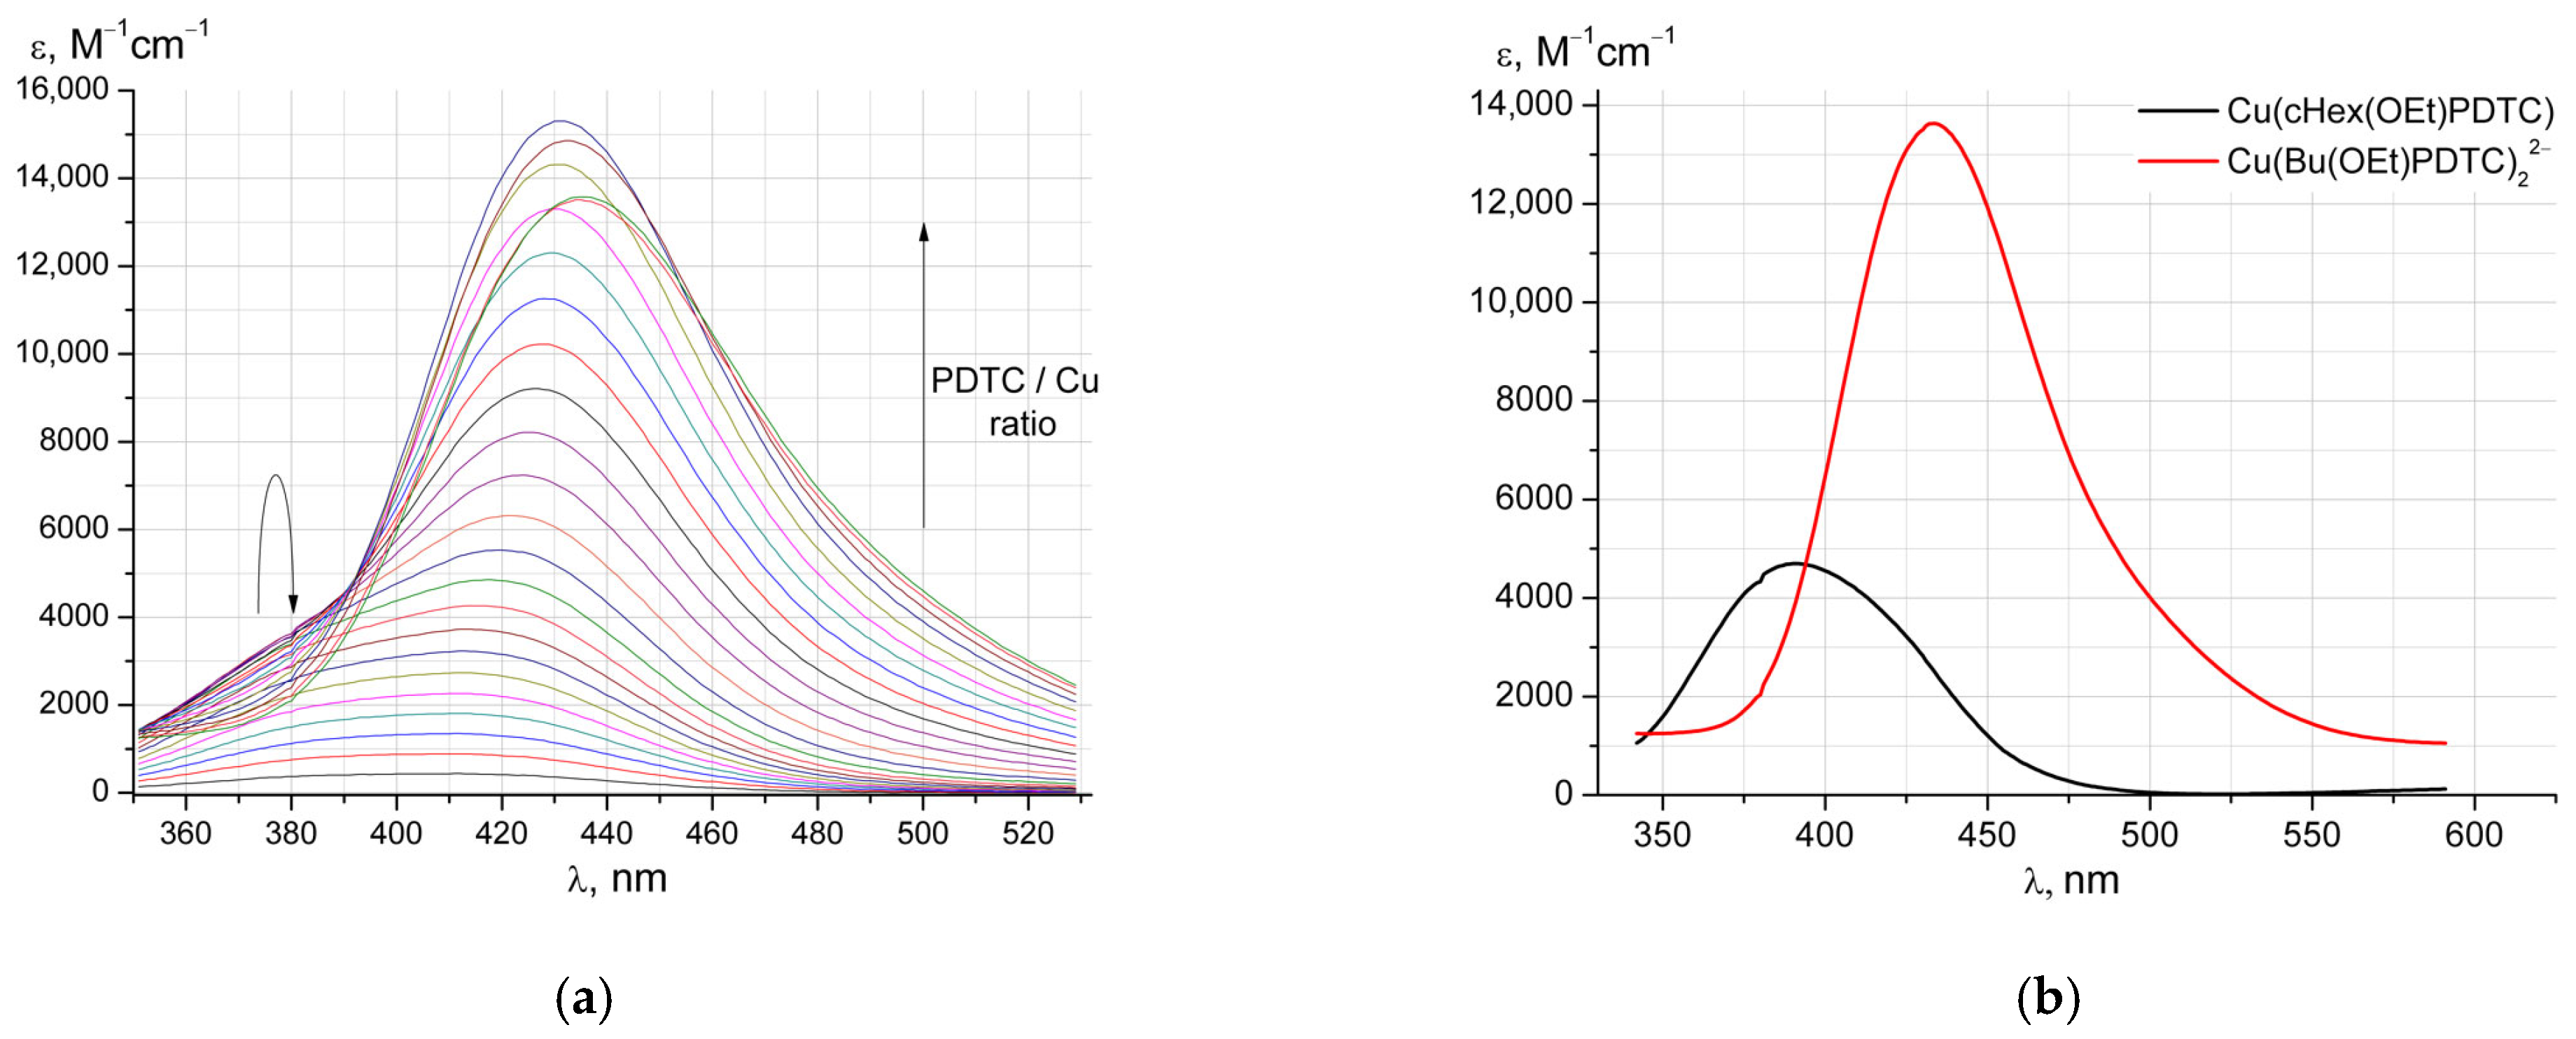
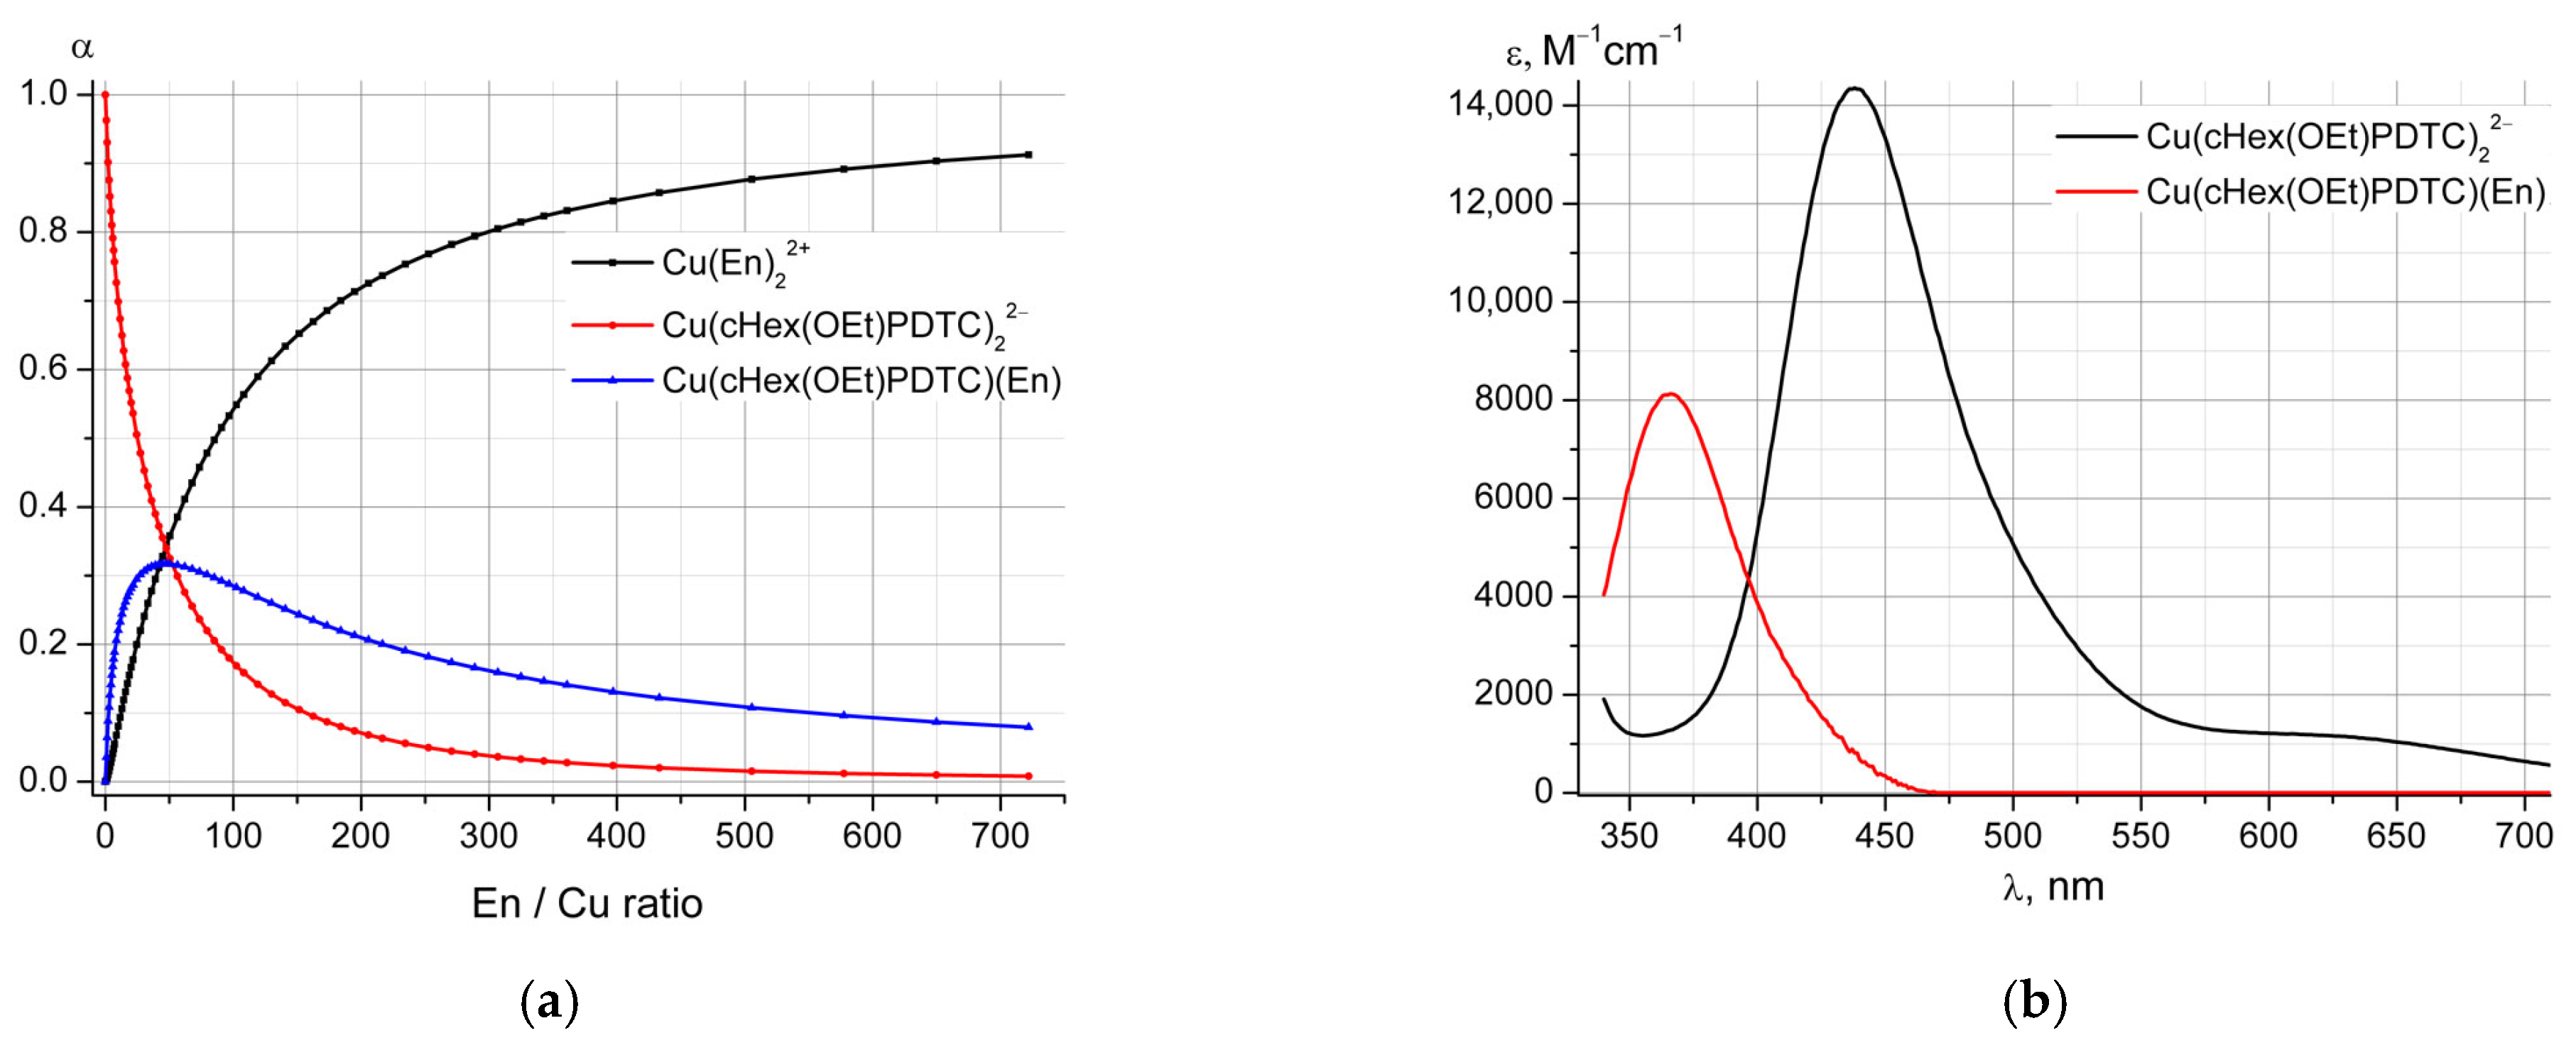
To determine the composition of complex forms in the copper(II)—PDTC systems, spectrophotometric titrations were performed in which the copper aqua ion in a neutral medium was titrated with the ligand. As can be seen from
Figure 1a, two complex forms, Cu(PDTC) and Cu(PDTC)
22−, are successively formed in the system as the carbamate/copper ratio increases. Although it is not possible to determine the complex formation constants directly from the results of these experiments because the constants of the mono- and
bis-forms are correlated, their individual absorption spectra were reconstructed using mathematical modeling with the STALABS program (version 2.0.4) [
13,
14] and are shown in
Figure 1b. When conducting a similar titration whilst maintaining the pH of the medium in the alkaline region, the formation of only one complex form, Cu(PDTC)
22−, was observed.
It should be mentioned that the intense absorption observed at 435 nm (ε = 13,500 M
−1cm
−1) for the copper(II)
bis-complex with phosphorylated dithiocarbamate in aqueous media (
Figure 1b) is in good agreement with similar values reported for “classic” copper(II) dithiocarbamate complexes in organic solvents (Cu(S
2CNEt
2)
2, λ
max = 435 nm, ε = 13,000 M
−1cm
−1) [
3].
The formation of the forms Cu(PDTC) and Cu(PDTC)
22− is confirmed by the EPR spectra, which are shown in the
Figures S1-10–S1-13; the parameters are given in
Table 1.
The EPR spectrum of a copper(II) solution with PDTC in a 5:1 ratio at pH 5 (
Figure S1-10) shows the formation of only one complex form with dithiocarbamate. In total, 20% of the copper(II) ions are bound in the complex, while 80% remain as the aqua ion; accordingly, the composition of this complex form is Cu(PDTC). The EPR spectra of copper(II) solutions with PDTC in a 1:2 ratio at pH 10.2 and pH 13.2 (
Figures S1-12 and S1-13) differ, indicating the formation of the Cu(PDTC)
2(OH)
3− complex only in highly alkaline media. A comparison of the simulated EPR spectra of all three complex forms is shown in
Figure S1-13.
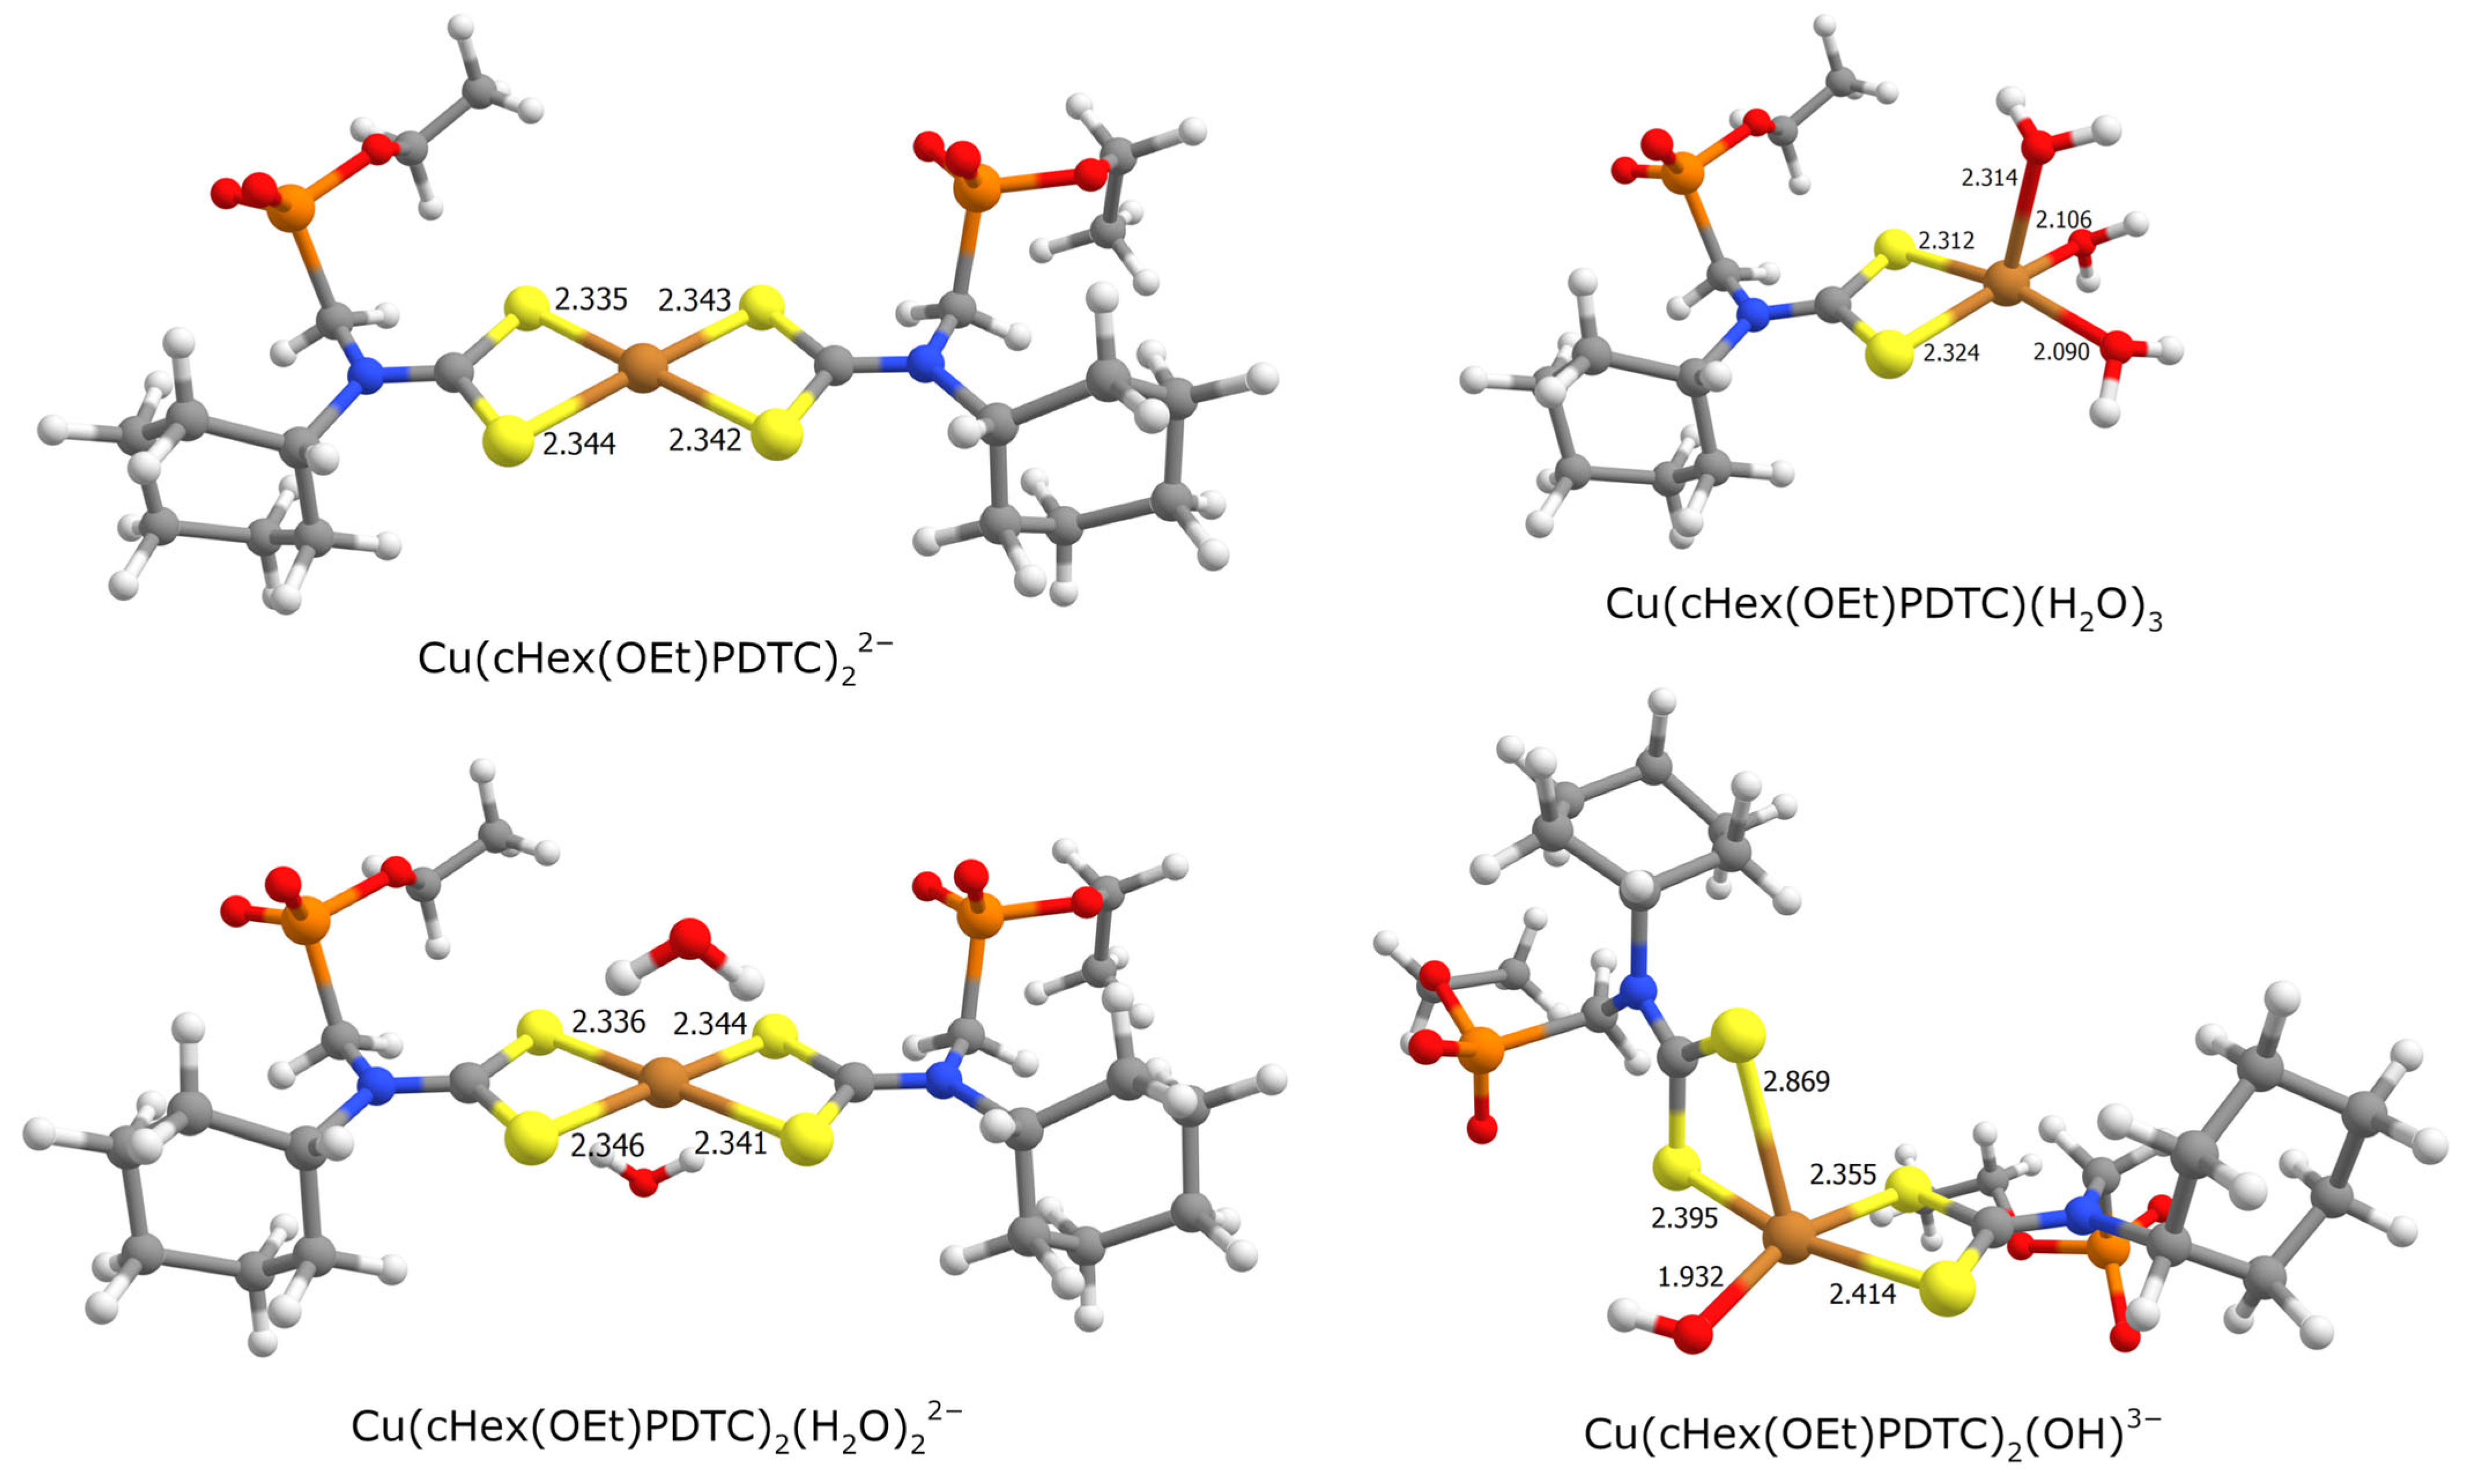
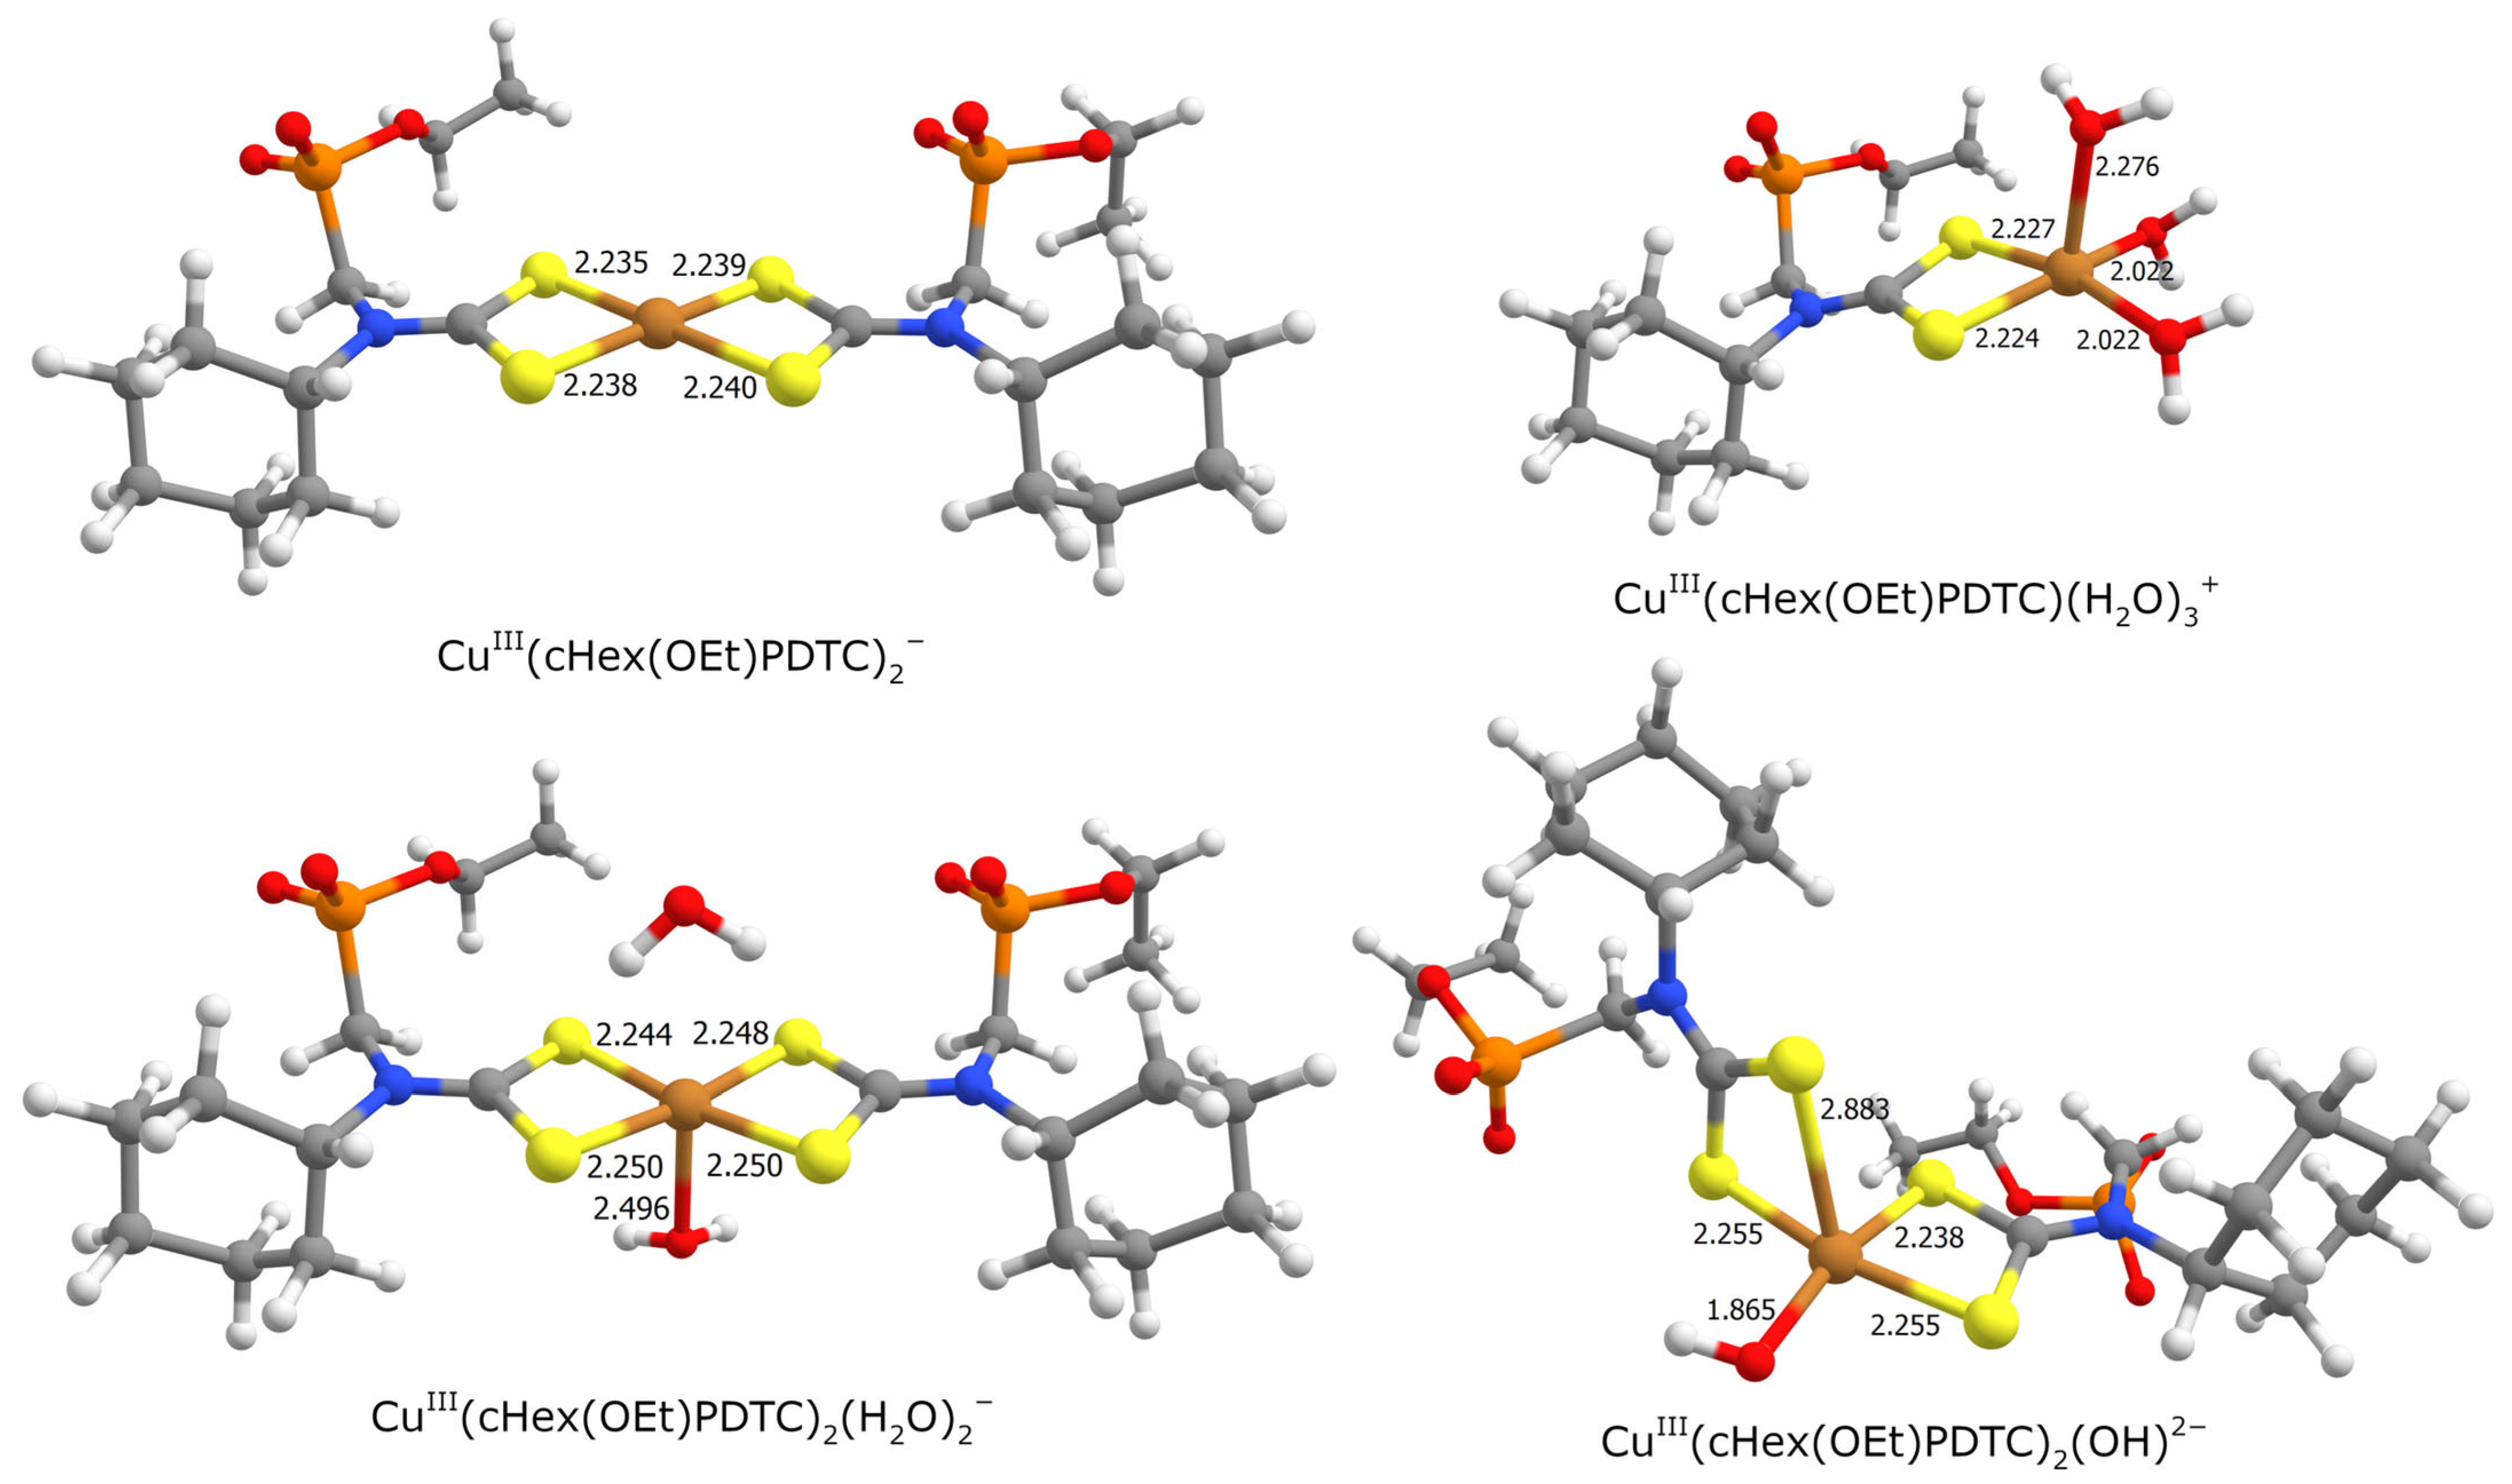
Calculated structures of the copper(II) complexes with phosphorylated dithiocarbamates are shown in
Figure 2 (all optimized structures can be found in ESI2,
Figures S2-1–S2-28, S2-59–S2-76, S2-97–S2-114, S2-137–S2-140). The central atom has a square-planar arrangement in the Cu(PDTC)
22− form (similar to the copper(II)
bis-complexes with “classic” dithiocarbamates; see [
3])—additional water molecules leave the axial positions during the optimization process (the structure with two water molecules is shown in
Figure 2 and with one water molecule in ESI2,
Figure S2-21). Quantum-chemical calculations using the TD-DFT method give relatively good agreement between the modeled (453 nm; see
Figures S2-2 and S2-4, ESI2) and experimental (435 nm; see
Figure 1 and text above) positions of the absorption maximum for the copper(II)
bis-complex.
In the Cu(PDTC)
2(OH)
3− form, the hydroxy group is placed in the equatorial plane (see
Figure 2), and one of the dithiocarbamate ligands becomes equatorially axially coordinated, with the coordination bond to the axial sulfur atom being significantly longer (difference of approximately 0.5 Å) than those to the equatorial sulfur atoms. It should be mentioned that a similar structure is obtained even if the hydroxy group is initially placed in an axial position, but during the optimization it shifts to the equatorial position with the replacement of the equatorial sulfur atom. Such a structure is consistent with the EPR data (see
Table 1 and
Figure S1-13), where a sufficiently large change in g
0 is observed for the hydroxy complex compared to Cu(PDTC)
22−. Axial coordination of OH
− would likely result in a much smaller increase in
g0. For example, the change in
g0 upon the formation of [CuLH
−3]
2− complex with triglycine from [CuLH
−2]
− is only 0.005 [
15]. Therefore, axial coordination of a dithiocarbamate sulfur atom should be assumed in the case of Cu(PDTC)
2(OH)
3−.
It should be noticed that in the hydroxy-form of the
bis-complex and in the complex with one PDTC ligand (
Figure 2), the complex former has a distorted square-pyramidal coordination arrangement, which is typical for copper(II) complexes with N,O-containing ligands [
16,
17].
2.3. Oxidation of Copper(II) Complexes
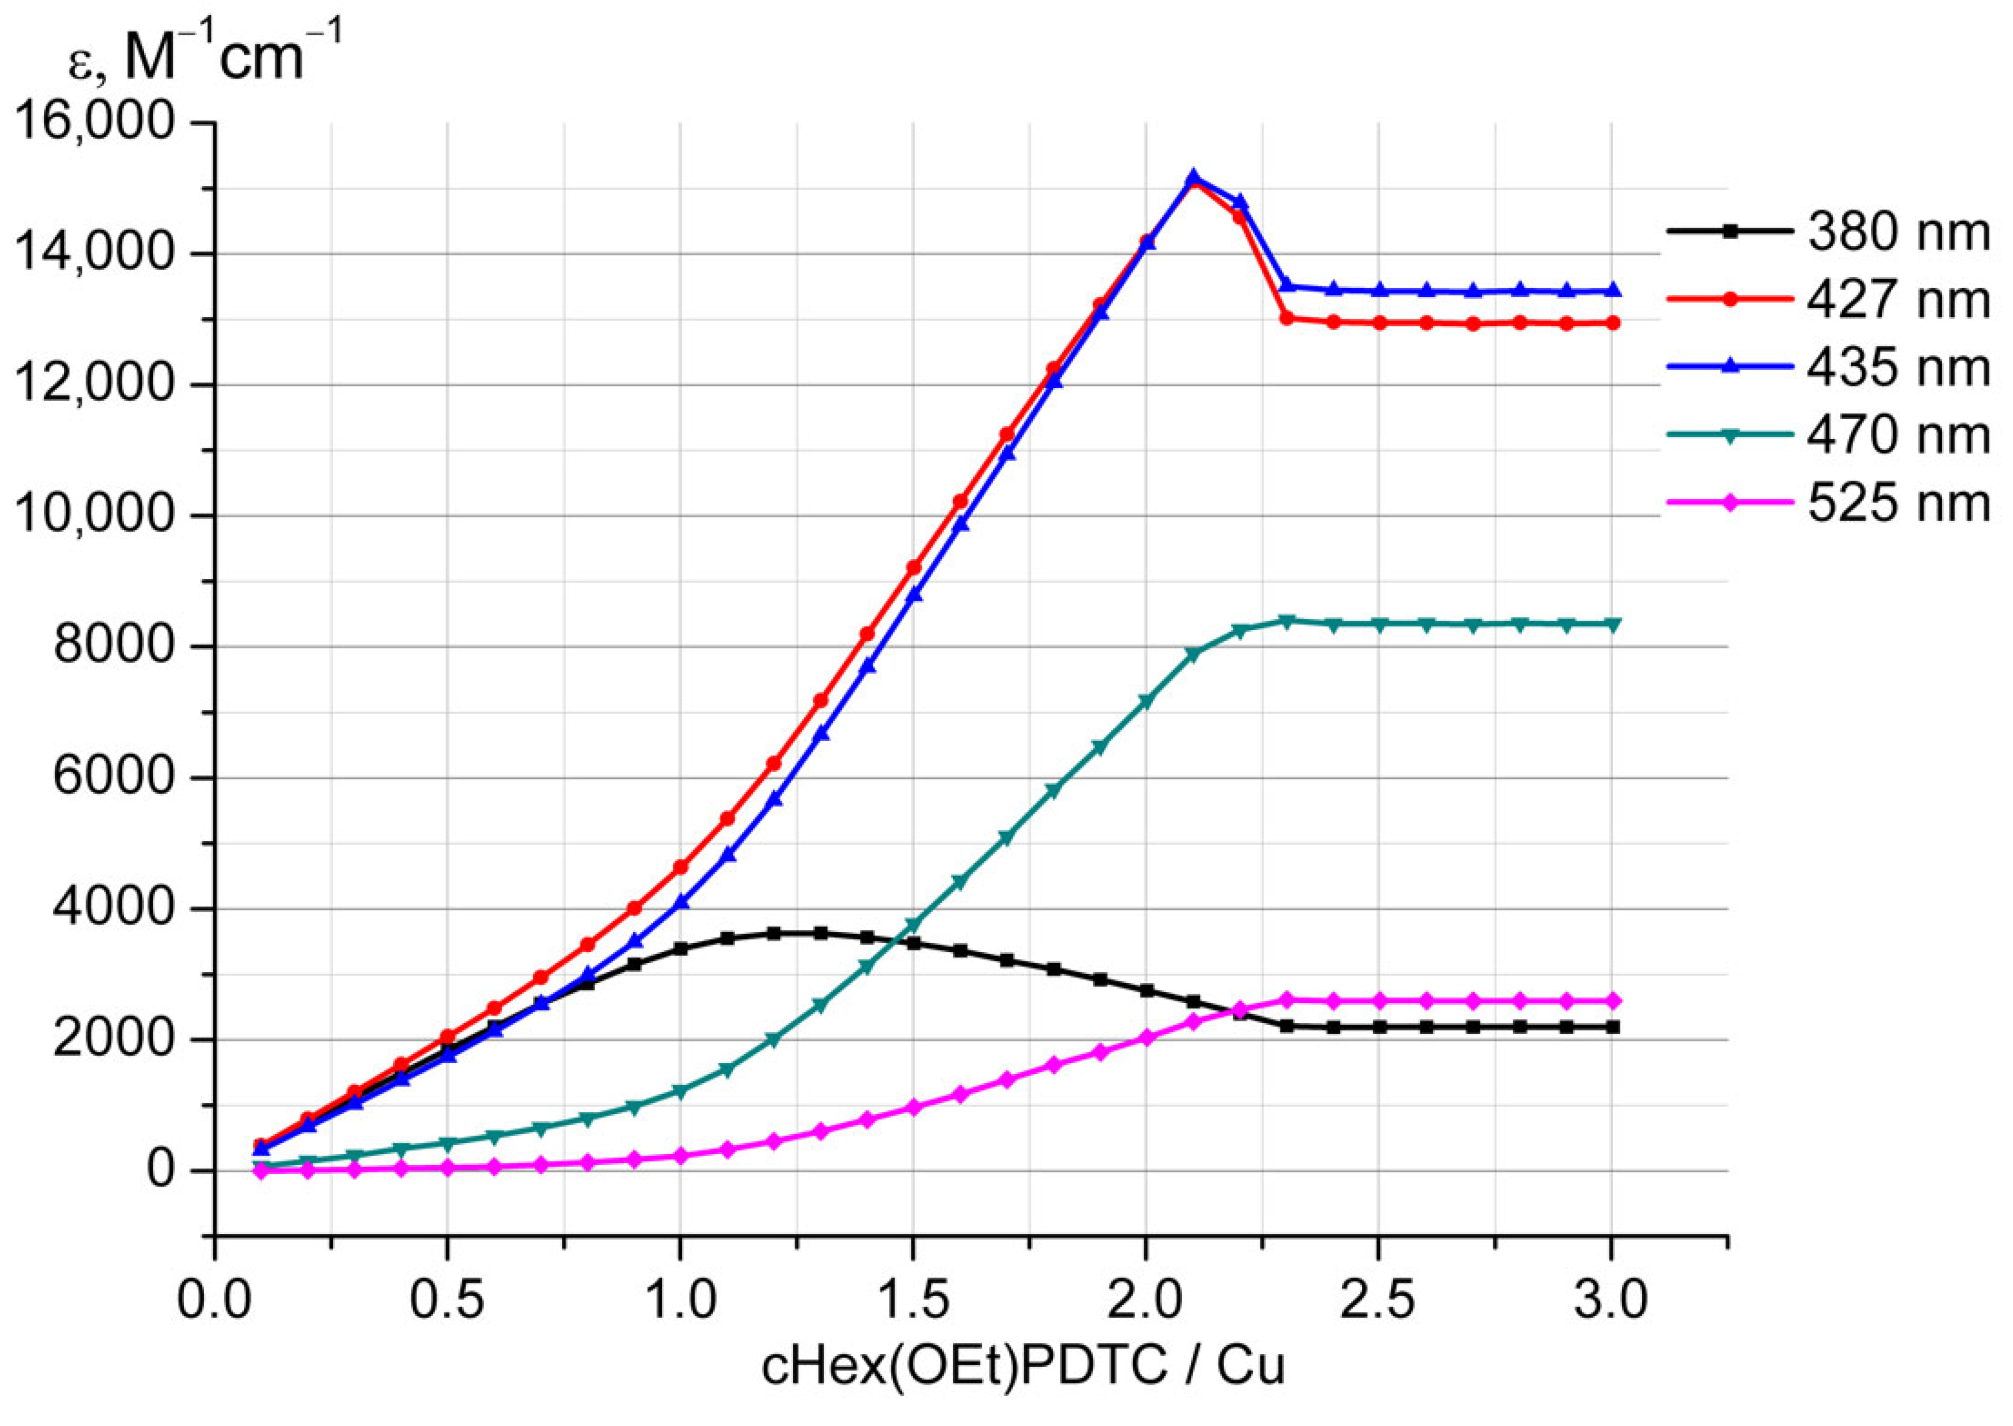
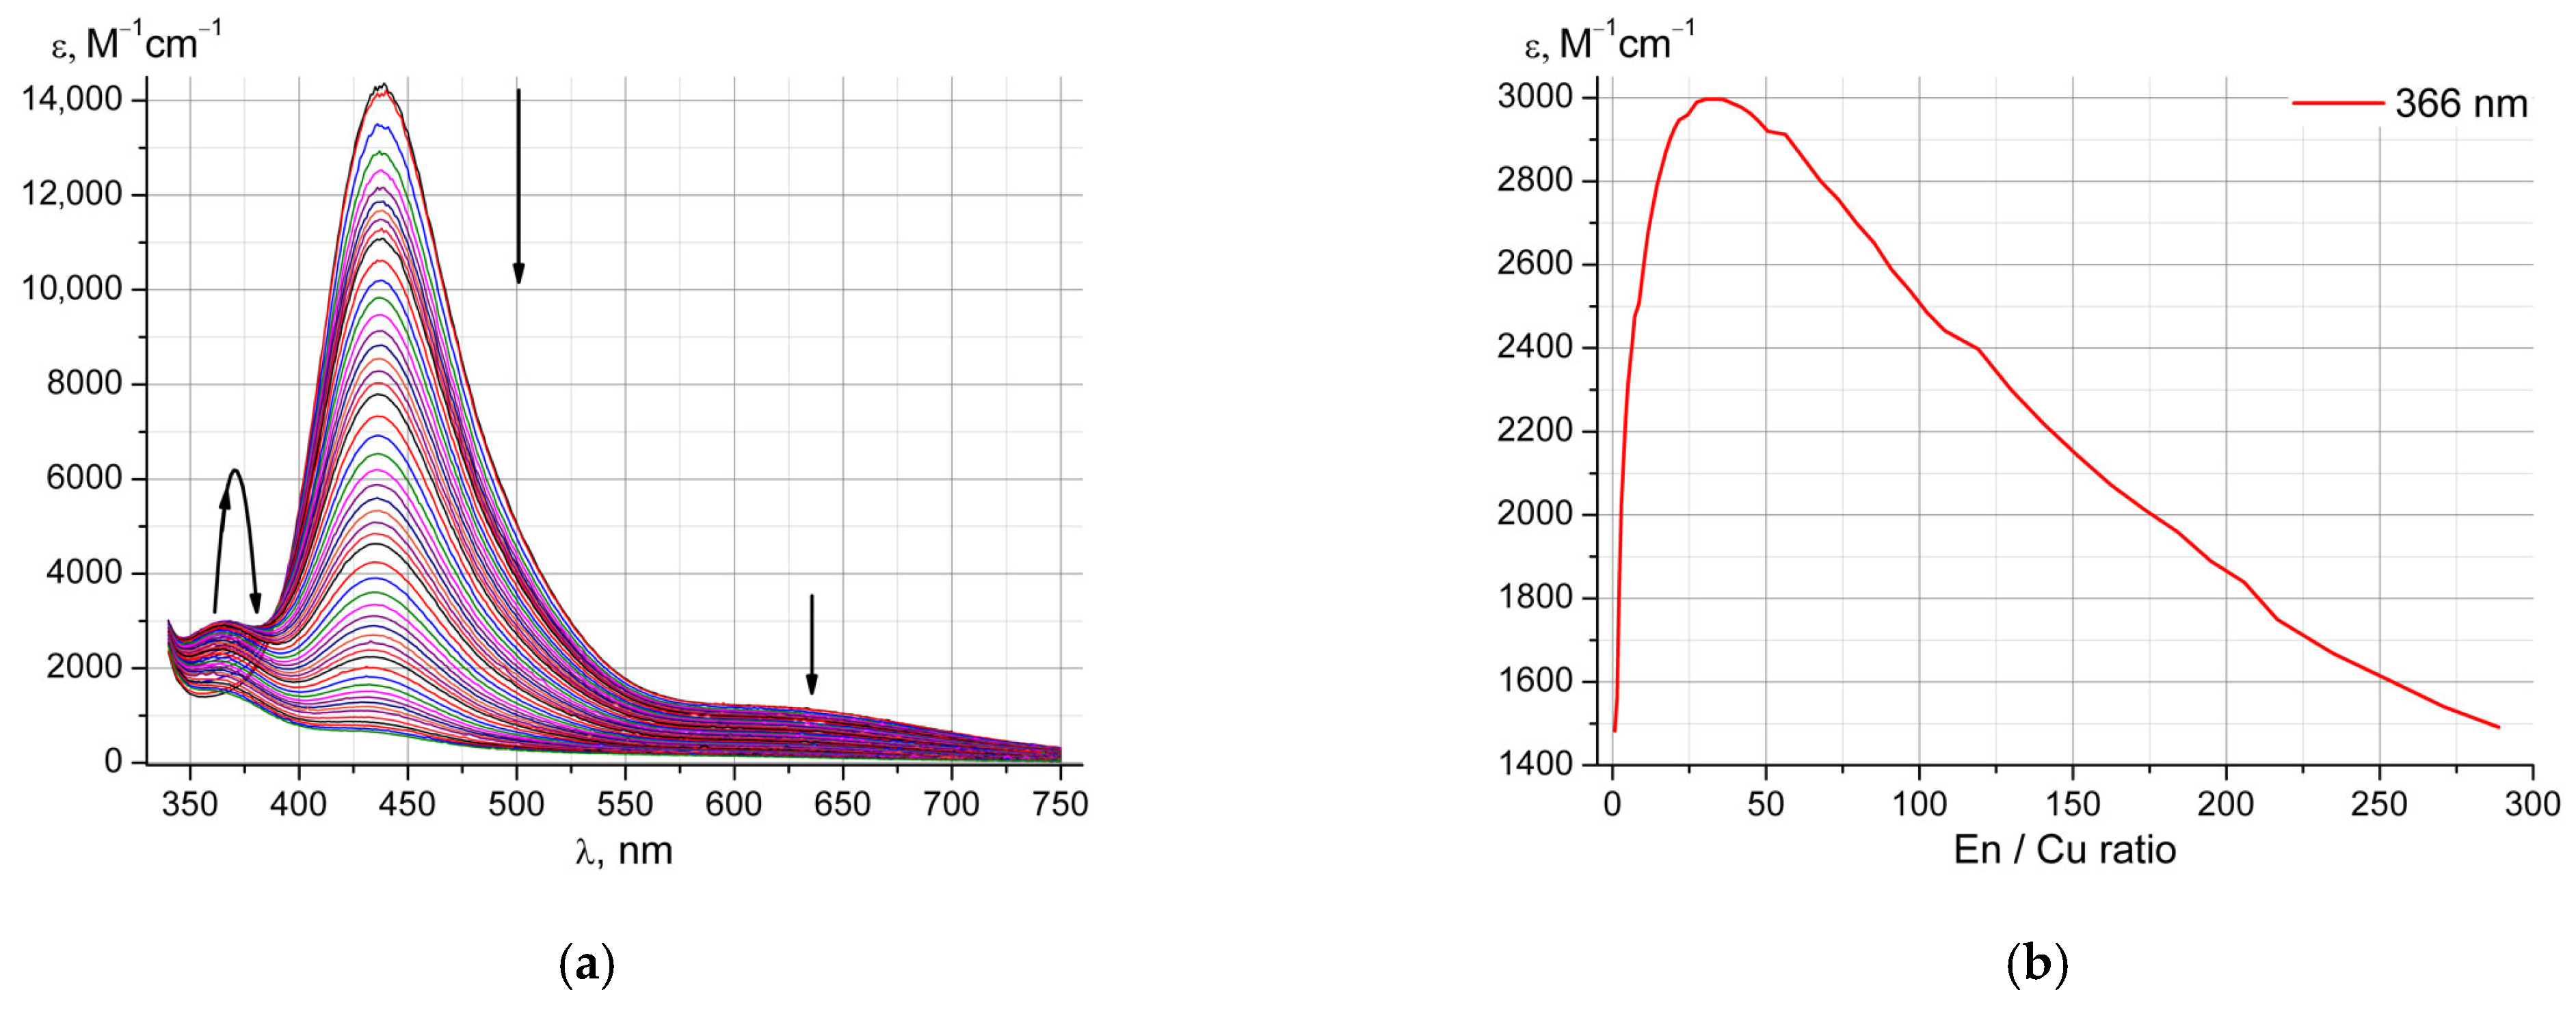
Interestingly, when the solution extinction coefficients during substitution titration of the copper(II) aqua ion with PDTC in neutral medium in the presence of dissolved oxygen are plotted against the PDTC/Cu(II) ratio (
Figure 3), at a ratio slightly greater than two, a strange sharp inflection and a decrease in absorption are observed at the absorption peak wavelength of the
bis-dithiocarbamate complex, accompanied by a shift in the wavelength of the absorption maximum. When similar titrations are performed in alkaline media or after sparging all solutions with argon, no such effects are observed.
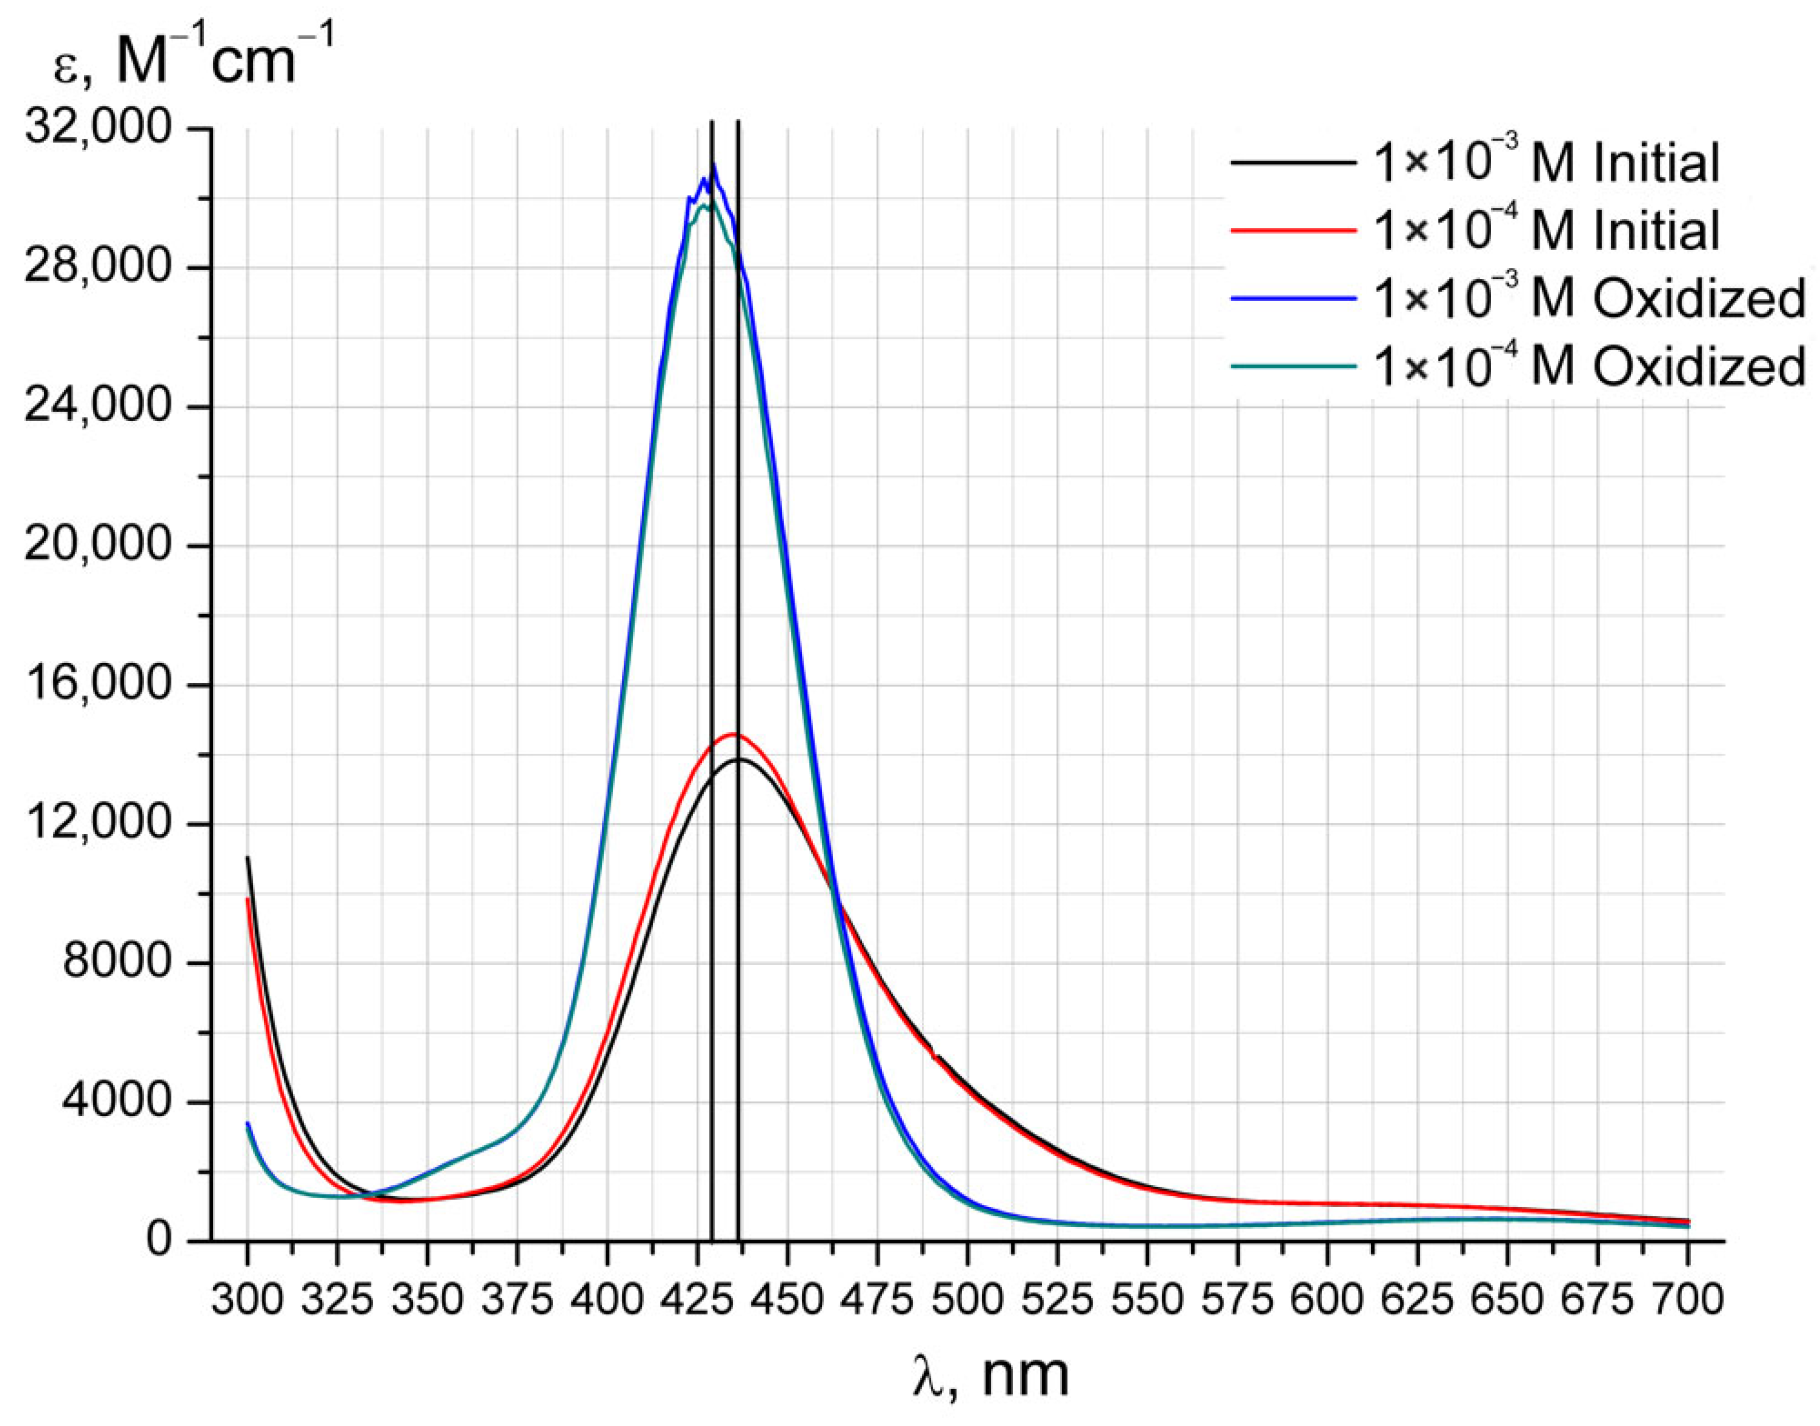
Such a sharp jump in a narrow range of ligand concentration may indicate a transition between complex forms unrelated to a change in the copper coordination sphere. Since phosphorylated dithiocarbamates, like alkyl and aryl dithiocarbamates, can act as reducing agents, and when an excess of ligand is added to the oxidized form of the copper complex, the former could theoretically reduce copper(III) to copper(II). To investigate this, the absorption spectrum of a copper(II) solution with PDTC in a 1:2.5 ratio was recorded after heterophase oxidation with iodine in benzene (
Figure 4). Additionally, the absorption spectrum of the initial and oxidized solutions was recorded after 10-fold dilution to test the hypothesis of binuclear complex formation. It should be noted that after oxidation of the complex with excess iodine, further oxidation of the coordinated ligands occurs, leading to complex decomposition and discoloration of the solution.
It is evident that the oxidized form exhibits significantly higher absorption than CuII(PDTC)22−, while the absorption peak wavelength of the oxidized form is shifted by 5–10 nm toward shorter wavelengths. Since the recalculated absorption spectra of the initial and diluted solutions are practically identical, the hypothesis of simple dimerization of CuII(PDTC)22− species can be excluded (or it is possible that the dimeric form has practically the same spectrum). Accordingly, in neutral media with an excess of copper(II) aqua ions and in the presence of dissolved oxygen in the solution, processes occur that lead to the formation of the oxidized complex.
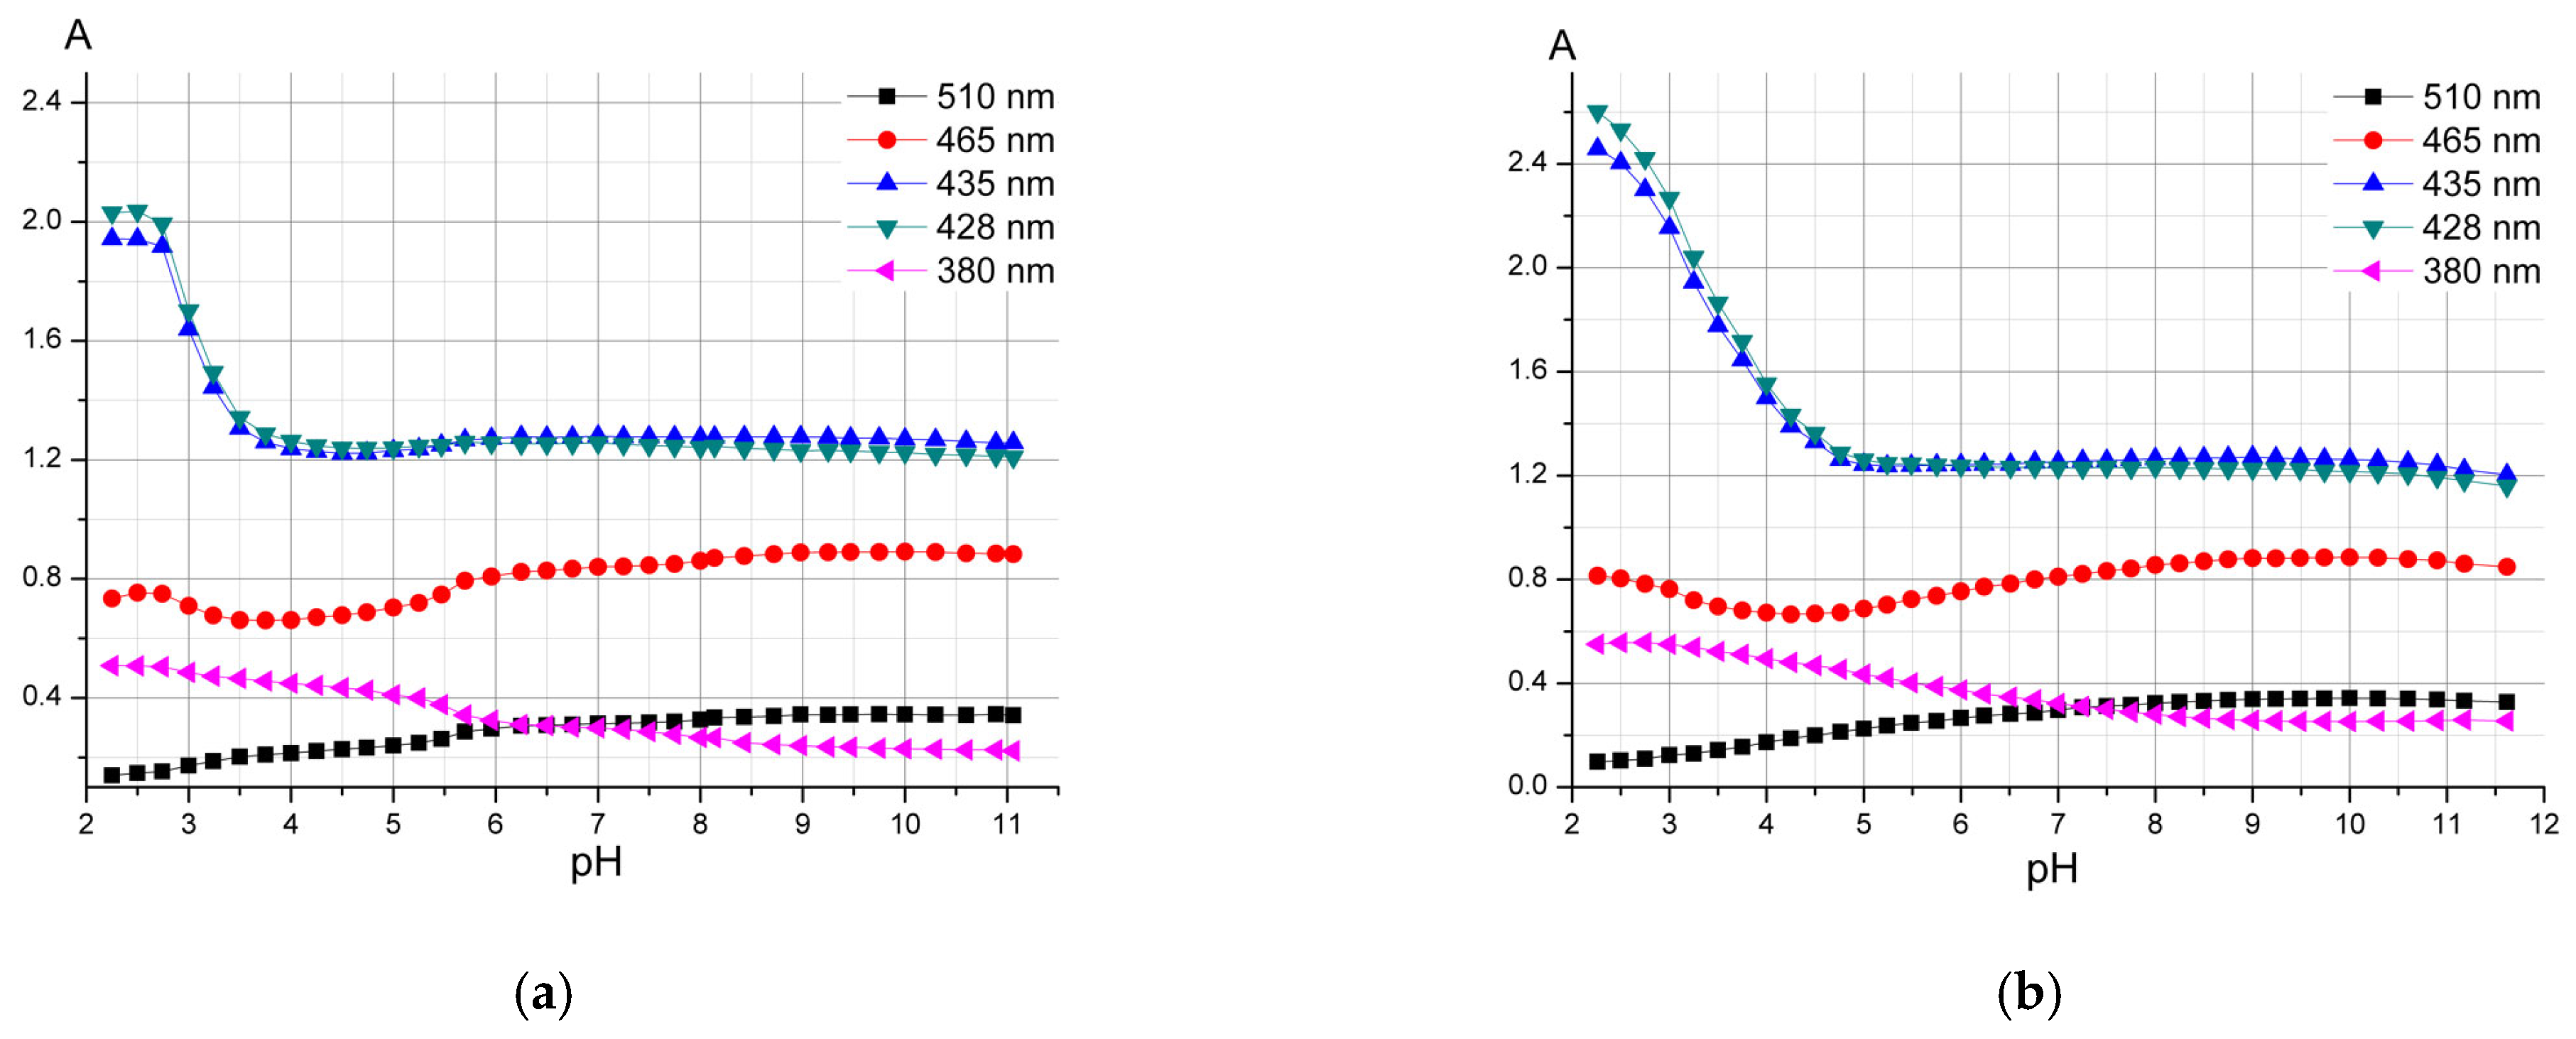
To determine the pH regions in which copper(III) compounds are formed and to evaluate the effect of dissolved oxygen, pH spectrophotometric titrations of the system with a metal/ligand ratio of 1:2 were carried out over a wide pH range with and without argon bubbling (
Figures S1-14, S1-15 and
Figure 5).
Figure 5 shows that when argon is bubbled, changes in the absorption spectrum of the solution occur at pH < 4, whereas without bubbling, changes begin at pH = 5. It is important to note that from the moment changes begin, the process is non-equilibrium. Below pH = 2, a brown precipitate forms in the solution, presumably due to protonation of the phosphonic groups of both ligands, forming a neutral complex (Cu(PDTC)
2H
2), which is slightly soluble in aqueous media.
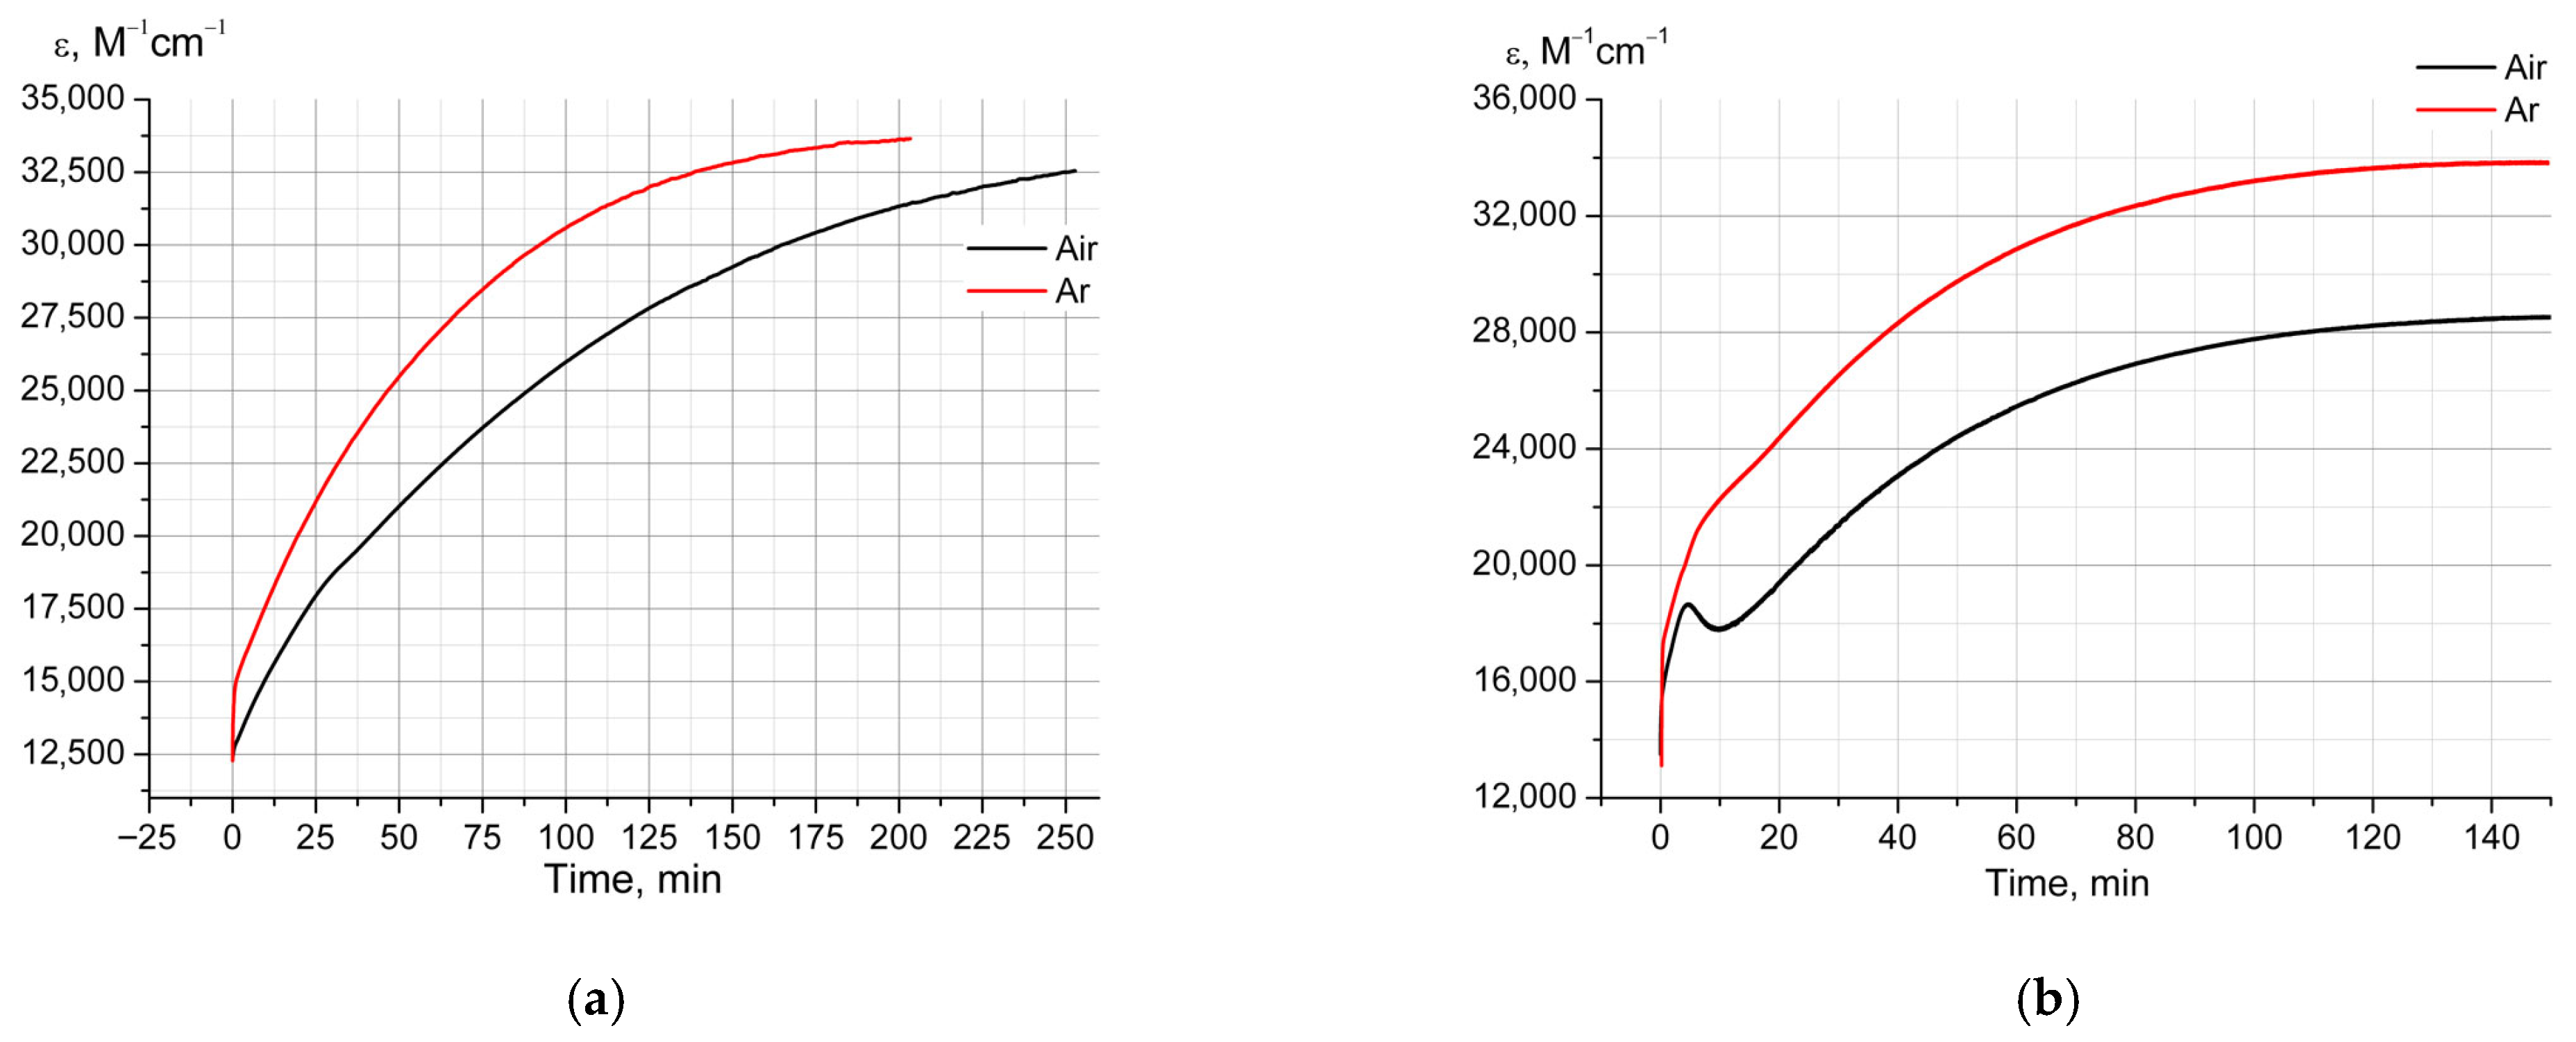
The non-equilibrium nature of the processes in acidic media, as well as the influence of dissolved oxygen, is confirmed by a kinetic experiment in which a copper(II)
bis-dithiocarbamate solution was acidified to pH = 3 using the stopped-flow method (
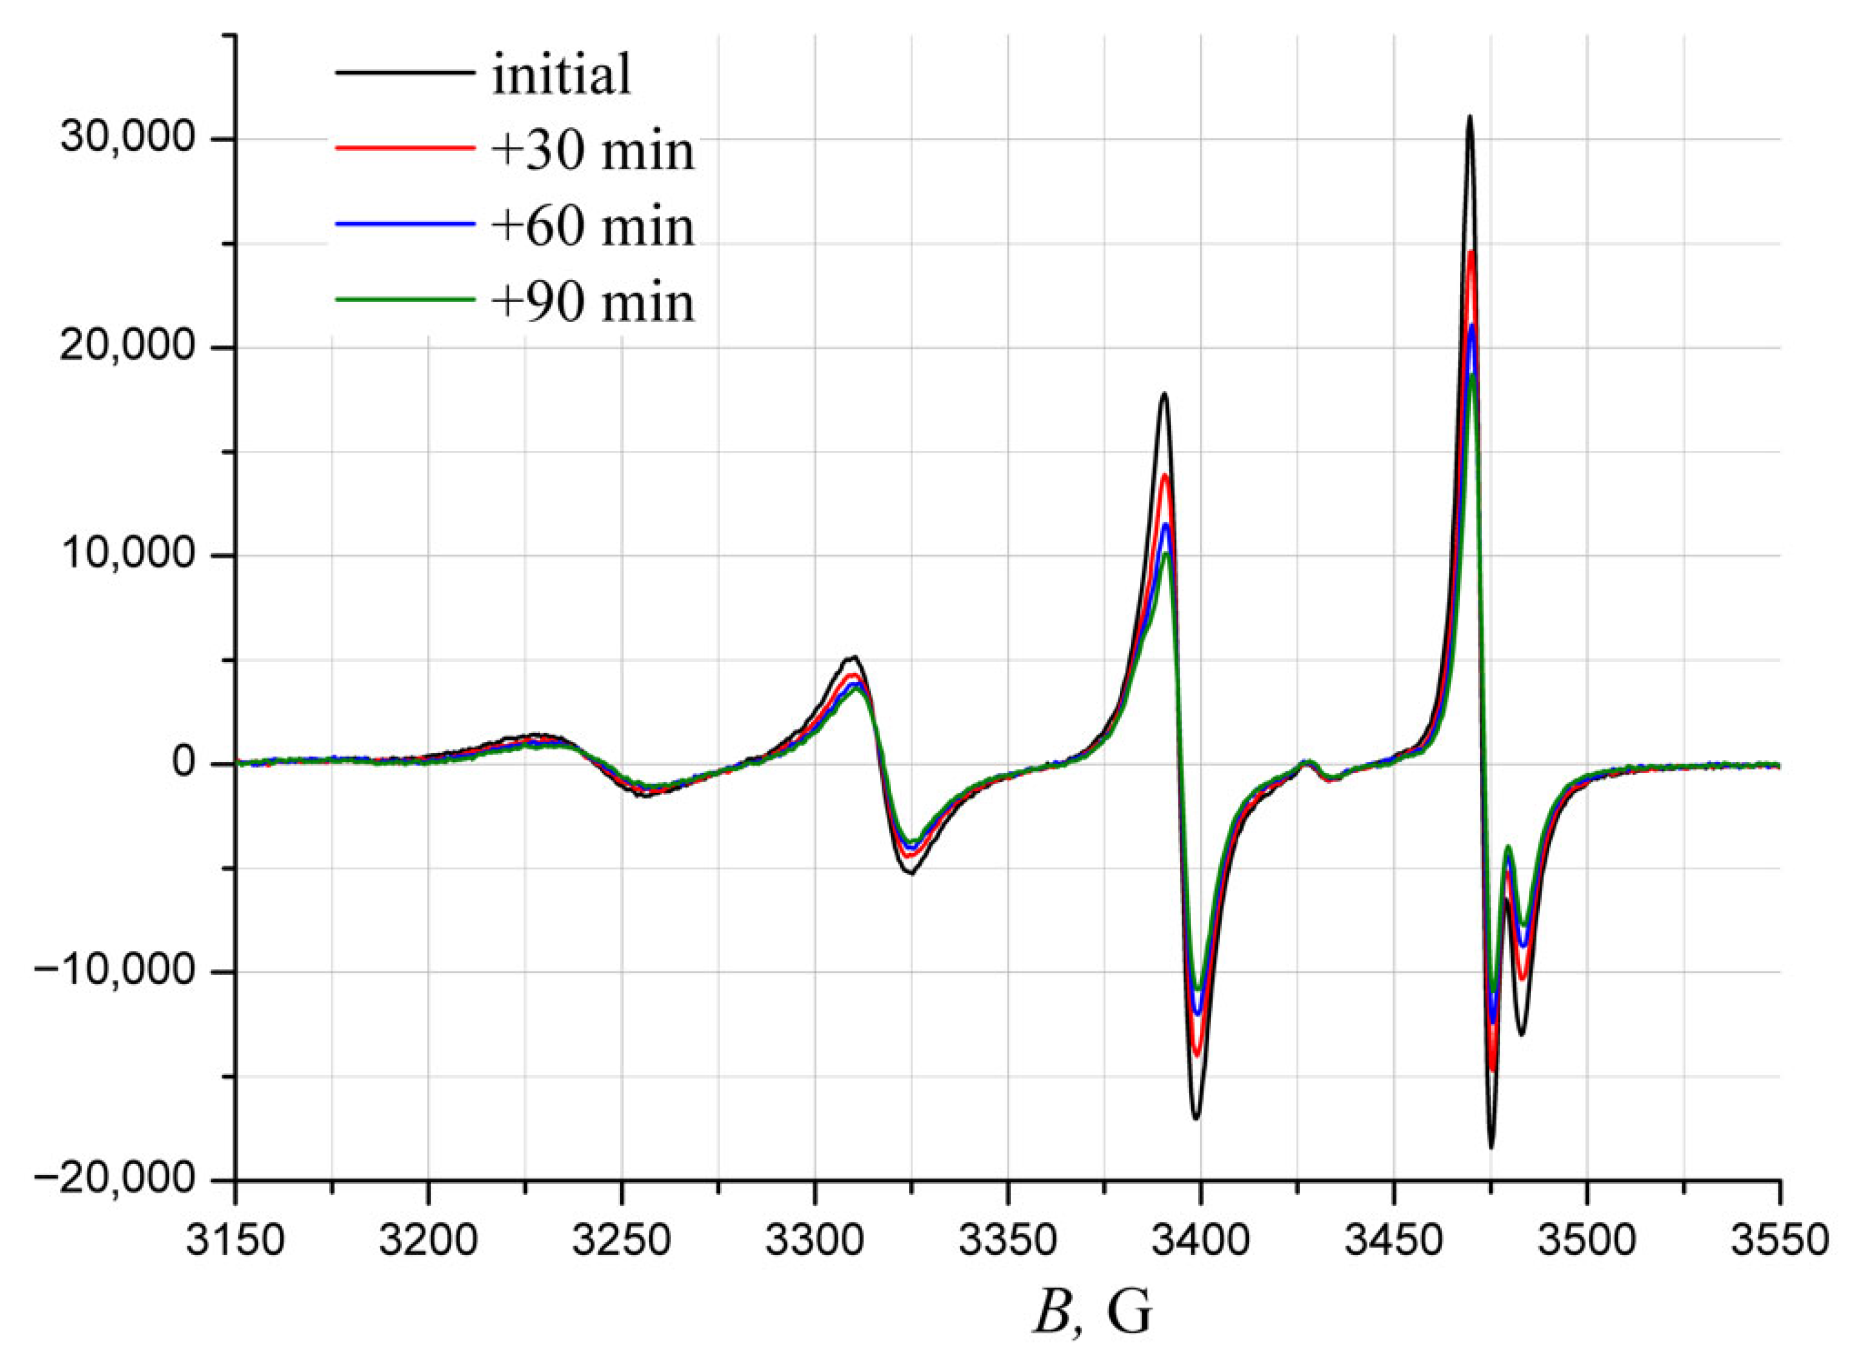
Figure 6a) with and without prior argon bubbling. The formation of a copper(III) and/or copper(I) compound is also supported by the results of a similar experiment using EPR control (
Figure 7): after acidification of the solution, a gradual decrease in the EPR signal of the Cu
II(PDTC)
22− form occurs without the appearance of any new signals of complex forms or copper(II) aqua ions.
To explain the formation of copper(III) in the absence of any oxidizing agents, we hypothesize the disproportionation of the copper(II) complex into copper(I) and copper(III). This process likely involves the formation of a binuclear complex consisting of two square-planar copper(II) complexes, which then dissociate into a square-planar copper(III) complex and, presumably, a tetrahedral copper(I) complex. Binuclear complexes will be discussed in more detail in
Section 2.6.
Separately, we note that when acidifying a solution of the copper(II)
bis-complex with a 50% excess of phosphorylated dithiocarbamate, the kinetic curves have a much more complex shape with several stages, and in the presence of dissolved oxygen, pronounced oscillations are observed, with the final absorption being lower than that of the bubbled solution (
Figure 6b).
Such difficult kinetic behavior suggests a complicated mechanism of the observed process involving different redox (and, possibly, dissociation-association) stages. Nevertheless, the presence of oscillations in the kinetic curve (
Figure 6b) points to a multi-step mechanism with “feedback” steps (possibly autocatalytic), similar to a Belousov–Zhabotinsky (or another oscillatory) reaction. Interestingly, when a more active form of oxygen, such as hydrogen peroxide, is introduced into the system, oscillations can be obtained under slightly acidic, neutral and slightly alkaline conditions (
Figure S1-16). The described situation deserves separate experimental and theoretical investigations and is beyond the scope of this article.
2.5. Oxidation Potentials of Copper(II) Complexes
In an attempt to explain the influence of pH on the oxidation process (see
Figure 5 and text above), oxidation potentials for copper(II) complexes were calculated on the base of quantum-chemical calculation results. For this purpose, a method similar to that described in [
18] for the copper(I)/copper(II) transition was used, which involves calculating the potential from the Gibbs energy for the transition from the reduced to the oxidized form:
where
EOx|Red refers to the potential of the transition being determined, ∆
GOx and ∆
GRed refer to the Gibbs energies for the oxidized and reduced forms from quantum-chemical calculations (converted from atomic units to Joules),
n is the number of electrons (for the copper(II)/copper(III) transition,
n = 1),
F is the Faraday constant, and
ESHE is the hydrogen electrode potential, −4.281 V [
19].
Under acidic conditions, protonation or dissociation of one PDTC ligand can occur; therefore, oxidation potentials were calculated for the protonated
bis-complex (structure shown in
Figures S2-57–S2-76), the mono-complex (shown in
Figure 2) and the simple
bis-complex (for comparison; also shown in
Figure 2). The calculation results are shown in
Table 2 (two solvent models, C-PCM and SMD, were used).
As can be seen from
Table 2, protonation of the ligand slightly increases the potential value (by nearly 0.1 V), whereas the loss of one PDTC ligand significantly increases the potential (by nearly 1 V). Thus, such processes themselves cannot explain the influence of pH on the oxidation process.
2.6. Dimerization of Copper(II) Complexes
Another possible explanation for the occurrence of oxidation under acidic conditions is that the process begins with the dimerization of
bis-complexes:
In that case, protonation (which occurs more readily as pH decreases) changes the charge of the complex from −2 to −1, making dimerization more likely to occur—the smaller the magnitude of the charge, the weaker the electrostatic repulsion between similar species.
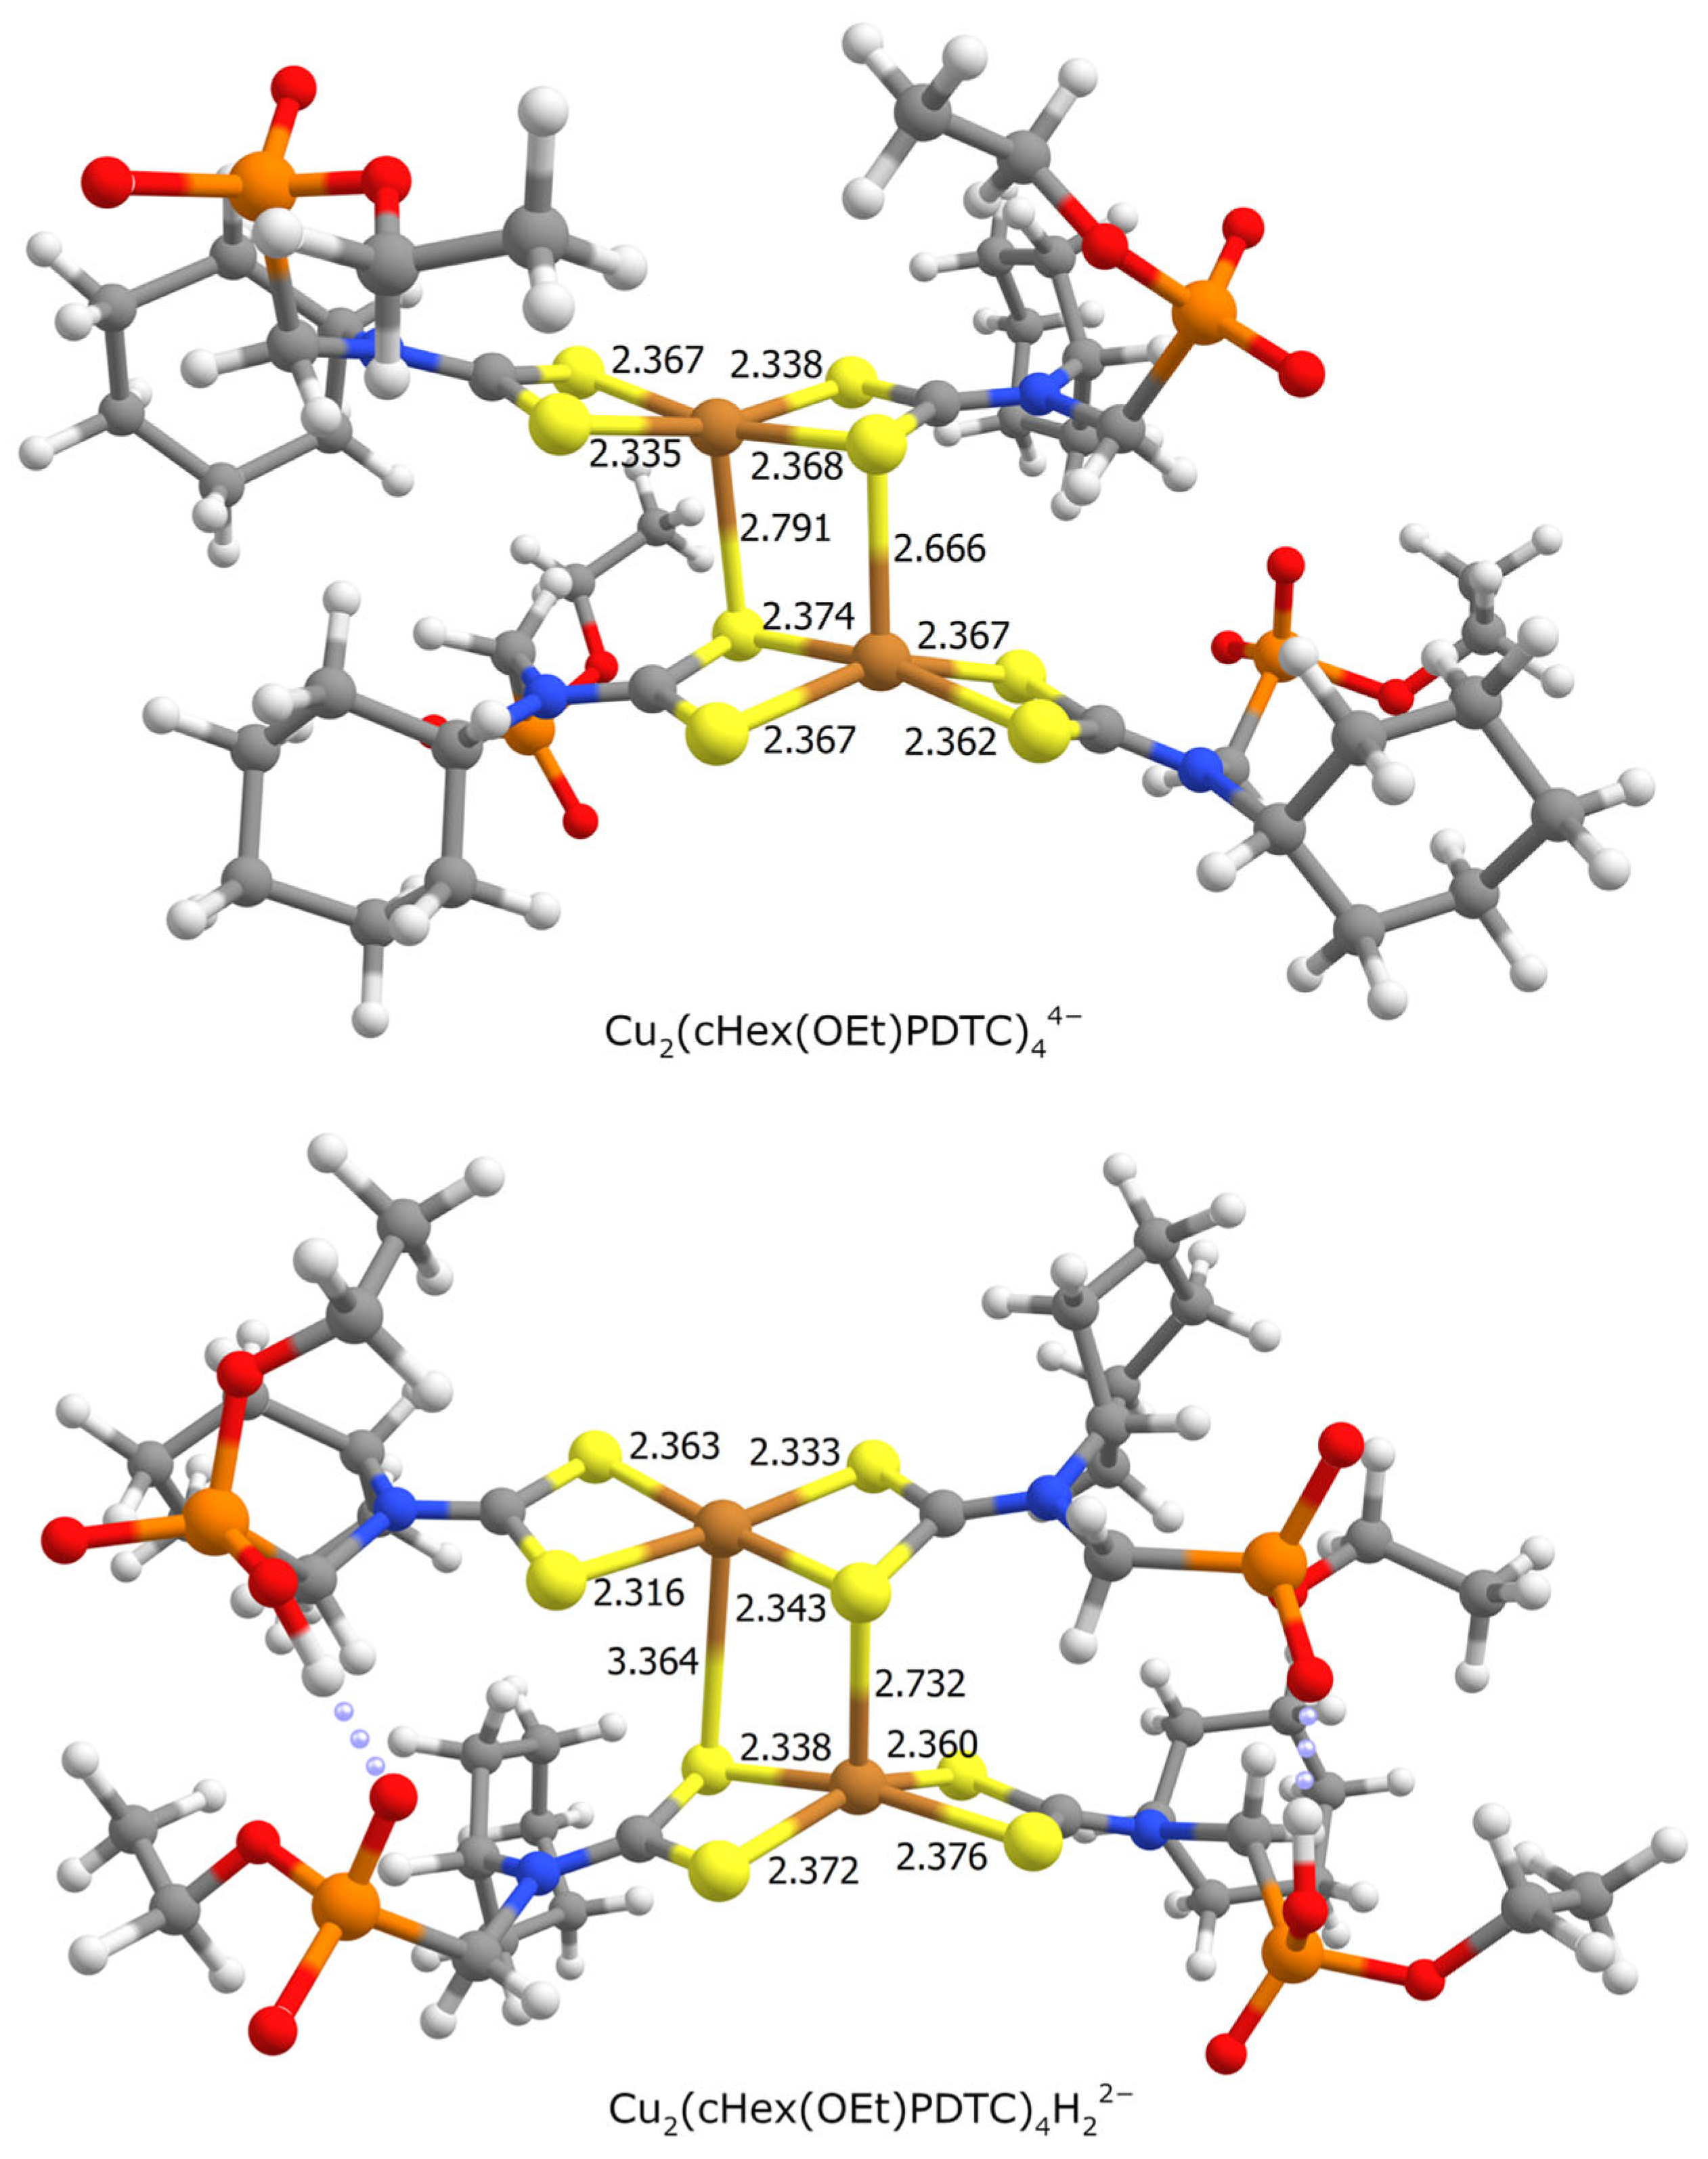
To investigate the possibility of dimerization, quantum-chemical calculations for binuclear complexes were performed. Optimized structures are shown in
Figure 9. Such dimerization with copper–sulfur bond formation between neighboring centers is known for copper(II)
bis-complexes with dialkyldithiophosphonates [
3]. However, phosphorylated dithiocarbamates have another possible mode of dimerization—through the phosphonate fragment. A structure for this case was also calculated (
Figure S2-165), but it is energetically less favorable (nearly 25 kJ/mol) than that with copper–sulfur bonds; that is why it is not taken into account in the considerations below.
Looking at the upper structure in
Figure 9, it can be seen that two copper–sulfur bonds are formed between the
bis-complex fragments. Those bonds lengths are not identical, but their values are in good agreement with the literature lengths near 2.7–2.9 Å (see [
3]). Upon protonation, two hydrogen bonds between phosphonate fragments can form (lower structure in
Figure 9), but the copper–sulfur bonds become longer.
From the quantum-chemical calculation results, the Gibbs free energy change for the dimerization process (Equations (2) and (3)) can be obtained: −9.51 kJ/mol for dimerization of the
bis-complex and −33.24 kJ/mol for the protonated form. Gibbs energy is related to the equilibrium constant by the formula
where ∆
G refers to the Gibbs free energy,
R is the universal gas constant,
T is the temperature (298 K) and log
K is the logarithm of the equilibrium constant. Using Equation (4) and the Gibbs energy values above, it can be calculated that the log
K value for reaction (2) is 1.67 and for reaction (3) is 5.83 (corresponding
K values are 46.7 and 6.8∙10
5), which is in good agreement with the assumption of greater dimerization upon protonation.
On the other hand, the equilibrium constant for dimerization can be expressed as
where [dimer] is the concentration of the binuclear complex and [monomer] is that of the mononuclear compound. These concentrations are interconnected by the formula
where
cCu is the total copper concentration in solution. Using Equations (5) and (6) with the obtained
K values for reactions (2) and (3), estimates of the binuclear form fraction can be made. If
cCu = 10
−3 M, then the dimer fraction is no more than 8% for the non-protonated form and approximately 97% for the protonated one. For
cCu = 10
−4 M, the values are 0.9% and 92% respectively. Therefore, it can be concluded that dimerization is practically absent under experimental conditions for the
bis-complex (reaction (2)), whereas it is highly favorable for the protonated form (reaction (3)).
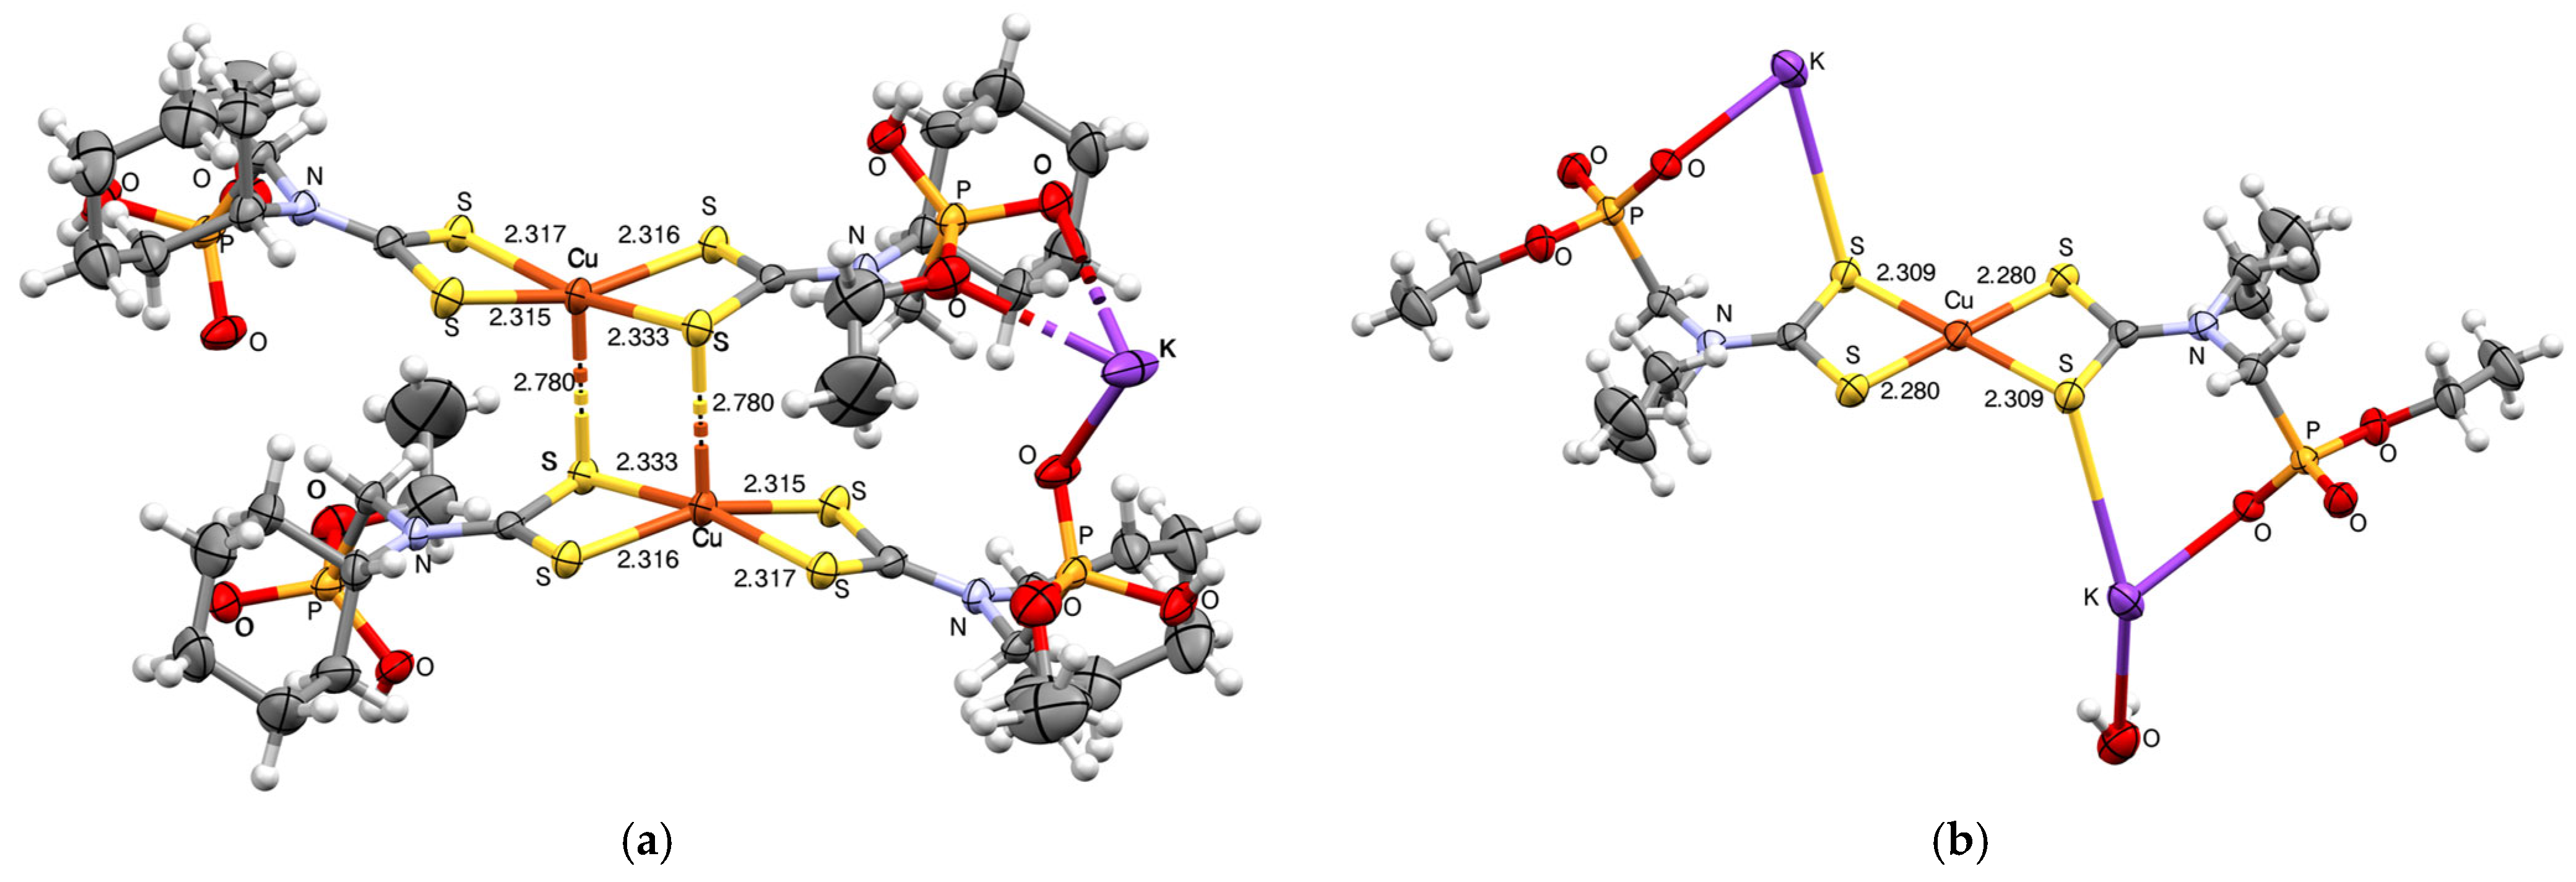
Additional evidence for the protonated dimer formation is the obtained crystal structure of the K[Cu
2(cHex(OEt)PDTC)
4H
3] complex in the solid state (
Figure 10a; asymmetric part is shown in
Figure S1-17). Both copper ions exhibit a slightly distorted square-pyramidal coordination geometry with the value τ
5 = 0.1245 (for the geometry index, see [
20]). The general motif of the dimer structure is the same as in the calculated case, but the two copper–sulfur bonds between monomeric fragments are equal to each other in the crystalline sample, in contrast to the calculated structure (
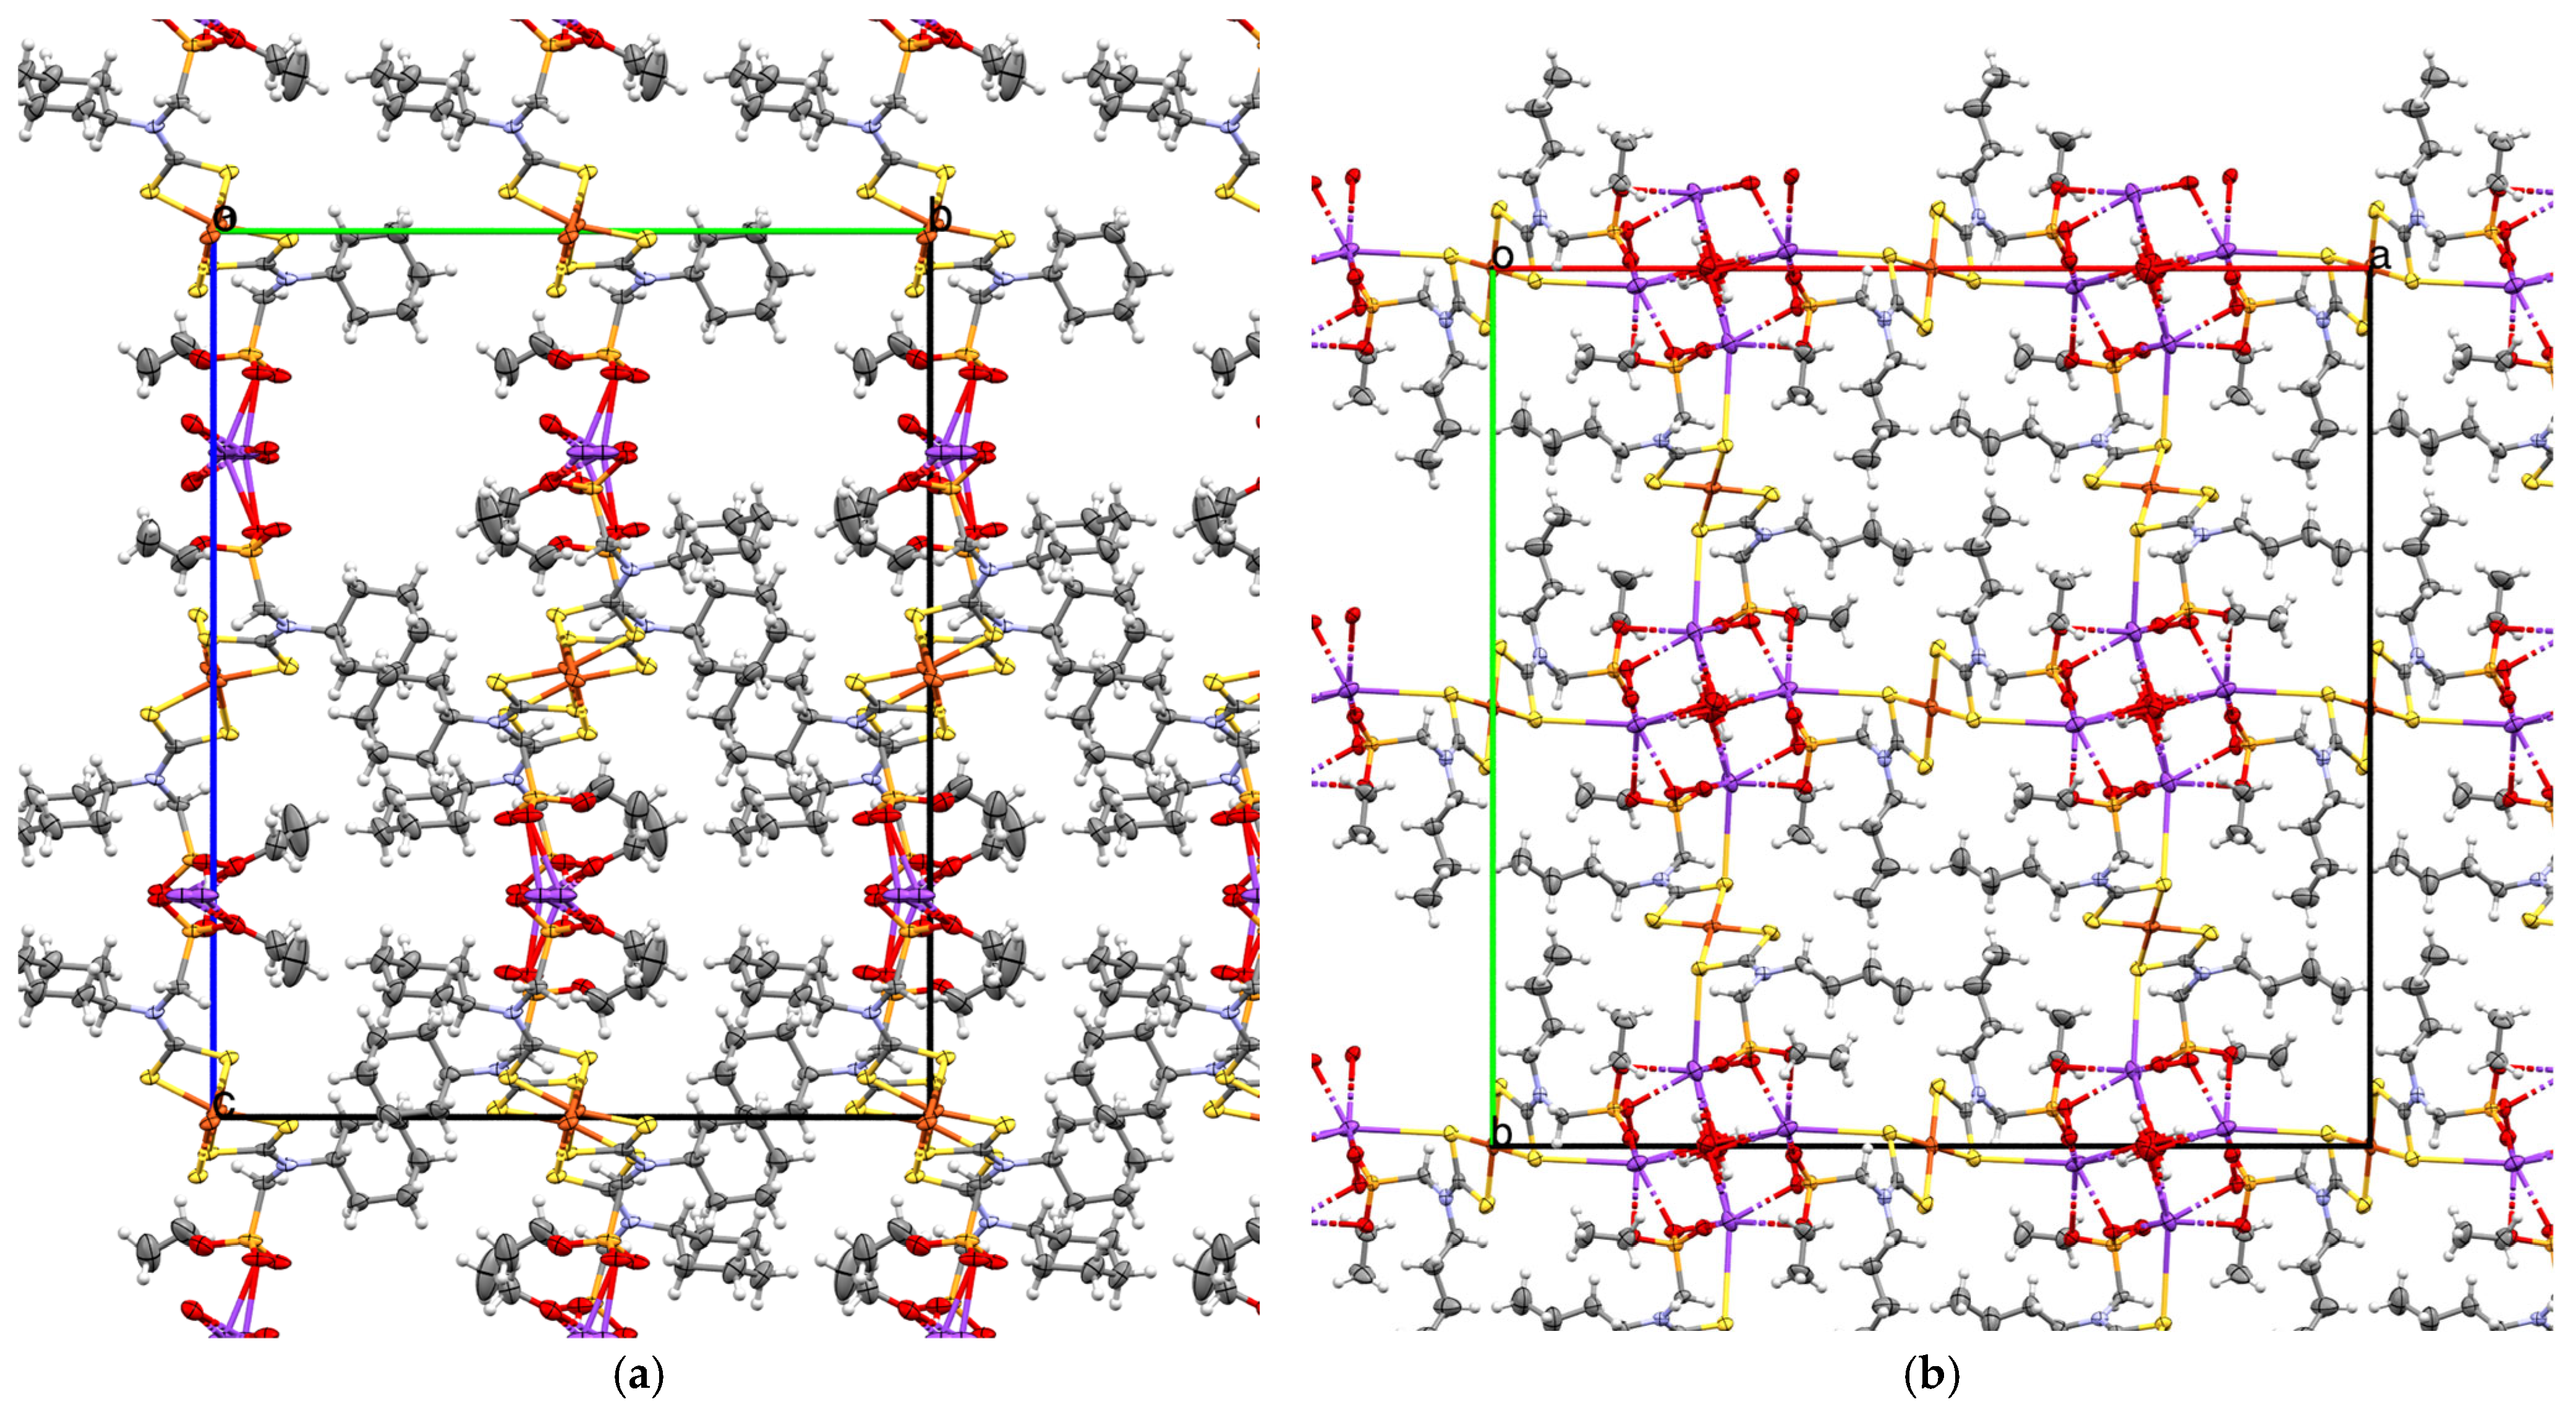
Figure 9), where the copper–sulfur bonds are not symmetric. This discrepancy may be attributed to the influence of crystal packing (see
Figure 11a and
Figure S1-18), but it is likely that the binding of phosphonate fragments by potassium ions in the solid state is a more influential factor.
It should be additionally mentioned that dimeric fragments are bonded through potassium ions into chains along the crystallographic direction
a0c (
Figure 11a). Moreover, in the crystal, binuclear fragments are connected by hydrogen bonds (parameters given in
Table S1-3). This situation differs significantly from the calculated structure in solution (
Figure 9), where hydrogen bonds are realized intramolecularly.
At the same time, the non-protonated form crystallizes as monomeric fragments, as revealed for the K
2[Cu(Bu(OEt)PDTC)
2]∙H
2O complex (
Figure 10b and
Figure S1-19). In this case, coordination bonds between
bis-complex fragments are absent. The copper ion adopts an ideal square-planar geometry, as indicated by the index τ
4 = 0.00 (for the geometry index see [
20]). The molecular complex occupies a specific position in the tetragonal unit cell, such that the ligand arrangement is antisymmetric with respect to the copper atom, and the sulfur atoms are coplanar with the copper atom. The solvate water molecule is statistically disordered in the crystal, with a relative occupancy of 0.56 per unit cell.
It should be noted that the Cambridge Crystallographic Database contains the crystal structures of five structurally similar copper complexes with dithiocarbamates containing a butyl substituent on the nitrogen atom [GUTQIW, HOTYUN, IDEBIC, UKECUI, UKEDOD] and six compounds containing a cyclohexyl substituent [COD_2237905, COD_4315344, COD_4315345, IDINOA, KADNIO, KADNOU, XOCGED]. Less than half of these compounds crystallize with the complex molecule in a special position. No information on phosphorus-containing compounds of this type has been found. According to the analysis, the bond length distribution ranges from 2.278 to 2.332 Å for Cu-S and from 1.716 to 1.7306 Å for S-C, which is consistent with the values observed in the complexes studied in this work. Therefore, it is difficult to assert the influence of the phosphoryl substituent on the electron density of the dithiocarbamate moiety and Cu–S bonding.
The supramolecular structure of the K
2[Cu(Bu(OEt)PDTC)
2]∙H
2O complex crystal is primarily determined by the association of molecular complexes through binding of potassium ions to the oxygen atoms of the phosphonate groups. The disordered water molecule also participates in the formation of hydrogen bonds with potassium cations, linking them into unique 1D clusters along the crystallographic axis 0
c and stabilizing these clusters (see
Figure 11b and
Figure S1-20). Coordination bonds of sulfur atoms with copper combine similar clusters in the crystallographic directions 0
a and 0
b, thus forming a 3D coordination polymer in the crystal. In this packing, localization of hydrophobic fragments of the molecules, represented in this case by butyl substituents, is observed in the space between the 1D clusters. The observed weak interactions of the C-H…S and C-H…O types also stabilize this arrangement of molecular fragments. The resulting three-dimensional supramolecular structure in the K
2[Cu(Bu(OEt)PDTC)
2]∙H
2O crystal exhibits noticeable anisotropy, which should have a significant impact on the anisotropy of the properties of these crystals under physicochemical influences.
Despite the complicated supramolecular structure in the crystal, the coordination center in the solid state is very similar to the calculated one, as shown in
Table S1-4.
Thus, it can be concluded that as the pH decreases, the probability of dimerization increases. Because the redox process also proceeds under an argon atmosphere (see
Figure 5a), it can be proposed that oxygen is not necessary for some stages; however, it undoubtedly participates in the overall mechanism, as the behavior in air differs from that under inert conditions (see
Figure 5 and
Figure 6). On this basis, it can be proposed that after dimerization intramolecular oxidation reduction can occur:
where Cu
II2(PDTC)
4H
22− corresponds to the initial binuclear complex, Cu
ICu
III(PDTC)
4H
22− represents the product of electron transfer between the two copper ions, with formation of copper(I) and copper(III).
Upon electron transfer, the spin state of the binuclear complex must change from one (two unpaired electrons on copper(II) atoms) to 0 (no unpaired electrons on copper(I) or copper(III) ions). However, attempts to optimize low-spin binuclear complexes yielded only two copper(II) ions with antiparallel spins (see
Figures S2-163 and S2-171), forming structures very similar to those with high spin (
Figure 9), but with slightly higher energies. Accordingly, it can be proposed that species such as Cu
ICu
III(PDTC)
4H
22− are not intermediates but rather transition states in the electron transfer process and immediately decompose into copper(I) and copper(III) species.
2.8. Electrochemical Investigation of Redox Activity
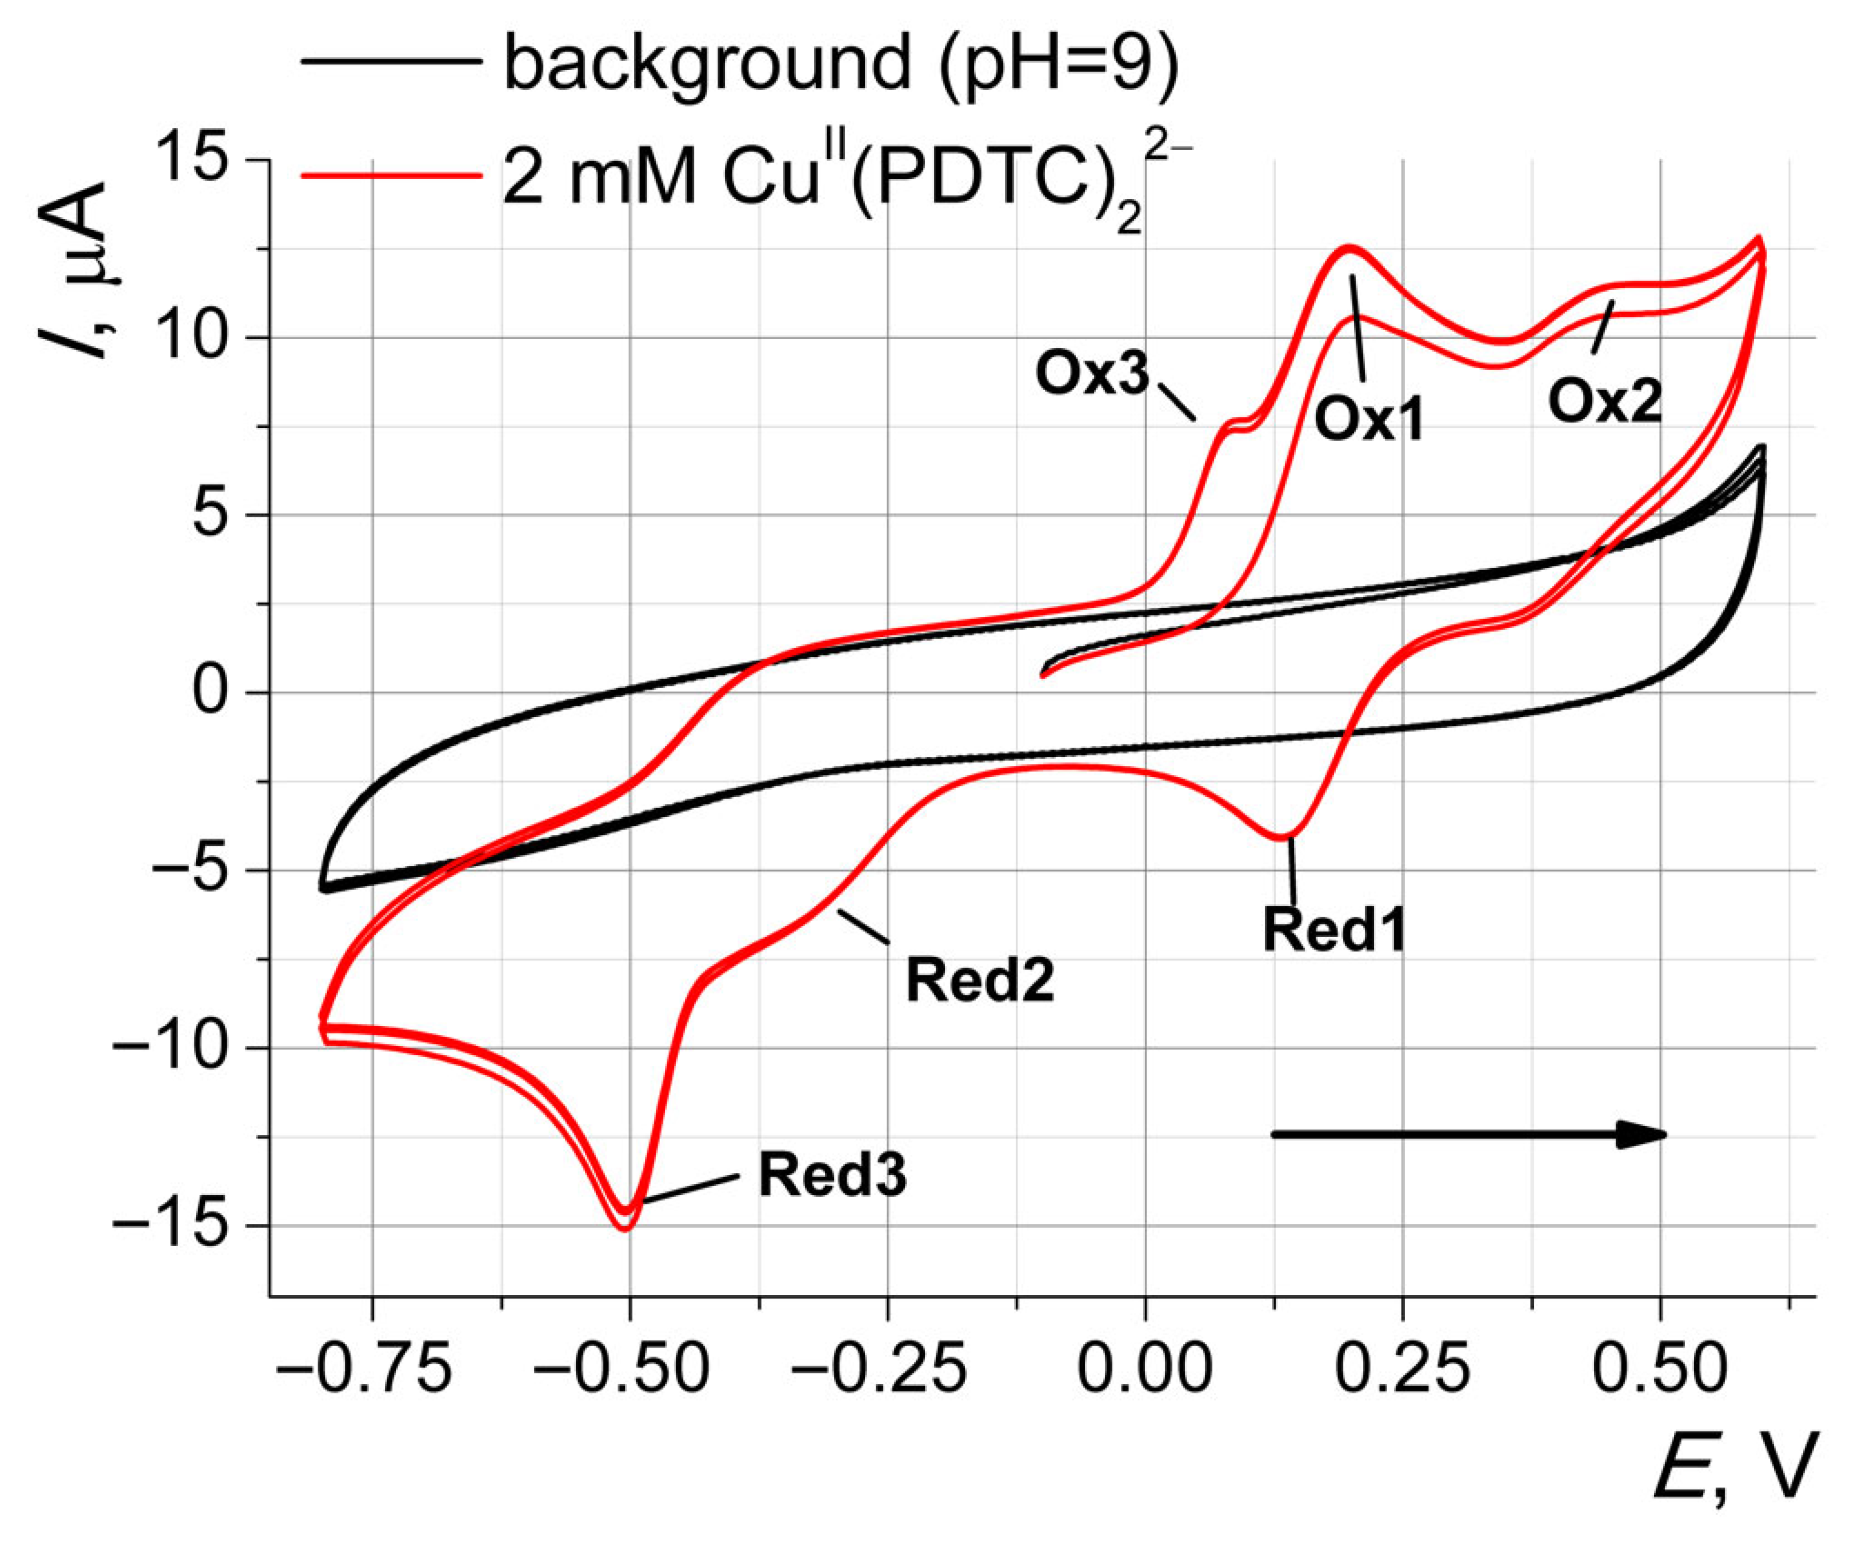
First, to obtain background curves, the prepared glassy carbon electrode (GCE) was immersed in buffer solution, and cyclic voltammograms (CVs) were recorded at a scan rate of 0.1 V/s in the range of [−0.8–0.6] V with an initial potential of −0.1 V. Then, an aliquot of the aqueous solution of the copper(II) phosphorylated dithiocarbamate complex was added to the aqueous buffer solution to a final concentration of 2 mM (unless otherwise stated). All solutions contained 0.1 M KNO
3 as an electrolyte. The voltammograms obtained for the working solution at pH = 9 are shown in
Figure 14. Two electrooxidation signals (Ox1 and Ox2) are observed at potentials of approximately 0.2 V (peak) and 0.4 V (wave), respectively, on the forward scan of the first cycle. Three electroreduction signals (Red1, Red2 and Red3) appear on the backward scan at 0.135 V, −0.25 V and −0.505 V, respectively. An additional oxidation peak (Ox3) is revealed at about 0.08 V on the forward scans of the second and third cycles. The shape of the recorded signals indicates the presence of one electrochemically quasi-reversible process (Ox1/Red1), since the value of peak-to-peak separation for oxidation and reduction peaks (
nΔ
Ep) lies in the range of 63 <
nΔ
Ep < 200 mV, where
n is the number of participating electrons [
21]. All other redox signals should be considered electrochemically irreversible processes according to the criteria of equality of peak currents (
Ic/
Ia = 1, where
Ic is the reduction peak current and
Ia is the oxidation peak current) and the value of ∆
Ep.
To identify relationships between the recorded signals, CVs were recorded in different potential ranges. In these experiments, the initial potential was −0.1 V, as in the experiments described above, but the potential sweep direction was negative, meaning the cathodic branch of the voltammogram was recorded first.
It was found that the Red2 and Red3 reduction signals appear on voltammograms without prior oxidation of the complex, i.e., without recording the Ox1 and Ox2 signals (
Figure S1-23). Moreover, the magnitude of Red2 currents in the first cycles is significantly lower than in the third cycles and depends on anodic vertex potential (
Figure S1-24). Thus, an increase in Red2 is clearly visible in the third cycles of voltammograms as the potential window expands toward positive potentials. The disappearance of the Red2 signal for the range [−0.8–0] V, as well as the decrease in the Red3 peak, is explained by depletion of the near-electrode space in depolarizer (complex) molecules after the first potential cycle. It should be noted that after stirring the solution, all signals returned to their initial values, indicating the presence of depolarizers undergoing transformations during Red2 and Red3.
Figure S1-24 demonstrates the presence of the Red2 signal starting from the range [−0.8–0.1] V, capturing Ox3. However, it is necessary to consider the superposition of the two signals. Indeed, the aforementioned potential range is sufficient to register both the Ox3 signal and the growing part of the Ox1 signal. Most likely, the Red2 signal is explained by the electroreduction of products generated during the processes responsible for the Ox1 signals. Moreover, a certain amount of these products is initially present in freshly prepared solutions of the complex.
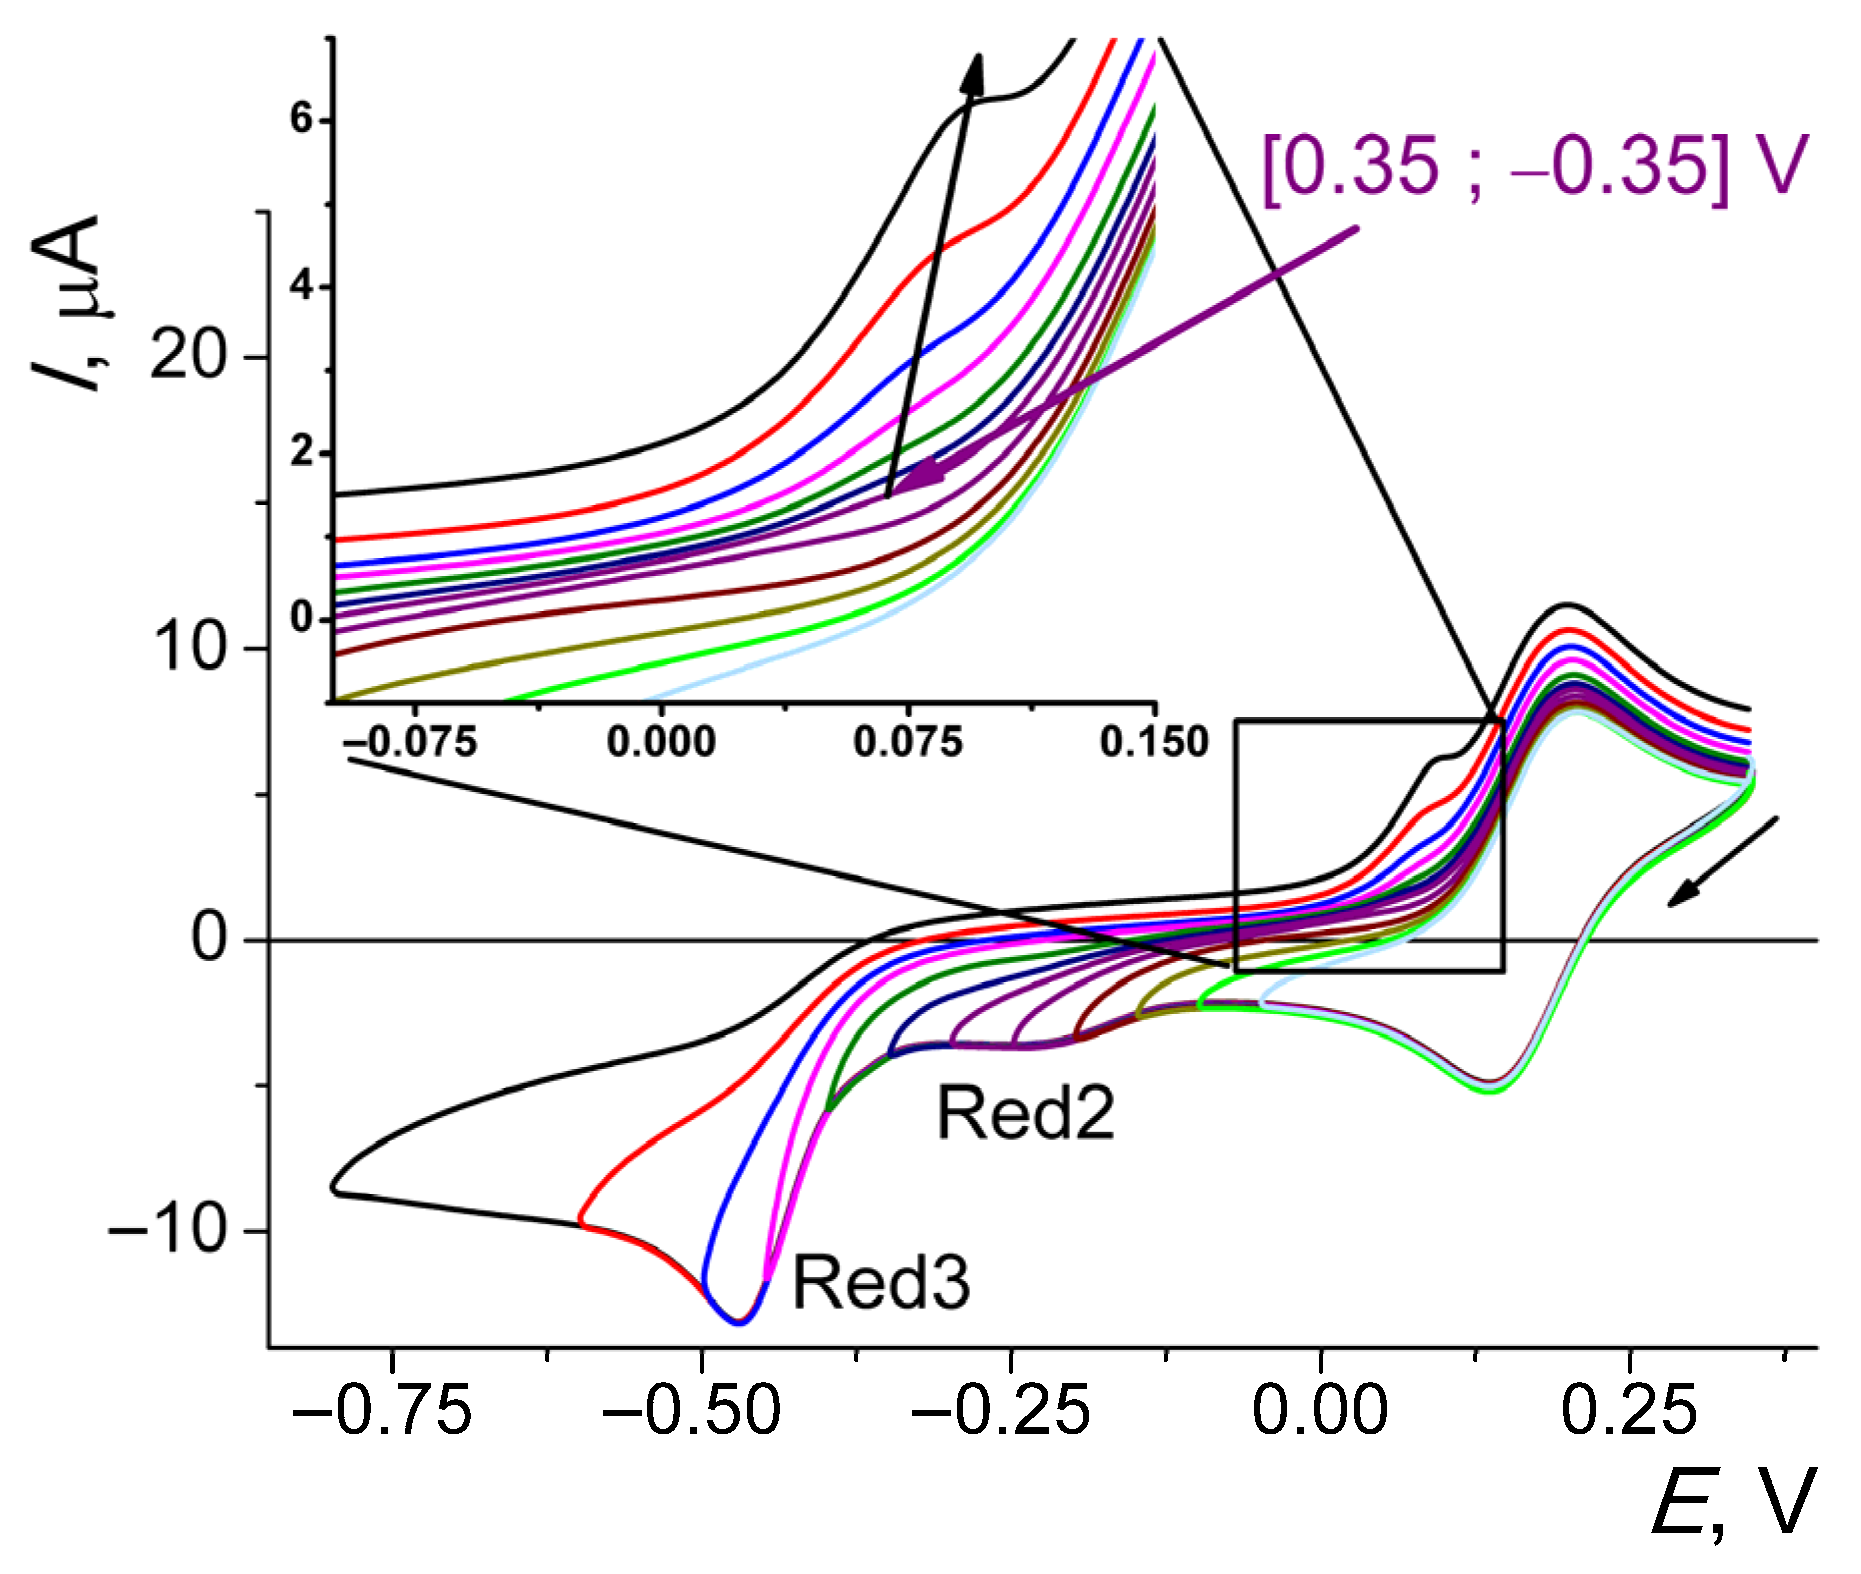
The presented voltammograms show that the Red2 and Red3 signals partially overlap; therefore, for a more detailed study of the possible relationship between Ox3 and Red2, experiments were performed in solution at pH = 7. At this pH, the Red2 and Red3 signals are more distinguishable (
Figure 15). The peak potential of Red2 under these conditions is −0.25 V, and the peak growth begins already at −0.075 V (compared to −0.13 V for solution at pH = 9). Negative potential sweep and gradual expansion of the negative vertex potential confirmed that the Ox3 signal begins to grow only after passing −0.3 V, i.e., when the Red2 signal is almost completely formed. Further expansion of the potential range led to a noticeable increase in the Ox3 signal. The obtained data demonstrate the relationship between the Red3 and Ox3 redox signals.
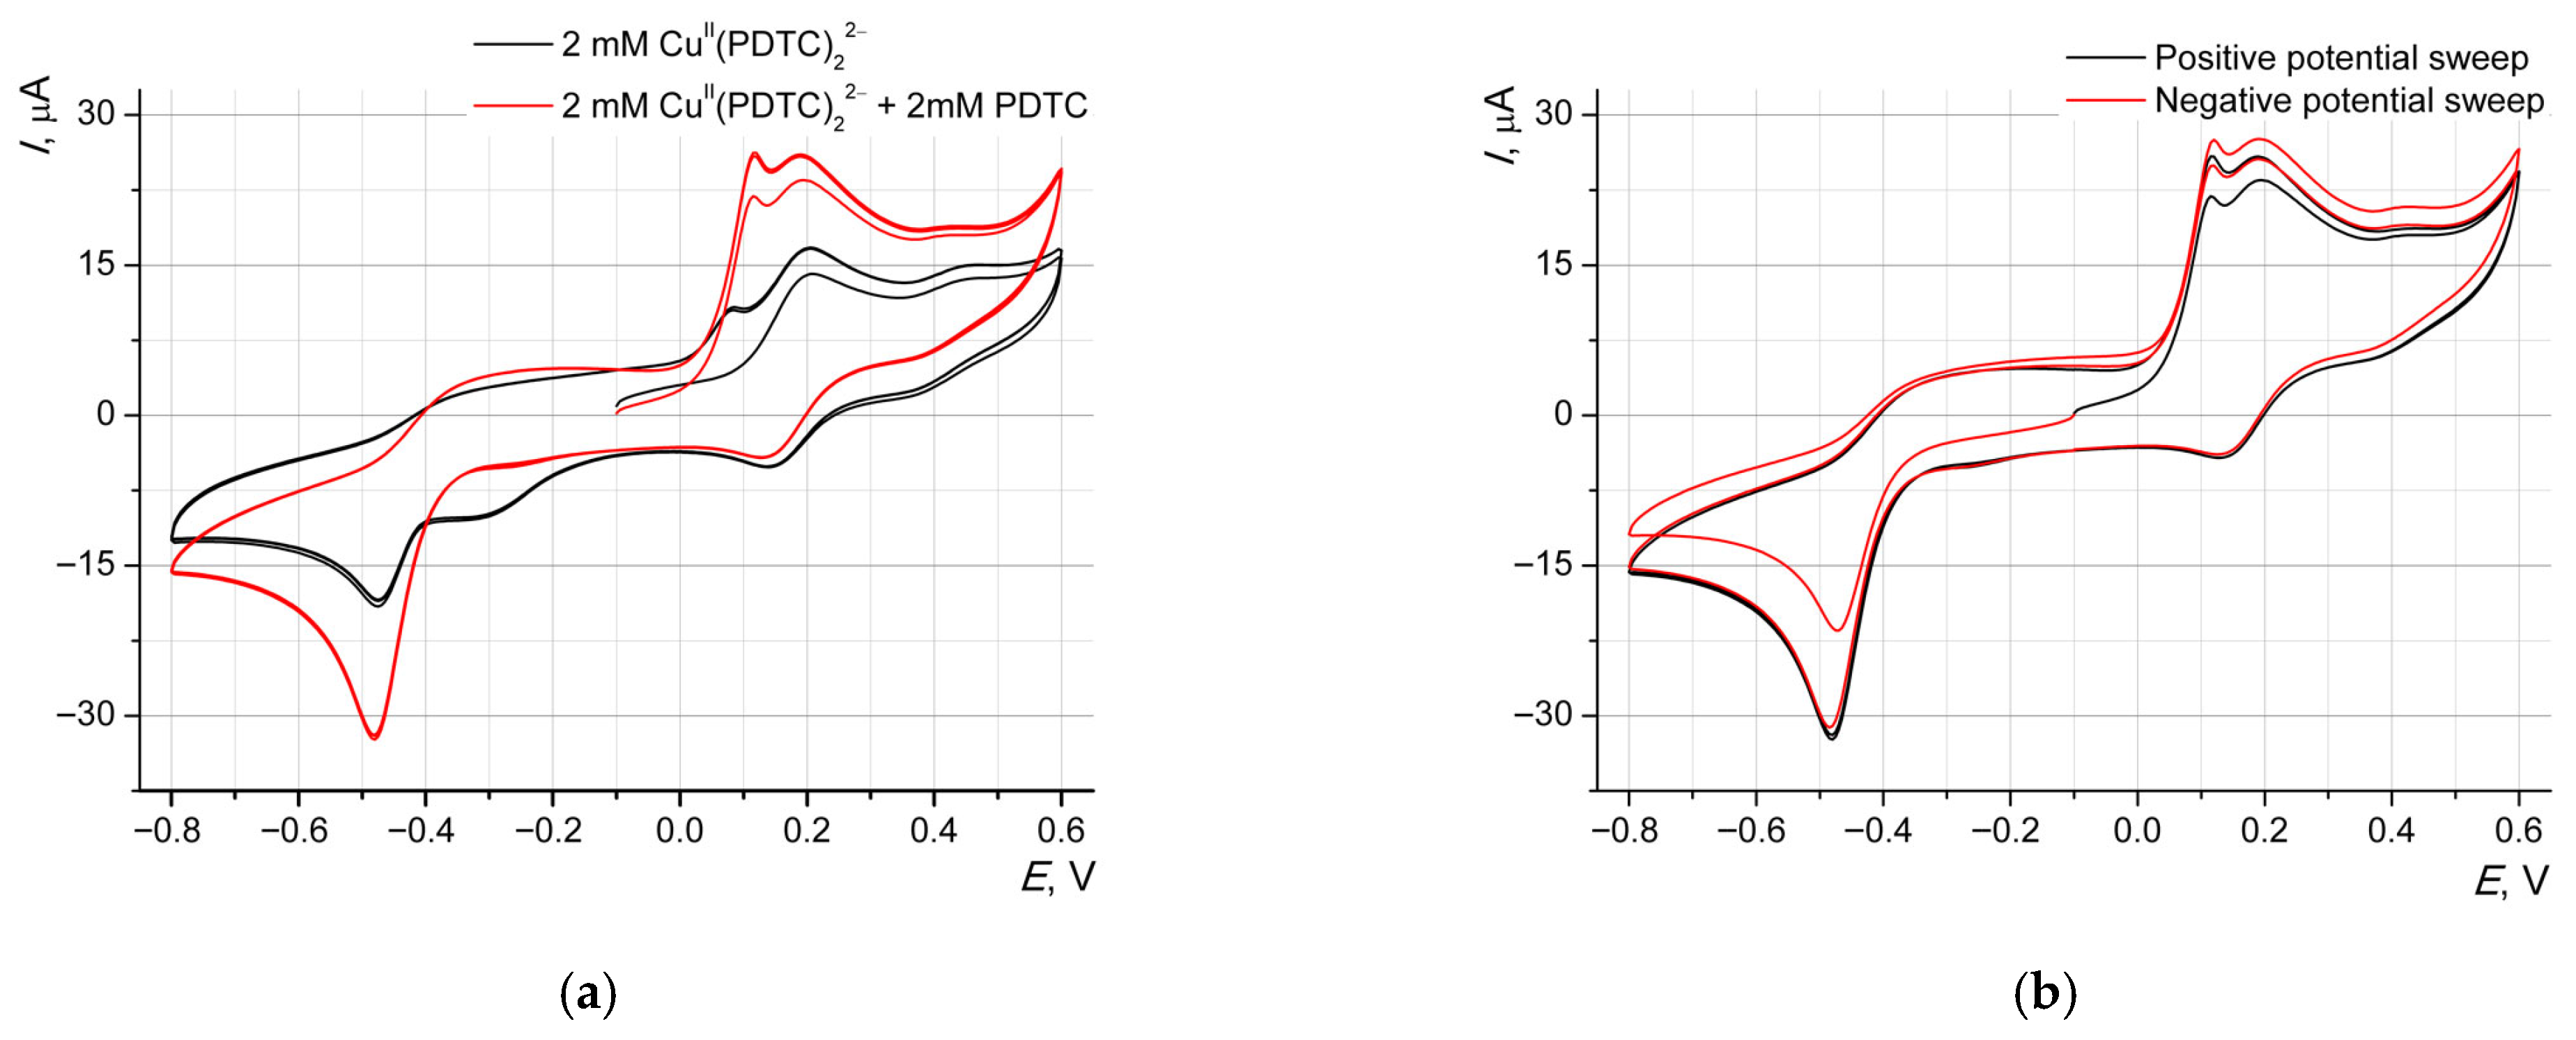
Upon addition of an equimolar amount of free ligand to the complex solution, a significant increase in the currents of Ox3, Ox1 and Red3 signals was observed, with a simultaneous decrease in Red2 (
Figure 16). The increase in Ox1 and Ox3 currents and the decrease in Red2 currents are explained primarily by the chemical reduction of copper(III) complexes by the free ligand, since the oxidation potential of the ligand is more positive than that of the complex (
Figure S1-25). The currents of the second and third cycles coincide, unlike in the voltammogram of the free ligand solution. This effect does not impact on Red1 currents, since only the oxidized form of the ligand is present in the near-electrode space at this potential. The increase in the Red3 current is particularly significant. Since disulfides are known not to be electrochemically reduced at the applied potentials, an increase in the reduction current indicates the formation of additional copper(II) compounds, which are re-reduced, increasing the current. Moreover, there is no increase in the Red3 current on the first cycle of the voltammogram with negative potential sweep (
Figure 16b). These results allow us to assume that the oxidized ligand is capable of chemically oxidizing copper(I) compounds, thereby leading to complete reproduction of the redox cycles.
Experiments with positive potential sweep involving the quasi-reversible Ox1/Red1 peak pair also indicate a predominant content of copper(II) compounds in solution. The initial portion of the voltammogram practically coincided with that of the background curve, whereas a reverse potential sweep resulted in the appearance of significant oxidation currents dominating the background ones (
Figure S1-26).
Varying the potential scan rate (
v) revealed a linear dependence of the oxidation peak currents on
v1/2 (
Figures S1-27 and S1-28). This behavior is consistent with diffusion control of the electrode reaction, according to the Randles–Sevcik equation [
22]. Additionally, the open-circuit potential (OCP) was measured in the complex solution. The obtained value (−0.06 V) was located to the left of the formal redox potential of the Ox1/Red1 pair, which also indicates a significant content of the reduced form.
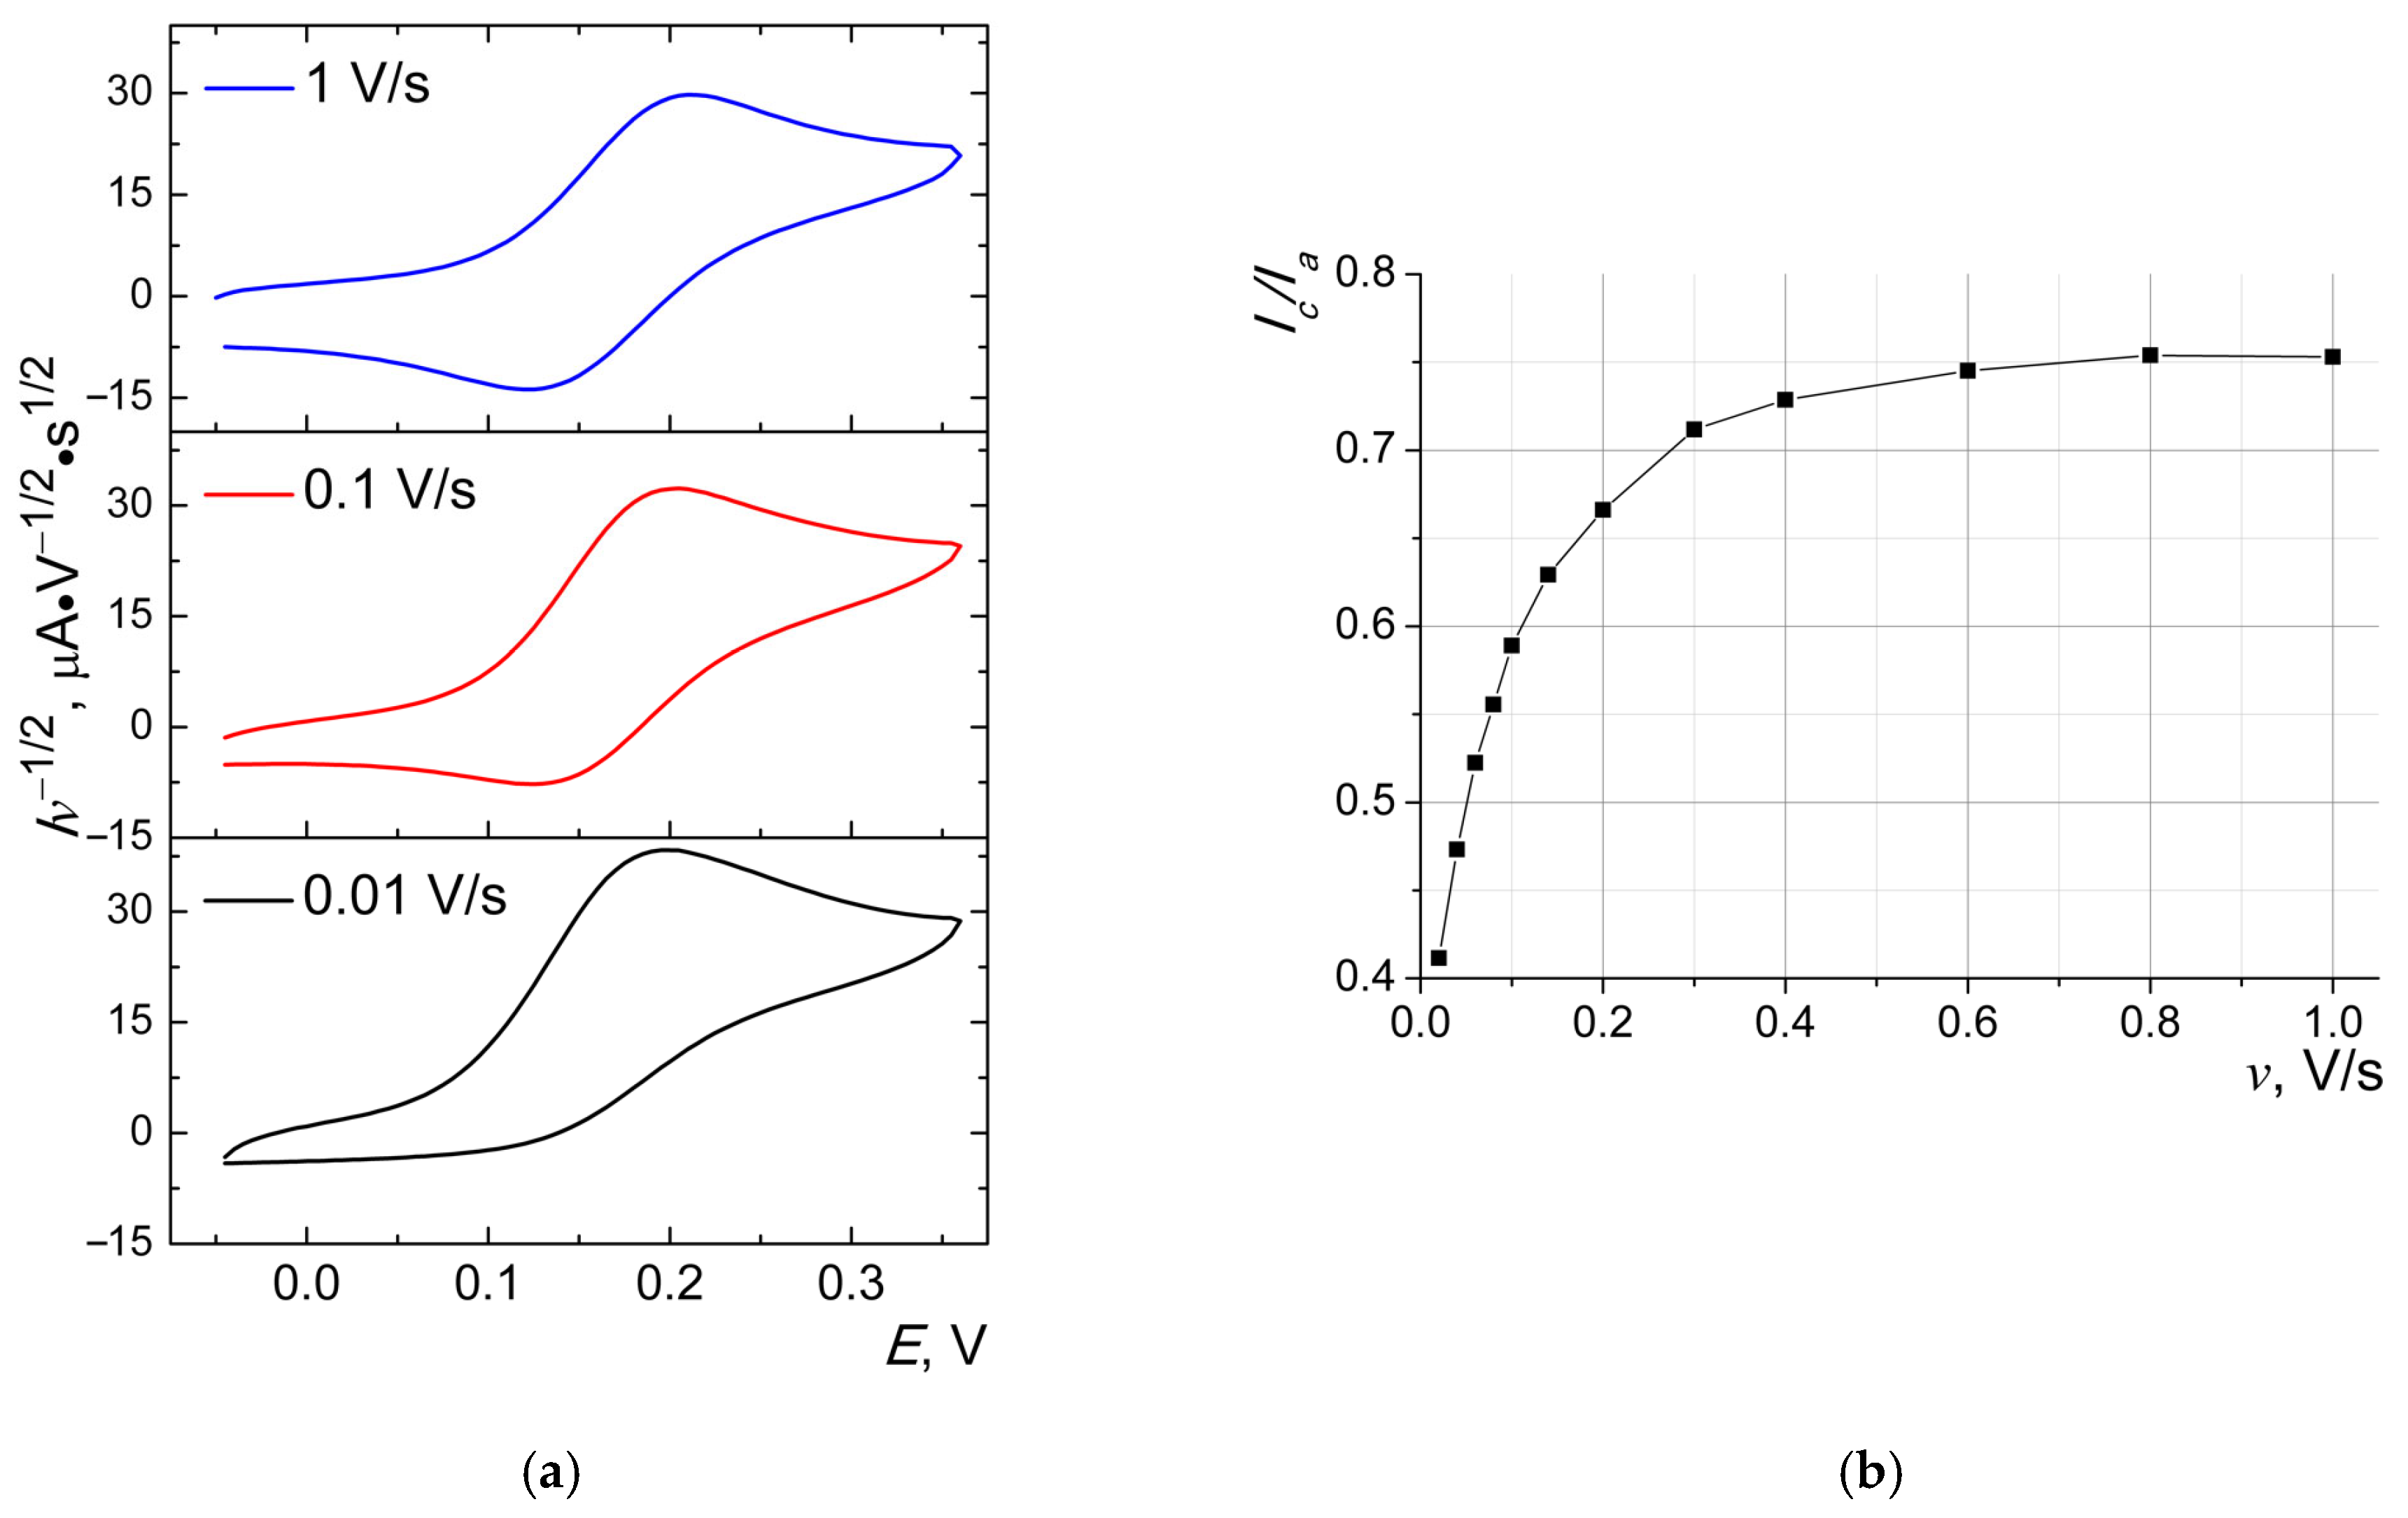
In
Figure S1-27, a change in the ratio of oxidation and reduction peak currents with scan rate can be observed. For greater clarity,
Figure 17 shows voltammograms with the ordinate axis normalized to
v1/2. The curves recorded at the three rates clearly show the suppression of the reduction peak with decreasing scan rate. This behavior is characteristic of an electrochemical process involving electron transfer followed by a chemical reaction, a so-called EC mechanism, where E is the electrochemical step and C is the chemical step [
23]. In this case, the oxidized form generated during the electrochemical step Ox1 is consumed in the subsequent chemical step; therefore, the current of the reverse reduction step (Red1) decreases. Increasing the potential scan rate allows one to record the aforementioned reverse process, since the rate of the chemical stage is finite. The potential returns to the reduction step faster than the chemical reaction can be completed. This is confirmed experimentally by the dependence of the peak current ratio
Ic/
Ia on
v. As shown in
Figure 17b, the peak current ratio for the complex studied increases with the potential scan rate and stabilizes near 0.75 at a scan rate of 1 V/s.
It should be noted that the subsequent chemical step can lead to the formation of both electrochemically inactive and electrochemically active compounds, generating their own signals on voltammograms [
24]. In the latter case, the mechanism of the electrode process is usually denoted as ECE. It would be logical to assume a relationship between the revealed chemical step occurring after Ox1 and the Red2 signal, which increases after oxidation of the studied complex (as shown in
Figure S1-24).
2.9. Kinetic Parameter Estimation
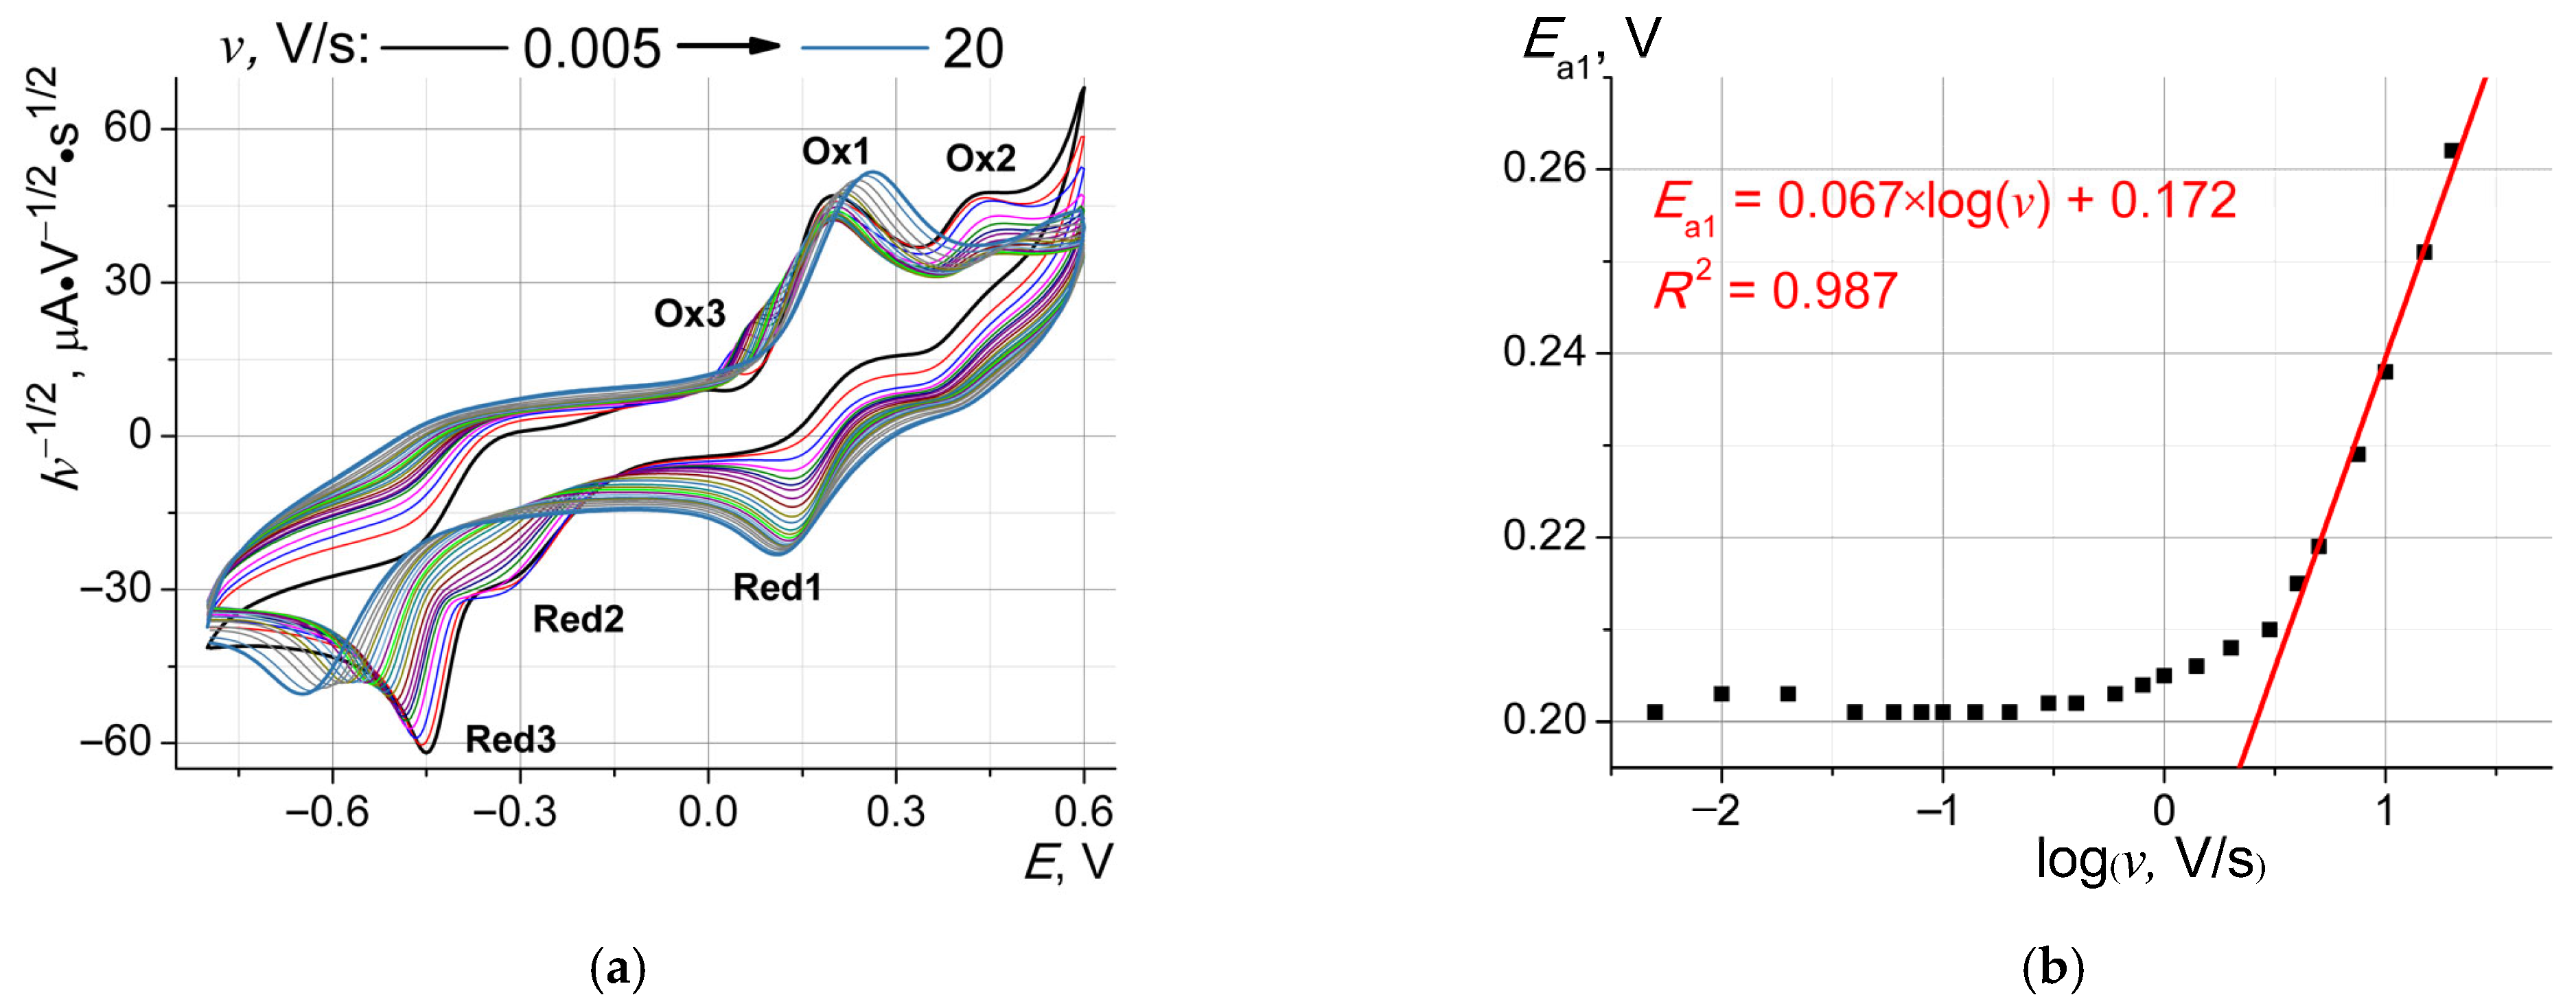
Figure 18a shows normalized CVs recorded at pH = 9 (third cycles). Changes in the shape of the recorded curves are observed with variations in the potential scan rate. For Ox2, a decrease in current and a shift toward more positive potentials are observed; i.e., another product of the Ox1 process may act as the signal-forming compound in this case. The absence of a reverse process for this signal is also more noticeable here. The figure also shows the disappearance of the Red2 signal with increasing
v. This behavior is consistent with the above assumption about the relationship of Red2 with the product of the chemical reaction occurring after the Ox1 electrochemical step. An increase in
v leads to a decrease in the amount of product accumulated in the chemical step, which is reflected in the decrease in the Red2 signal. The Ox3 signal, noticeable at low and medium
v values, merges with the Ox1 signal due to the lower electron transfer rate constant and, consequently, the lower reversibility of the process. This fusion leads to an increase in the recorded current. It is worth noting the electrochemical reversibility of the Ox1 process, resulting in the absence of Ox1 potential dependence on log
v for low and medium scan rates (
Figure 18b). The anodic peak potential (
Ea1) varied from 0.2 V to 0.21 V for
v ranging from 0.005 V/s to 2 V/s. Further increase in
v led to a shift in
Ea1 by 67 mV/dec, emphasizing the transition to quasi-reversible behavior.
The heterogeneous electron transfer rate constant,
k0, for the reaction Cu
II − 1ē = Cu
III can be estimated using the Nicholson method [
25]. The diffusion coefficient
D, necessary for this method, was determined using chronoamperometry (
Figure S1-29) and the Cottrell equation [
26]. The average value of
D is 3.8 × 10
−6 cm
2/s, giving a
k0 value of 0.03 cm/s (for details see ‘Electrochemical parameters evaluation details’ section in ESI1).
The dependence of the peak potential for the electrochemically irreversible Red3 process on the potential scan rate was more pronounced (
Figure S1-30). The slope of the dependence for low
v values was 31 mV/dec, indicating that the electrochemical process proceeds via the EC mechanism [
27]. Estimation of the chemical step rate constant
kc gives a value 0.54 s
−1. A further increase in
v is accompanied by the appearance of a slope of 50 mV/dec. This value indicates that the peak potential is controlled by quasi-reversible electron transfer kinetics; the obtained
k0 value is 0.003 cm/s, which is one order of magnitude lower than that for the Ox1/Red1 pair. The further increase in the slope of the
E~log
v dependence (
Figure S1-29) should also be noted. Such behavior has been previously reported in the literature and attributed to solution resistance and/or charging current impact [
28,
29].
2.10. pH Influence on Electrochemical Processes
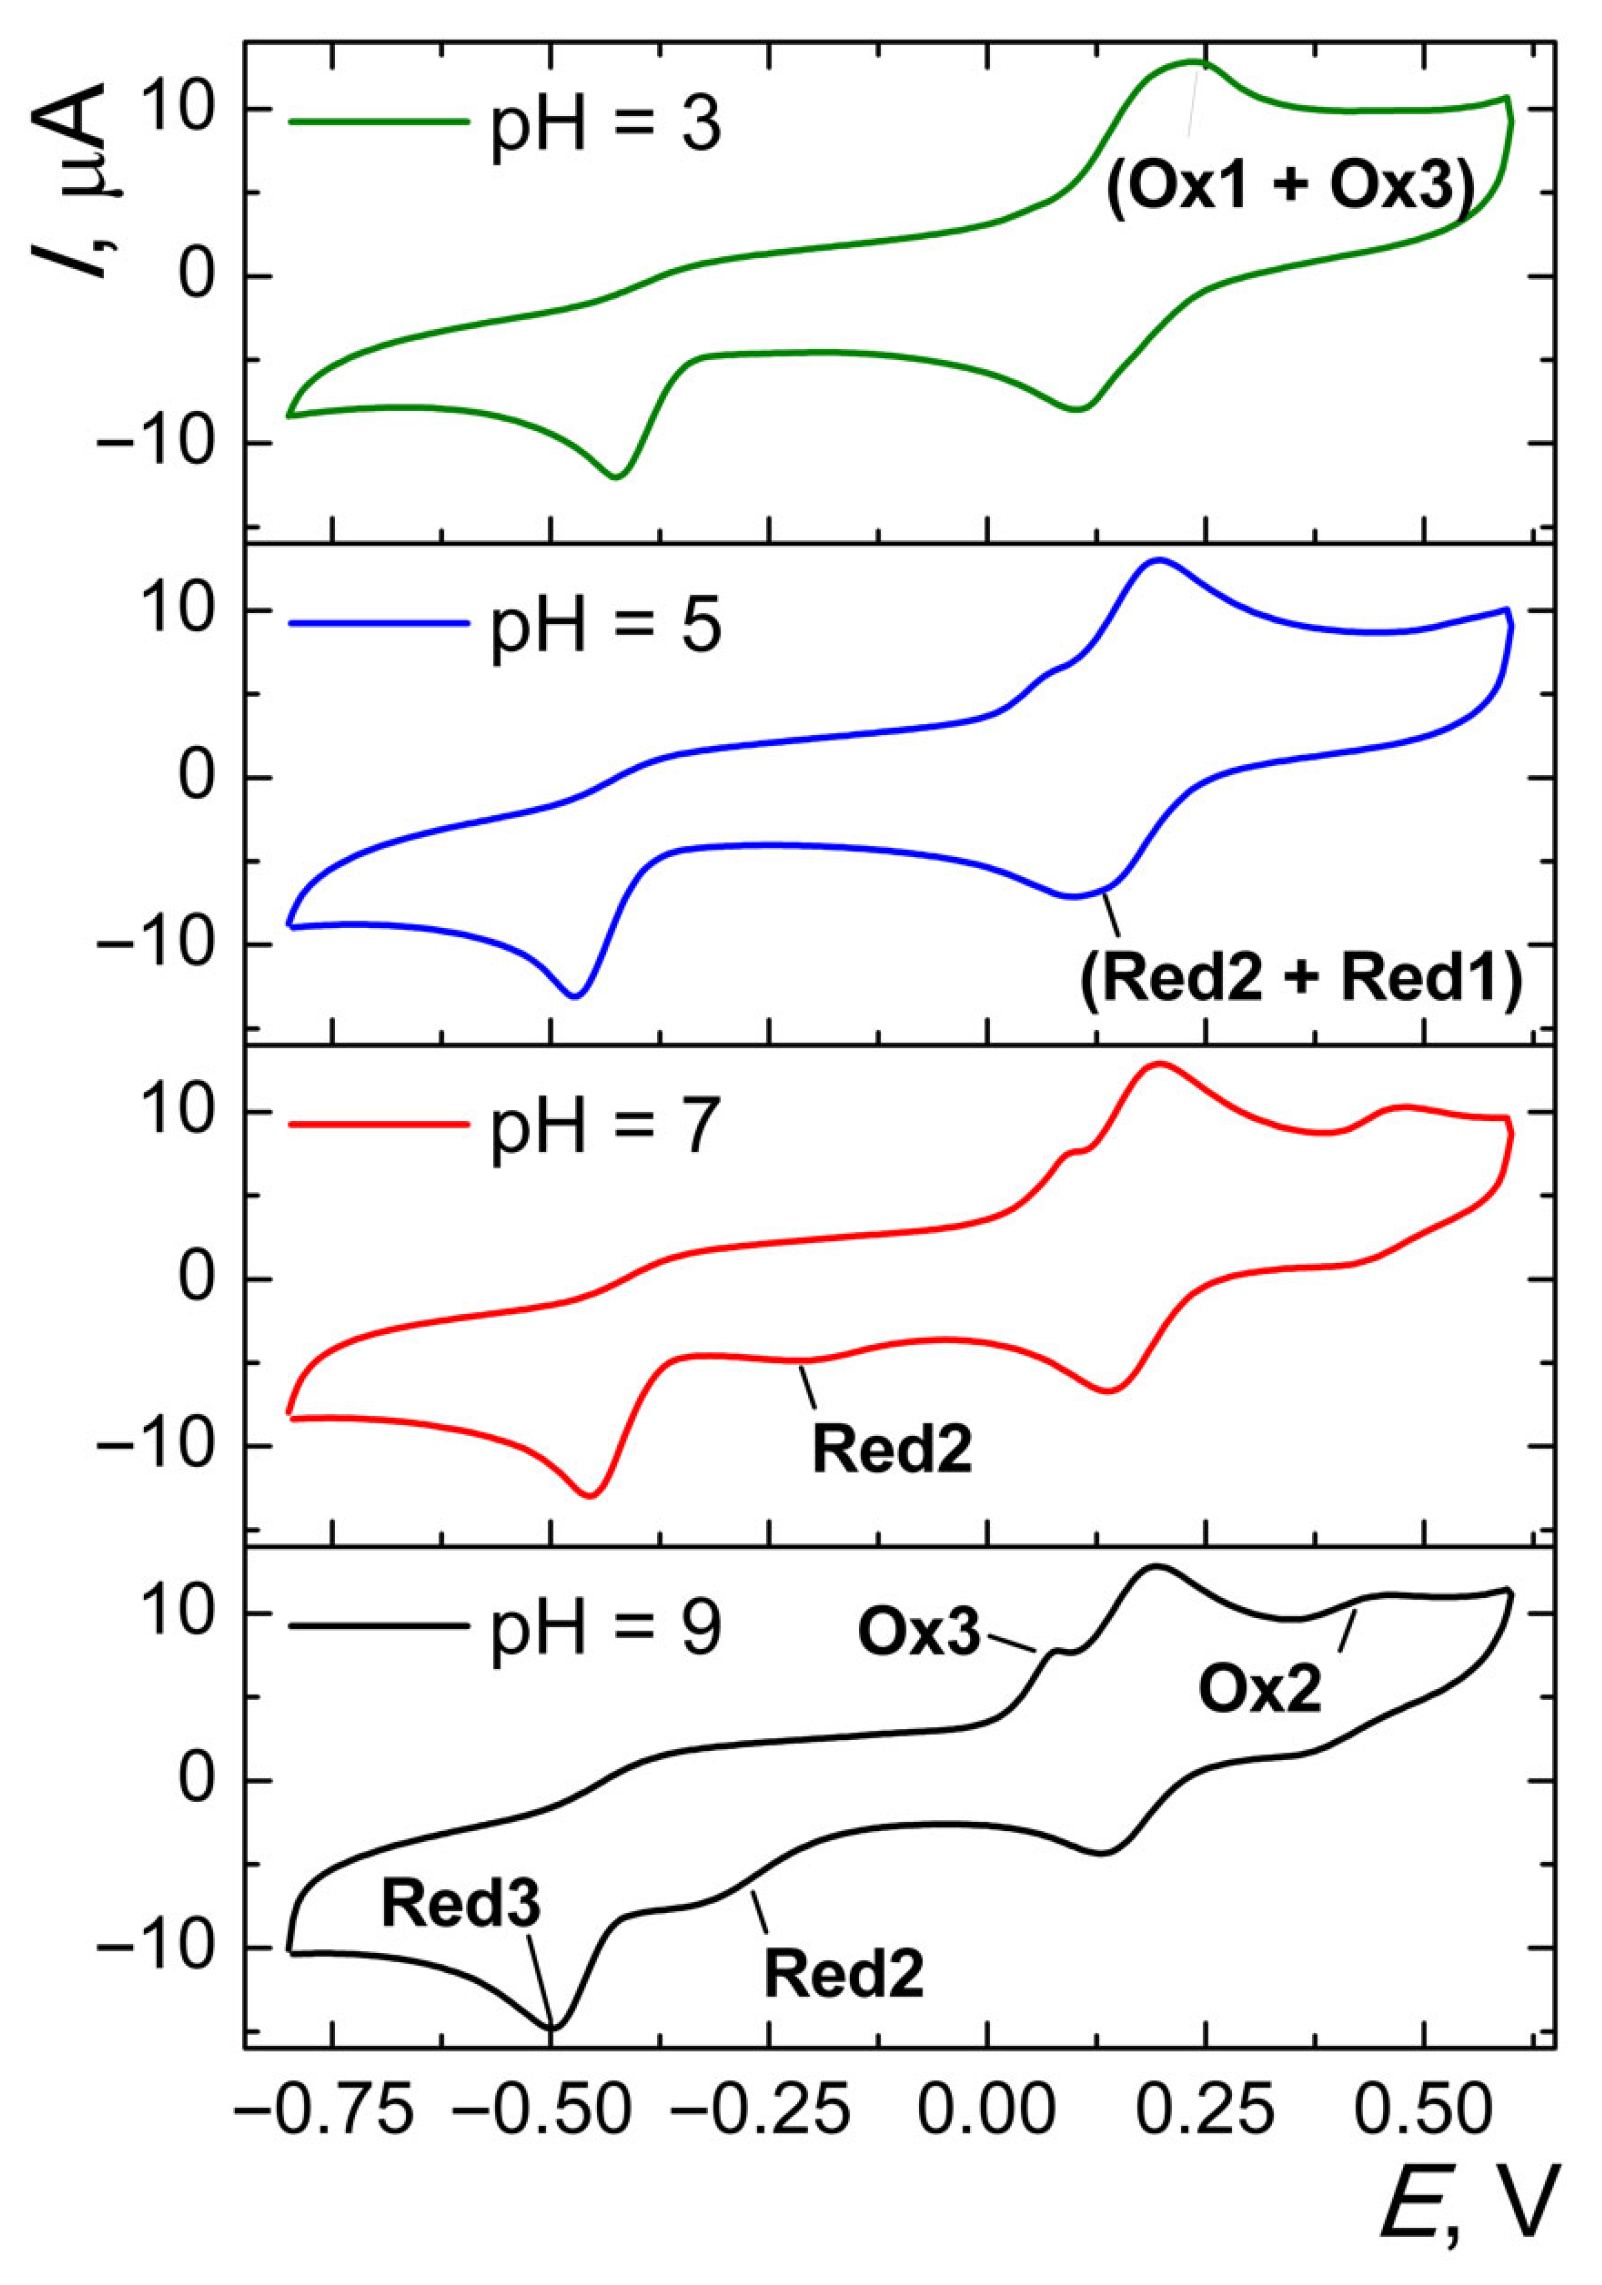
Experiments varying the pH of the working solution were performed to identify electron transfers that are accompanied by hydrogen ion transfer (proton-coupled electron transfer, PCET), as well as the formation of hydroxy complexes. A significant change in the shape of the voltammograms was observed as the pH decreases from nine to three (
Figure 19). As noted above, decreasing the pH to seven led to a shift in the recorded signals. In particular, a shift in the Red2 and Red3 signals toward more positive potentials can be seen. At the same time, the potential difference between these signals also increased. A further decrease in pH to five led to a shift of the Red2 signal toward the Red1 signal, as evidenced by the broadening of the reduction peak at approximately 0.125 V. It should be noted that this broadening was preserved in voltammograms recorded in the range from −0.15 V to 0.45 V, in contrast to the Ox3 signal. This further confirms the previously drawn conclusion about the relationship between the Ox1 and Red2 signals. The mentioned broadening was recorded for a solution at pH = 3 only for the first cycle, which may indicate the initial presence of some oxidized form in the solution and the slowing of its re-formation in solution at this acidity. It was previously shown that at acidic pH < 4, when bubbling argon through a copper(II)
bis-(phosphorylated dithiocarbamate) solution, the formation of oxidized copper(III) complexes occurs. Changes in the position of the Red3 reduction signal with varying pH were nonlinear. The Ox3 oxidation peak decreased in magnitude with a decrease in pH to five, maintaining approximately the same position. However, upon transition to pH = 3, it merged with the Ox1 signal. The Ox2 oxidation signal shifted to the higher anodic potentials with decreasing pH. Thus, changing the pH of the working solution influenced the positions of all recorded signals to varying degrees, including the Cu
II/Cu
III transition (Ox1), which is characterized by a high heterogeneous electron transfer rate constant, but demonstrated a potential shift as a result of merging with the Ox3 signal at pH = 3. The signal from the reverse transition (Red1) retained its position for solutions at pH = 9 and 7, but shifted slightly to the region of negative potentials for solutions at pH = 5 and 3, which is explained by merging with the Red2 signal.
Thus, based on experiments varying the potential scan rate and pH, the Red2 peak can be attributed to the reduction of the copper(III) hydroxy complex—CuIII(PDTC)2(OH)2−, which can form after the Ox1 peak. Evaluation of the standard potential of this reaction through quantum-chemical calculations yields values of −0.235 V and −0.238 V (for the C-PCM and SMD, respectively) relative to the silver chloride reference electrode. This is consistent with the position of the reduction peak Red2 relative to Red1.
In addition to the above, a change in the reversibility of the Ox1/Red1 pair with pH was revealed. The influence of the subsequent chemical step on the current ratio of forward and reverse processes was previously shown for pH = 9 (
Figure 17). Increasing the potential scan rate allowed an increase in the reduction peak to be recorded; however, the recorded
Ic/
Ia value stabilized at 0.75. This behavior is characteristic of an E
rC
i mechanism, where the “i” subscript denotes an irreversible process. Based on the experimental data obtained from pH variation (position of the Red2 peak) and on the ratio of peak currents of the Red1/Ox1 processes, we can conclude that coordination of the hydroxy group is the most probable chemical step following electron transfer. The rate of the chemical step depends on both the concentration of the oxidation product and the concentration of hydroxyl groups, which is determined by the pH of the solution. Thus, for a solution at pH = nine, the OH
− concentration is highest among the solutions studied, which explains the maximum Red2 current at this pH and the absence of a Red1 signal at low potential scan rates (
Figure 17). Additional experiments conducted in solution at pH = 12.2 revealed the absence of a Red1 signal and the probable merging of the Red2 and Red3 signals even at a scan rate of 0.1 V/s (
Figure S1-31). The fact that the
Ic/
Ia ratio is not equal to unity even for high
v values also confirms the fast kinetics of the chemical step.
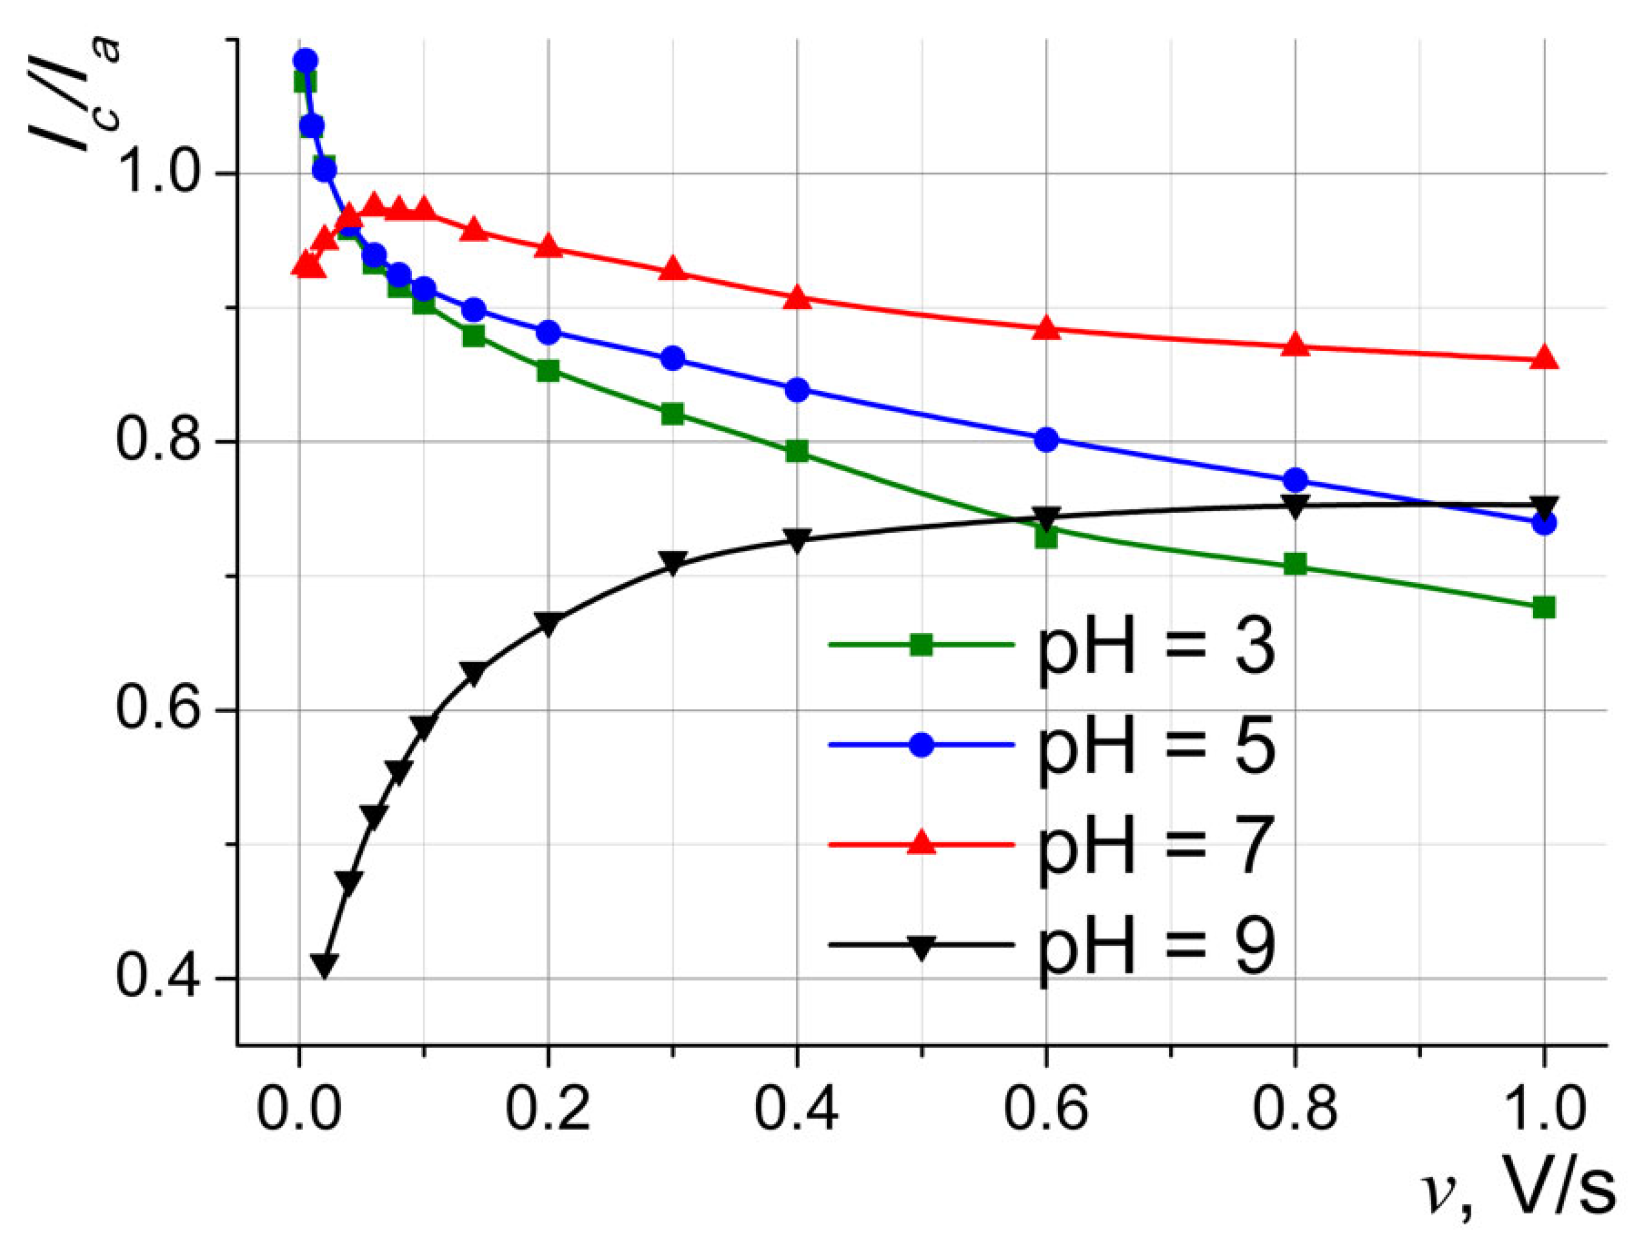
Carrying out similar experiments in solutions at other pH values made it possible to identify changes in the current ratio (
Figure 20). The presence of a dependence of
Ic/
Ia on
v indicates the occurrence of chemical stages for all studied pH values. However, with decreasing pH, an inversion of the obtained dependences is observed. Thus, an increase in the peak current ratio with increasing
v, previously recorded for pH = 9, in the case of solution at pH = 7 is preserved only for the initial scan rates (up to 0.04 V/s), gradually transitioning to a decrease. It is also necessary to note the higher initial value of
Ic/
Ia for pH = 7 (0.93 versus 0.41 for pH = 9), indicating a decrease in the influence of chemical step and an improvement in the reversibility of the electrode process, probably due to a decrease in OH
− concentration. The decrease in the Red2 current at pH = 7 and its absence for the solution at pH = 3 emphasizes this trend (
Figure 19). The change in Red2 position with pH is due to the fact that the electroreduction of Cu
III(PDTC)
2(OH)
2− must be accompanied by the elimination of the previously coordinated hydroxyl group. For acidic solutions, this process is energetically more favorable because it consumes the reaction product. This leads to electroreduction at lower cathodic potentials (in absolute value).
Reversible processes were observed at low potential scan rates (Ic/Ia close to 1, ∆Ep = 67 mV) for lower pH values as well as a decrease in the current ratio for medium and high v values. A decrease in the ratio of cathodic and anodic currents with increasing scan rate indicates the participation of the product of the electrochemical step in a subsequent reversible chemical step. The rate of this stage is sufficiently high that at higher potential scan rates, only a small amount of unreacted product can be detected on the backward scan. However, since the chemical stage is reversible, the backward electrochemical reduction process (Ic) becomes more significant at low v values, where a larger amount of the initial oxidation product is detected (higher ratio). Thus, it can be concluded that the electrochemical oxidation of the CuII(PDTC)22− complex in neutral and acidic media proceeds via the ErCr mechanism, where the “r” subscript indicates the reversibility of the steps.
2.11. Overall Scheme of the Electrochemical Processes
Based on the experimental data and calculated redox potentials (see
Table 2; to recalculate data relative to the silver chloride electrode (SCE) used in the experimental setup, the given values should be reduced by 0.222 V), the Ox1 process can be undoubtedly attributed to the transition of the copper(II)
bis-complex into the corresponding copper(III) compound. The Ox2 potential depends on pH and scan rate (see
Figure 18a and
Figure 19), so the participation of the copper(III) hydroxy-form can be proposed. To reveal this, redox potentials for copper(III) complexes with and without the hydroxy group were determined from quantum-chemical calculations; the obtained data are given in
Table 4.
As can be seen from
Table 4, the redox potential of the hydroxy complex is approximately 1 V lower than that of the simple copper(III)
bis-complex. Data recalculation for the Cu
III(PDTC)
2(OH)
2− form relative to SCE gives values near 0.5–0.7 V; the lover limit is in a good agreement with experimental values of Ox2 (approximately 0.4–0.5 V; see
Figure 18a and
Figure 19). Thus, the Ox2 process can be attributed to the oxidation of the copper(III) hydroxy complex. It should be mentioned that the result of oxidation is a copper(III) complex with an oxidized PDTC ligand (anion-radical form), as is clear from the calculated spin densities (see
Figures S2-189–S2-228).
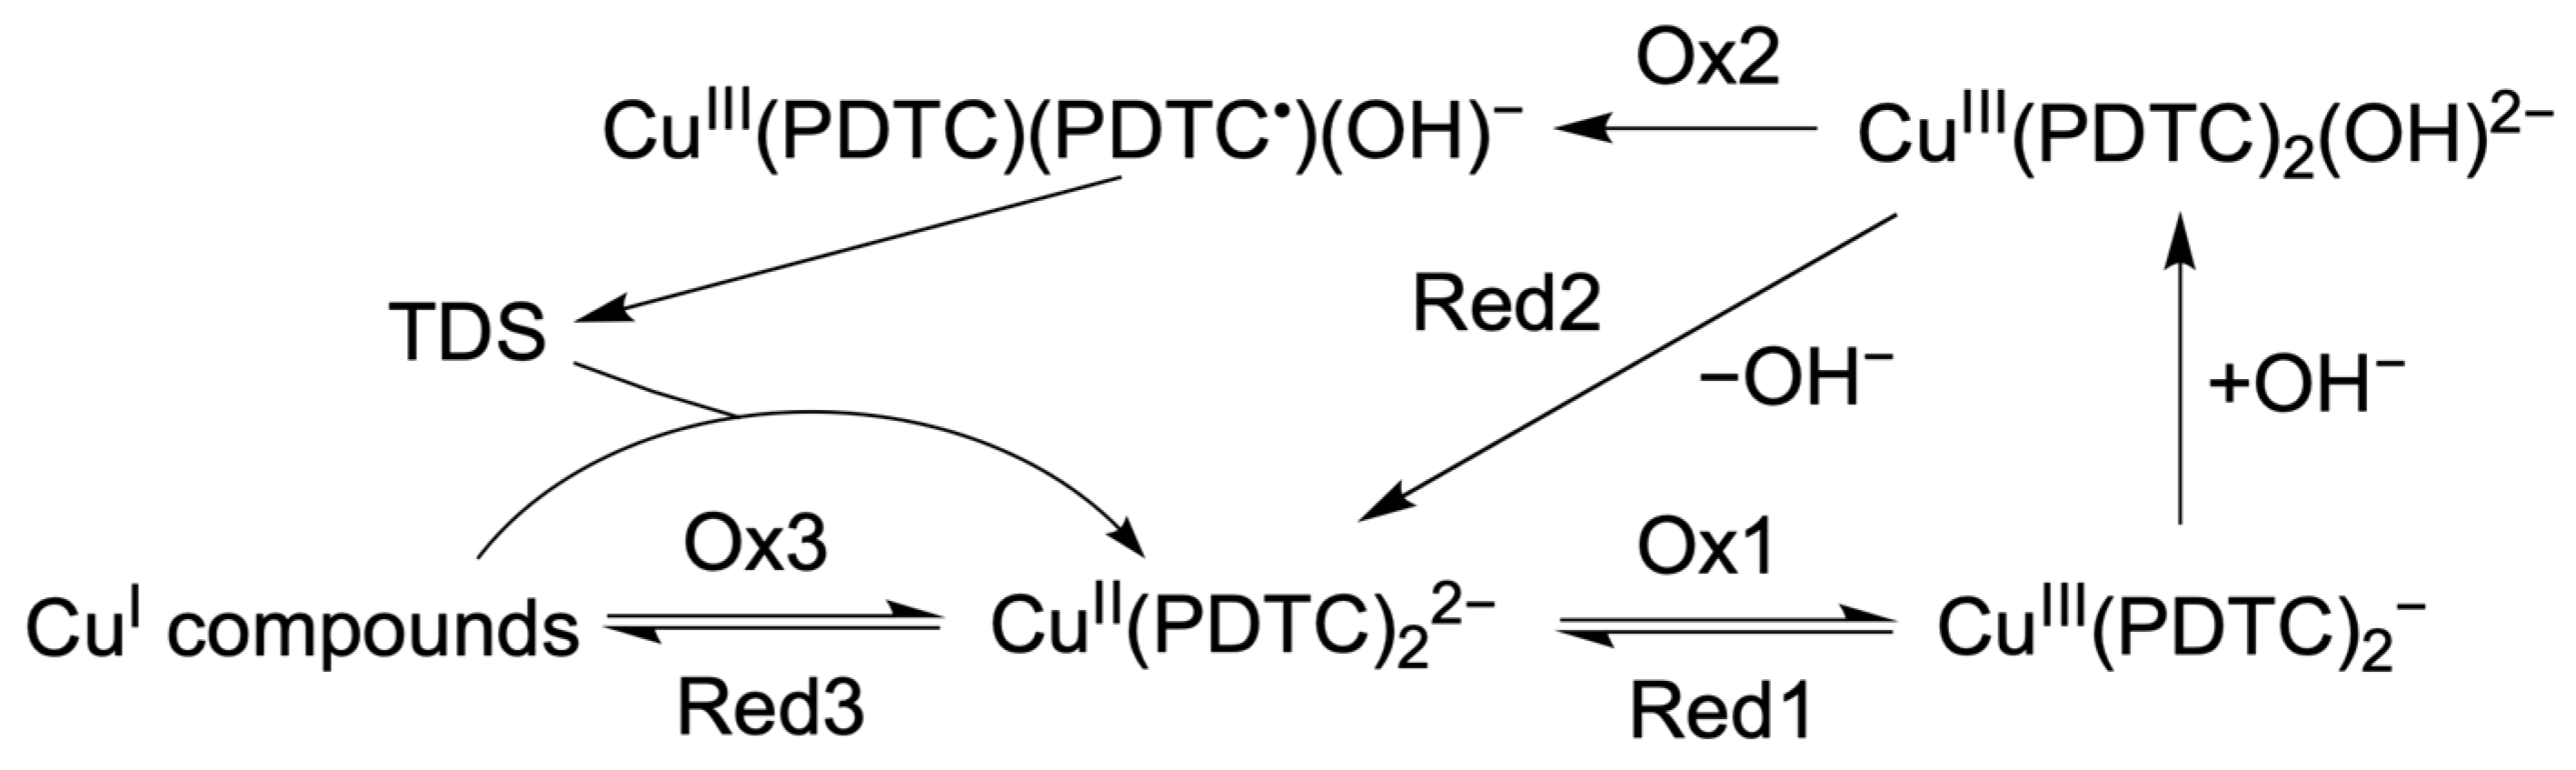
Finally, all chemical and electrochemical steps can be summarized in the proposed pathway (
Scheme 2).
It is also worth noting the Cu
II/Cu
I transition, which according to the literature can be accompanied by disproportionation of the resulting Cu
I compounds to Cu
II and Cu
0 [
30,
31]. Clustering of copper(I) dithiocarbamates with the formation of, among other things, 28-nuclear structures is also known from the literature [
3]. Previously obtained data on the change in reduction peak potential (Red3) with log
v confirm the occurrence of a chemical step for low potential scan rates (
Figure S1-29). The complexity and variety of possible chemical steps, including pH-dependent ones, do not allow the exact products of this electrode process to be established at this stage. A significant potential difference between the forward and reverse signals (Red3 and Ox3) indicates the electrochemical irreversibility of the process as a result of possible significant structural rearrangements of the complex.



 ,
,