Article

Analytical Identification and Quantification of Phosphogypsum in Epoxy Resin Composites

1
College of Chemistry and Chemical Engineering, Guizhou University, Guiyang 550025, China
2
Guizhou Institute of Products Quality Inspection & Testing, Guiyang 550014, China
3
Guizhou Institute of Technology, Analytical Testing Center, Guiyang 550003, China
*
Author to whom correspondence should be addressed.
Inorganics 2026, 14(4), 113; https://doi.org/10.3390/inorganics14040113
Submission received: 9 March 2026 / Revised: 28 March 2026 / Accepted: 29 March 2026 / Published: 14 April 2026
(This article belongs to the Special Issue Multifunctional Composites and Hybrid Materials)

Abstract

Accurate quantification of phosphogypsum (PG) filler in epoxy composites is essential for quality control and performance optimization. Conventional separation by muffle furnace calcination suffers from slow epoxy decomposition and risks thermal degradation of CaSO4, leading to inaccurate PG quantification. This study introduces a microwave-assisted separation method that leverages molecular vibration heating to achieve faster heating rates and more uniform temperature distribution, enabling complete epoxy removal while minimizing CaSO4 decomposition. Comprehensive characterization (X-ray diffraction, XRD; Fourier transform infrared spectroscopy, FT-IR; scanning electron microscopy-energy dispersive spectroscopy, SEM-EDS) confirms the structural integrity of the isolated PG filler. Among five quantification methods evaluated, inductively coupled plasma optical emission spectrometry (ICP-OES) based on sulfur content provides the highest accuracy (spike recovery: 91–99.8%, relative standard deviation, RSD ≤ 4.2%), while gravimetry suffices for single-filler systems. This work establishes a reliable analytical framework for PG characterization in epoxy composites, supporting quality control and resource valorization.

1. Introduction

Epoxy resins are widely used as matrices for high-performance composites because of their mechanical strength, adhesion, chemical resistance, and compatibility with various fillers [1,2,3,4,5,6]. Epoxy-based composites have found extensive applications across aerospace, electronics, construction, and automotive industries due to their favorable properties [7,8,9].
The incorporation of phosphogypsum (PG)—a solid waste generated during phosphoric acid production—as a filler in epoxy composites offers a dual benefit: it valorizes an industrial by-product while potentially enhancing material performance and reducing costs [10,11,12]. However, the macroscopic properties of these composites are critically dependent on the filler content, dispersion, and interfacial bonding. Therefore, accurate identification and quantification of PG within the epoxy matrix are essential for quality control and performance optimization [13,14,15].
Currently, a standardized analytical protocol for PG in epoxy composites remains elusive, primarily due to challenges in separating the cured thermoset matrix from the inorganic filler. Conventional methods, such as direct calcination in a muffle furnace, suffer from slow oxidative decomposition of the epoxy matrix and require elevated temperatures that risk decomposing CaSO4, while organic solvents alone cannot dissolve the highly cross-linked epoxy network [16], resulting in incomplete separation.
As an emerging alternative, high-temperature microwave heating offers distinct advantages. Unlike conventional furnace heating, which transfers heat from the surface inward, microwave heating operates via molecular vibration (dipolar polarization and ionic conduction), enabling simultaneous internal and external heating of the material. This mechanism provides faster heating rates, more uniform temperature distribution, and higher thermal efficiency at the same nominal temperature [17]. Consequently, microwave treatment can achieve more complete removal of the epoxy matrix while minimizing thermal decomposition of CaSO4, thereby preserving the structural integrity of the PG filler and improving quantification accuracy. Despite its potential, the application of microwave heating for separating PG from epoxy composites has not been systematically investigated.
The motivation for this study stems from the practical need in industrial quality control: epoxy composites containing PG filler are increasingly used in construction applications, yet no standardized analytical method exists to accurately determine the filler content after curing. Preliminary experiments revealed that conventional calcination yields inconsistent results due to incomplete epoxy removal or partial CaSO4 decomposition-a fundamental trade-off where complete matrix removal requires >500 °C but risks filler degradation. To address this challenge, the novelty of this work is threefold: (1) it establishes the first systematic application of microwave-assisted separation for PG-epoxy composites, demonstrating superior preservation of filler integrity; (2) it provides the first side-by-side comparison of five quantification methods under identical conditions; and (3) it integrates these elements into a comprehensive “separation–identification–quantification” analytical framework. Collectively, this study aims to establish a reliable workflow readily implementable for quality control and resource valorization.

2. Experimental Materials and Methods

2.1. Experimental Materials

2.1.1. Epoxy Resin

Bisphenol A-type epoxy resin was selected for this study. Possessing an epoxy equivalent weight (EEW) ranging from 210 to 230 g/mol and exhibiting favorable comprehensive properties, this resin is extensively utilized in composite applications. Furthermore, its viscous liquid state at room temperature facilitates facile homogenization with other constituent materials.

2.1.2. Phosphogypsum

Phosphogypsum procured from the Xifeng Phosphorus Plant served as the filler. Its primary chemical composition (by mass) consists of approximately 85% calcium sulfate (CaSO4), complemented by impurities such as silica (SiO2), iron(III) oxide (Fe2O3), and aluminum oxide (Al2O3). Prior to composite fabrication, the raw phosphogypsum underwent drying at 300 °C until a constant weight was achieved. Subsequently, the material was pulverized using a grinding mill to a particle size finer than 100 mesh, a critical step to ensure homogeneous dispersion throughout the epoxy matrix.

2.1.3. Curing Agent

Amine-based curing agent 650 was employed for its high reactivity with epoxy resins, facilitating cross-linking and network formation under appropriate conditions. The dosage of the curing agent was precisely calculated based on the epoxy value of the resin and the theoretical stoichiometric ratio.

2.1.4. Other Reagents

Analytical grade reagents, including hydrochloric acid (HCl, 37%, CAS 7647-01-0), tetrahydrofuran (THF, ≥99.9%, CAS 109-99-9), N,N-dimethylformamide (DMF, ≥99.5%, CAS 68-12-2), and acetone (≥99.5%, CAS 67-64-1), were utilized throughout this work. A sulfur and calcium standard solution (1000 μg/mL, GBW(E) 080264), pure hydrofluoric acid (HF, 48 wt.%, CAS 7664-39-3), and nitric acid (HNO3, 65 wt.%, CAS 7697-37-2) were procured from Aladdin and Tianjin Kermel (Guiyang, China). Deionized water (18.25 MΩ·cm), essential for chemical identification and quantification experiments, was generated using a Milli-Q purification system (Darmstadt, Germany).

2.1.5. Instruments

XRD analysis was performed using a D8 Advance diffractometer ((Bruker AXS GmbH, Karlsruhe, Germany) with Cu Kα radiation (λ = 1.5418 Å). Operating conditions included a tube voltage of 40 kV, current of 40 mA, a 2θ scanning range of 10° to 80°, and a step size of 2°. The instrument characterized CaSO4 crystalline phases, providing phase-based evidence for gypsum-like substance identification.
SEM-EDS was conducted using a Sigma 300 SEM (Zeiss, Oberkochen, Germany) with an accelerating voltage of 15 kV, beam spot diameter of 10 μm, and acquisition time of 100 s. SEM observed PG surface morphology, while EDS enabled qualitative and quantitative detection of key elements, particularly phosphorus, to distinguish PG from other gypsum types.
FTIR spectra were obtained using a Nicolet iS50 instrument (Thermo Fisher Scientific, Waltham, MA, USA) with a scanning range of 4000–400 cm−1. Characteristic SO42− peaks were used for PG identification: asymmetric S=O stretching at 1000–1300 cm−1 and bending vibrations at 500–790 cm−1. Residual PVC was identified by the -CH2- stretching peak at 2844 cm−1.
Thermogravimetric analysis (TGA) and derivative thermogravimetry (DTG) were performed using a TG 309 Libra Supreme thermal analyzer ((Netzsch, Selb, Germany) German Naichi Thermal Analysis. Approximately 5–10 mg of sample was placed in an alumina crucible and heated from room temperature to 800 °C at a heating rate of 10 °C/min under nitrogen atmosphere (flow rate: 50 mL/min). The instrument provided simultaneous recording of mass loss (TGA) and its first derivative (DTG), enabling the identification of thermal decomposition stages.
ICP-OES elemental quantification was conducted using an Optima 8300 system (PerkinElmer, Waltham, MA, USA) with radial plasma observation. Analytical lines were set at 181.975 nm for sulfur and 213.618 nm for phosphorus. The system’s low detection limits enabled precise quantification of trace elements, meeting environmental regulatory standards for solid waste analysis.
Anions were separated using a Dionex ICS-1100 ion chromatography (IC) system (Thermo Fisher Scientific, Waltham, MA, USA) equipped with an IonPac AS11-HC column (4 × 250 mm). Elution used 3.5 mM Na2CO3 at a flow rate of 1.0 mL/min, allowing efficient separation of SO42− from F- and Cl, ensuring reliable SO42− quantification by minimizing interference from coexisting anions.
Additional equipment included a muffle furnace (XD series, Luoyang Xingding Kiln Co., Luoyang, China), a high-temperature microwave experimental oven (Henan Kexin Microwave Technology Co., Ltd. Zhengzhou, China), an electric centrifuge (Model 800, Changzhou Guoyu Instrument Co., Changzhou, China), a constant temperature and humidity chamber (DHG-9053A, Shanghai Jinghong Experimental Equipment Co., Shanghai, China), and an electronic balance with a capacity of ≥200 g and resolution of 0.0001 g (Shanghai Shunyu Hengping Scientific Instrument Co., Shanghai, China).

2.2. Preparation of Epoxy Resin Composites

2.2.1. Formulation Design

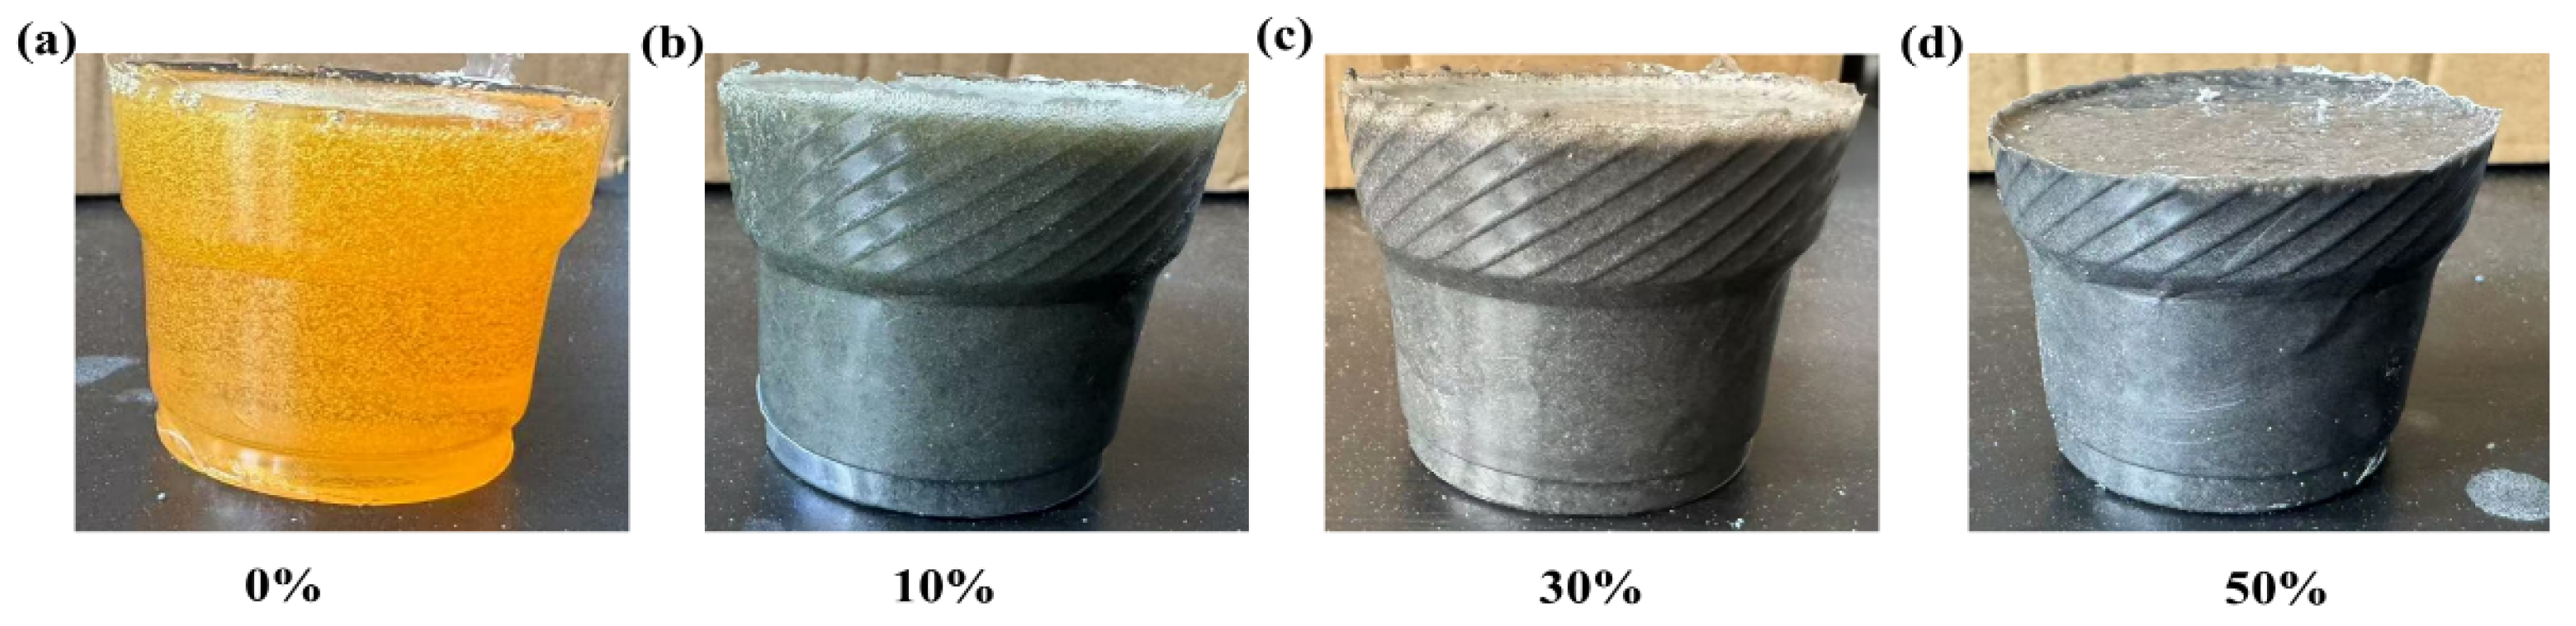
Composite formulations were designed with varying phosphogypsum loadings, maintaining a consistent epoxy-to-curing agent ratio of 1:1. Phosphogypsum was incorporated at mass fractions of 0%, 10%, 30%, and 50%, as illustrated in Figure 1. This experimental design ensures a sufficiently broad concentration range to systematically investigate its influence on the separation, characterization, and quantification processes.

2.2.2. Preparation Process

The dried and pulverized phosphogypsum was incorporated into the epoxy resin according to the designed proportions. The mixture was subjected to high-speed agitation at 1000 r/min for 30 min to ensure the homogeneous dispersion of the filler within the matrix. Subsequently, the curing agent was added at a 1:1 stoichiometric ratio relative to the epoxy resin, and stirring continued for an additional 15 min to facilitate thorough homogenization. The resulting mixture was then cast into molds and cured at 60 °C for 2 h, followed by cooling to room temperature, yielding epoxy/phosphogypsum composites with stable performance characteristics.

2.2.3. Separation of Phosphogypsum from Epoxy Resin

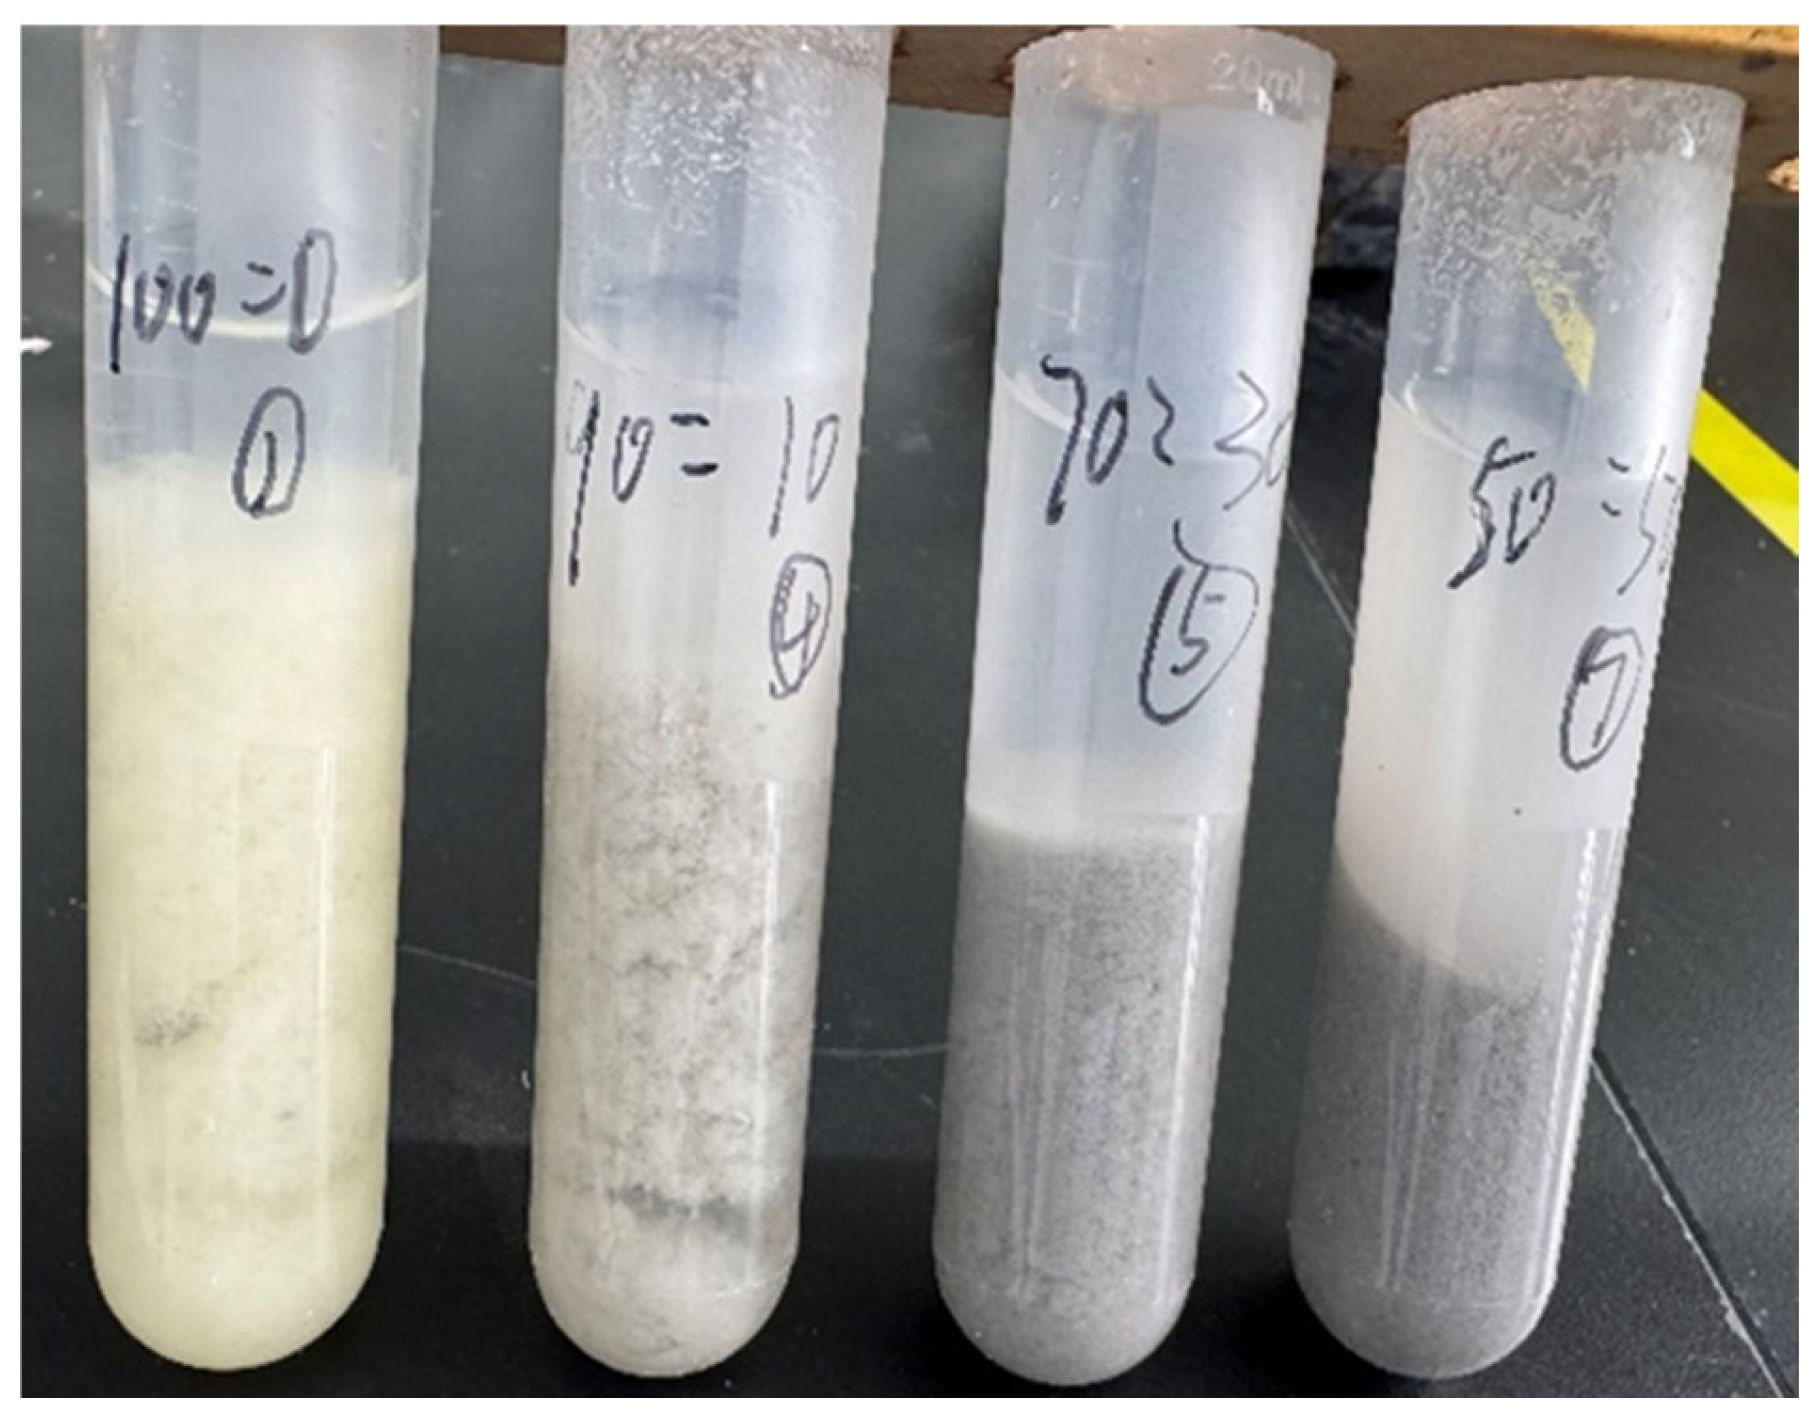
Phosphogypsum was isolated from the epoxy composites via a combined protocol involving chemical solvent swelling, high-temperature microwave heating, and calcination. The swelling solvent mixture consisted of DMF, acetone, and THF in a volume ratio of 1:1:1. Approximately 2 g of pulverized composite sample was immersed in 20 mL of this mixture in centrifugal tubes. This facilitated the thorough impregnation of the epoxy matrix, which was then subjected to a 24-hour water bath treatment at 60 °C. The resulting swollen solids were centrifuged and rinsed repeatedly with anhydrous ethanol to eliminate residual organic solvents. Subsequently, the purified swollen material (as depicted in Figure 2) was dried in an oven at 60 °C. The resulting dry specimens were reserved for subsequent high-temperature microwave heating and calcination experiments.
Muffle Furnace Calcination Method: The swollen and dried sample was placed in a ceramic crucible and subjected to calcination in a muffle furnace. The temperature was ramped to 600 °C at a heating rate of 5 °C/min and held constant for 120 min to ensure complete ashing of the epoxy resin.
High-temperature microwave heating: The swollen and dried sample was placed in a quartz crucible and treated in a microwave oven. The temperature was increased to 600 °C at a heating rate of 10 °C/min and maintained for 90 min to obtain purified phosphogypsum filler for subsequent analysis.
Criteria for Complete Epoxy Removal: Complete removal of the epoxy matrix was confirmed when the residue reached a constant weight (variation < 0.5% after two consecutive heating cycles) and when no characteristic epoxy peaks were detected in FT-IR spectra (absence of C-H stretching at 2844 cm−1).

2.2.4. Digestion and Elemental Analysis of PG

To ensure complete dissolution of PG, primarily composed of anhydrous CaSO4, a robust acid digestion procedure was employed. Approximately 0.05 g of separated PG was weighed into a polytetrafluoroethylene (PTFE) digestion vessel. A mixture of 1 mL concentrated HF and 2 mL concentrated HNO3 was added, and the vessel was sealed and placed in a digestion tank. Closed-system digestion was performed in an oven at 180–190 °C for 24–30 h until the solution turned clear. The digested solution was transferred to a hotplate and evaporated to near dryness at 140 °C, followed by adding <1 mL of HNO3 to remove residual volatiles. Then, 2 mL of HNO3 and 3 mL of deionized water were added, and the mixture was heated at 140 °C for another 4–5 h. After cooling, the solution was diluted with deionized water to a final volume of 50 mL. Elemental analysis was conducted using ICP-OES to quantify Ca, S, P, Si, Fe, and Al concentrations. SO42− concentrations were determined using IC.

3. Results and Discussion

3.1. Characterization of Epoxy Resin/Phosphogypsum Composites

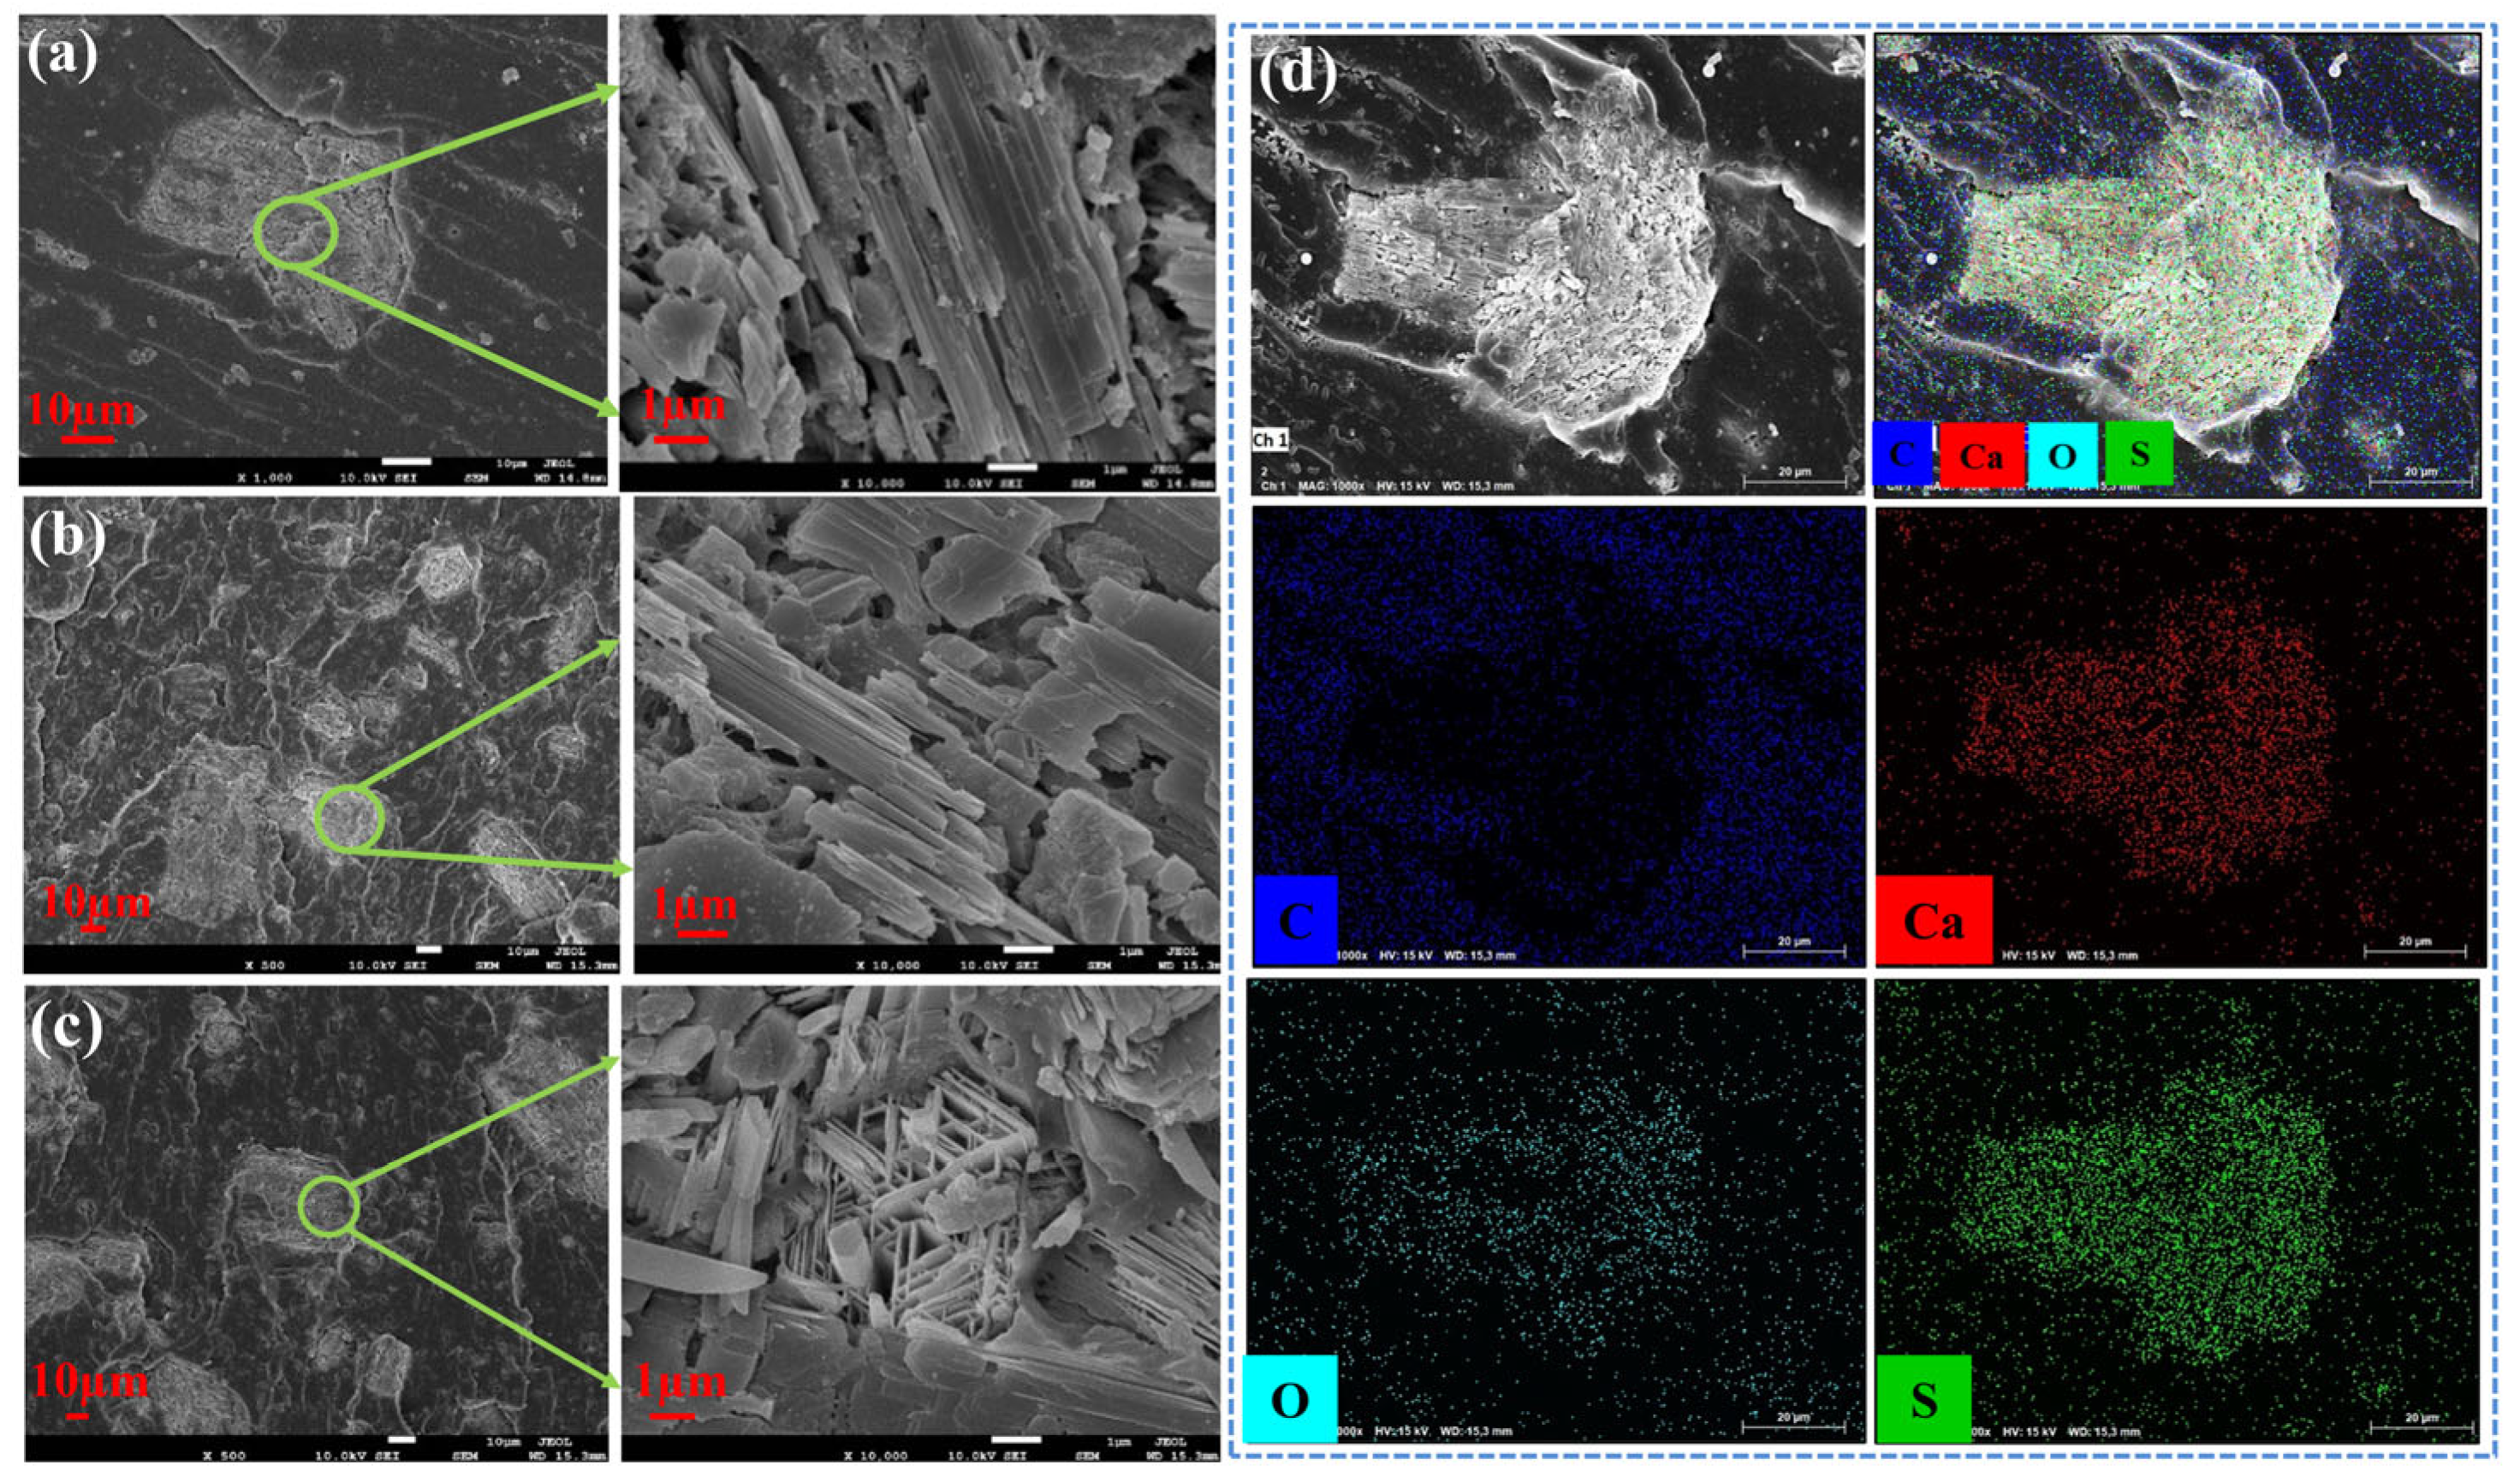
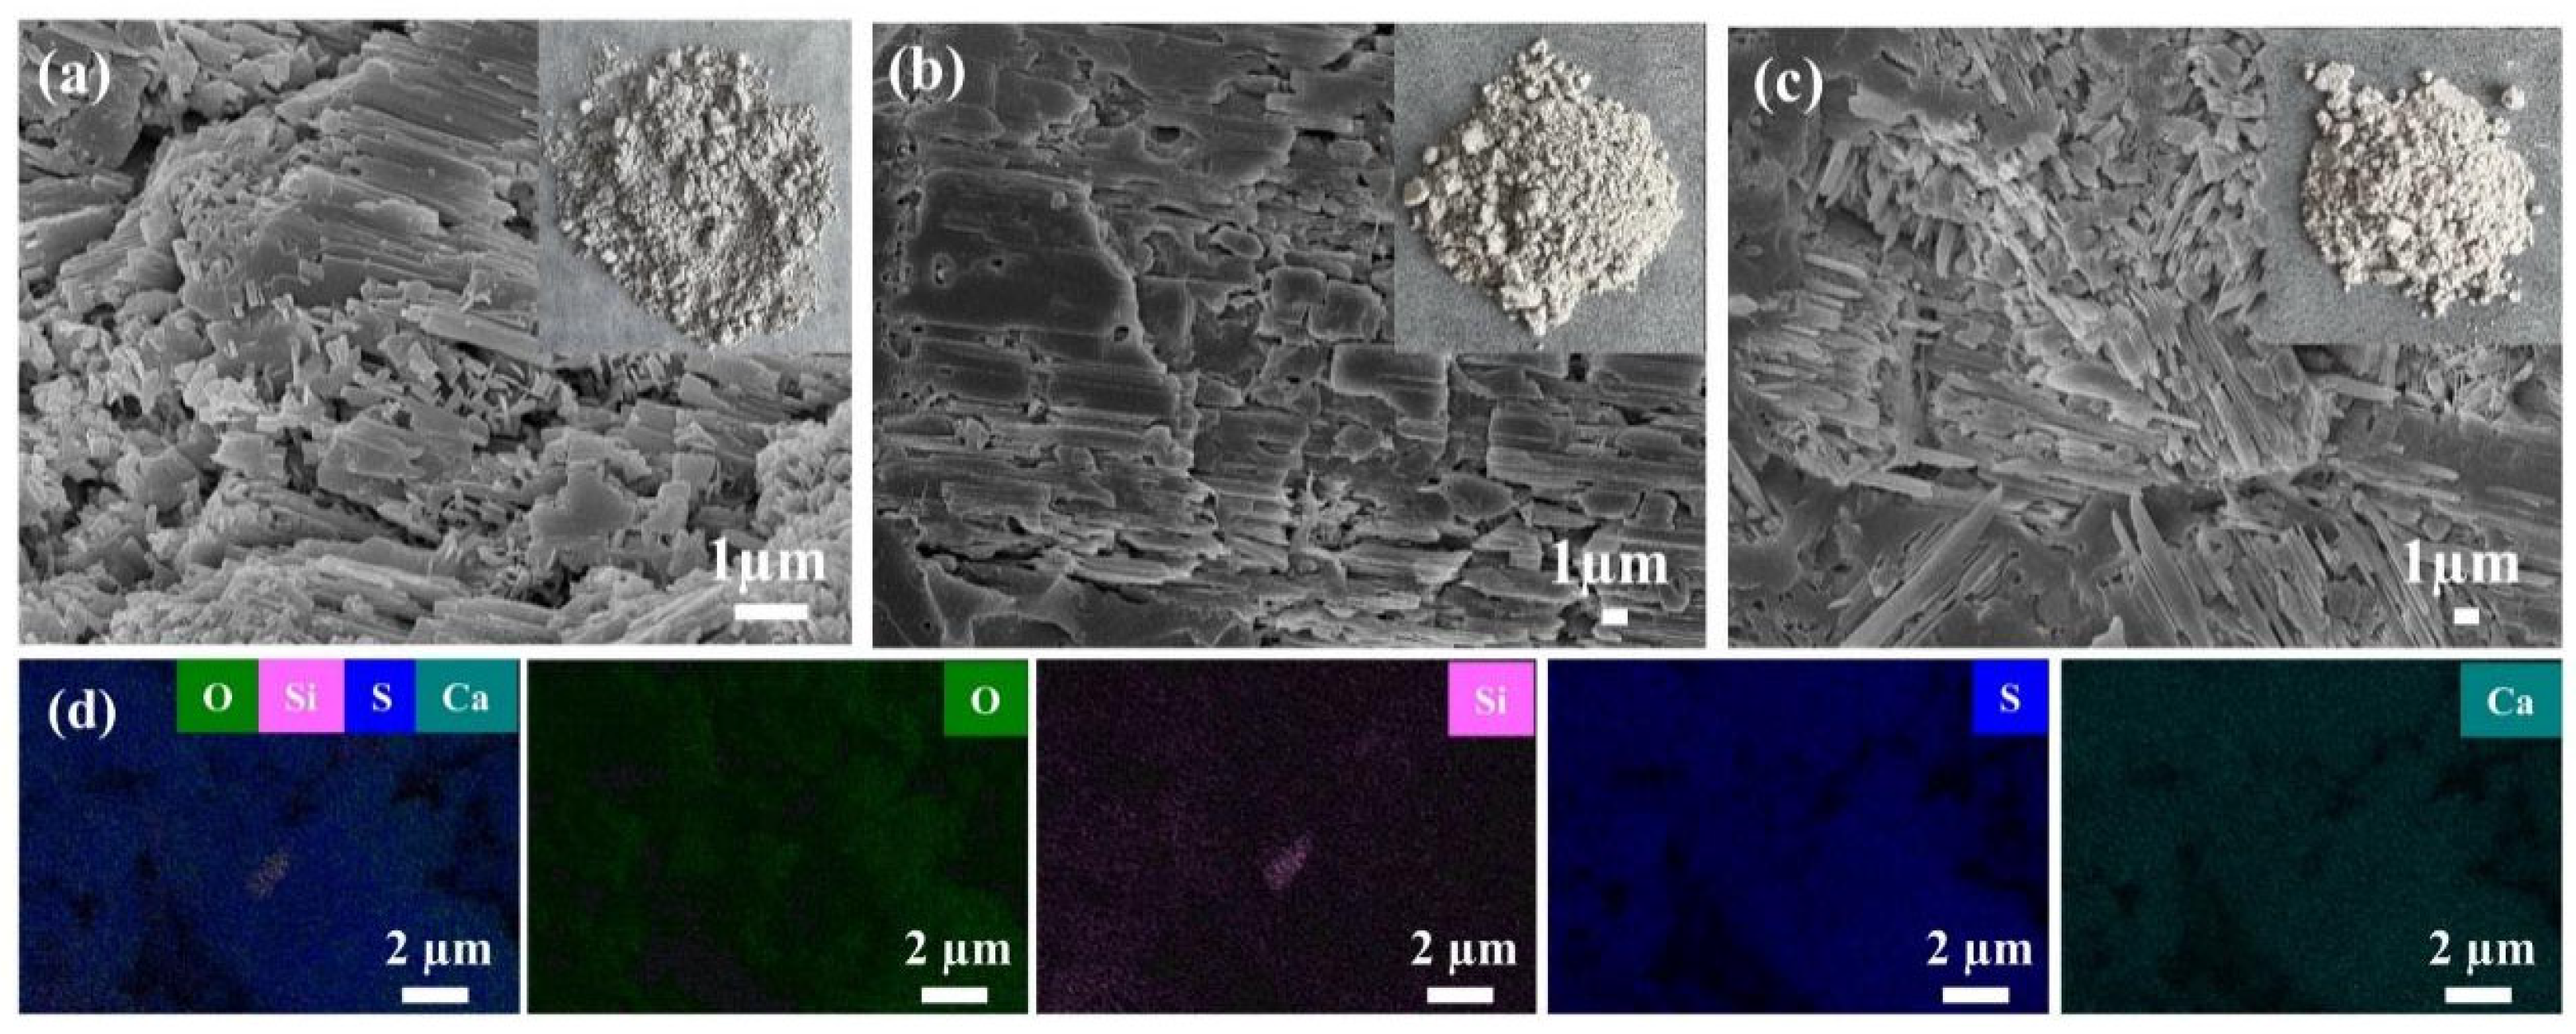
The microstructural morphology and elemental distribution of the epoxy composites were systematically investigated using Scanning Electron Microscopy (SEM) coupled with Energy-Dispersive Spectroscopy (EDS) elemental mapping. Figure 3a–c illustrate the cross-sectional morphologies of composites containing 10%, 30%, and 50% phosphogypsum, respectively, while Figure 3d presents the corresponding distribution profiles of calcium (Ca), sulfur (S), and oxygen (O) elements.
SEM observations revealed that the anhydrous calcium sulfate particles within the epoxy matrix exhibit a characteristic “sea–island” morphology. In the 10% loading sample (Figure 3a), phosphogypsum particles ranging from 1 to 3 µm are uniformly dispersed within the epoxy continuous phase. As the loading increases to 30% (Figure 3b), the density of filler particles increases significantly, with minor agglomeration observed in localized regions, although overall dispersion remains favorable. At a loading of 50% (Figure 3c), the filler particles form a continuous network structure, with close packing evident in certain areas, yet the epoxy matrix still provides effective encapsulation. The elemental mapping analysis (Figure 3d) demonstrates that the distribution of Ca and S elements is perfectly coincident and highly consistent with the O element distribution. This ternary co-localization serves as definitive evidence for the chemical integrity of the phosphogypsum (CaSO4) within the epoxy matrix. Notably, the signal intensity of these three elements correlates positively with the phosphogypsum content: signal points are sparsely distributed in the 10% sample, increase significantly in density in the 30% sample, and appear almost sheet-like in the 50% sample. Importantly, no significant elemental segregation was observed across all loadings, indicating the successful dispersion of anhydrous calcium sulfate. Collectively, these experimental data substantiate the reliability and accuracy of the established “isolation-identification-quantification” analytical framework for epoxy/phosphogypsum composites.

3.2. Optimization and Selection of Separation Methods for Epoxy Resin/Phosphogypsum Composites

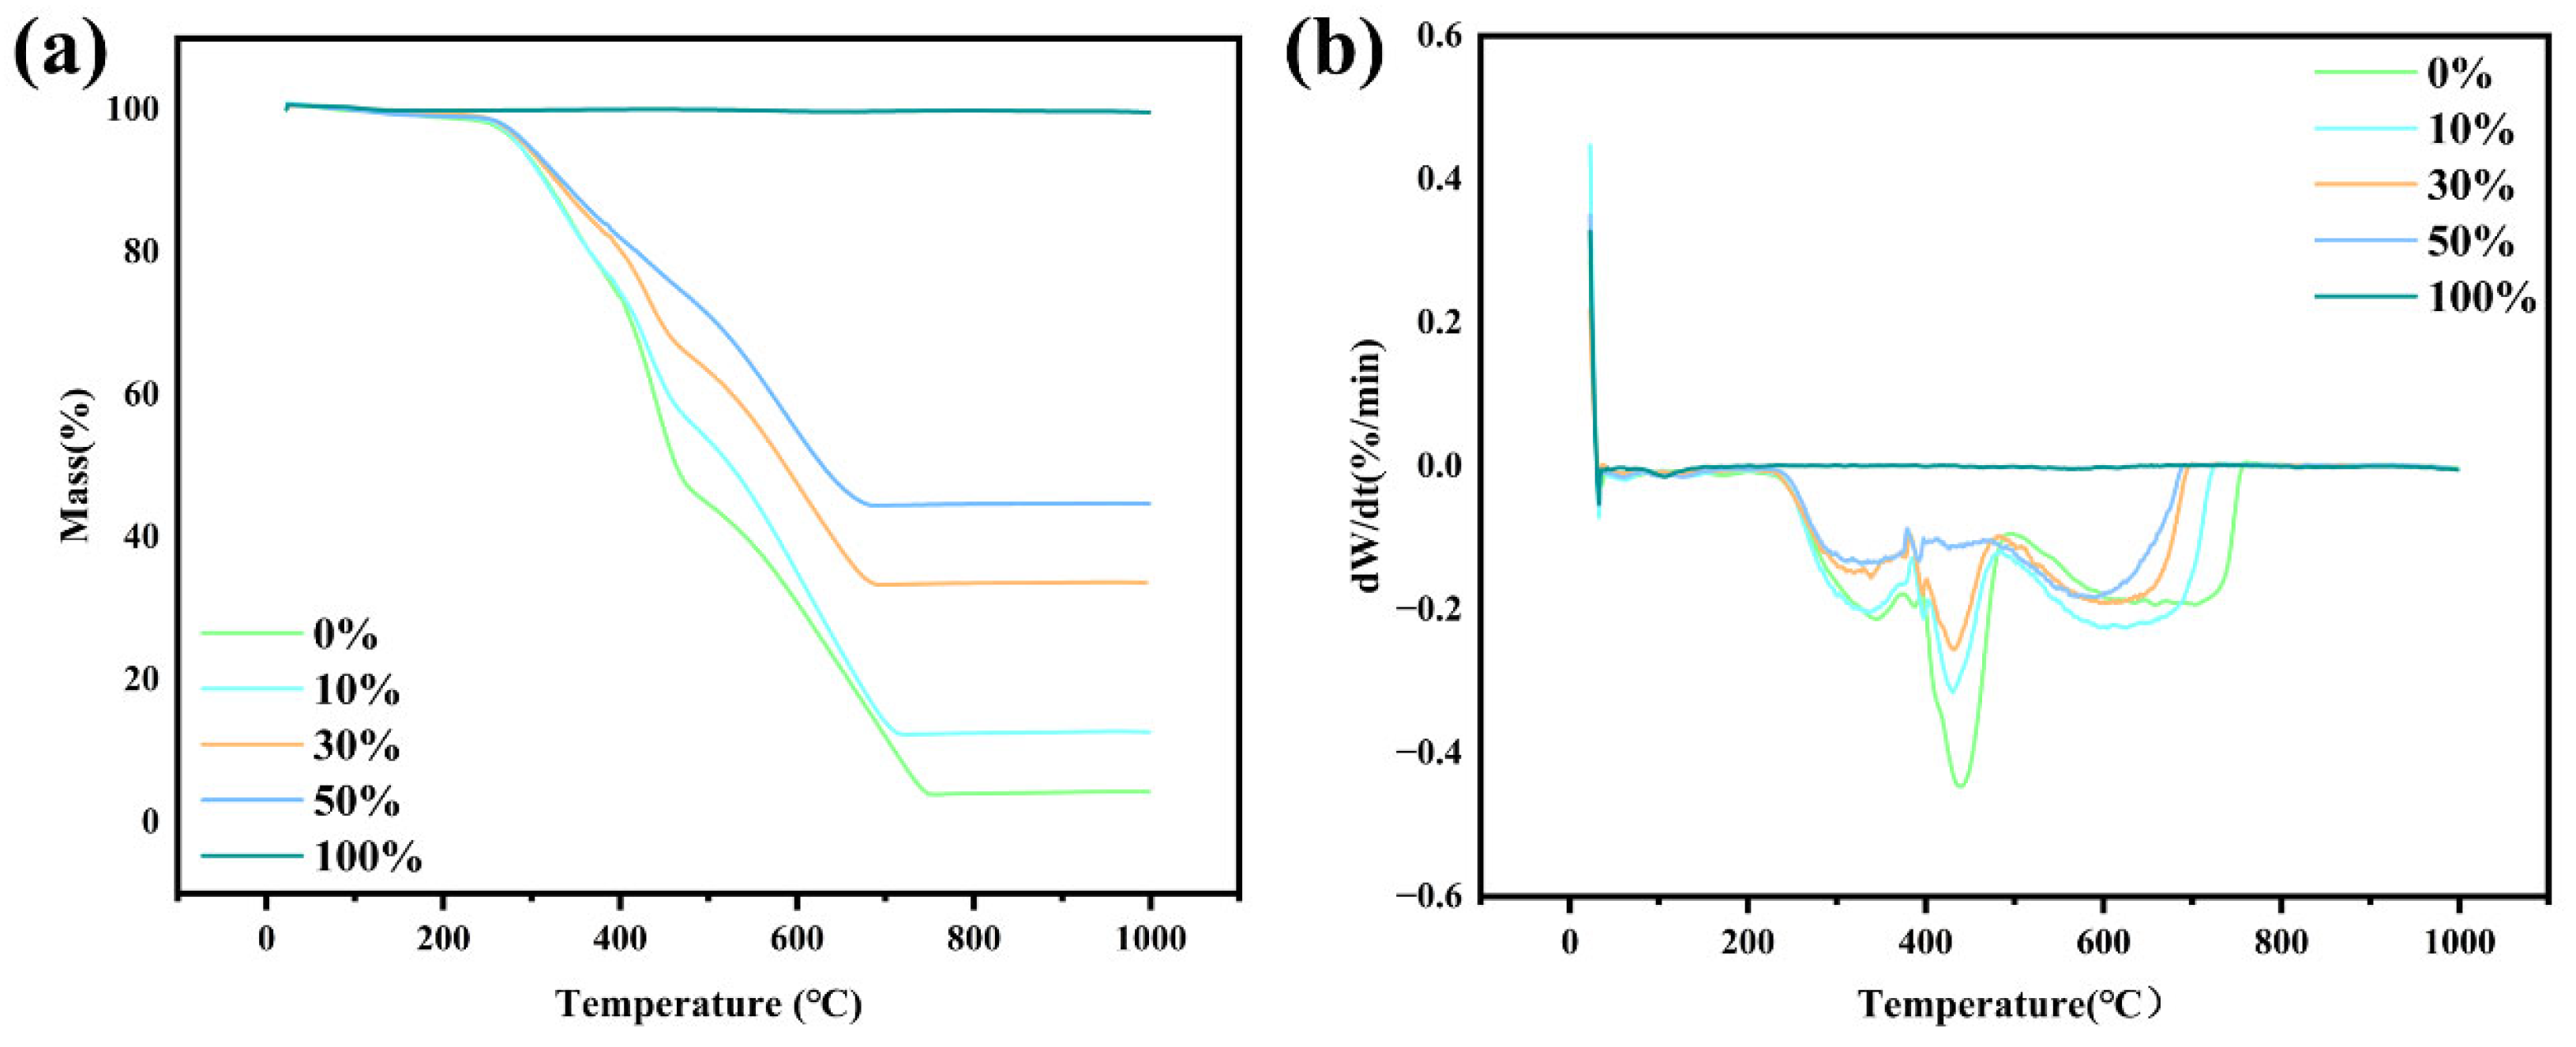
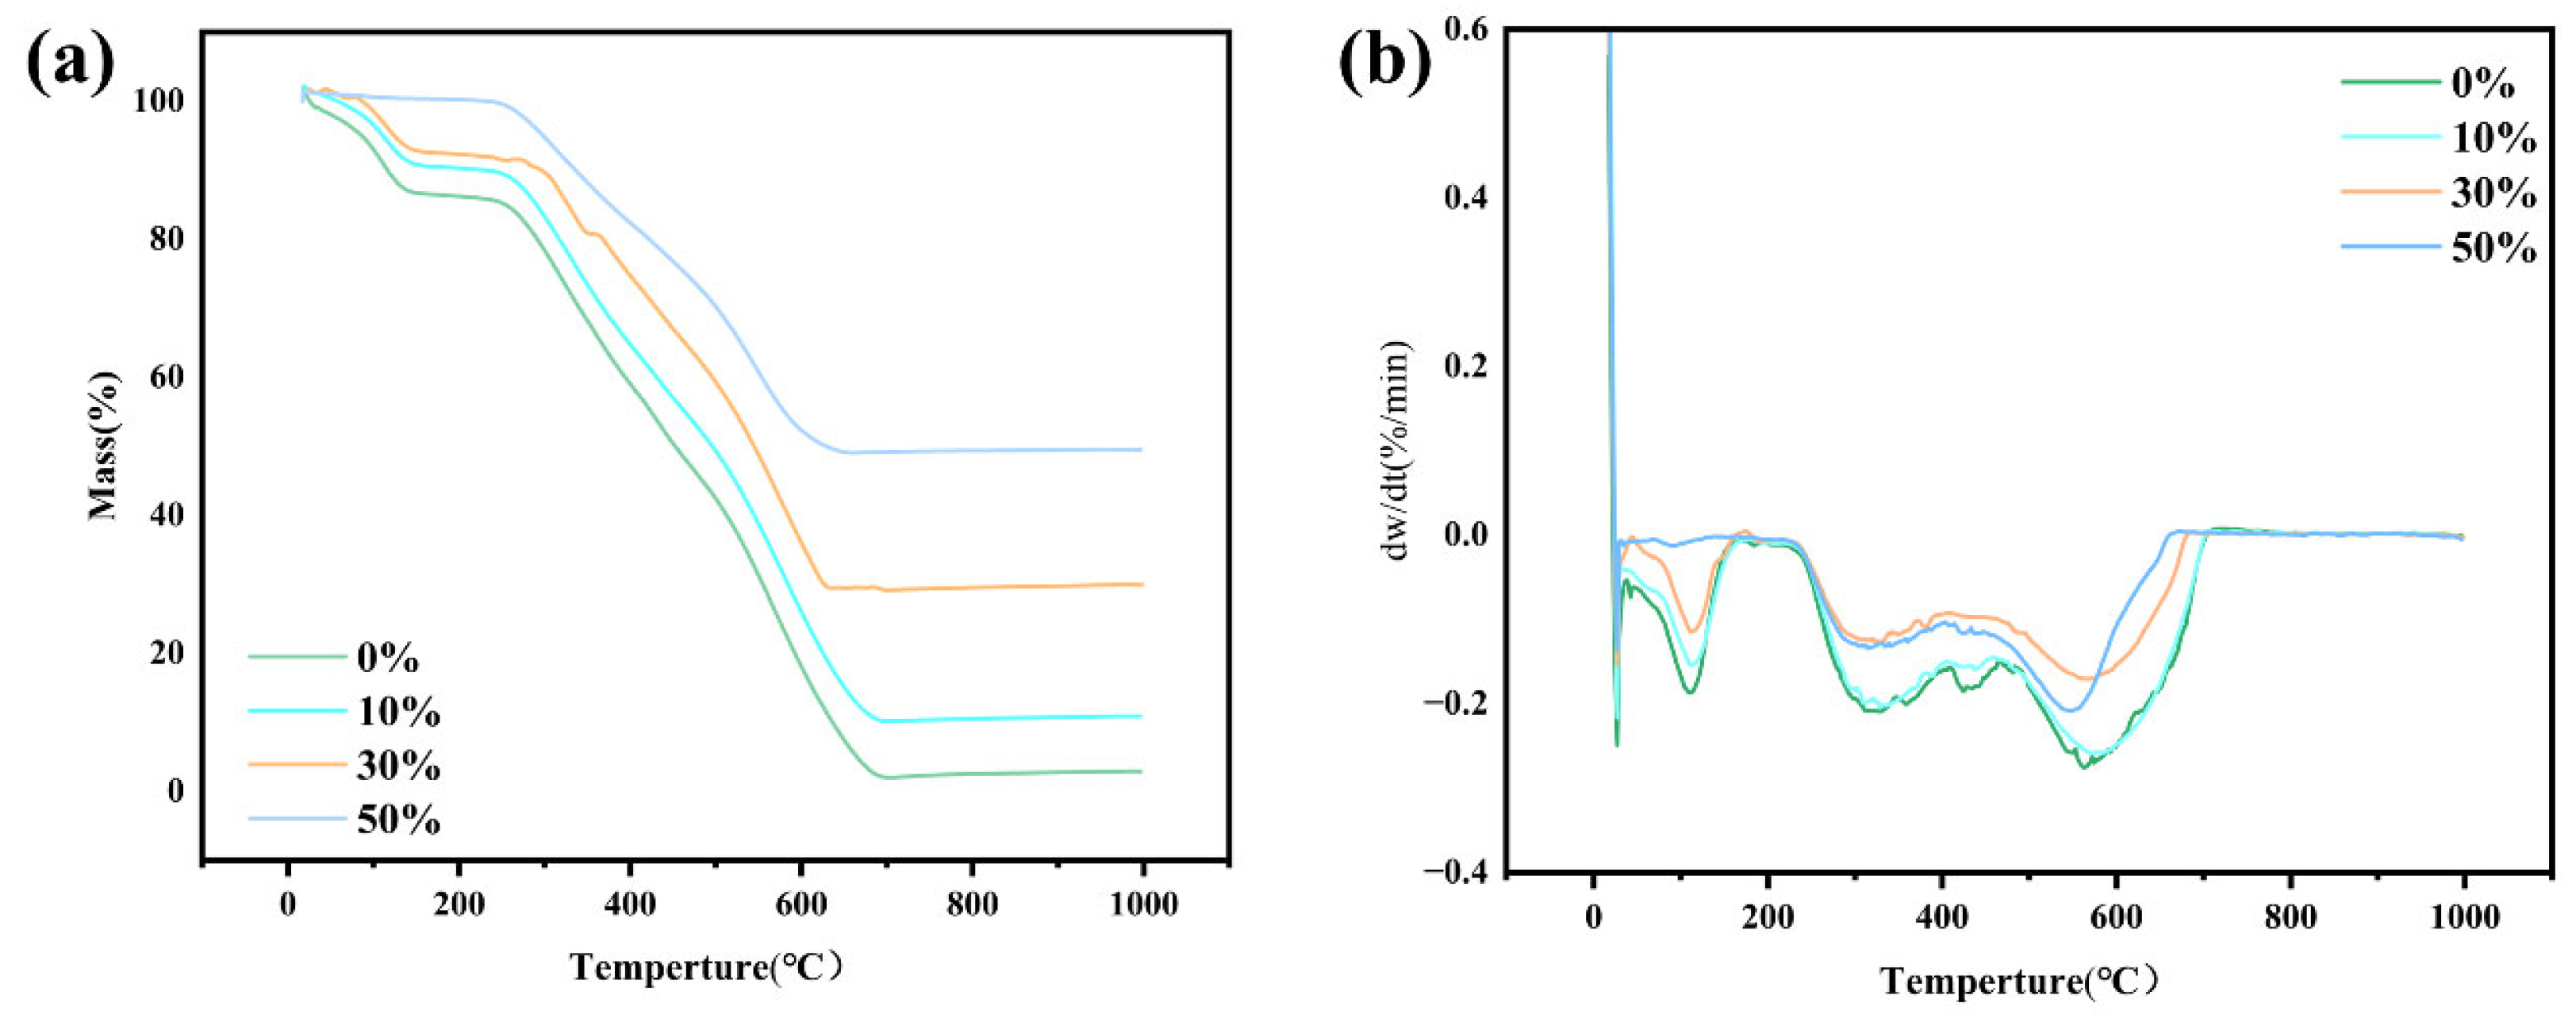
Thermogravimetric Analysis (TGA) revealed significant disparities in thermal decomposition behavior between non-swelled and swelled epoxy/phosphogypsum composites, underscoring the critical impact of the swelling pretreatment on thermal stability and degradation mechanisms. As depicted in Figure 4a, within the temperature range of 200 °C to 740 °C, the mass loss rates for non-swelled composites were recorded as 96.03%, 87.36%, 66.5%, and 55.43% for phosphogypsum loadings of 0%, 10%, 30%, and 50%, respectively. These data indicate that epoxy decomposition dominated the mass loss process, while the incorporation of phosphogypsum substantially mitigated total weight loss; notably, at a high loading of 50%, the mass loss was limited to 55.43%, a marked reduction from the 96.03% observed for neat resin. The Derivative Thermogravimetry (DTG) curve in Figure 4b identified a primary decomposition peak at 439 °C for non-swelled samples, corresponding to main chain scission and oxidative degradation of the epoxy network.
Conversely, the swelled composites exhibited a distinct two-stage decomposition profile, as illustrated in Figure 5a. The initial stage occurred between 17 °C and 135 °C, with mass losses of 97.44%, 89.79%, 70.43%, and 50.56%, attributed primarily to the volatilization of swelling solvents (e.g., acetone) and the release of low-molecular-weight components. The second stage spanned 220 °C to 672 °C, characterized by a significantly reduced mass loss rate, suggesting that the swelling treatment relaxed the polymer network and broadened the decomposition temperature range. The corresponding DTG curve in Figure 5b displayed distinct peaks at 110 °C, 320 °C, and 565 °C, correlating with solvent evaporation, resin matrix decomposition, and the oxidation of residual char, respectively.
While the total mass loss of the swelled samples remained comparable to that of the non-swelled counterparts, their decomposition kinetics exhibited more complex multi-stage characteristics. Notably, weight loss was more pronounced during the low and intermediate temperature stages, reflecting the profound impact of the swelling treatment on thermal behavior. Furthermore, as phosphogypsum content increased, the mass loss rate of the swelled samples gradually decreased, indicating that the inhibitory effect of the filler on resin decomposition persisted even under swollen conditions. However, compared to non-swelled samples, the swelled composites demonstrated a more gradual weight loss during the high-temperature stage. This phenomenon may be attributed to the weakening of interfacial bonding between the filler and matrix during swelling, leading to a more homogeneous decomposition process.
The TGA results provide critical insights for optimizing separation conditions. While both swelling–calcination and swelling–microwave methods effectively remove the epoxy matrix, the latter offers distinct advantages. Microwave heating enables more efficient energy transfer via molecular vibration, achieving complete matrix removal at a lower effective thermal exposure compared to conventional furnace heating. This minimizes the risk of thermal decomposition of CaSO4, which is particularly important for preserving filler integrity and ensuring accurate quantification. Consequently, the separation conditions for epoxy/phosphogypsum composites were established: a swelling pretreatment followed by thermal treatment at 600 °C ensures complete removal of the epoxy resin. Notably, microwave heating offers advantages in terms of efficiency and preservation of filler integrity, as demonstrated by the comparative analysis.
The superior preservation of CaSO4 integrity under microwave treatment can be rationalized by the fundamental differences in heating mechanisms. Conventional calcination relies on conductive heat transfer from the furnace walls to the sample surface, resulting in a temperature gradient where the sample surface is significantly hotter than its interior. This leads to prolonged thermal exposure and localized overheating, conditions known to promote CaSO4 decomposition [18]. In contrast, microwave heating generates heat volumetrically through molecular vibration, enabling rapid and uniform temperature rise throughout the sample bulk. This mechanism reduces both the maximum temperature and the duration of thermal exposure required to achieve complete epoxy removal. Previous studies on microwave-assisted decomposition of thermoset polymers have demonstrated that microwave heating achieves comparable matrix removal at lower effective thermal doses compared to conventional heating [16]. Therefore, the reduced thermal decomposition of CaSO4 observed in this work is consistent with the intrinsic advantages of microwave volumetric heating.

3.3. Comparison of Applicability of Separation and Identification Methods

3.3.1. XRD Analysis of Samples After High-Temperature Microwave Heating and Calcination

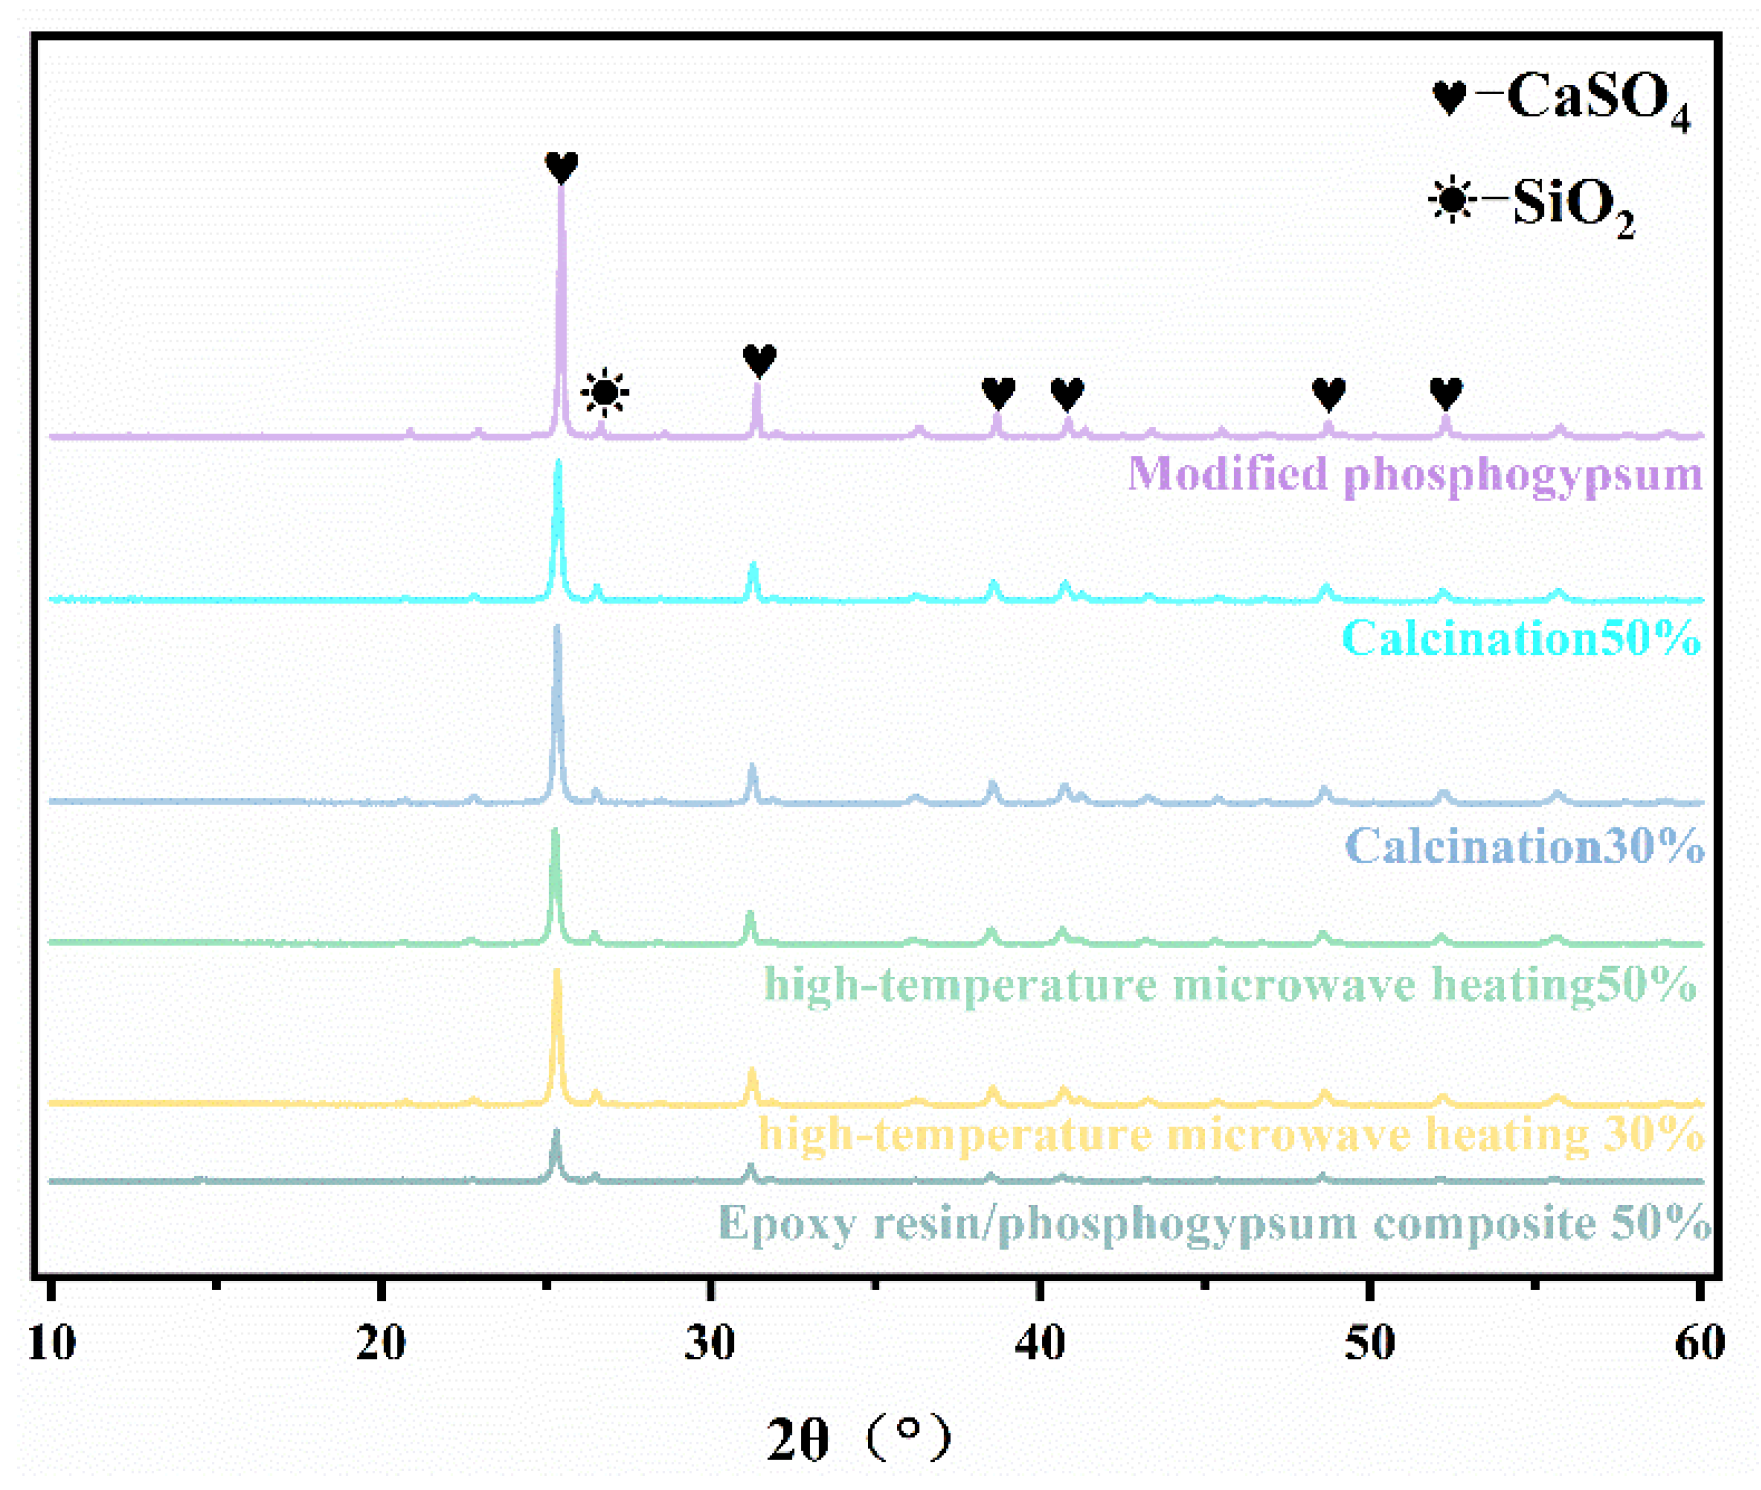
X-ray diffraction (XRD) analysis, as presented in Figure 6, reveals the emergence of distinct new diffraction peaks at 25.4°, 26.5°, 31.3°, 38.7°, 40.8°, and 52° across all samples. This phenomenon indicates a significant phase transition of the calcium sulfate component. The experimentally observed primary diffraction peaks exhibit a high degree of concordance with standard reference data for anhydrous calcium sulfate (CaSO4, anhydrite). Specifically, the peaks at 25.4°, 31.3°, 38.7°, 40.8°, and 52.2° correspond to the (111), (121), (202), (004), and (222) crystal planes, respectively. This systematic alignment of diffraction positions provides clear evidence that the raw phosphogypsum underwent dehydration during the modification or composite processing, transforming from calcium sulfate dihydrate to anhydrous calcium sulfate. Notably, the diffraction peak observed at 26.5° is attributed to trace impurities, such as silica (SiO2).

3.3.2. FT-IR Analysis of Samples After High-Temperature Microwave Heating and Calcination

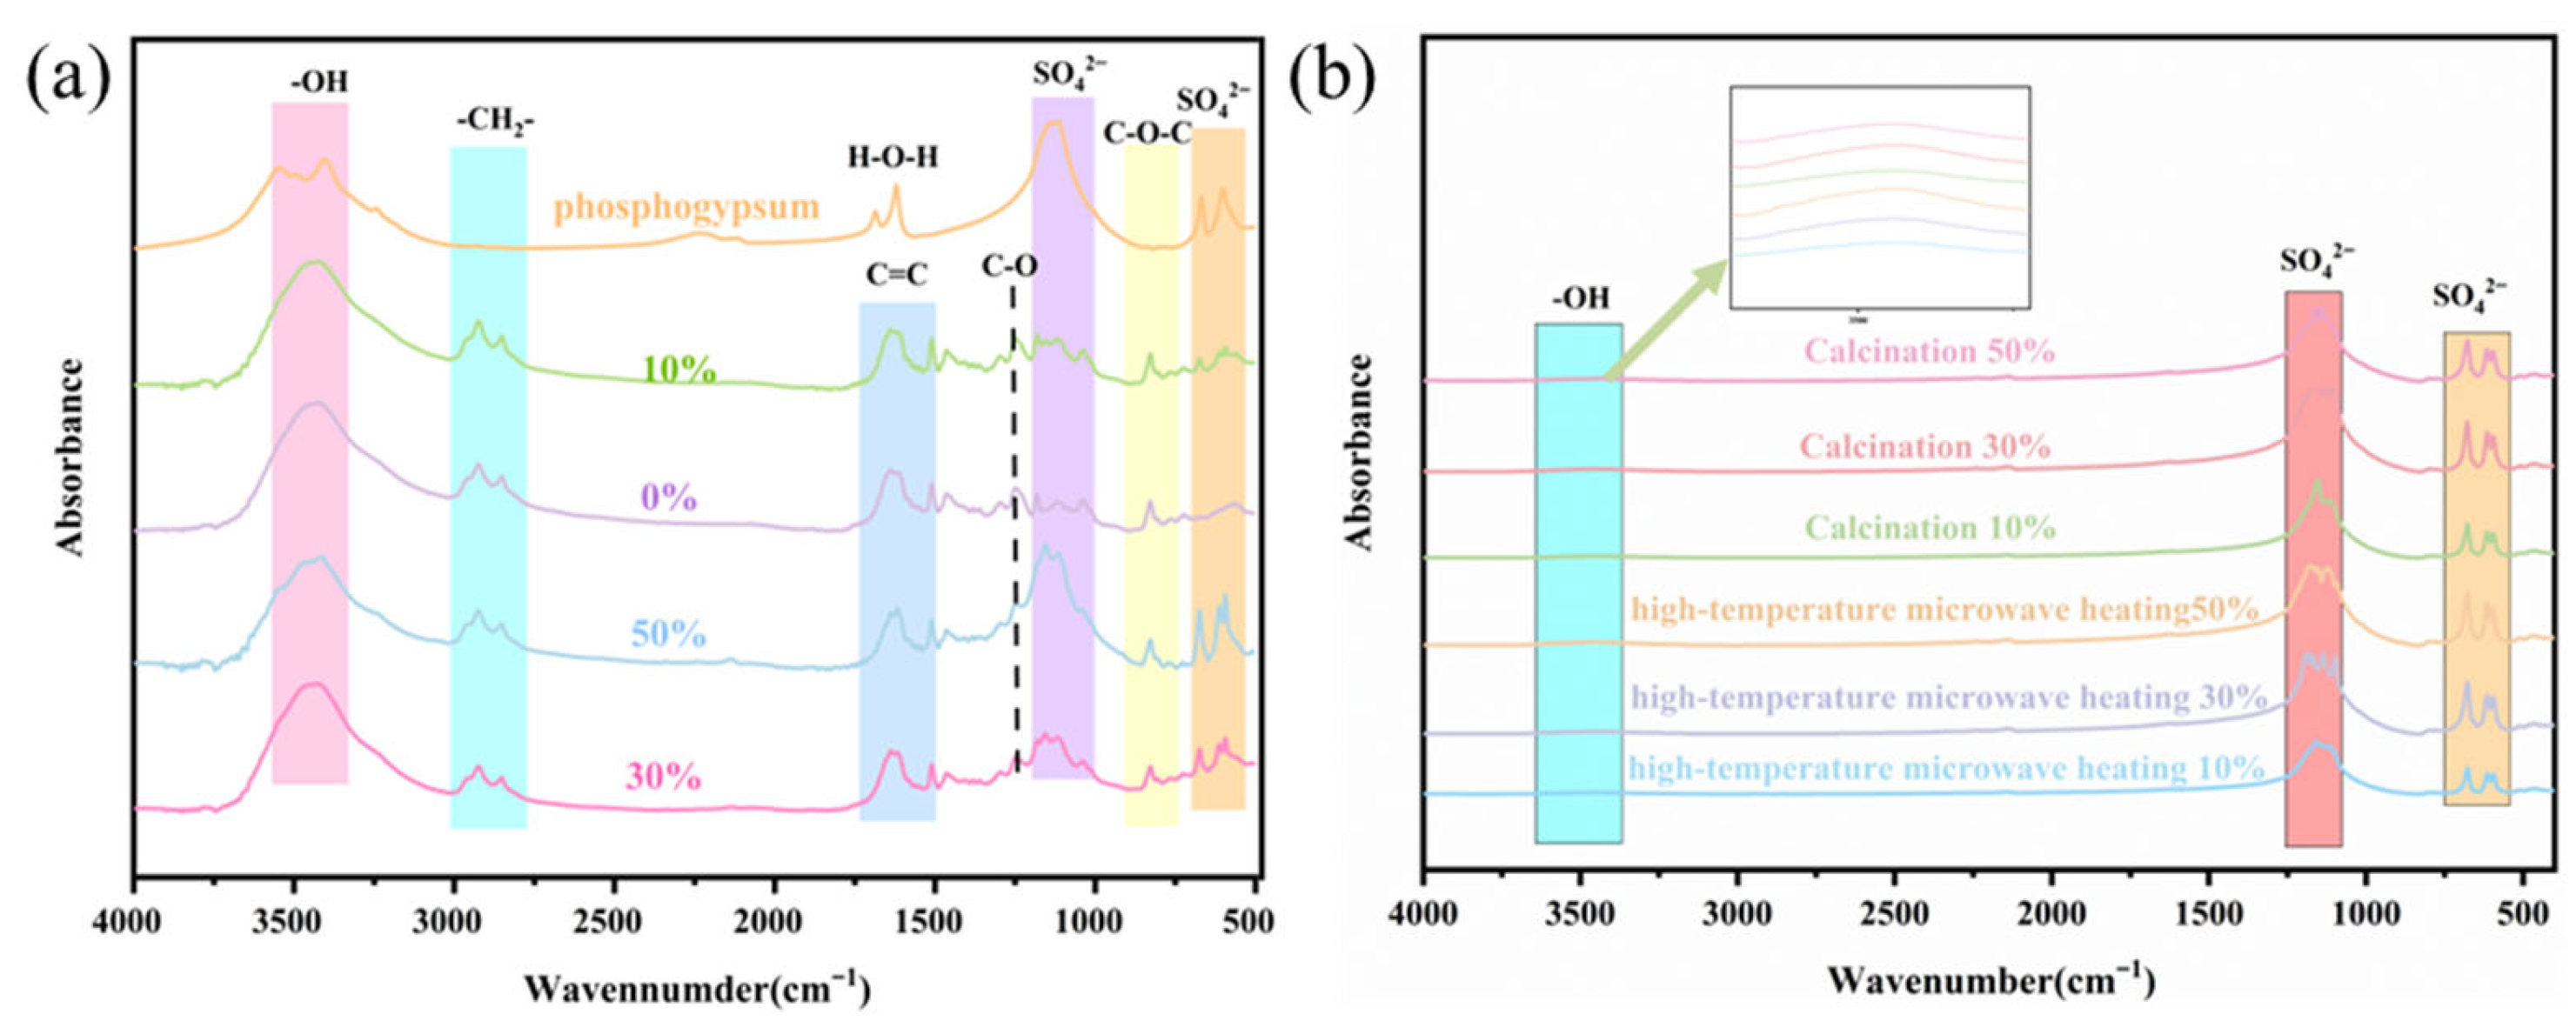
Fourier Transform Infrared Spectroscopy (FT-IR) analysis, conducted over the spectral range of 200–4000 cm−1, facilitated the clear identification of characteristic absorption peaks corresponding to both the epoxy matrix and phosphogypsum filler. As illustrated in Figure 7a, absorption bands observed between 520–645 cm−1 and 640–710 cm−1 are attributed to the bending and symmetric stretching vibrations of sulfate groups (SO42-) within the phosphogypsum [19,20]. These signatures are definitive characteristics of anhydrous calcium sulfate (CaSO4), explicitly confirming the presence of the filler and indicating the preservation of its crystal structure and chemical integrity without significant degradation or phase alteration.
The absorption peak detected in the range of 770–869 cm−1 is assigned to the out-of-plane C-H bending vibrations of aromatic rings or alkyl chains within the epoxy resin [21], reflecting the presence of the polymer matrix. This feature suggests the formation of a stable network structure, with distinct signals emanating from the aromatic and aliphatic segments. Furthermore, absorption bands spanning 1000–1218 cm−1 and 1218–1275 cm−1 correspond to the stretching vibrations of ether linkages (C-O-C) in the epoxy backbone [22]. The presence of these peaks corroborates the successful formation of a stable ether network during curing, a critical structural feature underlying the high-performance nature of the matrix. Finally, the absorption peak in the range of 1538–1755 cm−1 is characteristic of the C=C stretching vibrations in aromatic rings [23,24]. This observation further substantiates the chemical structure of the epoxy resin, providing the structural basis for its thermal stability and mechanical robustness.
Absorption peaks in the range of 2771–3000 cm−1 are attributed to the C-H stretching vibrations of alkyl chains (-CH2-, -CH3) within the epoxy resin, reflecting the aliphatic structural characteristics of the matrix. The presence of these features suggests the inclusion of flexible segments, which play a pivotal role in modulating mechanical properties such as toughness. The broad peak observed between 3010–3754 cm−1 likely originates from residual crystalline water in the phosphogypsum (CaSO4·2H2O) or unreacted hydroxyl groups (-OH) in the epoxy resin, indicating the potential presence of moisture or incompletely cured matrix components. A comparison between Figure 7b and Figure 7a reveals that only the infrared characteristic peaks of SO42− remain in Figure 7b. This observation confirms that the epoxy resin was completely removed following the swelling, calcination, and high-temperature microwave heating procedures, thereby substantiating the identity of the residual filler as phosphogypsum.

3.3.3. SEM Analysis of Samples After High-Temperature Microwave Heating and Calcination

SEM observations revealed a high degree of morphological similarity between the fillers recovered via the two treatment methods. As depicted in Figure 8a, the raw phosphogypsum exhibited an irregular blocky structure with distinct edges and surface porosity. The fillers isolated following high-temperature microwave heating Figure 8b and calcination Figure 8c retained the fundamental morphological characteristics of the raw material. However, the particle edges appeared more rounded, and surface porosity was slightly enhanced, likely attributable to the complete volatilization of organic residues during high-temperature processing. Notably, no significant morphological discrepancies were observed between the two separation methods, indicating that both calcination and high-temperature microwave heating effectively removed the epoxy matrix. Elemental mapping analysis, presented in Figure 8d, confirmed that the primary constituent of the isolated filler was anhydrous calcium sulfate. The elements Ca, S, and O displayed perfectly coincident distribution profiles, indicative of excellent homogeneity. Notably, the absence of a carbon (C) signal in the elemental mapping provides definitive evidence that the epoxy resin matrix was completely removed.

3.4. Selection of Methods for Determination of Phosphogypsum Content

3.4.1. Gravimetric Method

The phosphogypsum content of the formulated epoxy composites was quantified using the gravimetric method, with the results summarized in Table 1. The measured values demonstrated good agreement with the theoretical loadings. Specifically, the relative error for the calcination method was maintained within ±4%. Conversely, while the high-temperature microwave heating method exhibited a smaller relative error range of ±3%, this discrepancy diminished progressively with increasing phosphogypsum content, suggesting its suitability for composites with high filler loadings. Furthermore, the average recovery rate for phosphogypsum following the swelling–calcination protocol was determined to be 97.05%, whereas the rate for the swelling–high-temperature microwave heating procedure was 98.2%.

3.4.2. ICP-OES and IC Analysis for Content Determination

To verify the chemical identity of the filler and validate the quantification results, a comprehensive compositional analysis was performed. A comparative study of the content determination using Inductively Coupled Plasma Optical Emission Spectroscopy (ICP-OES) and Ion Chromatography (IC) is presented in Table 2. Furthermore, ICP-OES was utilized to quantify the concentration of impurity elements within the phosphogypsum, as detailed in Table 3. The results indicate that calcium (Ca) and sulfur (S) are the dominant components, while the concentrations of other trace elements remain relatively low.
ICP-OES analysis of the calcined samples yielded sulfur concentrations of 235.627 mg/L, 269.377 mg/L, and 250.711 mg/L, as detailed in Table 2. Based on these values, the calculated mass of calcium sulfate (CaSO4) was determined to be 0.05 g, 0.0572 g, and 0.0532 g, respectively, exhibiting a deviation of less than ±0.0005 g from the actual mass of the digested phosphogypsum. Conversely, the high-temperature microwave heating samples displayed sulfur concentrations of 243.156 mg/L, 271.423 mg/L, and 253.428 mg/L. The calculated CaSO4 content for these samples also showed good agreement with the actual mass, with deviations maintained within ±0.0004 g.
To ensure the accuracy of the quantitative analysis, Ion Chromatography (IC) was employed to verify the sulfate content. For the calcined samples, IC measurements indicated sulfate concentrations of 681.525 mg/L, 809.68 mg/L, and 768.32 mg/L. Although the calculated phosphogypsum mass based on these data deviated from the actual content by up to ±0.0009 g, the discrepancy was relatively significant. For the high-temperature microwave heating, the sulfate concentrations were measured as 710.235 mg/L, 825.467 mg/L, and 782.591 mg/L, with corresponding deviations in the calculated mass ranging within ±0.0004 g. Through extensive experimental validation and cross-comparison, it was concluded that the filler composition within 1 g of the epoxy composite is exclusively phosphogypsum, with no other filler components present. The measured phosphorus (P) content further corroborated the identity of the filler as phosphogypsum. Consequently, ICP-OES demonstrates superior performance and is established as the optimal method for the quantitative determination of phosphogypsum in these composites.
It should be noted that the presence of Ca, S, and O alone does not uniquely identify the filler as phosphogypsum, as these elements are also present in natural gypsum and other calcium sulfate materials. However, the filler isolated in this study exhibits two key characteristics that confirm its origin as phosphogypsum. First, ICP-OES analysis revealed detectable phosphorus content (1.06–1.54 mg/L in the digestate), which is a distinctive impurity derived from the phosphoric acid production process and is not present in natural gypsum at comparable levels. Second, the raw material was sourced directly from a phosphoric acid plant (Xifeng Phosphorus Plant), and the XRD patterns showed characteristic anhydrite peaks consistent with the thermal dehydration of phosphogypsum. The combination of phosphorus content, industrial source, and phase composition collectively supports the identification of the filler as phosphogypsum rather than other gypsum types.

3.4.3. Thermogravimetric Analysis Results (Direct Content Determination of Composites)

Thermogravimetric curves for the various samples are illustrated in Figure 3. The curves exhibit a distinct mass loss within the temperature range of 100–200 °C, corresponding to the dehydration of crystalline water in the phosphogypsum. The phosphogypsum content, calculated based on the mass loss percentage during this dehydration stage, is presented in Table 4.

3.4.4. SEM-EDS Analysis Results (Direct Content Determination of Composites)

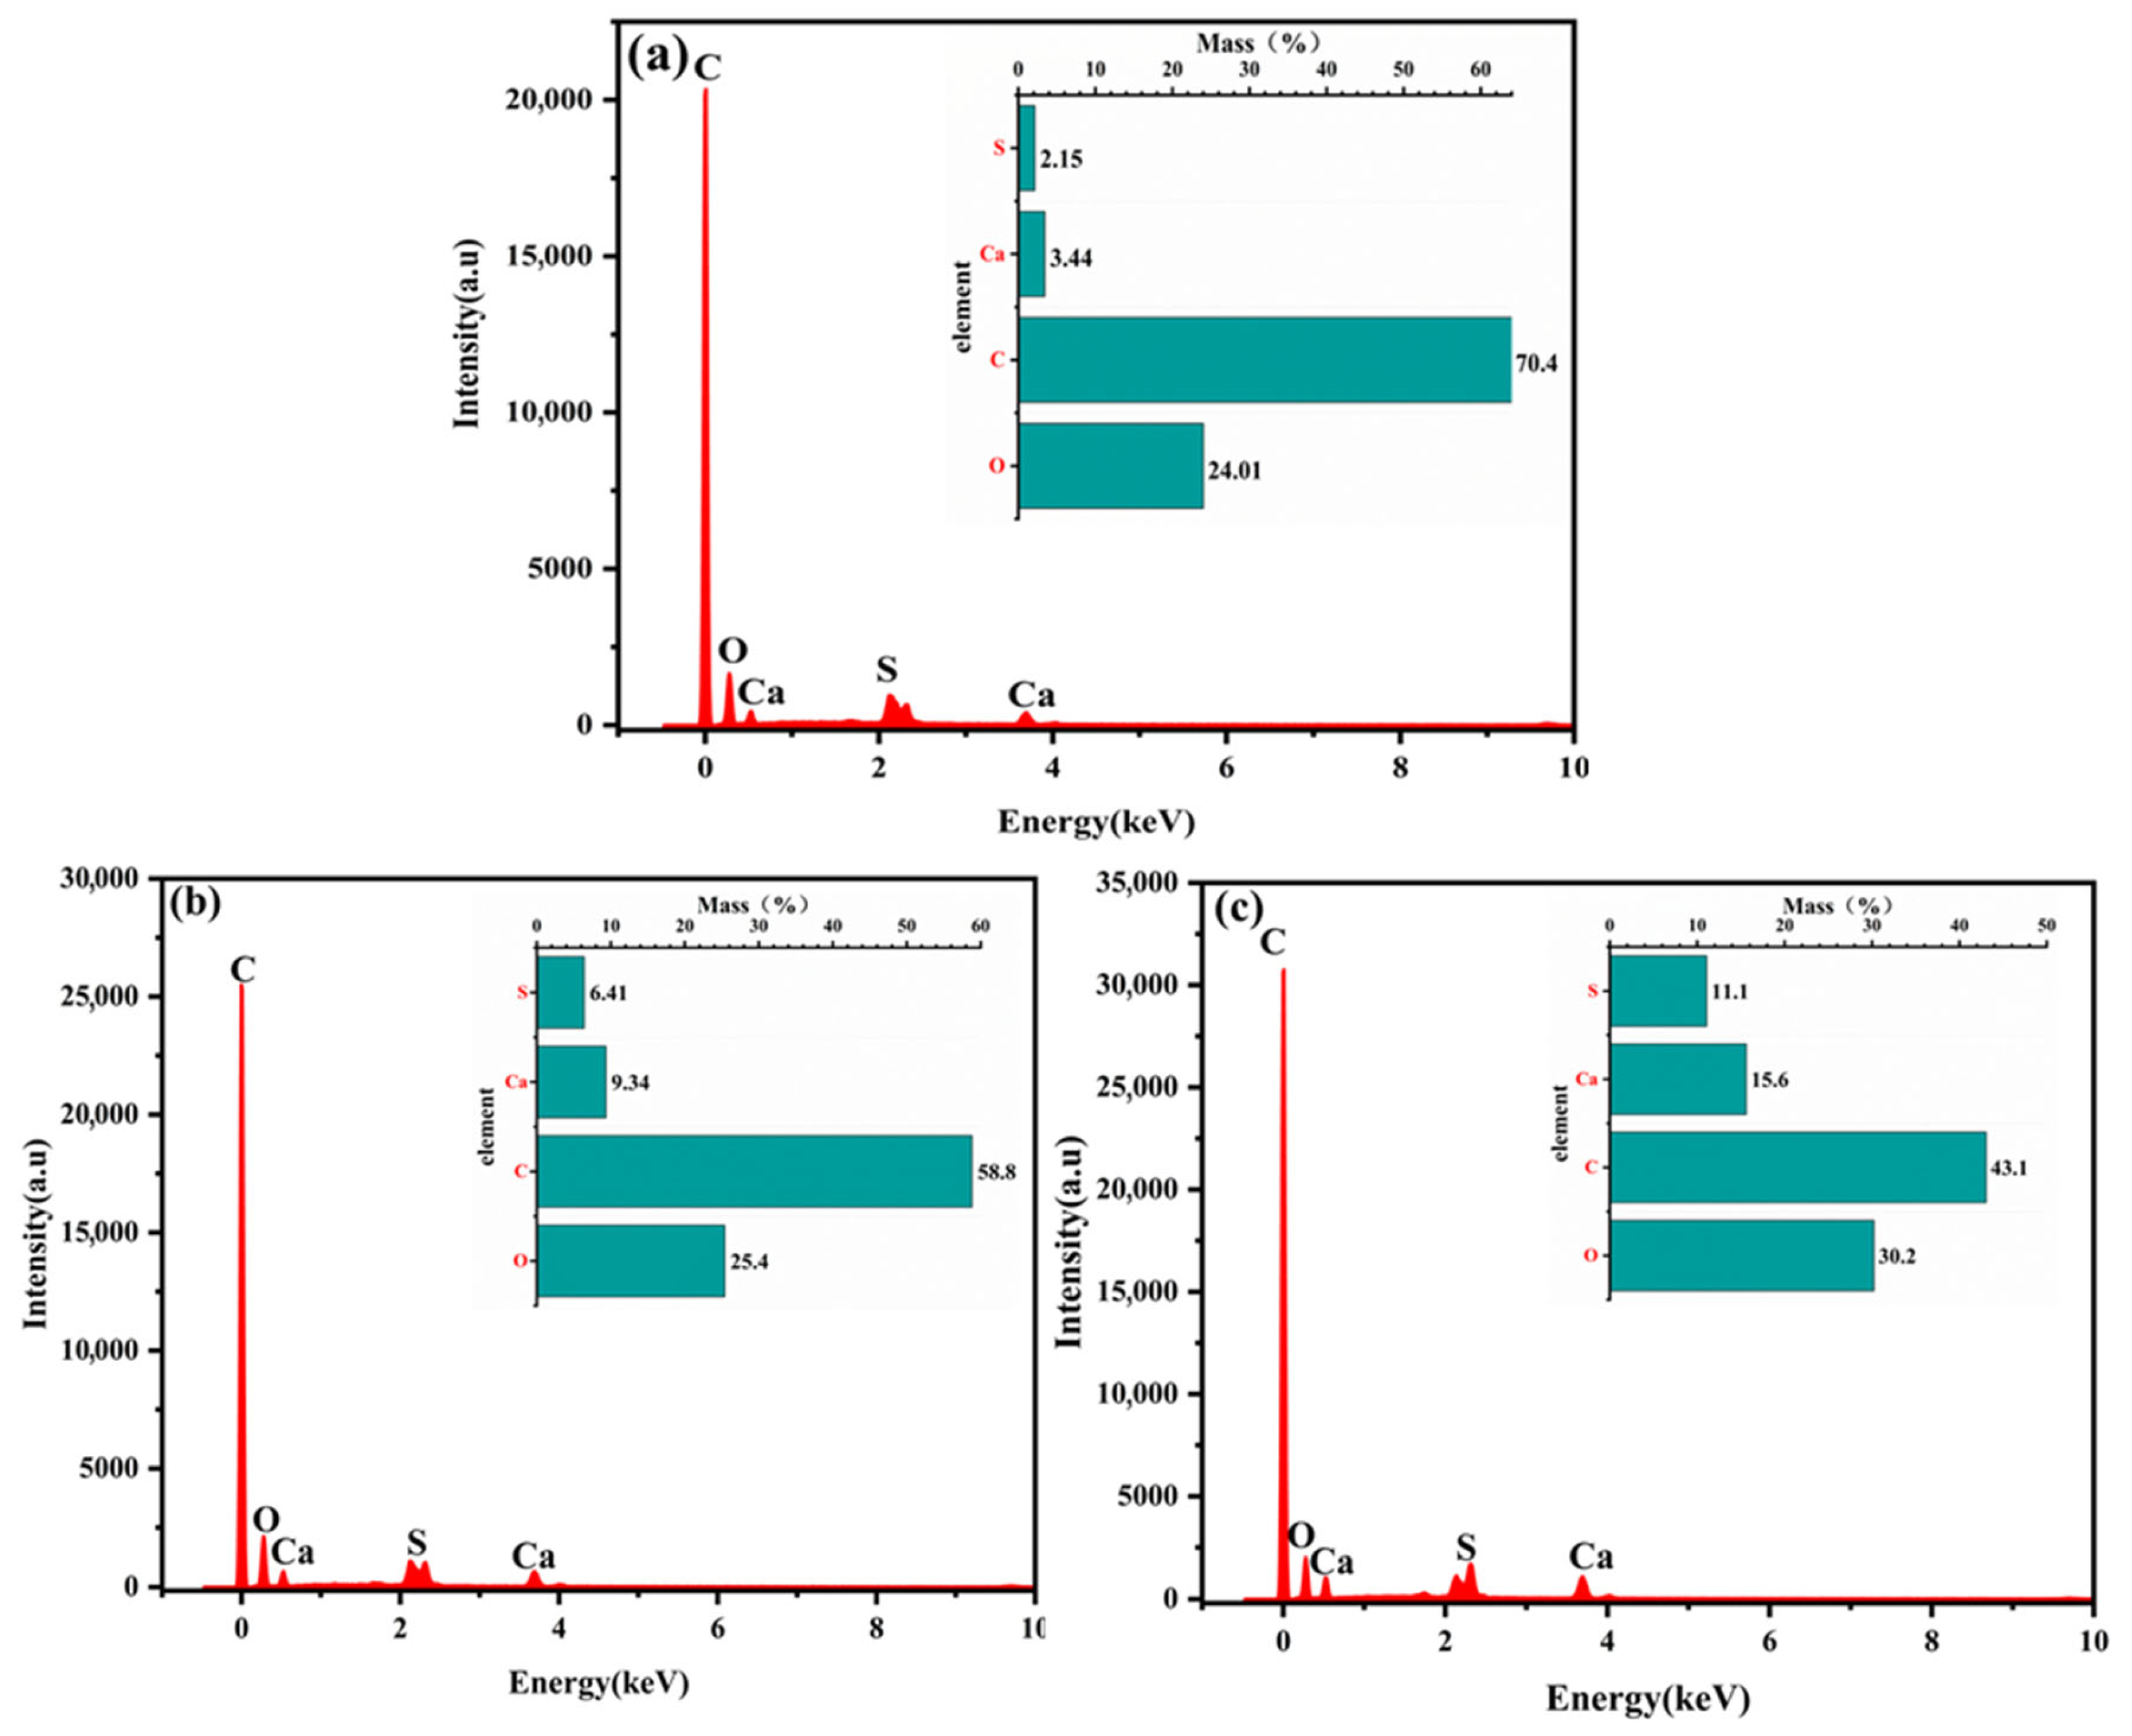
Energy-Dispersive X-ray Spectroscopy (EDS) was employed to systematically analyze the composition of anhydrous phosphogypsum (anhydrous CaSO4) composites with varying loadings (10%, 30%, and 50%). As illustrated in Figure 9, the experimentally determined filler contents demonstrated good consistency with the designed formulations.
For the 10% phosphogypsum composite Figure 9a, EDS analysis yielded mass fractions of 3.44% for calcium (Ca) and 2.15% for sulfur (S). Based on the theoretical composition of anhydrous phosphogypsum, the calculated CaSO4 content derived from sulfur was 9.13% (Equation (1)), deviating by 0.87% from the designed 10%. Conversely, the calculation based on calcium (Equation (2)) resulted in a content of 11.68%, representing a deviation of 1.68%. Notably, a strong carbon (C) signal of 70.4% was detected, primarily originating from the epoxy matrix and the carbon coating applied during sample preparation. This high carbon content introduced significant interference in the quantitative analysis of light elements, such as oxygen (O).
In the analysis of the 30% phosphogypsum composite Figure 9b, the measured contents of Ca, S, and O were 9.34%, 6.41%, and 25.4%, respectively. Calculations based on the stoichiometry of anhydrous CaSO4 yielded a filler content of 31.7% via the calcium method (deviation of 1.7%) and 27.2% via the sulfur method (deviation of 2.8%). Of particular significance, the measured Ca/S mass ratio of 1.46 was in close proximity to the theoretical value of 1.25, indicating the near absence of calcium-containing impurities. Furthermore, the measured oxygen content (25.4%) was consistent with the oxygen contribution from the composite components, thereby validating the reliability of the analytical results.
For the 50% phosphogypsum composite (Figure 9c), EDS analysis determined the mass fractions of calcium, sulfur, and oxygen to be 15.6%, 11.1%, and 30.2%, respectively. Based on the theoretical composition, the calculated CaSO4 content was 53.0% using the calcium method (deviation of 3%) and 47.1% using the sulfur method (deviation of 2.9%). The measured Ca/S mass ratio of 1.41 was slightly higher than the theoretical value; this discrepancy may be attributed to the presence of trace calcium-containing impurities or systematic errors inherent to the testing procedure. Furthermore, the detection of a 43.1% carbon signal, primarily originating from the carbon coating applied during sample preparation or the organic matrix itself, introduces potential interference, thereby contributing to errors in both the identification and quantitative determination of the filler content.
m C a S O 4 = w s 32.06 × 136.14 = w s × 4.246
m C a S O 4 = w s 40.08 × 136.14 = w C a × 3.397
where m_(mCaSO4) represents the mass of calcium sulfate in grams (g), w_s is the mass fraction of sulfur (%), and w_Ca is the mass fraction of calcium (%).
The results obtained via direct SEM-EDS quantification exhibited a relative error of less than ±3% compared to the designed loadings, indicating high accuracy and reproducibility. This method offers the distinct advantage of operational simplicity, as it negates the need for sample separation and enables the simultaneous analysis of multiple components. However, it imposes stringent requirements on instrumental precision, and the results are susceptible to variations in sample preparation and testing conditions, which can introduce significant errors.

3.5. Determination of Sulfur and Calcium Contents by ICP-OES with Spike Recovery

To validate the accuracy of the method for determining sulfur (S) and calcium (Ca) content in phosphogypsum, a standard addition method was employed to evaluate the epoxy matrix. Sulfur and calcium standard solutions (1000 µg/mL) were added to 1 g of blank epoxy resin to prepare spiked samples at three concentration gradients: low (5 µg/g), medium (50 µg/g), and high (200 µg/g). Each group was measured in triplicate, as summarized in Table 5.
Following sample digestion with nitric acid and hydrofluoric acid, the sulfur and calcium contents were determined using ICP-OES (S 181.975 nm, Ca 317.933 nm). The results, presented in Table 5 and Table 6, indicate that the spiked recoveries for sulfur ranged from 91% to 99.8%, while those for calcium ranged from 94.0% to 99.7%, with relative standard deviations (RSD) ≤ 4.2%.
These results comply with the requirements for trace analysis specified in the standard GB/T 27417-2017 [25] (recovery rate: 80–120%, RSD ≤ 15%), demonstrating that the method is accurate and reliable, and is therefore suitable for the quantitative analysis of phosphogypsum fillers in polymer materials.

3.6. Comparison of Quantification Methods

To provide a systematic basis for method selection, the five quantification methods were evaluated against the following criteria: accuracy (recovery rate), precision (RSD), sample preparation complexity, sample destructiveness, and suitability for multi-filler systems. The comparison is summarized in Table 7.

4. Conclusions

This study established a reliable comprehensive analytical workflow for PG fillers in epoxy composites, covering separation, identification, and quantitative determination. A key innovation is the introduction of microwave-assisted separation, which leverages molecular vibration heating to achieve simultaneous internal and external heating of the composite. Compared to conventional muffle furnace calcination, microwave treatment offers faster heating rates, more uniform temperature distribution, and higher thermal efficiency, resulting in more complete epoxy removal while minimizing thermal decomposition of CaSO4. This leads to improved quantification accuracy, as evidenced by higher average recovery rates (98.2% vs. 97.05%) and better performance for low-content samples.
For quantification, gravimetry suits single-filler PG systems for simplicity; ICP-OES (based on S content) is preferred for high precision (spike recovery ~99%, RSD ≤ 4.2%) or multi-filler systems. TGA and SEM-EDS enable rapid assessment but with larger errors.
In conclusion, the “swelling–high-temperature microwave heating–XRD/SEM-EDS identification–gravimetry/ICP-OES quantification” framework has been demonstrated to be effective for PG filler characterization in epoxy composites across a range of filler loadings. The validation results show that microwave-assisted separation improves quantification accuracy compared to conventional calcination, and ICP-OES provides the highest precision among the methods evaluated. This workflow offers a practical foundation for quality control, formulation design, and resource utilization of phosphogypsum in epoxy composites. Further validation using industrial samples and additional filler loadings is recommended to extend the applicability of the framework.

Author Contributions

Conceptualization, J.Z.; Methodology, J.Z.; Software, W.Y.; Validation, X.C.; Formal analysis, X.C.; Investigation, X.C.; Data curation, J.W.; Writing—original draft, J.W.; Writing—review & editing, J.W. Visualization, T.L.; Supervision, J.Z. and W.Y.; Project administration, J.Z. and T.L.; Funding acquisition, J.Z. All authors have read and agreed to the published version of the manuscript.

Funding

This research was funded by 2024 Central Government Guides Local Science and Technology Development Fund Project (Qiankehe Zhongyindi [2024] 029); Science and Technology Innovation Leading Talent Workstation of Guizhou Province for High-Value Utilization of Aluminum Industry Solid Wastes (Qiankehe Pingtai KXJZ [2025] 019); 2025 Central Government Guides Local Science and Technology Development Fund Project (Qiankehe Zhongyindi [2025] 028); 2023 Guizhou Provincial Major Science and Technology Achievement Transformation Project (Qiankehe Chengguo [2023] Zhongda 009); 2026 Guizhou Provincial Science and Technology Support Program Project (Qiankehe Zhicheng (2025) Yiban 309).

Data Availability Statement

The original contributions presented in this study are included in the article. Further inquiries can be directed to the corresponding author.

Conflicts of Interest

The authors declare no conflict of interest.

References

  1. Mirmohammadi, S.M.; Moini Jazani, O.; Gharieh, A. Thermomechanical analyses and ANN modeling of novel epoxy adhesives with CSR particles and zinc oxide nanoparticles in structural bonding. Sci. Rep. 2025, 15, 11201. [Google Scholar] [CrossRef] [Scilit] [PubMed]
  2. Yang, X.; Shi, T.; Gao, B.; Li, L.; Zhang, S. Ultralow-Smoke-Release Epoxy Resin with Efficient Radical Quenching Fabricated via Soluble Carbohydrates. Ind. Eng. Chem. Res. 2024, 63, 16789–16800. [Google Scholar] [CrossRef] [Scilit]
  3. Zhi, M.; Zhao, H.; Zhou, Z.; Zhang, M.; Liu, Q. Recent progress on flame-retardant bio-based epoxy resins: Preparation methods and performance evaluation. Int. J. Biol. Macromol. 2025, 327, 147069. [Google Scholar] [CrossRef] [Scilit] [PubMed]
  4. Yamamoto, S.; Ida, R.; Aoki, M.; Kuwahara, R.; Shundo, A.; Tanaka, K. Formation Mechanism of a Heterogeneous Network in Epoxy Resins. Macromolecules 2023, 56, 3913–3921. [Google Scholar] [CrossRef] [Scilit]
  5. Xu, J.; Zhang, J.; Liu, X.; Ao, X.; Wang, D.Y.; Wu, J. Bio-based epoxy resin composites reinforced with surface-modified cellulose fabrics: Coupled enhancement of flame retardancy and mechanical performance. Int. J. Biol. Macromol. 2026, 339, 150005. [Google Scholar] [CrossRef] [Scilit]
  6. Liu, E.; Li, H.; Li, Z.; Li, J.; Hao, H.; Su, M. Mechanical properties of Al based-aluminum foam/resin interpenetrating porous composites with different interface types. Compos. Struct. 2026, 380, 120030. [Google Scholar] [CrossRef] [Scilit]
  7. Wu, Q.; Jin, D.; Ma, Q.; Xiao, B.; Li, Y.; Zhang, Y.; Zhu, J. Two geometries of polydopamine synergistically enhance carbon fiber-epoxy interfacial adhesion. Compos. Part B Eng. 2025, 305, 112768. [Google Scholar] [CrossRef] [Scilit]
  8. Zhao, Q.; Jiang, X.; Sun, M.; Zhang, J.; Lv, T. Exploring capillary adsorption of corrosive medium in epoxy resin-modified calcium-silicate-hydrate channels. Constr. Build. Mater. 2023, 390, 131803. [Google Scholar] [CrossRef] [Scilit]
  9. Wang, Z.; Liu, C.; Cao, X.; Cheng, B.; Wang, J.; Sun, G. Molecularly Ordered Epoxy/Organic Acceptor Composites for Superior Thermal Transport and Electrical Insulation Performance. Adv. Funct. Mater. 2025, 36, e16105. [Google Scholar] [CrossRef] [Scilit]
  10. Kim, H.; Jeon, S.; Cho, Y.S.; Huang, C.; Na, S.; Lee, J.; Chung, Y.; Kang, J.; Kim, S.W.; Choi, D. Polydopamine-coated iron-nickel alloy and epoxy composites for electromagnetic interference shielding. J. Appl. Polym. Sci. 2024, 141, e56187. [Google Scholar] [CrossRef] [Scilit]
  11. Li, X.; Wang, F.; Cai, X.; Meng, S.; Hu, X.; Tang, L. A porous IPN-structured polyurethane/epoxy grouting material with low viscosity, high strength and low volume shrinkage. Constr. Build. Mater. 2024, 449, 138312. [Google Scholar] [CrossRef] [Scilit]
  12. Li, W.; Zeng, H.; Xie, Z. Preparation of composite bipolar plates for proton exchange membrane fuel cells with balanced performance by expanding the conductive network with carboxylated carbon nanotubes in the resin phase. J. Power Sources 2025, 657, 238163. [Google Scholar] [CrossRef] [Scilit]
  13. Capricho, J.C.; Fox, B.; Hameed, N. Multifunctionality in Epoxy Resins. Polym. Rev. 2020, 60, 1–41. [Google Scholar] [CrossRef] [Scilit]
  14. Wang, F.S.; Ji, Y.Y.; Yu, X.S.; Chen, H.; Yue, Z.F. Ablation damage assessment of aircraft carbon fiber/epoxy composite and its protection structures suffered from lightning strike. Compos. Struct. 2016, 145, 226–241. [Google Scholar] [CrossRef] [Scilit]
  15. Ruan, K.; Zhong, X.; Shi, X.; Dang, J.; Gu, J. Liquid crystal epoxy resins with high intrinsic thermal conductivities and their composites: A mini-review. Mater. Today Phys. 2021, 20, 100456. [Google Scholar] [CrossRef] [Scilit]
  16. Silva, P.; Valente, T.; Azenha, M.; Sena-Cruz, J.; Barros, J. Viscoelastic response of an epoxy adhesive for construction since its early ages: Experiments and modelling. Compos. Part B Eng. 2017, 116, 266–277. [Google Scholar] [CrossRef] [Scilit]
  17. Zhang, Y.M.; Li, J.L.; Wang, J.P.; Yang, X.S.; Shao, W.; Xiao, S.Q.; Wang, B.Z. Research on epoxy resin decomposition under microwave heating by using ReaxFF molecular dynamics simulations. RSC Adv. 2014, 4, 17083–17090. [Google Scholar] [CrossRef] [Scilit]
  18. Ma, L.; Du, Y.; Niu, X.; Zheng, S.; Zhang, W. Thermal and Kinetic Analysis of the Process of Thermochemical Decomposition of Phosphogypsum with CO and Additives. Ind. Eng. Chem. Res. 2012, 51, 6680–6685. [Google Scholar] [CrossRef] [Scilit]
  19. Sun, M.; Sun, Q.; Zhang, J.; Sheng, J. Surface modification of phosphogypsum and application in polyolefin composites. Environ. Sci. Pollut. Res. 2022, 29, 66177–66190. [Google Scholar] [CrossRef] [Scilit]
  20. Cao, W.; Yi, W.; Peng, J.; Li, J.; Yin, S. Recycling of phosphogypsum to prepare gypsum plaster: Effect of calcination temperature. J. Build. Eng. 2022, 45, 103511. [Google Scholar] [CrossRef] [Scilit]
  21. Brownlow, S.R.; Moravsky, A.P.; Kalugin, N.G.; Majumdar, B.S. Probing deformation of double-walled carbon nanotube (DWNT)/epoxy composites using FTIR and Raman techniques. Compos. Sci. Technol. 2010, 70, 1460–1468. [Google Scholar] [CrossRef] [Scilit]
  22. Doblies, A.; Benjamin, B.; Bodo, F. Prediction of Thermal Exposure and Mechanical Behavior of Epoxy Resin Using Artificial Neural Networks and Fourier Transform Infrared Spectroscopy. Polymers 2019, 11, 363. [Google Scholar] [CrossRef] [Scilit]
  23. Ruban, Y.J.V.; Ginil Mon, S.; Vetha Roy, D. Mechanical and thermal studies of unsaturated polyester-toughened epoxy composites filled with amine-functionalized nanosilica. Appl. Nanosci. 2013, 3, 7–12. [Google Scholar] [CrossRef] [Scilit]
  24. Avila, A.F.; dos Reis, M.O.; Leão, S.G.; Nascimento, H. Carbon nanotube reinforced epoxy based adhesive: Correlations between chemical functional and failure modes. Int. J. Adhes. Adhes. 2022, 119, 103273. [Google Scholar] [CrossRef] [Scilit]
  25. GB/T 27417-2017; Guidance on Validation and Verification of Chemical Analysis Methods. Chinese Standard: Beijing, China, 2017. Available online: https://www.chinesestandard.net/PDF/English.aspx/GBT27417-2017 (accessed on 9 May 2025).
Figure 1. Epoxy resin–phosphogypsum composite materials with different ratios: (a) 0%, (b) 10%, (c) 30%, (d) 50%.
Inorganics 14 00113 g001
Figure 2. Phosphogypsum-filled epoxy resin composite after solvent swelling. The numbers indicate the mass (g) of epoxy resin and phosphogypsum in each sample: (1) epoxy 100 g, phosphogypsum 0 g; (4) epoxy 90 g, phosphogypsum 10 g; (5) epoxy 70 g, phosphogypsum 30 g; (7) epoxy 50 g, phosphogypsum 50 g.
Inorganics 14 00113 g002
Figure 3. Morphology and Elemental Distribution of Epoxy Resin/Phosphogypsum Composites, (a) 10%, (b) 30%, (c) 50%, (d) Elemental Mapping.
Inorganics 14 00113 g003
Figure 4. Thermogravimetric analysis (TGA) and derivative thermogravimetry (DTG) curves of non-swelled epoxy/phosphogypsum composites with PG loadings of 0%, 10%, 30%, and 50%. (a) TGA curves showing mass loss as a function of temperature; (b) DTG curves showing decomposition rate peaks.
Inorganics 14 00113 g004
Figure 5. Thermogravimetric analysis (TGA) and derivative thermogravimetry (DTG) curves of swelled epoxy/phosphogypsum composites with PG loadings of 0%, 10%, 30%, and 50%. (a) TGA curves showing mass loss as a function of temperature; (b) DTG curves showing decomposition rate peaks.
Inorganics 14 00113 g005
Figure 6. XRD patterns of raw phosphogypsum and fillers isolated from epoxy composites with different PG loadings after calcination and microwave treatment.
Inorganics 14 00113 g006
Figure 7. FT-IR spectra: (a) raw phosphogypsum and epoxy/PG composites with different filler loadings; (b) phosphogypsum fillers isolated after epoxy removal via calcination and microwave treatment.
Inorganics 14 00113 g007
Figure 8. SEM images: (a) raw phosphogypsum; (b) phosphogypsum separated by microwave treatment; (c) phosphogypsum separated by calcination; (d) elemental mapping of the isolated filler (Ca, S, O, Si).
Inorganics 14 00113 g008
Figure 9. SEM-EDS analysis of epoxy/phosphogypsum composites with different filler loadings: (a) 10 wt. %, (b) 30 wt. %, (c) 50 wt. %.
Inorganics 14 00113 g009
Table 1. Phosphogypsum content obtained after swelling followed by calcination and swelling–high-temperature microwave heating.
Target PG Content (wt. %)Composite Mass (g) Phosphogypsum Obtained by Swelling–Calcination (g)Relative Error (%)Composite Mass (g)Phosphogypsum Obtained by Swelling–High-Temperature Microwave Heating (g)Relative Error (%)SD (n = 3)
01.13070.0028-1.0091---
101.07290.1021−4.850.98230.0995+1.290.0012
301.24370.3708−0.6191.09110.3350+2.340.0018
501.00590.5049+0.3871.05560.5200−1.480.0016
All data presented above, with the exception of the designed phosphogypsum content, represent the average values derived from triplicate measurements (n = 3), SD: standard deviation.
Table 2. S element and SO42− content table.
S Concentration by ICP-OES (mg/L)CaSO4 Mass (calc. from S) (g)SO42− Concentration by IC (mg/L)CaSO4 Mass (calc. from SO42−) (g)Actual Mass of Digested PG (g)
Blank−0.526-9.36--
Calcination
10%
235.6270.0500681.5250.04960.0505
Calcination
30%
269.3770.0572809.680.05670.057
Calcination
50%
250.7110.0532768.320.05380.0533
high-temperature microwave heating
10%
243.1560.0516715.8350.05080.0512
high-temperature microwave heating
30%
271.4320.0576812.4670.05760.0575
high-temperature microwave heating
50%
253.4280.0538760.5000.05390.0540
All data presented above, with the exception of the actual digested phosphogypsum content, represent the average values derived from triplicate measurements (n = 3).
Table 3. ICP-OES determination of other element content in fillers.
Element (mg/L)BlankCalcination
10%
Calcination
30%
Calcination
50%
High-Temperature Microwave Heating
10%
High-Temperature Microwave Heating
30%
High-Temperature Microwave Heating
50%
Si0.2400.3440.4200.3500.3520.4310.358
Ca−0.555300.182338.946316.931305.671341.824319.547
Al−0.4201.9852.2342.2542.1242.3782.315
Fe−0.9157.6306.1055.0997.8916.3475.287
Mg−0.760−0.402−0.376−0.408−0.398−0.371−0.402
Ti−0.882−0.397−0.343−0.304−0.391−0.338−0.298
K0.3161.0541.0881.0681.0871.1121.083
Na0.2261.0191.0941.0111.0451.1181.027
P−0.3661.4931.2941.0621.5421.3311.089
Results are expressed in mg/L, with all data representing the average values derived from triplicate measurements (n = 3).
Table 4. Thermogravimetric analysis yields a table of phosphogypsum content.
Target Phosphogypsum Content (%)Phosphogypsum Obtained by Direct Separation (g)SD (n = 3)Relative Error (%)Phosphogypsum Obtained After Swelling Pretreatment (g)Relative Error (%)SD (n = 3)
03.970.12-2.37-0.09
1012.50.182.510.660.660.14
3033.390.213.3929.46−0.540.16
5044.610.24−5.3949.26−0.740.19
The TGA results for the swelled samples demonstrated a relative error of less than ±5.4% compared to the designed loadings, indicating high accuracy and reproducibility. This method offers rapidity and simplicity while enabling the simultaneous analysis of multiple components. However, it imposes stringent requirements on instrumental precision, and the results are susceptible to variations in sample preparation and testing conditions.
Table 5. Sulfur spike recovery test result.
Sample SetTheoretical Spike (µg/g)Measured S (mg/L)Calculated S (µg/g)Recovery (%)RSD(%)
Blank00.357---
low concentration50.4494.60092%2.1%
Medium concentration501.35349.80099.6%1.7%
high concentration2004.350199.65099.8%2.3%
All data presented above, with the exception of the theoretical spiked amounts, represent the average values derived from triplicate measurements (n = 3).
Table 6. Calcium spike recovery test results.
Sample SetTheoretical Spike (µg/g)Measured Ca (mg/L)Calculated Ca (µg/g)Recovery (%)RSD(%)
Blank03.115---
low concentration53.2094.700942.2
Medium concentration504.11249.85099.72.97
high concentration2007.059197.20098.62.68
All data presented above, with the exception of the theoretical spiked amounts, represent the average values derived from triplicate measurements (n = 3).
Table 7. Comparison of quantification methods for PG in epoxy composites.
MethodAccuracy (Recovery)Precision (RSD)Sample PreparationDestructiveSuitable for Multi-Filler
GravimetryModerate (97–98%)<5%SimpleYesNo
ICP-OESHigh (91–99.8%)≤4.2%ComplexYesYes
ICModerate (96–99%)<5%ComplexYesYes
TGAModerate (95–105%)<6%SimpleYesLimited
SEM-EDSModerate (90–97%)<8%SimpleNoLimited
Based on this comparison, ICP-OES is recommended when high accuracy and precision are required, particularly for complex or multi-filler formulations. Gravimetry remains a practical choice for single-filler PG systems due to its simplicity. TGA and SEM-EDS offer rapid, non-destructive alternatives but with larger errors and limitations in multi-component systems.
Disclaimer/Publisher’s Note: The statements, opinions and data contained in all publications are solely those of the individual author(s) and contributor(s) and not of MDPI and/or the editor(s). MDPI and/or the editor(s) disclaim responsibility for any injury to people or property resulting from any ideas, methods, instructions or products referred to in the content.