Article

The Comprehensive Study of TiO2 Blocking Layer with Complementary Electrochemical and SPM Methods for the Application in Photovoltaics

by
Evgenija Milinković
1,
Katarina Cvetanović
1,*,
Marko V. Bošković
1,
Nastasija Conić
2,3,
Vladislav Jovanov
1,
Dragomir Stanisavljev
4 and
Dana Vasiljević-Radović
1
1
Institute of Chemistry, Technology and Metallurgy, National Institute of the Republic of Serbia, University of Belgrade, 11000 Belgrade, Serbia
2
School of Electrical Engineering, University of Belgrade, 11000 Belgrade, Serbia
3
Institute for Quantum Information and Matter, California Institute of Technology, Pasadena, CA 91125, USA
4
Faculty of Physical Chemistry, University of Belgrade, 11000 Belgrade, Serbia
*
Author to whom correspondence should be addressed.
Inorganics 2025, 13(8), 270; https://doi.org/10.3390/inorganics13080270 (registering DOI)
Submission received: 10 July 2025 / Revised: 7 August 2025 / Accepted: 14 August 2025 / Published: 17 August 2025

Abstract

The blocking layer is crucial for inhibiting recombination processes in photovoltaics that utilize oxide semiconductors, such as dye-sensitized solar cells (DSSCs), quantum-dot-sensitized solar cells (QDSSCs), and perovskite solar cells. However, its effectiveness strongly depends on the chosen deposition method. This study systematically evaluates the most suitable approach for obtaining a uniform, pinhole-free titanium dioxide (TiO2) blocking layer by using three deposition methods: radio-frequency sputtering, spin-coating, and chemical bath deposition. The electrochemical, optical, and morphological properties of blocking layers were characterized using cyclic voltammetry (CV), electrochemical impedance spectroscopy (EIS), UV-VIS spectroscopy, scanning electron microscopy (SEM), atomic force microscopy (AFM), and Kelvin probe force microscopy (KPFM). KPFM analysis, together with CV and EIS, revealed that the lower Rct values and higher CV currents observed in spin-coated (SC_11-33) and vertically deposited CBD films (CB_5, CB_6) resulted from incomplete FTO coverage. In contrast, sputtered (SP_21-24) and horizontally deposited CBD films (CB_1, CB_2) demonstrated significantly higher Rct values and improved surface coverage. Full DSSCs fabricated with SP_23, SC_33, and CB_2 confirmed the correlation between interfacial properties and photovoltaic performance. This combined approach offers a fast, material-efficient, and environmentally conscious screening method for optimizing blocking layers in solar cell technologies.

1. Introduction

Due to the enormous energy consumption and the negative impact of non-renewable sources on the environment, the demand for renewable energy sources continues to grow. Over the last few decades, there has been notable interest in research and development in the field of photovoltaics, i.e., solar cells [1,2,3]. Numerous theoretical and experimental studies eventually led to the development of three generations of solar cells [3,4,5]. Third-generation solar cells are recognized as promising technologies with rising power conversion efficiency [2,3,4,5], characterized by simple and low-cost fabrication processes. These devices can be manufactured with minimal use of hazardous materials, which makes them ecologically acceptable and sustainable, in line with the most important objectives of today’s society. Titanium dioxide (TiO2) is a widely spread semiconducting material that has the role of the electron transport layer in third-generation solar cells (Figure 1), like dye-sensitized solar cells (DSSCs) [6,7,8,9], quantum-dot-sensitized solar cells (QDSSCs) [10,11,12], hybrid organic-inorganic solar cells [13,14,15], and perovskite solar cells (PSC) [16,17,18,19].
The wide band gap, high thermal and chemical stability, non-toxicity, and low cost are the main characteristics that enable its widespread use in photovoltaics [20,21]. The particular role of TiO2 in solar cells is in the form of a so-called blocking layer, which was first applied in DSSCs [22]. This thin TiO2 layer prevents recombination processes at the interface between transparent conductive oxide glass (TCO) and electrolyte. In DSSCs, the semiconductor alone consists of three layers: a thin blocking layer, a mesoporous layer, and a thin passivation layer on top of the mesoporous layer. The physical contact between the hole transport electrolyte and the conductive glass surface is the cause of the recombination processes on this interface. Due to the porous nature of the nanocrystalline TiO2, redox species of the electrolyte can easily come into contact with TCO, thus deteriorating the performance of solar cells. Adding a blocking layer between TCO and nanocrystalline TiO2 has been shown as an effective way to block such recombination and improve both the photovoltage and photocurrent of cells [23,24]. In addition to dye-sensitized solar cells, the blocking layer has been proven crucial for the efficient operation of quantum-dot solar cells [25], and progressively developing perovskite solar cells [19,26]. In perovskite solar cells, a thin TiO2 layer blocks recombination between the TCO and the active perovskite layer. Furthermore, the blocking layer creates a potential barrier between TCO and semiconducting material, which hinders the flow of electrons from TCO back to the semiconductor [27]. Introducing the blocking layer also improves adhesion between the oxide semiconductor and the TCO substrate. Various promising methods for the deposition of the TiO2 blocking layer can be found in the literature, such as chemical bath deposition [28], the sol-gel method [29], spray pyrolysis [30], chemical vapor deposition [31], spin-coating [32], electrochemical deposition [26], atomic layer deposition [33], and sputtering [34]. Among the wide range of available techniques, choosing the most suitable one can be challenging without a detailed investigation of the correlation between the deposited layer and the overall anode performance.
Our research addresses one of the challenges in the solar cell manufacturing process: fabricating a good-quality blocking layer on TCO while evaluating the advantages and limitations of different fabrication methods. The methods used were diode radio-frequency (RF) sputtering, spin-coating, and chemical bath deposition. Chemical bath deposition (CBD) is the most common method for the deposition of thin TiO2 layers since it is suitable for use at low temperatures and has a simple and cost-effective experimental setup with minimal use of chemicals [35,36]. Prior studies of the chemical bath-deposited layers have focused on their properties shaped by varying parameters such as the concentration of the precursor [37,38] and time duration [35,39]. To our knowledge, there is currently no information in the literature regarding the optimal properties of the blocking layer regarding its vertical or horizontal positioning. Therefore, we extended our study of CBD layers to evaluate the effect of the sample placement in the solution during deposition on the parameters of the blocking layer. The second deposition method was spin-coating, which, according to the literature, achieves highly smooth, uniform, and ultra-thin coatings [40]. The primary limitation of this approach is the deposition on large-scale substrates. In contrast to spin-coating, RF sputtering is suitable for uniform large-scale deposition, with precisely defined thickness of deposited films and their stoichiometric structure [41,42].
In addition to the techniques that were chosen for comparison in this study, it should be noted that atomic layer deposition (ALD) and electrochemical deposition emerged as the most promising methods for TiO2 layer fabrication. With the ALD method, it is possible to produce very thin, uniform, and pinhole-free TiO2 layers, with excellent control over the thickness and composition of the films at the atomic scale [43]. However, its main drawbacks are the high equipment cost and slow deposition rates, as well as limited scalability for large-area, low-cost solar technologies. The electrochemical deposition method provides a low-cost, solution-based route for TiO2 film formation under ambient conditions [44] but is usually of lower quality in comparison to ALD layers. Our study presents a comprehensive evaluation of three accessible and scalable deposition methods, RF sputtering, spin-coating, and chemical bath deposition (CBD), with direct correlation to DSSC device performance. Sputtering achieves excellent compactness and adhesion but requires vacuum systems, similar to ALD. One of the main advantages of the spin-coating method is the simplicity of its application; however, it can exhibit low reproducibility and incomplete coverage of the deposited films. Chemical bath deposition, particularly in the horizontal orientation, emerges as a promising low-temperature, low-cost alternative, with high scalability, as opposed to the ALD method.
Ten TiO2 layers (SP_11-24) were deposited using the RF sputtering method by adjusting different sputtering powers and deposition times. Nine layers (SC_11-33) were spin-coated from titanium tetrachloride (TiCl4) precursor solutions with different concentrations and pre-heating times, while six blocking layers (CB_1-6) were deposited from the same precursor using the bath-coating method, varying only sample orientation and homogenization (without changing the concentration). The sample labels and their corresponding deposition conditions are presented in Table 1. TiO2 blocking layers were simultaneously deposited onto fluorine-doped tin oxide (FTO) glass and microscopic glass. Detailed information regarding the different samples’ preparations is presented in Section 3.2.
The blocking layers obtained by these deposition methods have been thoroughly characterized electrochemically, optically, and morphologically in order to determine their key features. A brief understanding of the causal relationship between deposited TiO2 layers and the nature of anodes is found.
An additional contribution of this study lies in the comparison of results obtained by characterization methods and their compatibility: electrochemical impedance spectroscopy (EIS) and cyclic voltammetry (CV) with Kelvin probe force microscopy (KPFM). This multi-method approach provided valuable insights into the blocking layer properties using readily accessible equipment. Combining the results of current density from CV, charge transfer resistance from EIS, and surface potential from KPFM, it is possible to say with great certainty whether the surface (even if it is not completely smooth) is homogeneously covered with a thin film or whether it contains pinholes. Furthermore, atomic force microscopy (AFM) analysis provided insights into the growth characteristics of the investigated films. This combination of methods was used to investigate the devices, but not for a detailed investigation of components [45,46]. The main contribution of our study is the comparative analysis of the morphological, optical, and electrochemical characteristics of blocking layers obtained with the use of three different methods. This approach allows the selection of the best method for the deposition of blocking layers in order to achieve the highest efficiency of DSSC, prior to full device fabrication, while reducing material waste and minimizing environmental impact.

2. Results and Discussion

2.1. Radio-Frequency Sputtering of TiO2 Layers—SP Method

The initial series of sputtered films, SP_11-16, significantly decreased the transparency of the microscopic glass. Corresponding transmittance spectra of sputtered films SP_11-16 can be found in the Supplementary Information, following extracted transmittance values in Table S1. In order to quantitatively compare the obtained spectra, the transmittance values of every sample were determined from their UV-VIS spectra at a specific wavelength of 535 nm. This wavelength was chosen for comparison because it corresponds to the absorption maximum of the most commonly used photosensitizer in DSSCs, dye N719 [47], which is frequently used as a co-sensitizer in quantum-dot solar cells [48].
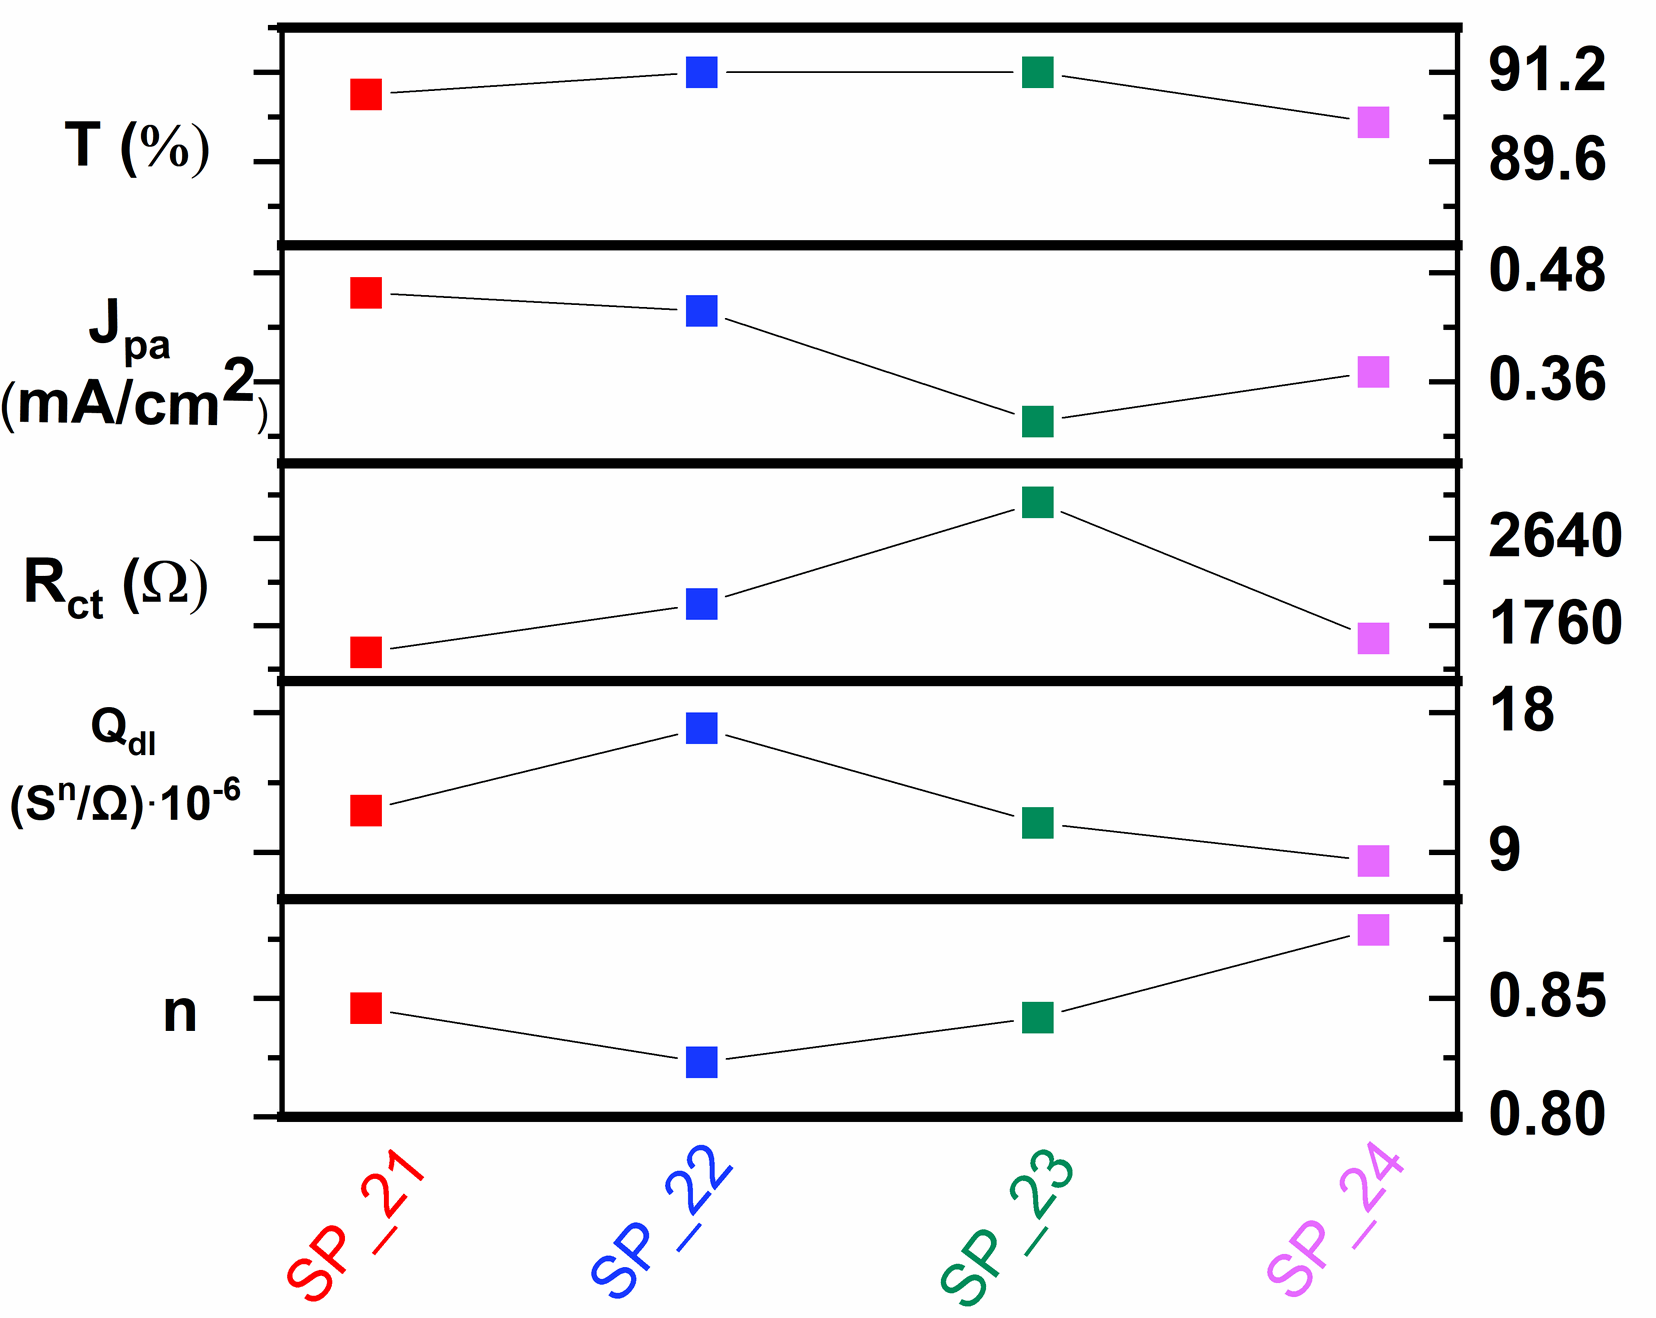
To achieve more transparent blocking layers and consequently photoanodes, sputtering powers and deposition times were reduced in the second series, SP_21-24. Transmittance spectra of the second sputtered series SP_21-24 are presented in Figure 2, while transmittance values are presented in Figure 3 and Table S1. Estimated optical absorption edges (nm) are presented in Table S2. Along with the transmittance values of sputtered samples, electrochemical parameters (Jpa, Rct, Qdl, and n) are also represented in Figure 3 and will be described later on. As observed in Figure 2 and Figure 3, for the deposition time of 5 min, the sputtering power has minimal influence on the film transparency, as evidenced by the similar transmittance values of samples SP_21-23 (which were sputtered with powers of 200 W, 250 W, and 300 W for 5 min). The UV-VIS spectrum of the sample SP_24 (sputtered for 10 min with a sputtering power of 200 W) differs from the first three samples. The absorption edge of SP_24 is slightly shifted to longer wavelengths of the UV-VIS spectrum (306 nm) in comparison to the other samples, but in general, the values are very similar (Table S2).
The higher sputter powers (250 W and 300 W) with deposition times of 10 min have not been examined, since the sputtering with the lowest power of 200 W already led to an unfavorable decrease in the transparency of samples.
The blocking effect of deposited sputtered layers on the FTO has been analyzed using cyclic voltammetry. The electrochemical response of deposited layers to the redox reaction of Fe(CN)63−/4− was compared with the response of bare FTO (Figure 2b). On a bare FTO, the Fe(CN)63−/4− redox couple undergoes a reversible one-electron transfer redox reaction, seen with a clear reversible voltammogram of FTO in Figure 2b (black line). CV curves of the sputtered samples SP_21-24 change shape to irreversible voltammograms with a significant decrease in current compared to pristine FTO due to the presence of TiO2 blocking layers [19,32,49,50]. Comparing electrochemical systems under identical conditions of electrolyte and scan rate, a change in current can only be the consequence of a change in the electrochemically active area of the electrode [48]. Anodic peaks on voltammograms of samples SP_21-24 are significantly suppressed. Reduction in Fe(CN)63− is facilitated by the quasi-metallic nature of TiO2 occurring at the negative potential [49]. A decrease in current, i.e., an increase in the TiO2 blocking effect, does not follow a decrease in the layer thickness regarding the transmittance spectra. Anodic current density peaks of the sputtered samples are graphically compared in Figure 3. Sample SP_23 showed the highest current suppression in CV, although the lowest transparency was found for SP_24. The higher transparency of the SP_23, but better CV current suppression, can stem from the more densely arranged structure of the TiO2 layer on the FTO, due to the specific growth of the layer during sputtering deposition. During the sputtering process, atoms and molecules are consecutively ejected toward the substrate and start to form a TiO2 layer, with a final structure defined after annealing. Nucleation and film growth strongly depend on the applied sputtering power [51].
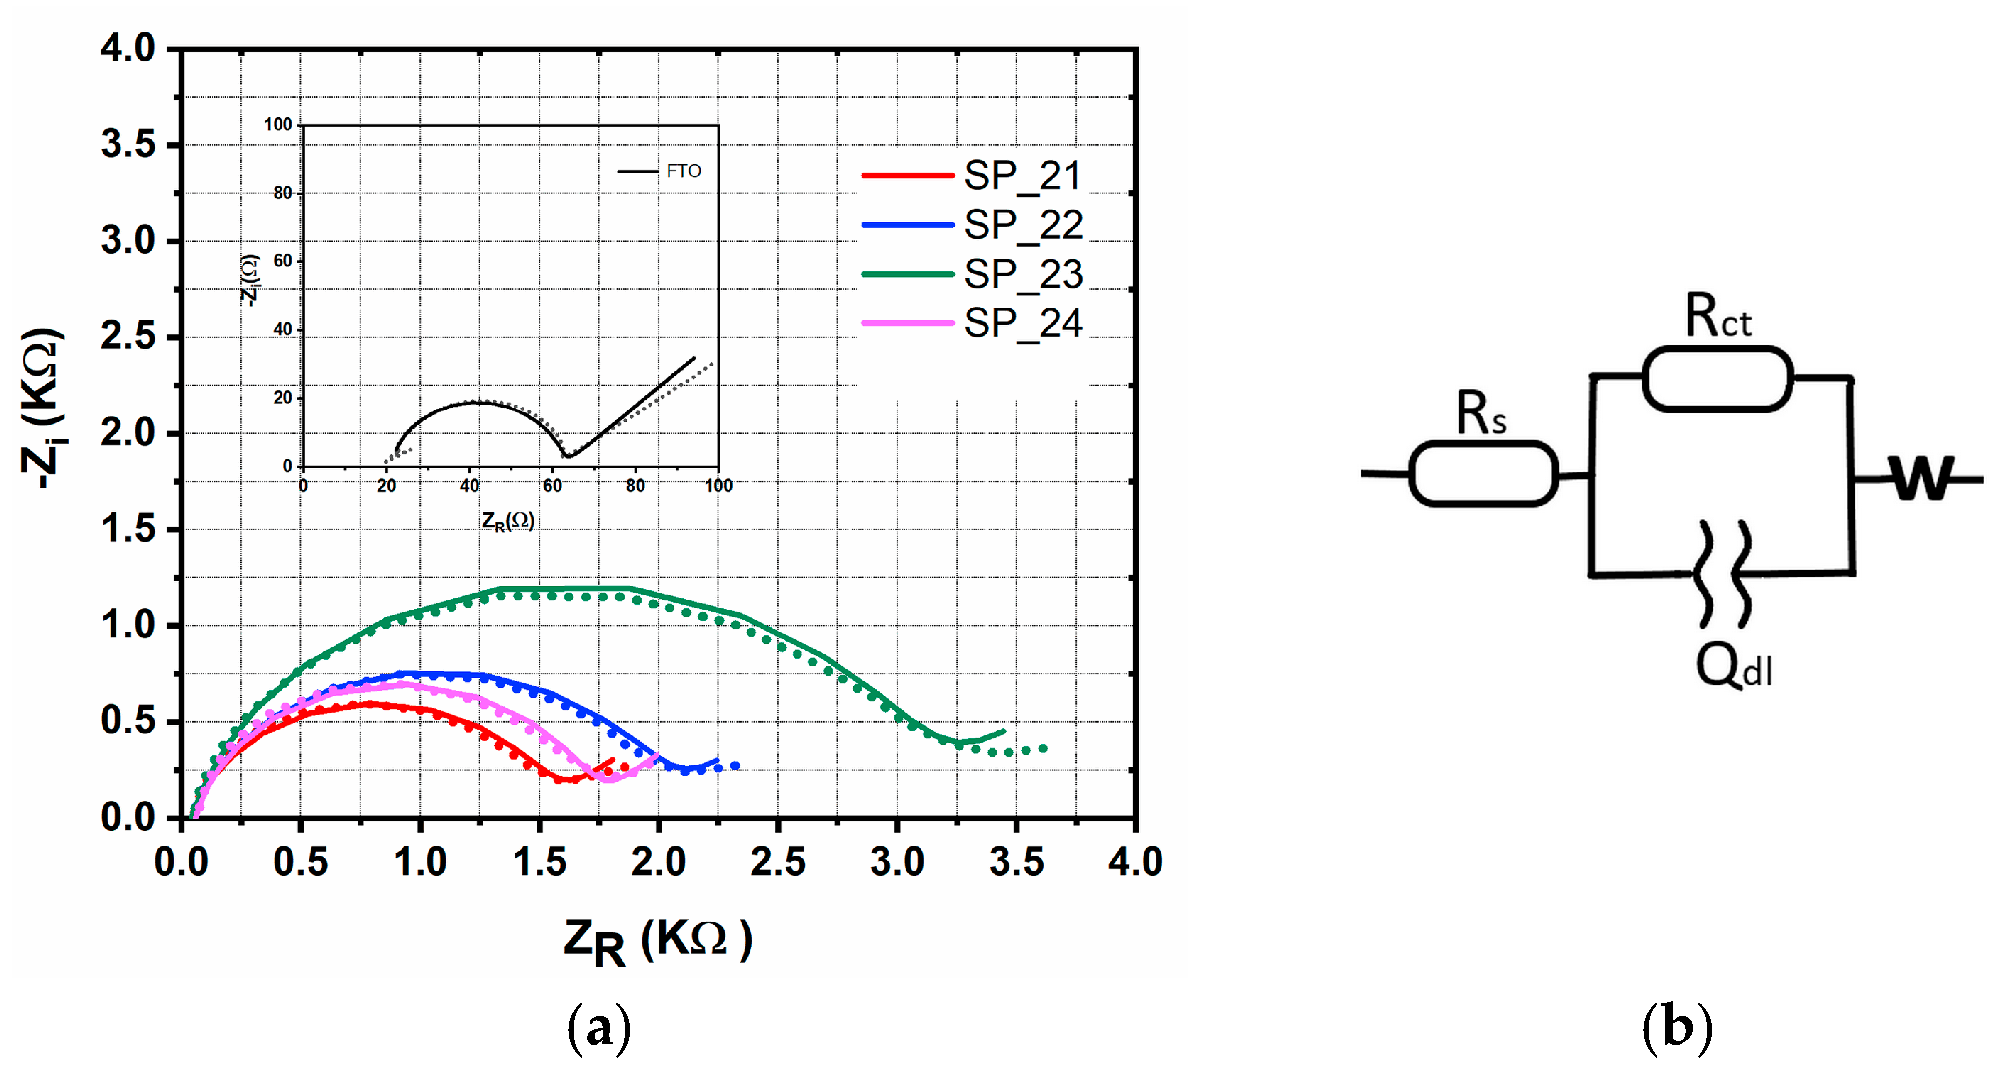
To investigate the charge transfer and interfacial properties of deposited TiO2 layers on FTO electrodes, EIS was used, a well-established technique for studying electrode/electrolyte interfaces [52]. EIS data are presented as Nyquist and Bode plots in Figure 4a and Figure S3, respectively. The dotted lines represent experimental data, while the solid lines represent data obtained by fitting experimental data with the equivalent circuit presented in Figure 4b.
The circuit was chosen to provide the best fit with the measured data while also reflecting the physical properties of the studied systems. The circuit used for fitting EIS spectra comprises four elements. Rs is the series resistance, which characterizes the ohmic resistance of electrodes, electrical contacts, and electrolyte solution. Rct presents charge transfer resistance at the TiO2/electrolyte interface, i.e., the double-layer interface. The contribution of the charge transfer at the counter electrode is negligible due to the large area of the Pt mesh and the rapid redox reaction on its surface. Surface inhomogeneities on the metal oxide electrode can contribute to the non-ideal capacitor [43]. This fact is why a Qdl element is used instead of an ideal capacitance element in the circuit. Qdl corresponds to the constant-phase element (CPE), which describes the behavior of an imperfect capacitor with impedance defined by the relation:
ZCPE = (jω)−n Q−1
where Q is the capacitance of a non-ideal capacitor, ω is the angular frequency, j is the complex number, and n is an ideality factor that ranges from 0 to 1. When n has a value of 0, the impedance of the CPE corresponds to the impedance of a resistor. In contrast, a value of one suggests that CPE impedance corresponds to the impedance of an ideal capacitor. In the same equivalent circuit, there is also a Warburg element (W), which characterizes diffusion processes influenced by the concentration gradient of redox species in the electrolyte due to rapid electron transfer reactions at the electrode surface. In Nyquist plots, the Warburg element is typically seen as a line with a slope of 45°. The Nyquist plot of bare FTO is also presented in Figure 4a.
Table 2 represents the fitting parameters for the equivalent circuit elements by modeling the impedance spectra presented in Figure 4a, while Rct, Qdl, and the n factor are presented in the same graph (Figure 3) aligned with the current density peaks from CV and transmittance values. The electron lifetime (τ) was determined from the frequency fp that corresponds to the arc’s peak in the Nyquist plot [53]:
τ = 1 2 π f p
This time constant is directly related to the charge transfer process at the TiO2/electrolyte interface, and comprises both the charge transfer resistance and the capacitance of the double-layer interface [43]. The charge transfer resistance of all samples is above 1 KΩ. The charge transfer through the SP_23 sputtered TiO2 electrode is the most unfavorable compared to the other electrodes, which aligns with CV results, while the Rct of sample SP_22 is higher than SP_24.
However, impedance spectroscopy allows independent analysis of capacitance and resistance, unlike cyclic voltammetry, where the observed current is a combined effect of these properties [54]. The Qdl value of the sample sputtered with power 250 W (SP_22) is the highest compared to the other samples (Figure 3 and Table 2), which suggests that the structure is changed in the context of surface homogeneity. Also, the SP_22 sample has the lowest value of the ideality factor n. The values of Warburg elements are lower in all samples when compared with the bare FTO. However, their presence suggests that there is still a concentration gradient on the surface of sputtered electrodes due to redox transfer, especially because of the quasi-metallic TiO2 nature at the negative potentials, as mentioned above. This is also evident in straight lines in the low-frequency range on the Nyquist plots (Figure 4a). If one considers electron lifetime in TiO2 layers in prepared samples, it is evident that samples SP_22 and SP_23 have increased electron lifetimes, which is due to the reduced recombination process on the anode, which is beneficial for efficient solar cells [55].
Figure 5 presents SEM images of the thinnest sample, SP_21; the thickest sample, SP_24, according to transparency; and SP_22 with the highest value of Qdl (Figure 3). The SEM image of sample SP_21 (Figure 5a) shows a very thin TiO2 layer under which the morphology of the FTO is visible. The TiO2 layer of sample SP_24, deposited over a time period of 10 min (Figure 5c), fills valleys between FTO structures, resulting in a more compact layer compared to sample SP_21, explaining the smaller current density presented in CV measurements. Both SP_22 and SP_24 samples exhibit similar surface morphologies as observed in SEM images. The coverage of the FTO (%) substrate with sputtered TiO2 thin films is determined from images presented in Table S10. Software analysis of obtained images shows a higher percentage cover of SP_22 (87.92%) and SP_24 (95.59%) compared to sample SP_21 (81.25%). Considering that cover percentages were determined from SEM micrographs at magnifications of 50 k, values could not be absolutely reliable for the whole surface of the sample, and need additional confirmation through electrochemical analysis of the whole sample. So, a smaller percentage cover of SP_22 than SP_24 only corresponds to the place of SEM analysis, while the higher Rct of the whole surface of the sample indicates its better blocking layer performances. There are minor surface cracks in sizes smaller than 100 nm in both samples SP_22 and SP_24 (marked in yellow in Figure 5b,c). While these defects may potentially facilitate the penetration of the electrolyte to the FTO substrate, the complete suppression of anodic current in CV measurements and the high charge transfer resistance indicate that a direct conductive path to the FTO is unlikely. Significant surface irregularities of sample SP_22 were indicated by the different behavior in the EIS measurements (considering the value of the CPE element), but these differences could not be detected in the SEM analysis.
In addition, both Ra and RMS roughness values of the SP_22, obtained by AFM topography measurements, are smaller than those of SP_24 (Table S11). The smaller factor n of the SP_22 (0.823) in comparison to the factor n of the SP_24 (0.879) is then the result of the energetic heterogeneity of this sample rather than the geometric one (roughness), as is explained and confirmed in detail in previous studies [56,57], where the authors claim that the decrease in the CPE ideality coefficient with the roughness of the electrode’s surface does not necessarily follow this rule and is more dedicated to the relation to energetic material characteristics.
The EDS analysis performed for samples SP_21, SP_22, and SP_24 is presented in SI (Figures S6–S8 and Tables S3–S5). The results show that the coverage of the FTO with TiO2 deposited by sputtering is uniform, and the percentage of measured Ti is the highest for sample SP_24 with the lowest transmittance.
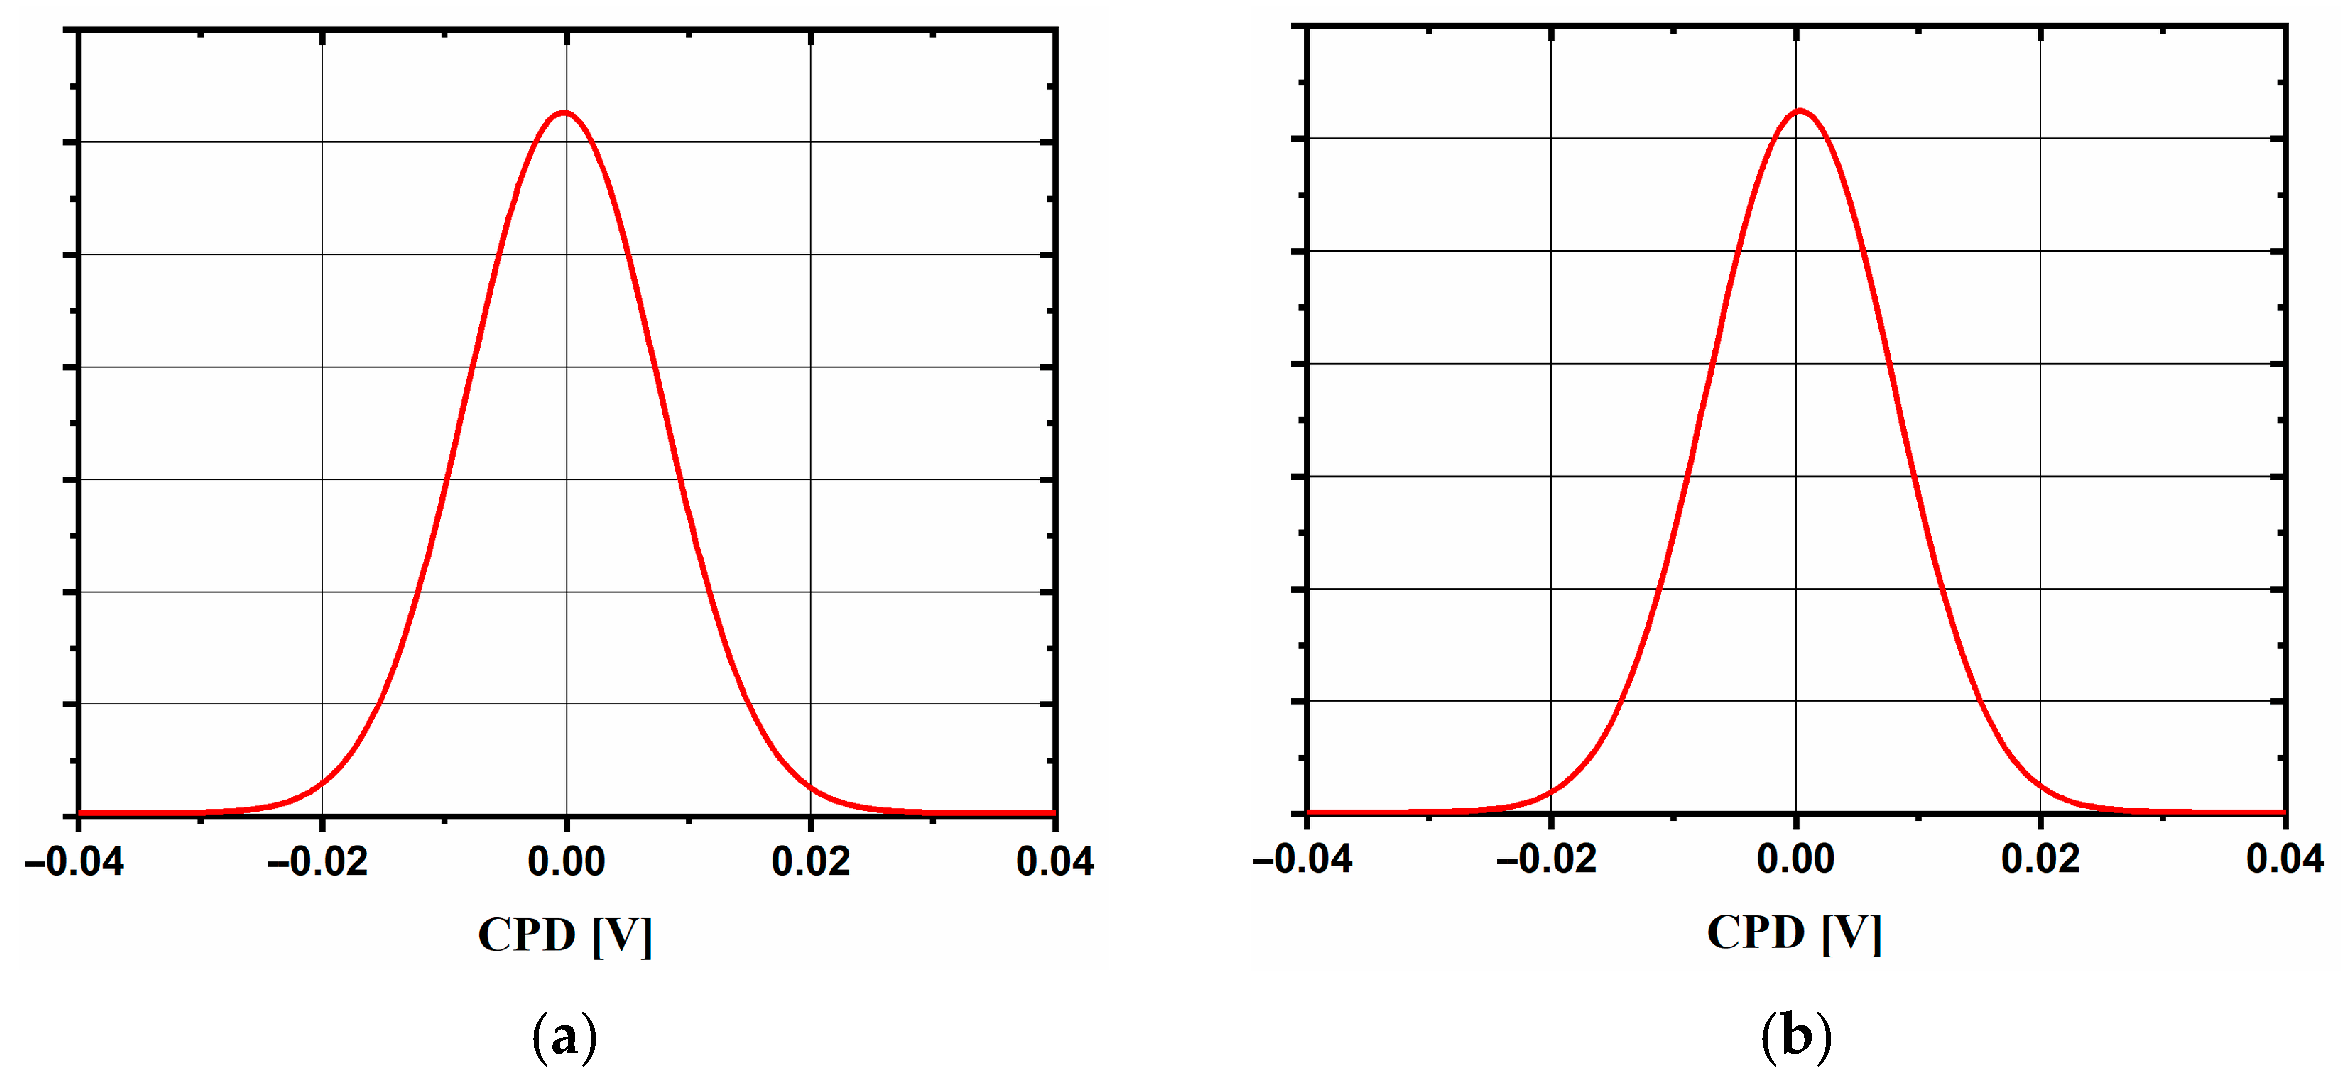
The KPFM measurements of the bare FTO and SP_24 are presented in Figure 6. The results further confirm the uniformity and complete coverage of the sample SP_24 with the sputtered layer of TiO2. The obtained contact potential difference (CPD) histograms for bare FTO and SP_24 samples indicate that there is only one value of surface potential, which is due to the presence of only one material on the surface, FTO and TiO2, respectively. These results are consistent with the CV measurements and indicate the full coverage of the sample SP_24, but also of the samples SP_22 and SP_23, which showed a weaker electrochemical response.
Of all the sputtered samples that were investigated, sample SP_23 showed the best blocking layer properties with the highest charge transfer resistance and expected uniform distribution of the surface potential.
In order to better understand the morphology and growth of TiO2 in the sputtered samples, the bare FTO and the sample SP_21, deposited over the shortest period of time, using the lowest power (200 W, 5 min), were analyzed by atomic force microscopy. The obtained results are presented in Figure 7. It can be seen that the surface of bare FTO has sharp spikes, while the surface of the thinnest sputtered sample, SP_21, shows a slight change in roughness, with more rounded spikes, and more uniform morphology. Therefore, it can be concluded that TiO2 deposited via the sputtering method follows the morphology of the surface of the FTO.

2.2. Spin-Coated TiO2 Layers—SC Method

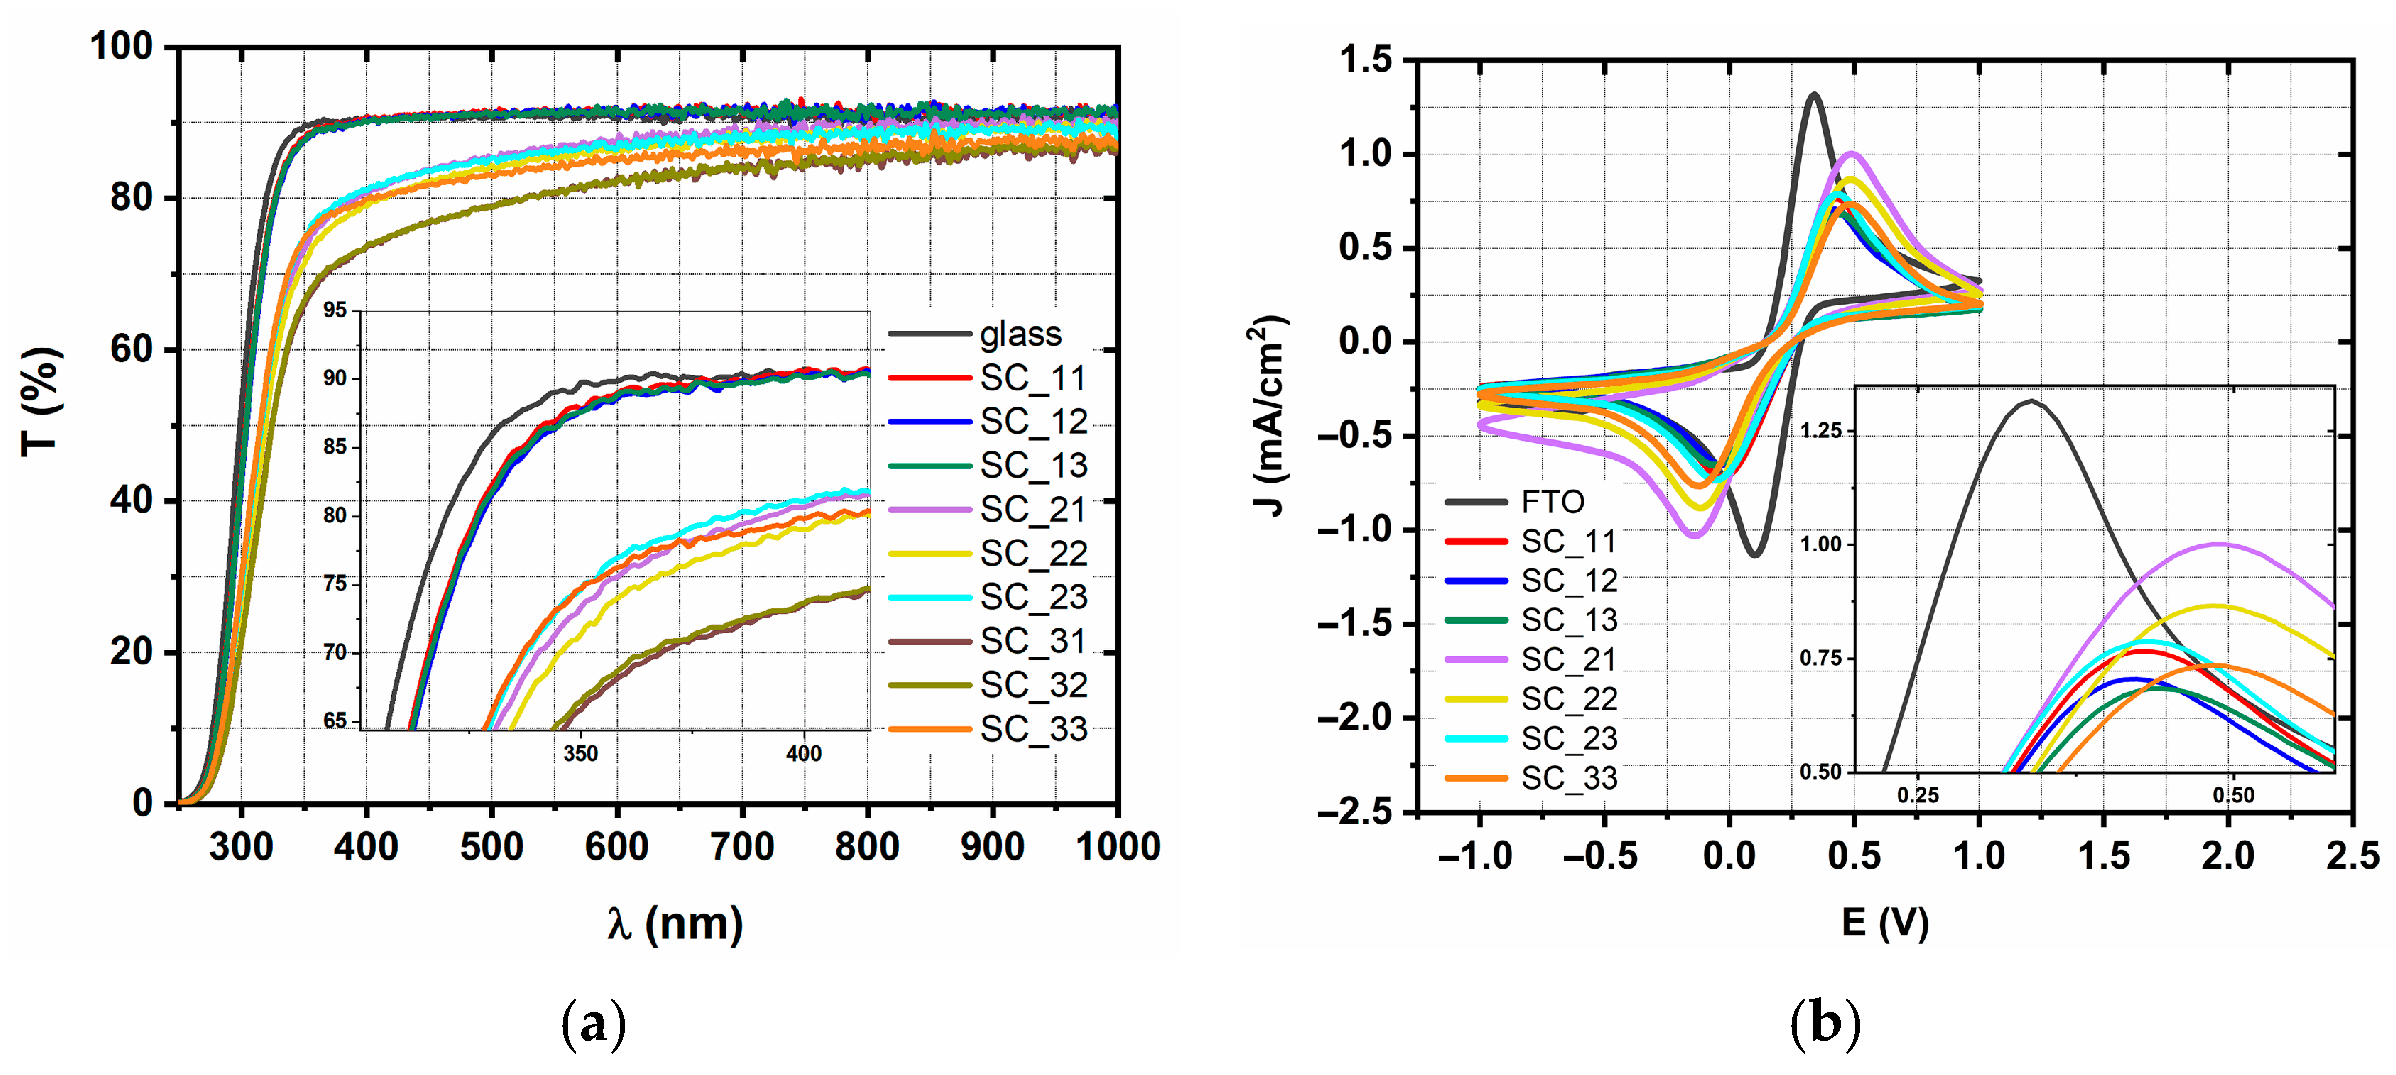
Figure 8a presents the transmittance spectra of the spin-coated samples, and observed transmittance values at 535 nm can be found in Figure 9a and Table S1. Samples prepared from 40 mM TiCl4(aq) solutions (SC_11-13) exhibit high transmittance, close to the glass transmittance. In contrast, layers derived from more concentrated solutions (120 mM, SC_21-23; 240 mM, SC_31-33) show lower transmittances depending on the time remaining for hydrolysis of the TiCl4 at 70 °C. In both cases (120 mM and 240 mM solutions), layers prepared with solutions pre-heated for 60 min (SC_23 and SC_33) exhibit the highest transmittance compared to the other samples from their series that were pre-heated for 20 and 40 min. This behavior can be attributed to the non-linear growth kinetics of TiO2 particles during TiCl4 hydrolysis [58], as aggregated particles can break down into smaller pieces. The size of TiO2 particles is strongly dependent on the concentration, temperature, and pH of the TiCl4(aq) solution. Sample SC_33 shows similar transmittance to the samples spin-coated from a 120 mM solution and an optical absorption edge value of 331 nm (Table S2), similar to the values of samples SC_21-23 (around 330 nm). Absorption edges of SC_11-13 are shifted to shorter wavelengths (around 320 nm), as a result of different thicknesses, but also possible morphological changes in the surface. The transmittance of the samples SC_21-23 and SC_31-33 does not reach the transmittance of the glass in the high-wavelength range, suggesting the high reflection from the surface of these samples.
Due to significantly reduced substrate transmittance, which is less than 75% at 400 nm, samples SC_31 and SC_32 were excluded from further investigations.
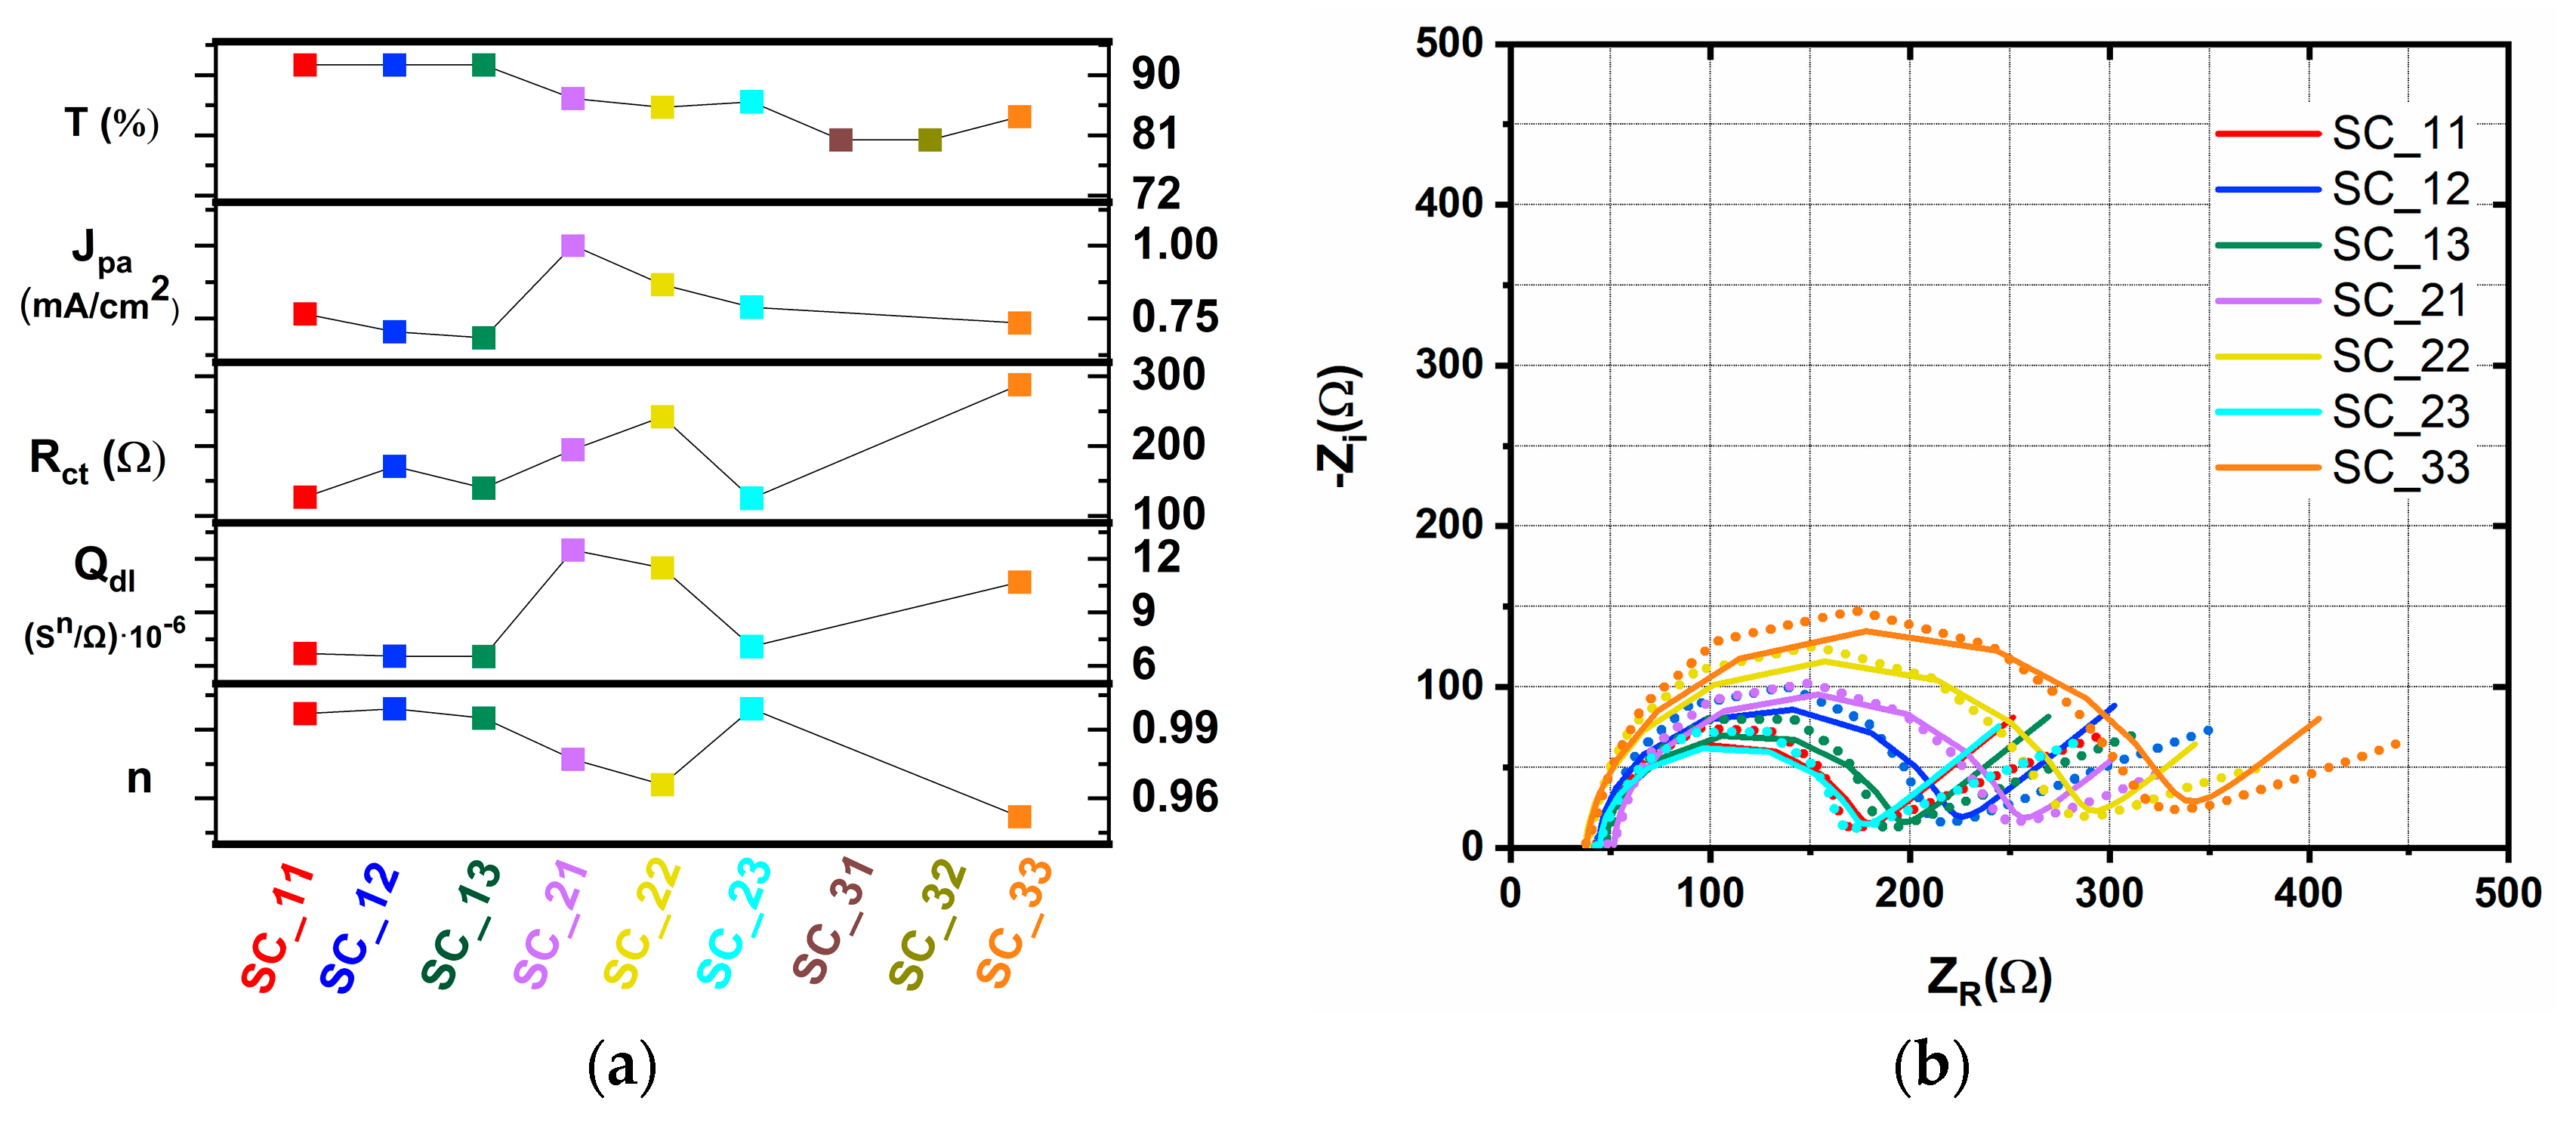
Cyclic voltammograms of spin-coated samples retain a reversible shape. Nevertheless, a current reduction is observed, suggesting a possible TiO2 blocking effect, by hindering the redox reaction of electroactive species (Figure 8b). While the transparency measurements revealed negligible differences between samples prepared from 40 mM solutions (SC_11-13), their electrochemical properties showed an increased effectiveness of the blocking effect with prolonged deposition time. As can be observed from Figure 8b and Figure 9a, current peak suppression is inversely proportional to increasing deposition time for samples SC_11-13. Notably, the current is decreased to a lesser extent for samples prepared from a 120 mM solution than for samples prepared from a 40 mM solution, at an expected rate. Sample SC_23, which has the highest transmittance of the two other samples prepared from the 120 mM solution, exhibits a CV current comparable to the current of sample SC_11, which was deposited from the 40 mM solution. The sample prepared from the 240 mM solution (SC_33) exhibits a current reduction in the same range but with a wider peak-to-peak separation. This broader peak separation is a further indicator of the weaker charge transfer of this sample [59].
Measured data are fitted using the same circuit as for sputtered samples (Figure 4b). Nyquist plots are presented in Figure 9b, and the obtained parameters are shown in Figure 9a and Table 3. Corresponding Bode plots are shown in Figure S4. The highest value of charge transfer resistance (288 Ω) was found for the sample SC_33, suggesting the most efficient blocking effect. While it was expected that the small TiO2 particles of sample SC_11 would easily form compact layers on a rough FTO surface, thus developing a promising blocking effect, the EIS data show that the opposite is true. SC_11 and SC_23 exhibit the lowest Rct values of 127 Ω and 125 Ω, respectively. Samples SC_21 and SC_22 deposited from the 120 mM solution exhibit larger Rct values (195 Ω and 242 Ω, respectively) compared to samples SC_11-13 deposited from 40 mM solutions.
While the current reduction in cyclic voltammetry was insignificant for these samples, the wider peak separation in their CV curves suggests a hindrance to the redox reactions occurring on their surfaces. Among the samples with higher charge transfer resistance, Rct, (SC_21, SC_22, and SC_33), higher values of double-layer capacitance, and lower values for the parameter n are also observed compared to other samples. The lower Qdl value for SC_11, SC_12, SC_13, and SC_23, and their correspondingly higher value of parameter n, can be attributed to their similarity to bare FTO (Table 2 and Figure 9a), i.e., incomplete surface coverage with TiO2. This observation also follows the electron lifetime values since this parameter for these samples is three times smaller than the electron lifetime of the samples with higher Rct.
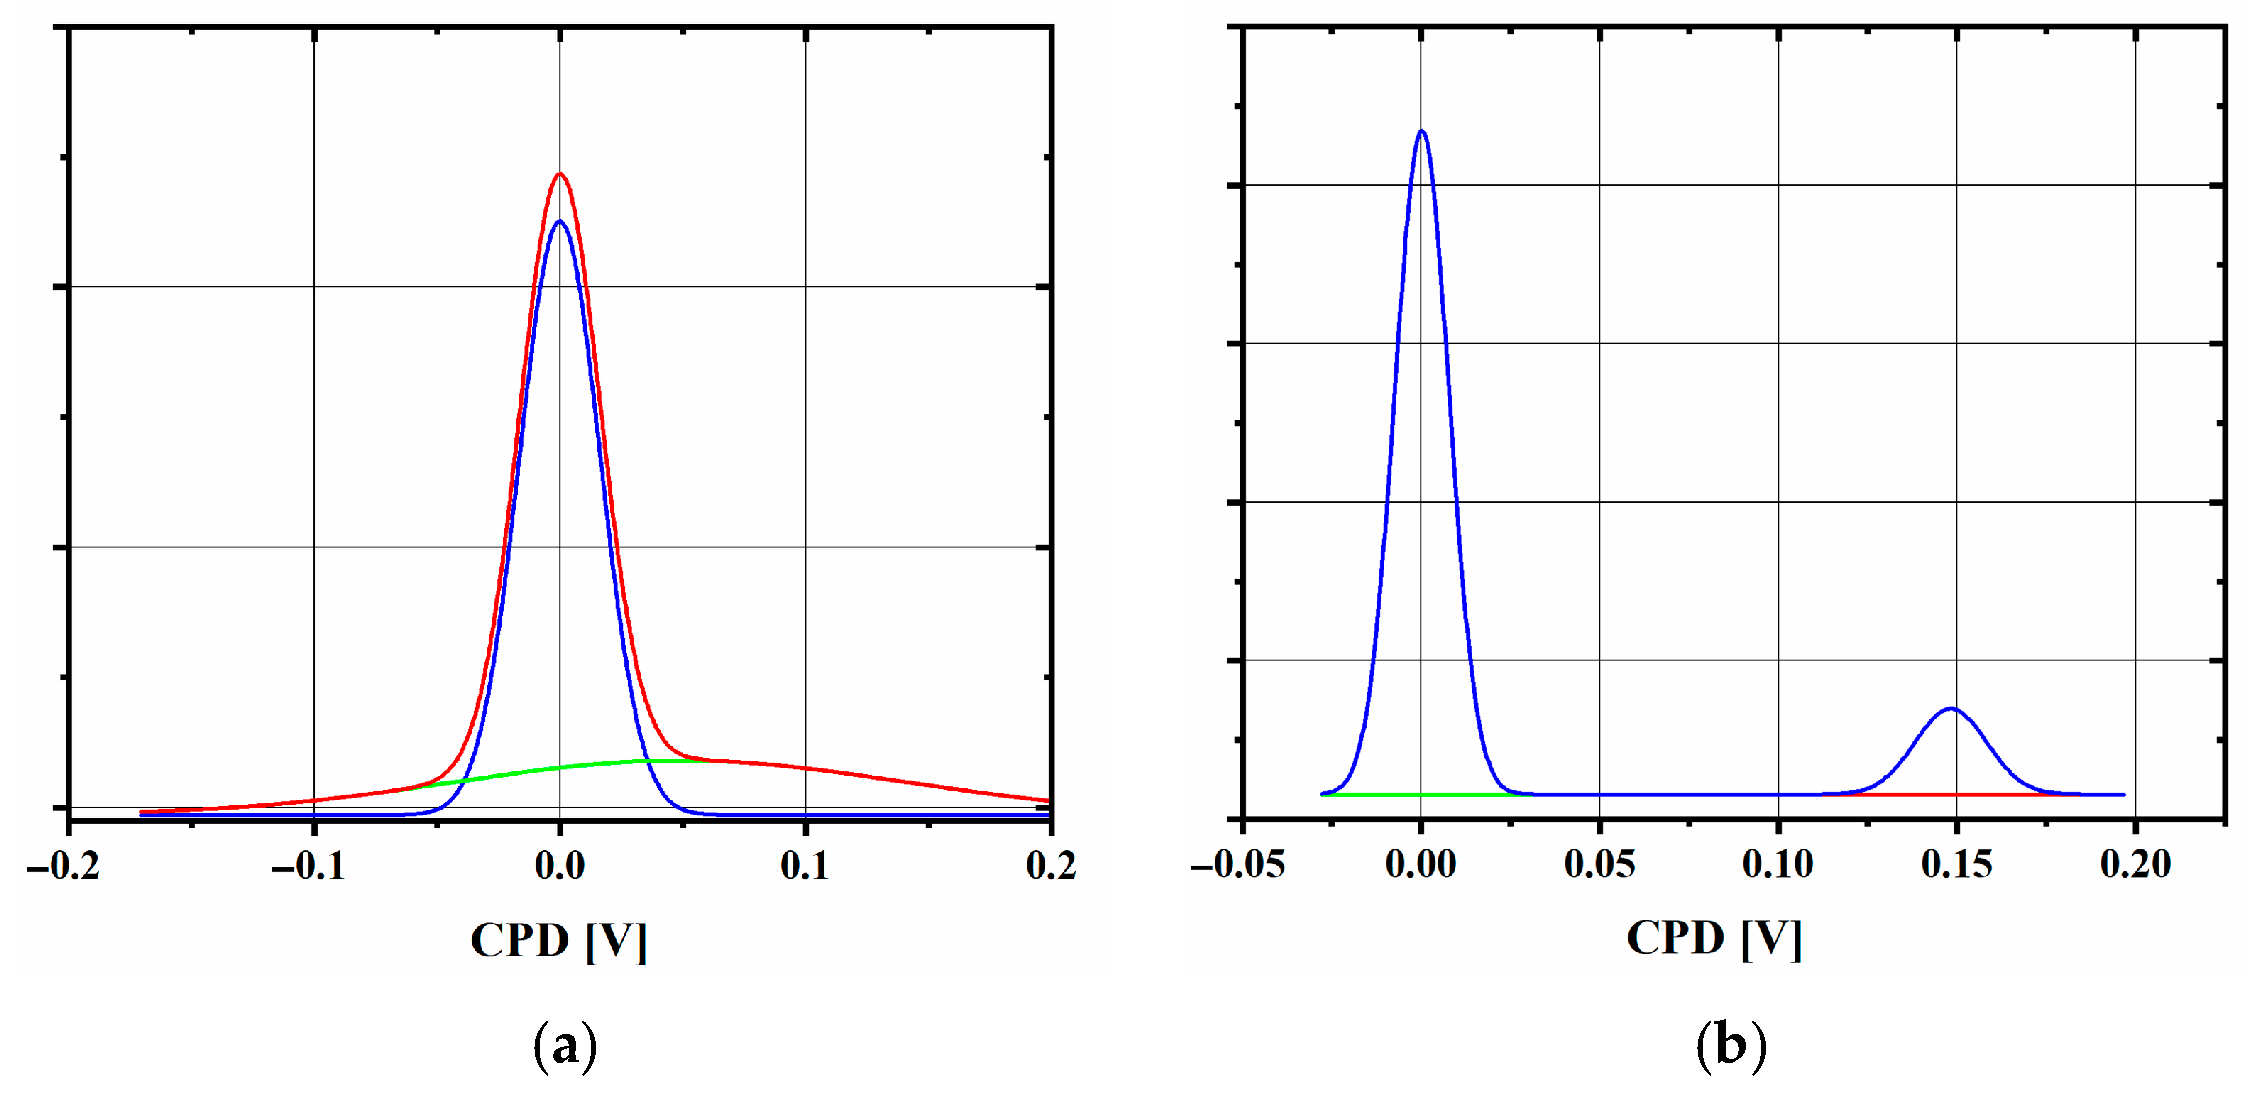
KPFM histograms for the spin-coated samples with the lowest (SC_11) and highest (SC_33) charge transfer resistance are shown in Figure 10. Both histograms show bimodal surface potential distributions indicated by green and blue lines of Gaussian fits, leading to the conclusion that two different materials are present at the sample surface.
Despite the reduced CV current in sample SC_33 compared to bare FTO, the overall blocking effect of the spin-coated layers remains insufficient. Therefore, it can be concluded that spin-coated TiO2 on the FTO using TiCl4 solution as a precursor is not efficient, not even for the sample with the highest Rct value (SC_33).
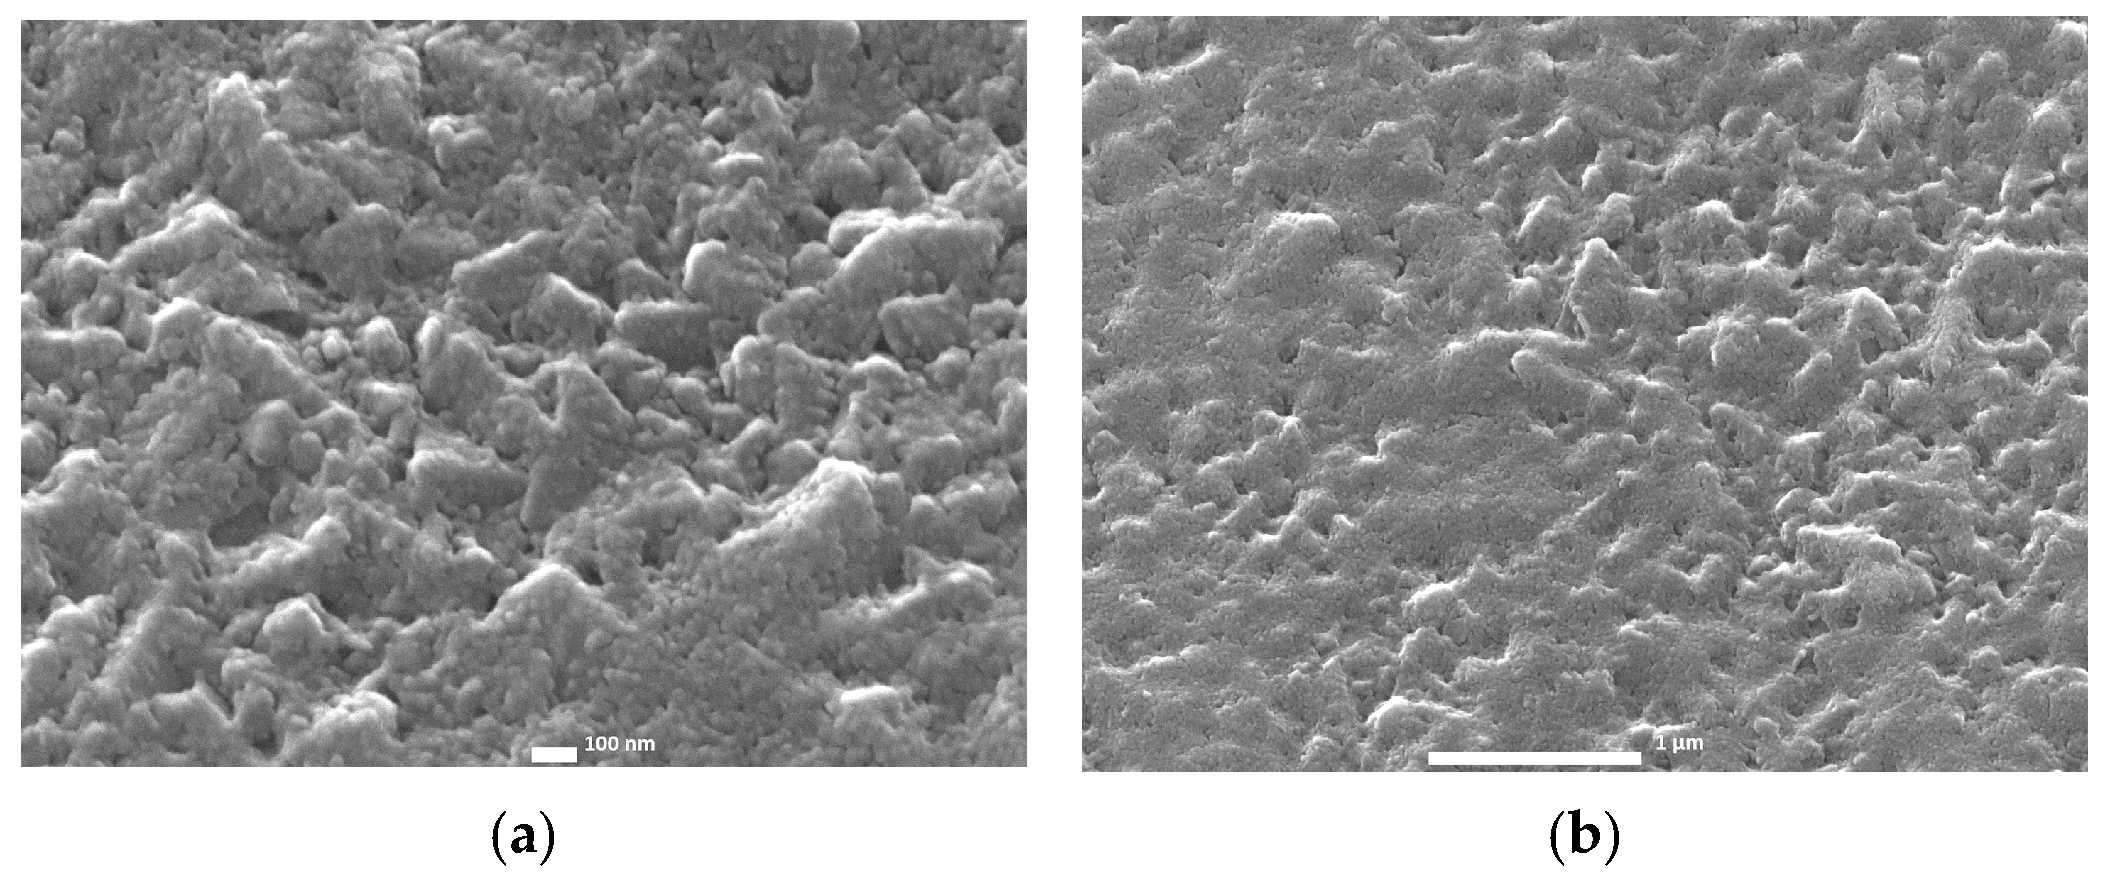
Poor electrochemical response on the spin-coated electrodes is further investigated by considering SEM and AFM measurements of the surface morphology of the samples.
The surfaces of the samples presented in the SEM micrographs in Figure 11 appear different compared to the samples that are made with sputtering (Figure 5). The TiO2 layer of sample SC_11 is characterized by a grainy texture without an ordered compact structure. The surface of sample SC_21 shows similar features, already at a smaller SEM magnification (right side of the image presented in Figure 11b).
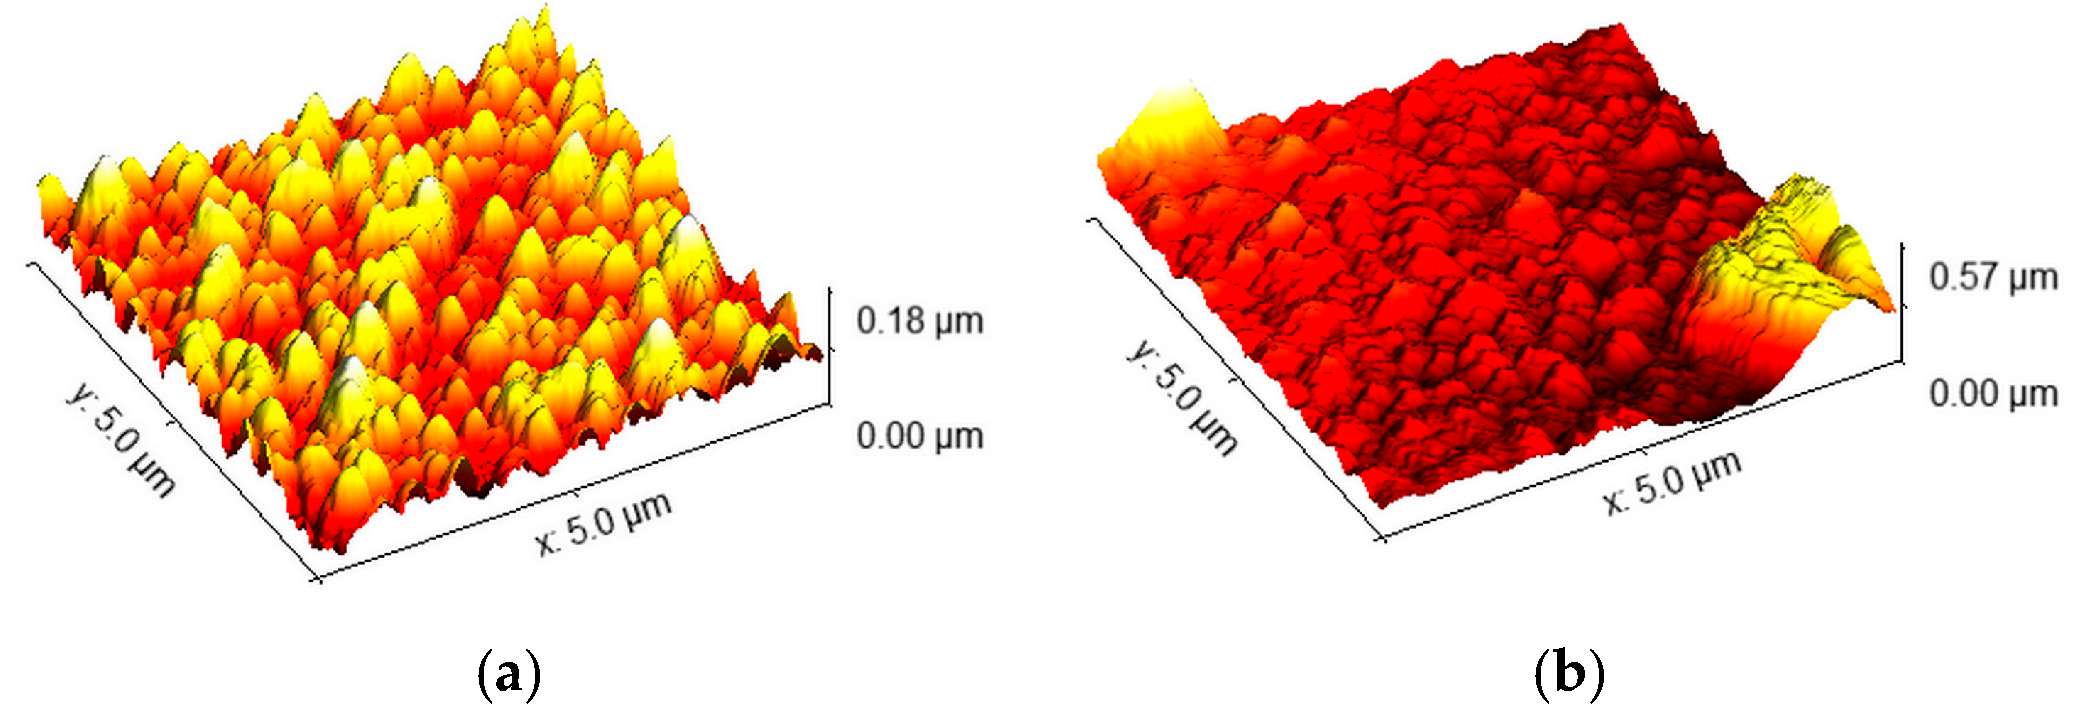
The obtained AFM micrograph of sample SC_11 shows sharp spikes that reach 0.18 μm high, resembling the morphology of the bare FTO substrate (Figure 7a). In contrast, SC_33 exhibited larger, non-uniform TiO2 structures reaching up to 0.57 μm (Figure 12b). These larger structures resulted from the prolonged hydrolysis time and higher TiCl4 concentration, but with obvious non-linear growth kinetics of the particles, hindering the formation of a uniform film during the spin-coating process. Larger particles tended to preferentially accumulate on certain regions of the FTO substrate, leaving other areas with incomplete or sparse coverage with smaller TiO2 particles. Combining the electrochemical results, KPFM, and roughness measurements, it can be concluded that the spin-coated TiO2 film predominantly forms in the depressions of the FTO, with the spikes on the surface remaining bare, as a result of the precursor solution filling the indentations on the uneven surface.

2.3. Chemical Bath-Deposited TiO2 Layers—CB Method

The most transparent samples prepared by the chemical bath deposition method were the ones deposited horizontally with homogenization (stirring with a magnet) during TiCl4 hydrolysis (CB_3 and CB_4) (Figure 13a, Figure 14a, and Table S1). Both samples, regardless of deposition time, exhibit identical transmittance. The horizontally placed samples without homogenization (CB_1 and CB_2), as well as the samples placed vertically (CB_5 and CB_6), showed a reduction in transparency compared to homogenized samples (Figure 13a, Figure 14a, and Table S1). Notably, the transmittance of the non-homogenized samples, prepared with the chemical bath method, with a longer deposition time (CB_2 and CB_6), is higher than that of the samples with a shorter deposition time (CB_1 and CB_5). A similar effect of the non-linear growth kinetics of TiO2 particles during TiCl4 hydrolysis is observed, as for some spin-coated samples. Optical absorption edges in general are comparable to values determined for spin-coated samples (Table S2). Values vary in the range of 317–333 nm, and they are significantly shifted from values for sputtered samples (around 302 nm).
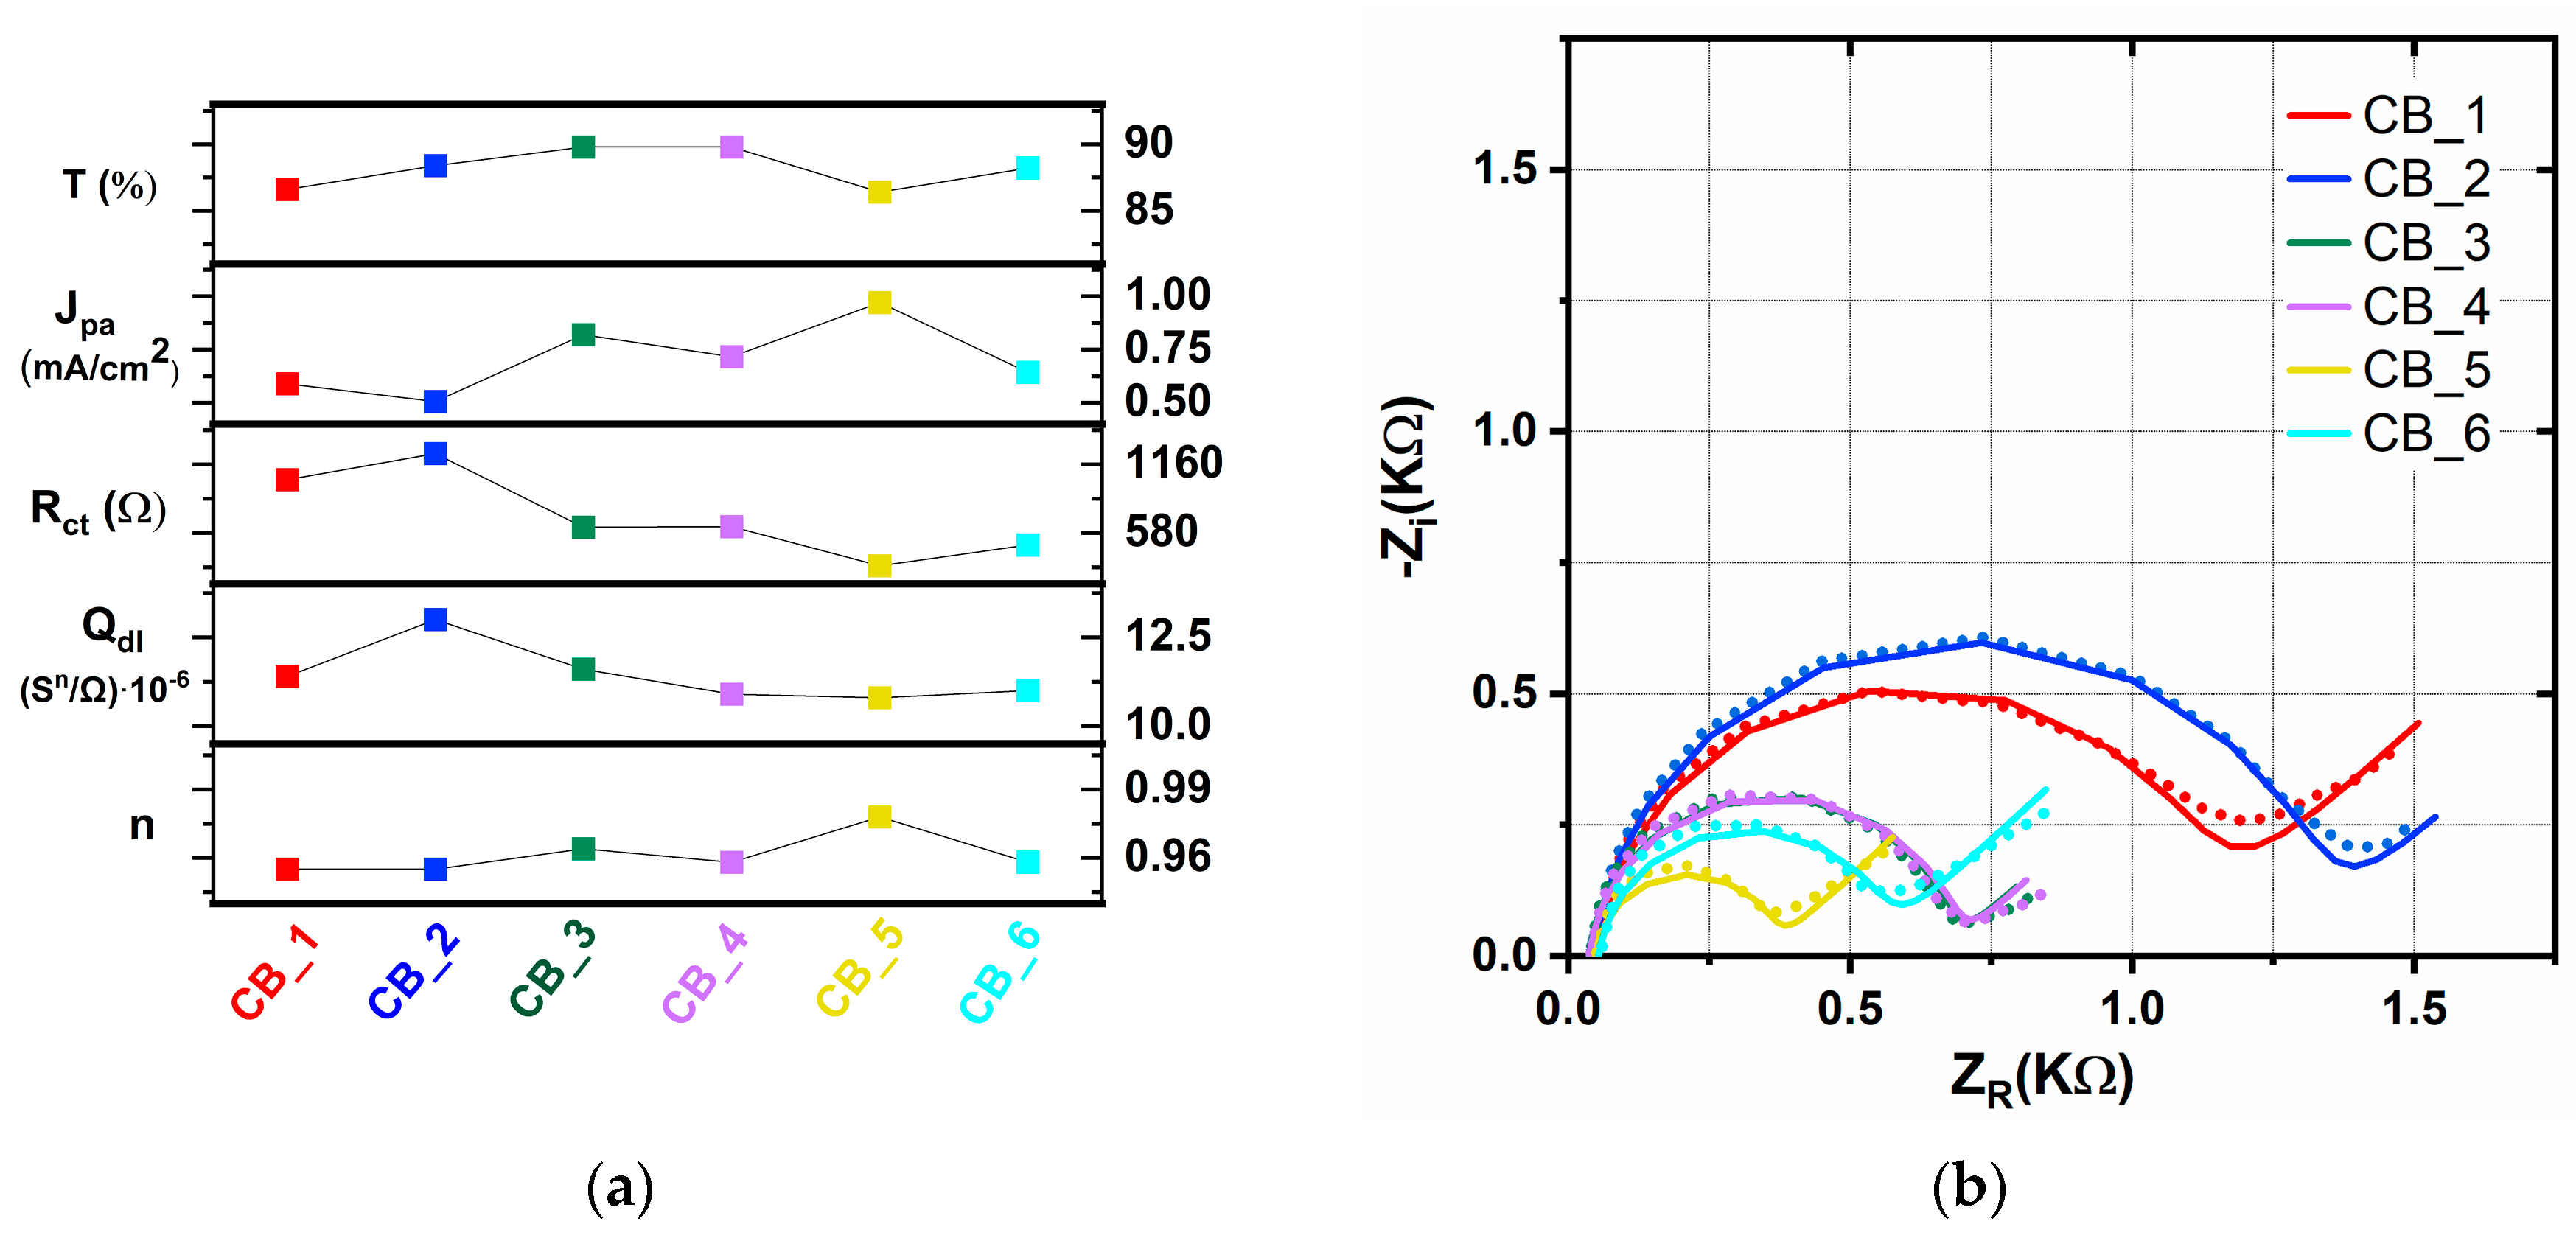
The CV current reduction in non-homogenized samples CB_1 and CB_2 is more significant than for homogenized CB_3 and CB_4 (Figure 13b and Figure 14a). The better blocking nature of non-homogenized samples on the redox reaction is also seen in more significant Rct values obtained from EIS measurements, 1030 Ω and 1250 Ω for CB_1 and CB_2, respectively (Table 4). The measured EIS data (Figure 14b) were fitted using the same equivalent circuit as for previous deposition methods (Figure 4b). Current suppression, i.e., the blocking effect, is more evident for the samples prepared over a longer time of 60 min, regardless of the position or homogenization effect in the chemical bath deposition method. However, vertically placed samples CB_5 and CB_6 generally showed weaker blocking characteristics. The sample CB_5, deposited via the chemical bath method in the vertical position for 30 min, showed the lowest current density reduction in the cyclic voltammogram.
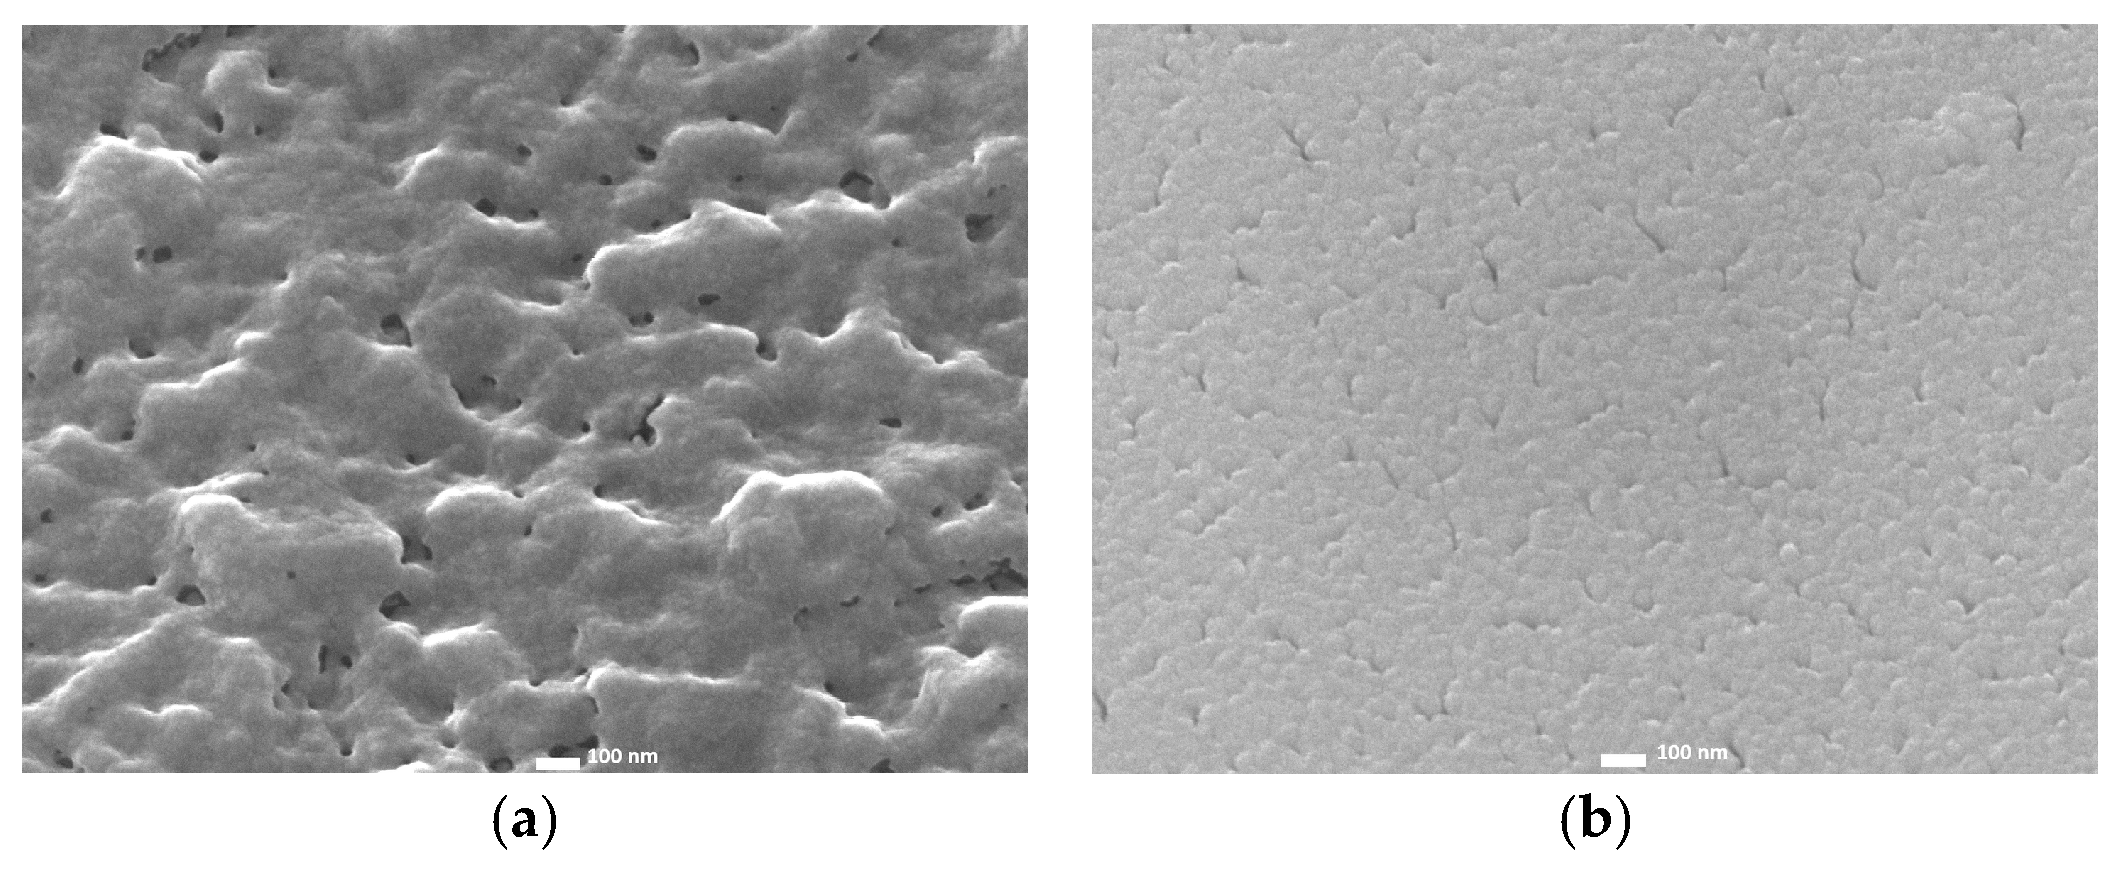
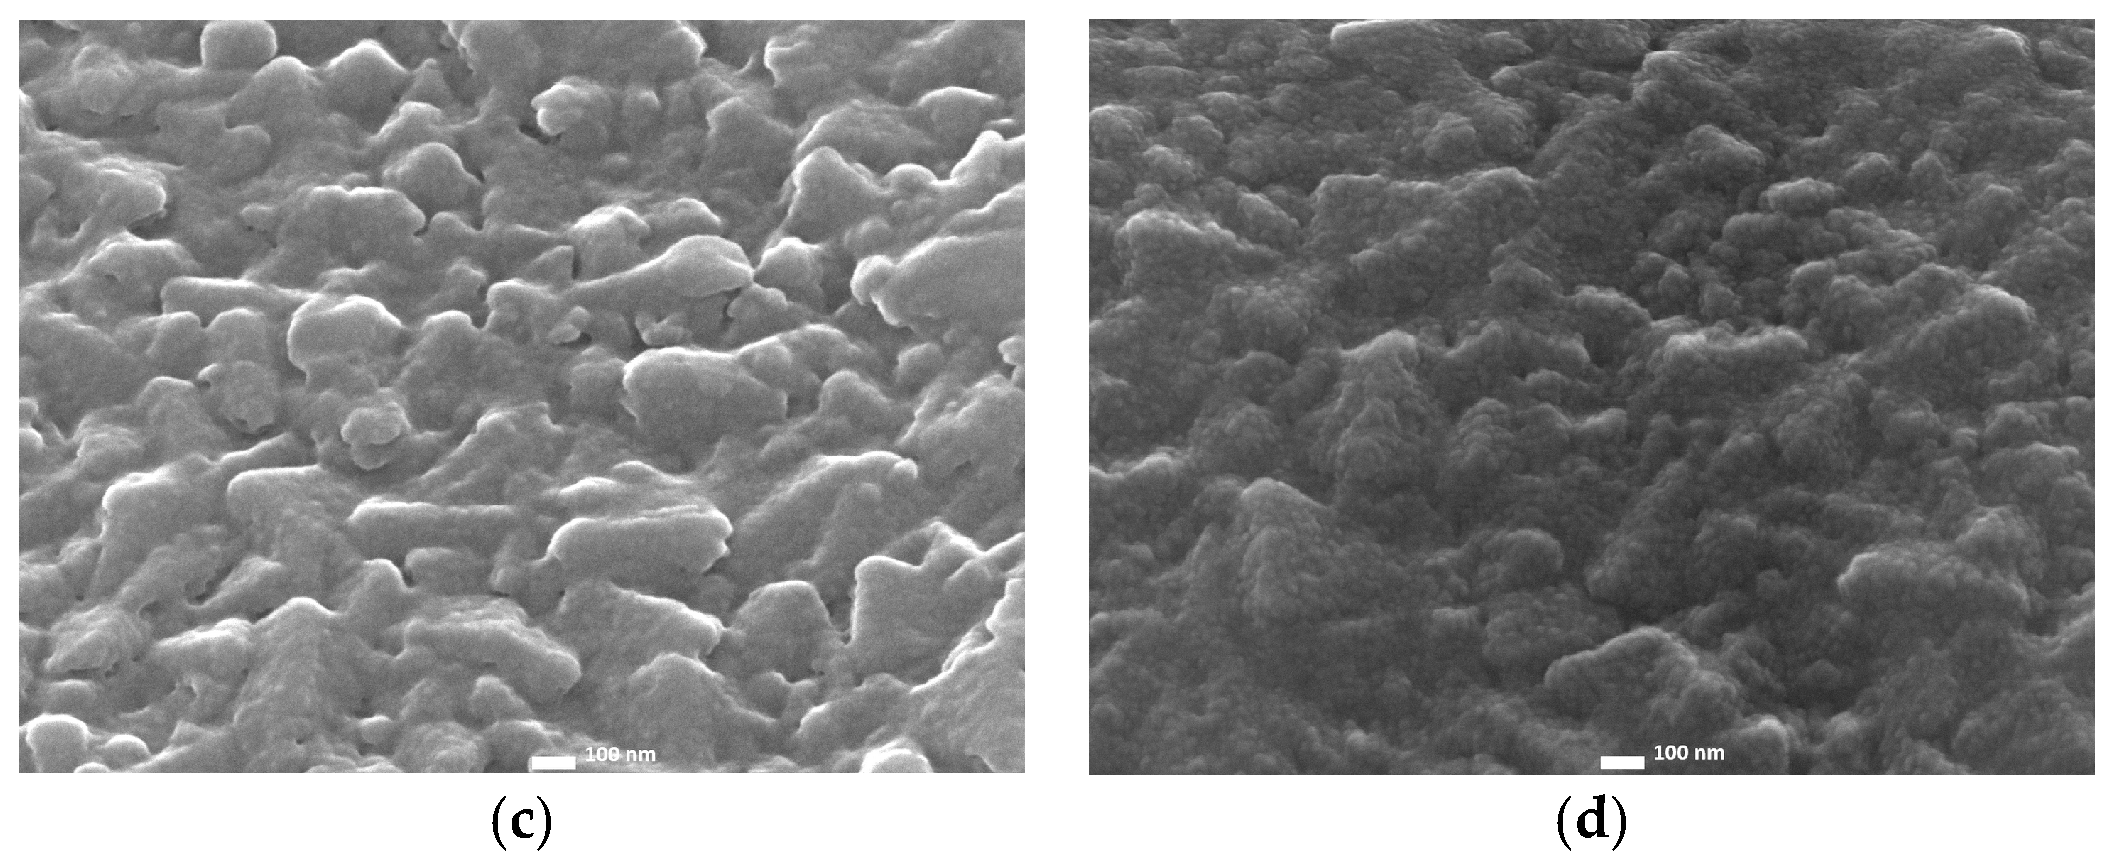
The morphology of the sample CB_5 can be seen in the SEM image in Figure 15d. The TiO2 layer obscures the underlying FTO structures in sample CB_5, with the inhomogeneity of the surface coverage as the probable reason for the weak blocking effect. The EDS analysis of this sample, presented in SI (Table S9a,b), shows inconsistency in the percentage of Ti content, depending on the measurement site, which is the consequence of the vertical placement of the sample. The lower charge transfer resistance (Rct) value (302 Ω) of vertically placed CB_5 film compared to horizontally placed CB_1 (1030 Ω) suggests a more favorable pathway for charge transfer. This could be indicative of cracks appearing in the TiO2 layer of CB_5, potentially even penetrating through the film to the FTO surface. The vertical orientation (samples CB_5 and CB_6) could have facilitated crack propagation, inhibiting the homogenous formation of a compact layer compared to horizontally positioned samples. In contrast, the higher Rct value of CB_1 in comparison to the Rct value of CB_5 suggests that cracks seen in the SEM image of CB_1 (Figure 15a) are located at the surface of the TiO2 layer and most likely limited to pinholes.
The SEM image of sample CB_2 (Figure 15b) shows a further reduction in pinholes within the TiO2 layer, and the highest percentage cover of 96.47% (Table S10) compared to other samples. The TiO2 structures are closely packed, resulting in a dense and compact layer. This observation aligns well with the better blocking behavior observed through the electrochemical analysis of this sample. Similar values of parameters Qdl and n suggest a comparable number of active sites at the TiO2/electrolyte surface in all CB samples. With respect to Rct and Qdl, samples CB_1 and CB_2 have longer electron lifetimes than the other samples (Table 4).
The morphology of the deposited films varies significantly from sample to sample, as can be seen in the SEM images presented in Figure 15. The TiO2 layer of sample CB_1 fully covered FTO structures successfully, with observable small pinholes, unlike the layer of sample CB_3 prepared from a homogenized TiCl4(aq) solution, despite both undergoing a 30-minute water bath treatment. The presence of exposed FTO crystal edges in the SEM image of the homogenized sample CB_3 indicates potential areas of incomplete TiO2 coverage or the presence of a very thin TiO2 layer. However, definitive confirmation could not be established only through the SEM morphology analysis.
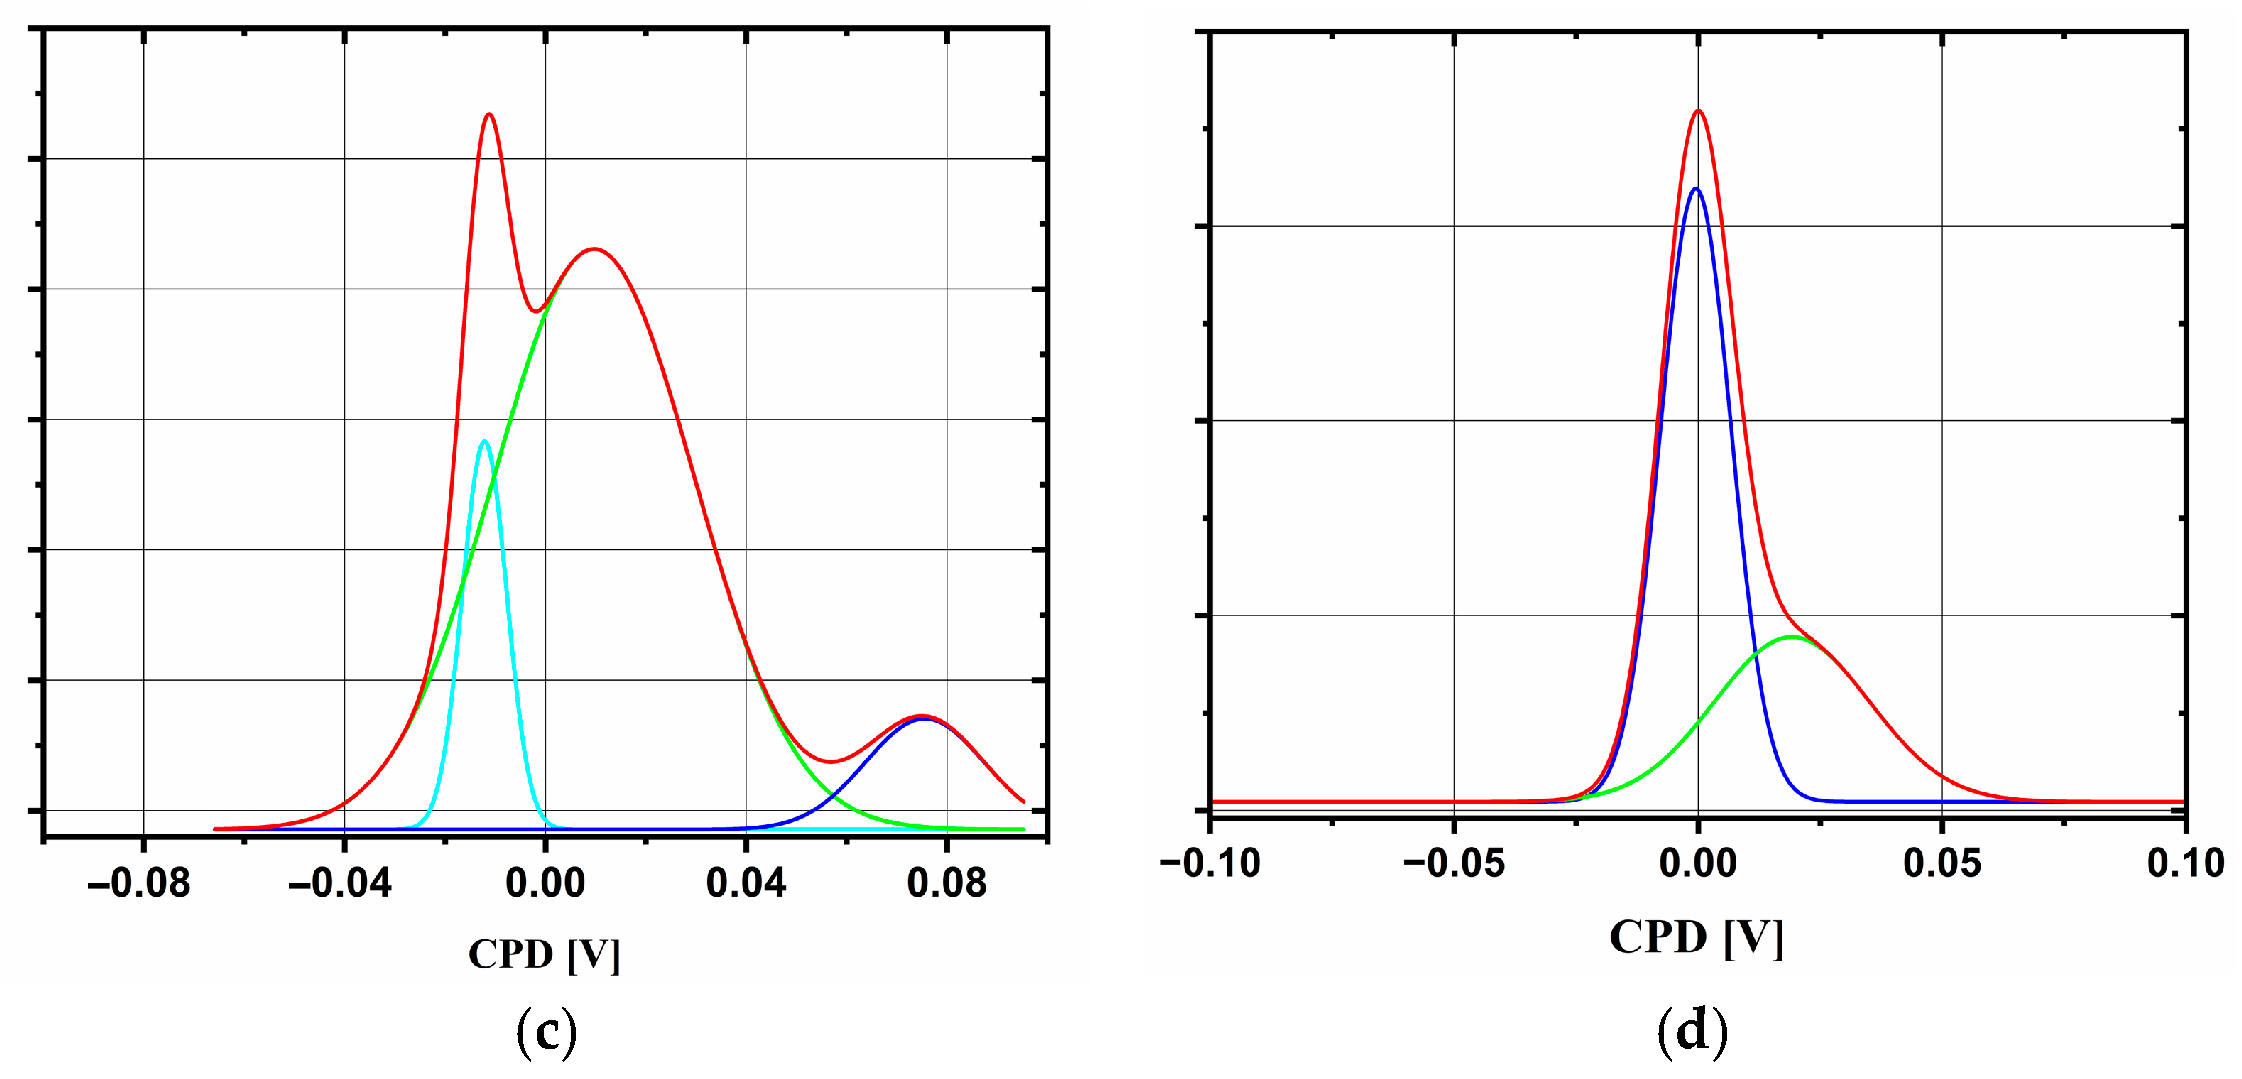
The CPD histogram distributions of chemical bath-deposited samples are presented in Figure 16. KPFM analysis of sample CB_3 revealed a distribution of multiple surface potentials, indicating the presence of distinct surface phases (Figure 16c). This unambiguously suggests incomplete TiO2 coverage, with areas of bare, partially covered FTO, as well as fully covered FTO with TiO2.
Sample CB_6, prepared in a vertical position for 60 min, also showed multiple distributions of surface potentials, which pointed out inefficient coverage. In contrast, samples CB_1 and CB_2, deposited horizontally without homogenization, exhibited single-peak CPD distribution, suggesting uniform and complete TiO2 coverage of the FTO surface. Sample CB_2 proved to be the best choice among the samples deposited via the chemical bath method, due to the highest Rct value, surpassing even that of sample CB_1.
The 3D AFM micrographs of chemical bath-deposited samples (Figure 17), in general, show more rounded spikes compared to the bare FTO (Figure 8a). Surface inhomogeneity of the vertically placed sample CB_5 is also evident in the AFM micrograph. Larger, rounded TiO2 structures of the CB_5 sample were observed compared to the horizontally deposited samples. Stirring of the solution during the deposition of sample CB_3 led to sharper surface structures compared to the samples with the same deposition times, CB_1 and CB_5. Both horizontally placed samples CB_1 and CB_3 have a uniformly distributed TiO2 layer over the FTO substrate, but the layer of CB_1 is smoother. The roughness values of CB_1 are significantly lower compared to the values for CB_3 and CB_5 (Table S9 and Figure S13). These facts lead to the conclusion that in the horizontal chemical bath method, TiO2 particles grow on the complete surface of the FTO, since the FTO substrate is immersed in the precursor solution, and therefore, a more homogenous TiO2 film is obtained.

2.4. Comparison of Three Deposition Methods for the Application in DSSCs

Regarding the blocking effect of TiO2 layers, sputtered anodes exhibited the highest current suppression in cyclic voltammograms with evident irreversible behavior, while spin-coated and chemical bath-deposited samples showed more reversible behavior, suggesting that the redox reaction is more facile on their surface. Sputtered samples also exhibited the highest values of charge transfer resistance (up to 3000 Ω) compared to spin-coated (up to 290 Ω) and chemically deposited (up to 1250 Ω) samples. All samples, regardless of the type of deposition method, have displayed Warburg impedance, indicating that a gradient of electroactive species remains near the double electric layer of the deposited film. However, values of the Warburg parameters of spin-coated samples are of the order of magnitude corresponding to the bare FTO substrate, which indicates their similarity to FTO and insufficient coverage. The strong electrochemical response of sputtered anodes, resulting from full coverage of the FTO, was further confirmed using Kelvin probe force microscopy, with the measured sample SP_24 (200 W, 10 min) showing a uniform surface potential distribution. The chemically deposited samples, which were placed horizontally, CB_1 (30 min) and CB_2 (60 min), also exhibited uniform potential distribution. Furthermore, the electron lifetime of CB_1 follows those values of sputtered samples SP_21 (200 W, 5 min) and SP_24 (200 W, 10 min), while CB_2 has the same value as SP_22 (250 W, 5 min). Conversely, every spin-coated sample displayed multiple distributions of surface potential due to insufficient FTO coverage with the TiO2 layer.
Table 5 summarizes the main characteristics of the best-performing samples (SP_23, SC_33, and CB_2), CV current suppression (expressed in terms of the anodic current density peak Jpa), Rct value, and surface potential distribution (single or bimodal). From KPFM measurements, we have derived the qualitative parameters of CPD distribution, as well as the quantitative values of work function φ (eV). Corresponding CPD histogram distributions for work function evaluation of deposited blocking layers can be found in SI (Figure S15). To avoid the influence of thickness inhomogeneity of the SC_33 (the thickness value of 50 nm was estimated roughly since this sample showed incomplete FTO coverage), the CPD histogram responds to the place on the surface with complete TiO2 coverage. The work function values of SC_33 and CB_2 are the same (4.4 eV), and differ by 0.2 eV from the value of SP_23 and FTO (4.6 eV), which is to be expected considering the different morphologies and layer thicknesses of deposited layers. As discussed in previous sections, the morphology of TiO2 layers deposited via sputtering and the horizontal CBD method follows the morphology of the FTO substrate, with chemical bath-deposited samples showing more rounded TiO2 structures over the FTO substrate in AFM micrographs.
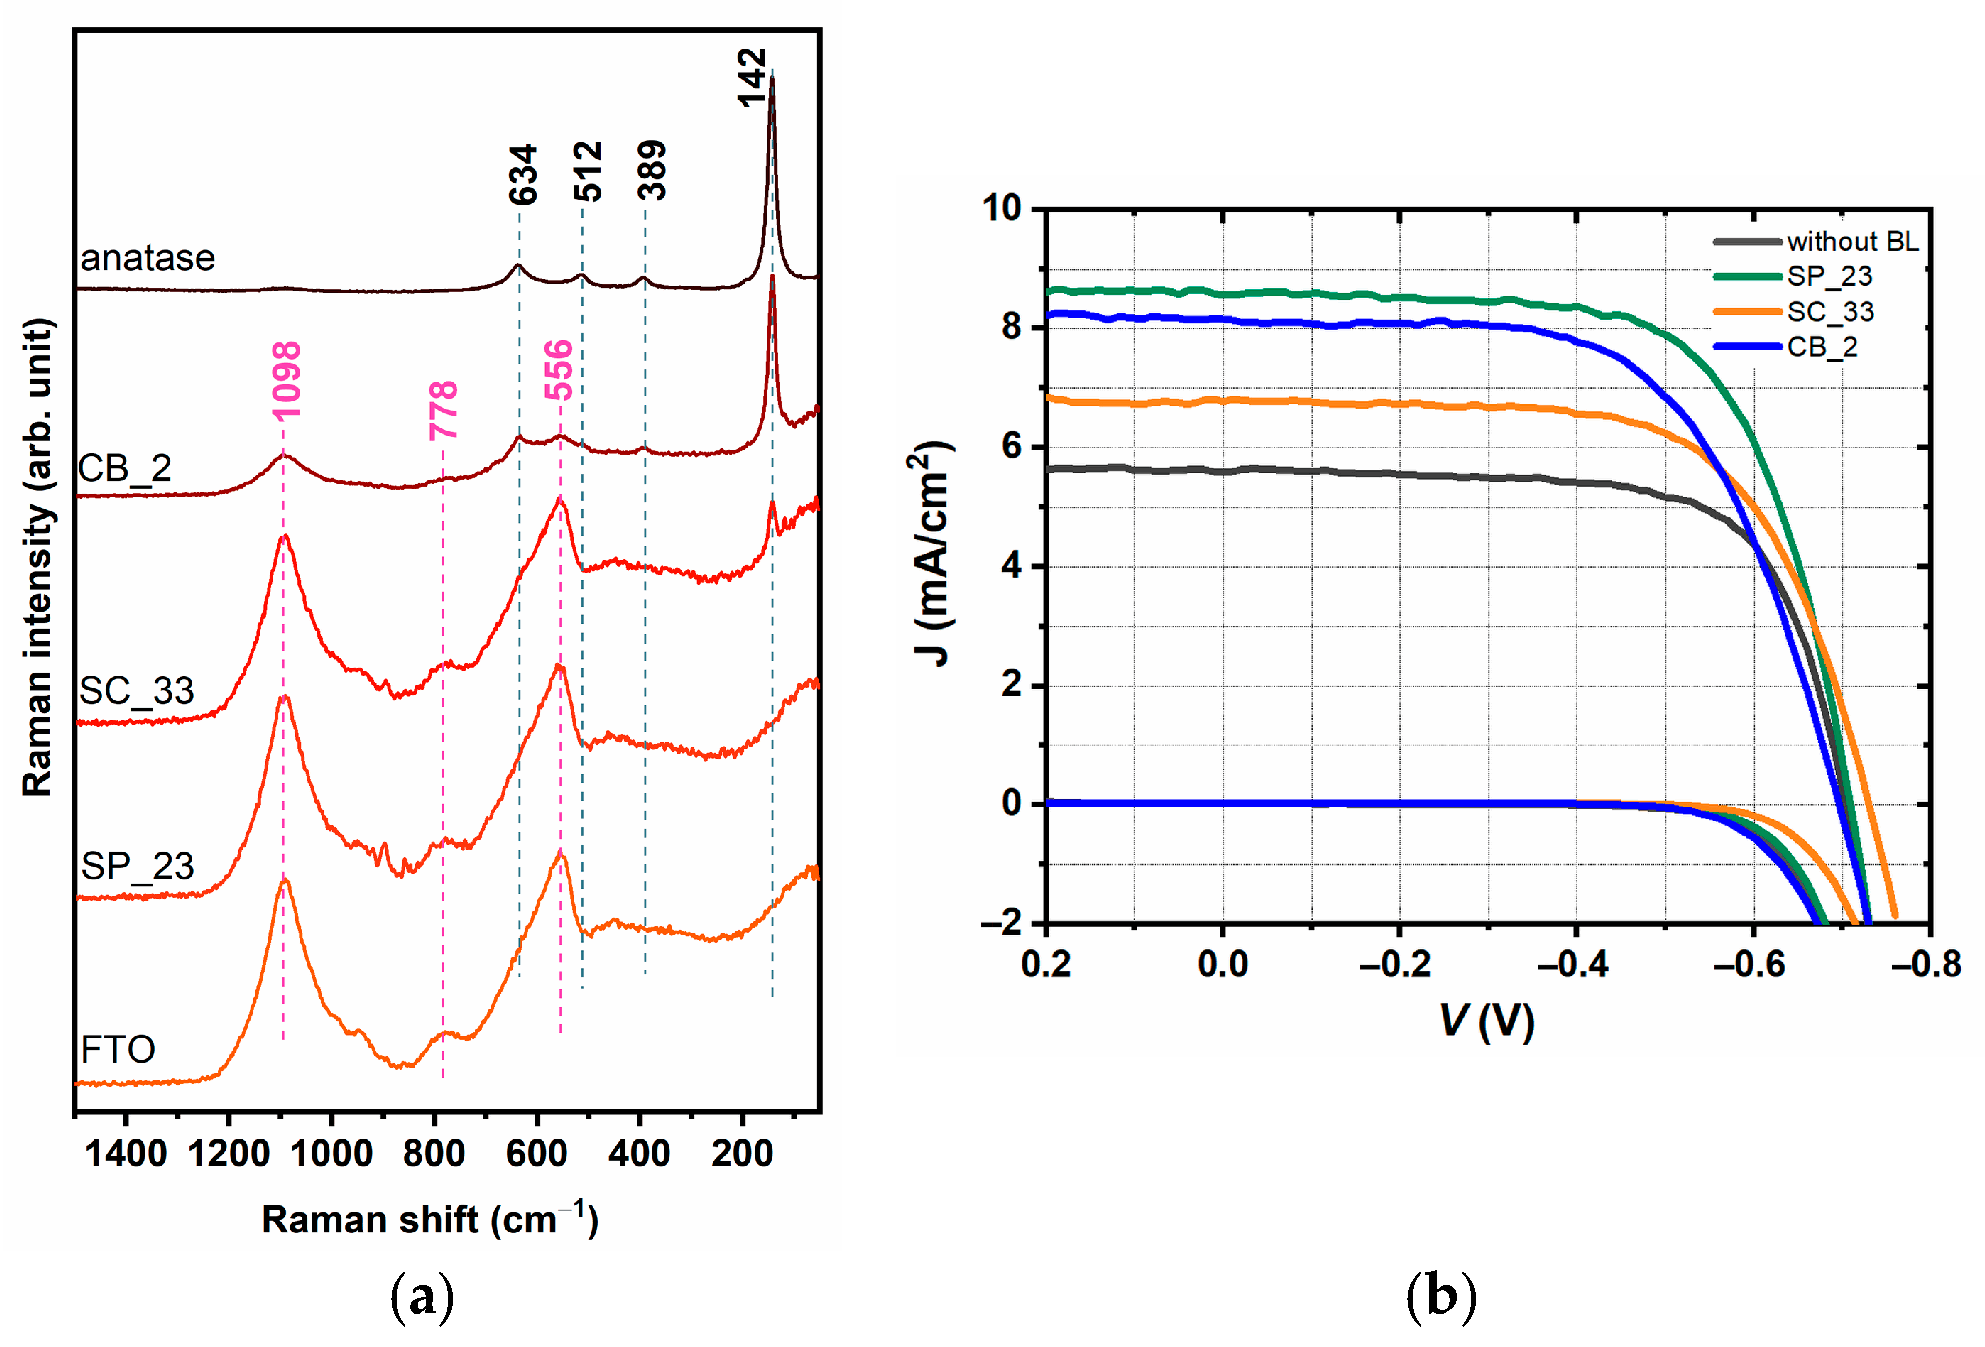
Obtained values of work function are in accordance with values from the literature for the TiO2 anatase phase when measurements are conducted in an ambient atmosphere [60]. The proper alignment of the energy levels during solar cell operation is expected, considering the similarity of work function values to the work function of the bare FTO [61]. As work functions are strongly dependent on the TiO2 crystalline phase [60,62], the Raman spectra of samples are collected and shown in Figure 18a.
In the Raman spectrum of the CB_2 sample, the bands at 556, 778, and 1098 cm−1 originate from the FTO substrate [63], while the observed bands at 142, 389, 512, and 634 cm−1, corresponding to Eg, B1g, A1g + B1g, and Eg modes, confirm the presence of phase-pure anatase TiO2 [64]. The same bands are observed in the Raman spectrum of the SC_33 sample. However, the anatase-related bands are of significantly lower intensity due to the thinner TiO2 layer. In sample SP_23, TiO2 could not be detected in the Raman spectrum due to the layer’s small thickness of 13 nm and the dominant signals of the substrate in the spectral region of interest. It can be assumed that SP_23 possesses an anatase crystal structure, as it was sintered under the same conditions as CB_2 and SC_33 at 500 °C. The anatase phase is the more favorable crystal structure for solar cell applications, given its higher electron mobility, so the temperature was held at values that do not promote phase transitions [65].
To determine the band gap energy (Eg) of blocking layers, we used the Tauc relationship for indirect electron transitions [66]:
α h ν = A h ν E g 2
where α is the absorption coefficient, hv is the photon energy, Eg is the bandgap energy, and A is a constant. Tauc plots of the best-performing blocking layers are shown in Figure S2. Absorption coefficients are calculated from corresponding transmittance spectra. The sputtered blocking layer shows the highest value of band gap, 3.73 eV, while spin-coated and chemical bath-deposited layers show lower values, 3.32 eV and 3.41 eV, respectively (Table 5). Band gap values are higher than the typical values for anatase (around 3.2 eV), which may be attributed to the very small thickness of the deposited films, especially of ultra-thin SP_23. The Eg value of SP_23 concurs with the reported values obtained from Tauc plots for the sputtered TiO2 thin films [67]. This is consistent with the principle that the band gap of thin oxide films is inversely proportional to their thickness [68,69]. The value of the band gap energy of sample SC_33 cannot be considered completely reliable because of the varying TiO2 thickness over the substrate surface, with some bare FTO areas.
Blocking layers with the best characteristics, discussed above, were used for the fabrication of DSSCs. Figure 18b) shows J-V curves of DSSCs with differently deposited blocking layers. Corresponding photovoltaic parameters (short-circuit current density—Jsc, open-circuit voltage—Voc, fill factor—FF, and the power conversion efficiency—η) obtained from J-V curves are presented in Table 6.
As a result of the deposited blocking layers, all DSSCs have better power conversion efficiencies, η, in comparison to the cell fabricated without a blocking layer. The higher Jsc values observed in cells with a blocking layer, compared to the cells without one, directly contributed to their higher η values due to improved electron collection efficiency on the photoanodes. The DSSC with a sputtered layer (SP_23) exhibits the best characteristics, showing a 35% improvement in Jsc and a 31.5% improvement in η compared to the values of the DSSC without a deposited TiO2 layer. Cells with the spin-coated blocking layer (SC_33) and chemical bath-deposited layer (CB_2) also show improvement in current and power conversion efficiency, but at a smaller percentage than SP_23. Jsc values of the CB_2 and SC_33 cells were higher by 31.4% and 17.7%, with the corresponding η values increased by 20.1% and 14.4%, respectively, in comparison to the reference cell without the blocking layer. The results of photoelectrochemical characterization of fabricated DSSCs are consistent with the previous results of electrochemical and KPFM characterization of individual blocking layers, where the SP_23 layer exhibited the best blocking properties with the highest Rct value, the lowest Jpa value (Table 5), and a single CPD distribution.

3. Materials and Methods

3.1. Reagents and Chemicals

FTO glass with a surface resistivity of 7 Ω/sq was purchased from Solaronix (Aubonne, Switzerland), and microscopic glass from Thermo Fisher Scientific (Waltham, MA, USA). The organic solvents acetone (>99.5%), isopropanol (>99.5%), ethanol (>99.5%), acetonitrile (>99.5%), and chloroplatinic acid (H2PtCl6∙6H2O) were acquired from Merck (Darmstadt, Germany). Potassium ferricyanide (K3[Fe(CN)6]), potassium ferrocyanide (K4[Fe(CN)6]), lithium iodide (LiI), and 4-tert-butylpyridine (TBP) were also purchased from Merck, while potassium chloride (KCl) and iodine (I2) were from Alkalioid (Skopje, North Macedonia). Precursor titanium tetrachloride (TiCl4) was received from ACROS Organics (Illkirch-Graffenstaden, France). TiO2 nanopowder Degussa p25, used for the preparation of screen-printing paste, was acquired from Merck, along with terpineol and ethyl cellulose of two different viscosities (10 cP and 46 cP). Photosensitizer ruthenizer 535-bisTBA (N719) and thermoplastic melting foil (Meltonix, thickness = 25 μm) are from Solaronix. All chemicals were used without further purification.

3.2. Preparation of TiO2 Blocking Layers

The dimensions of the FTO and microscopic glass surfaces were 1∙2 cm2 and 1.5∙1.5 cm2, respectively. The cleaning procedure of glass before each method of deposition consisted of ultrasonication in a detergent for 15 min, followed by rinsing in deionized water, ultrasonication in acetone for 2 min, and finally, ultrasonication in isopropanol for 2 min. The samples were dried with N2 after each ultrasonication step of the cleaning procedure. Finally, substrates were rinsed with ethanol and dried with N2.
Sputtered films on glass were obtained by adjusting the sputtering power and deposition time using a pure (3N) TiO2 target (Bodenseewerk Perkin-Elmer & Co, Überlingen, Germany) within the RF sputter system (Perkin-Elmer 2400, Waltham, MA, USA). Two series of samples were deposited using this method. The sputtering for the first series of samples (SP_11-16) was performed with power levels set to 250 W, 350 W, and 450 W and deposition times of 15 and 30 min. For the next series of samples (SP_21-24), power levels were reduced to 200 W, 250 W, and 300 W, while the time duration was shortened to 5 and 10 min. The sample labels and their corresponding deposition conditions are presented in Table 1.
Due to the high reactivity of TiCl4 with air moisture, liquid TiCl4 was transferred to a glass bottle with DI water through the parafilm by syringe. The glass bottle placed on the magnetic stirrer was cooled to approximately 0 °C before injecting the precursor to inhibit the immediate formation of TiO2 particles at room temperature. Different concentrations of TiCl4 aqueous solutions, 40 mM, 120 mM, and 240 mM, have been prepared before spin-coating deposition. In preparation for coating, solutions were placed on the hot plate at 70 °C during different time intervals to facilitate the formation of TiO2 particles through the hydrolysis of TiCl4. All samples were spin-coated in a single step for 30 s with a rotation speed of 3000 rpm and an acceleration of 1000 rpm/s [70]. The difference between spin-coated samples (SC_11-33) originated solely from concentrations and pre-heating conditions of TiCl4 solutions, as shown in Table 1.
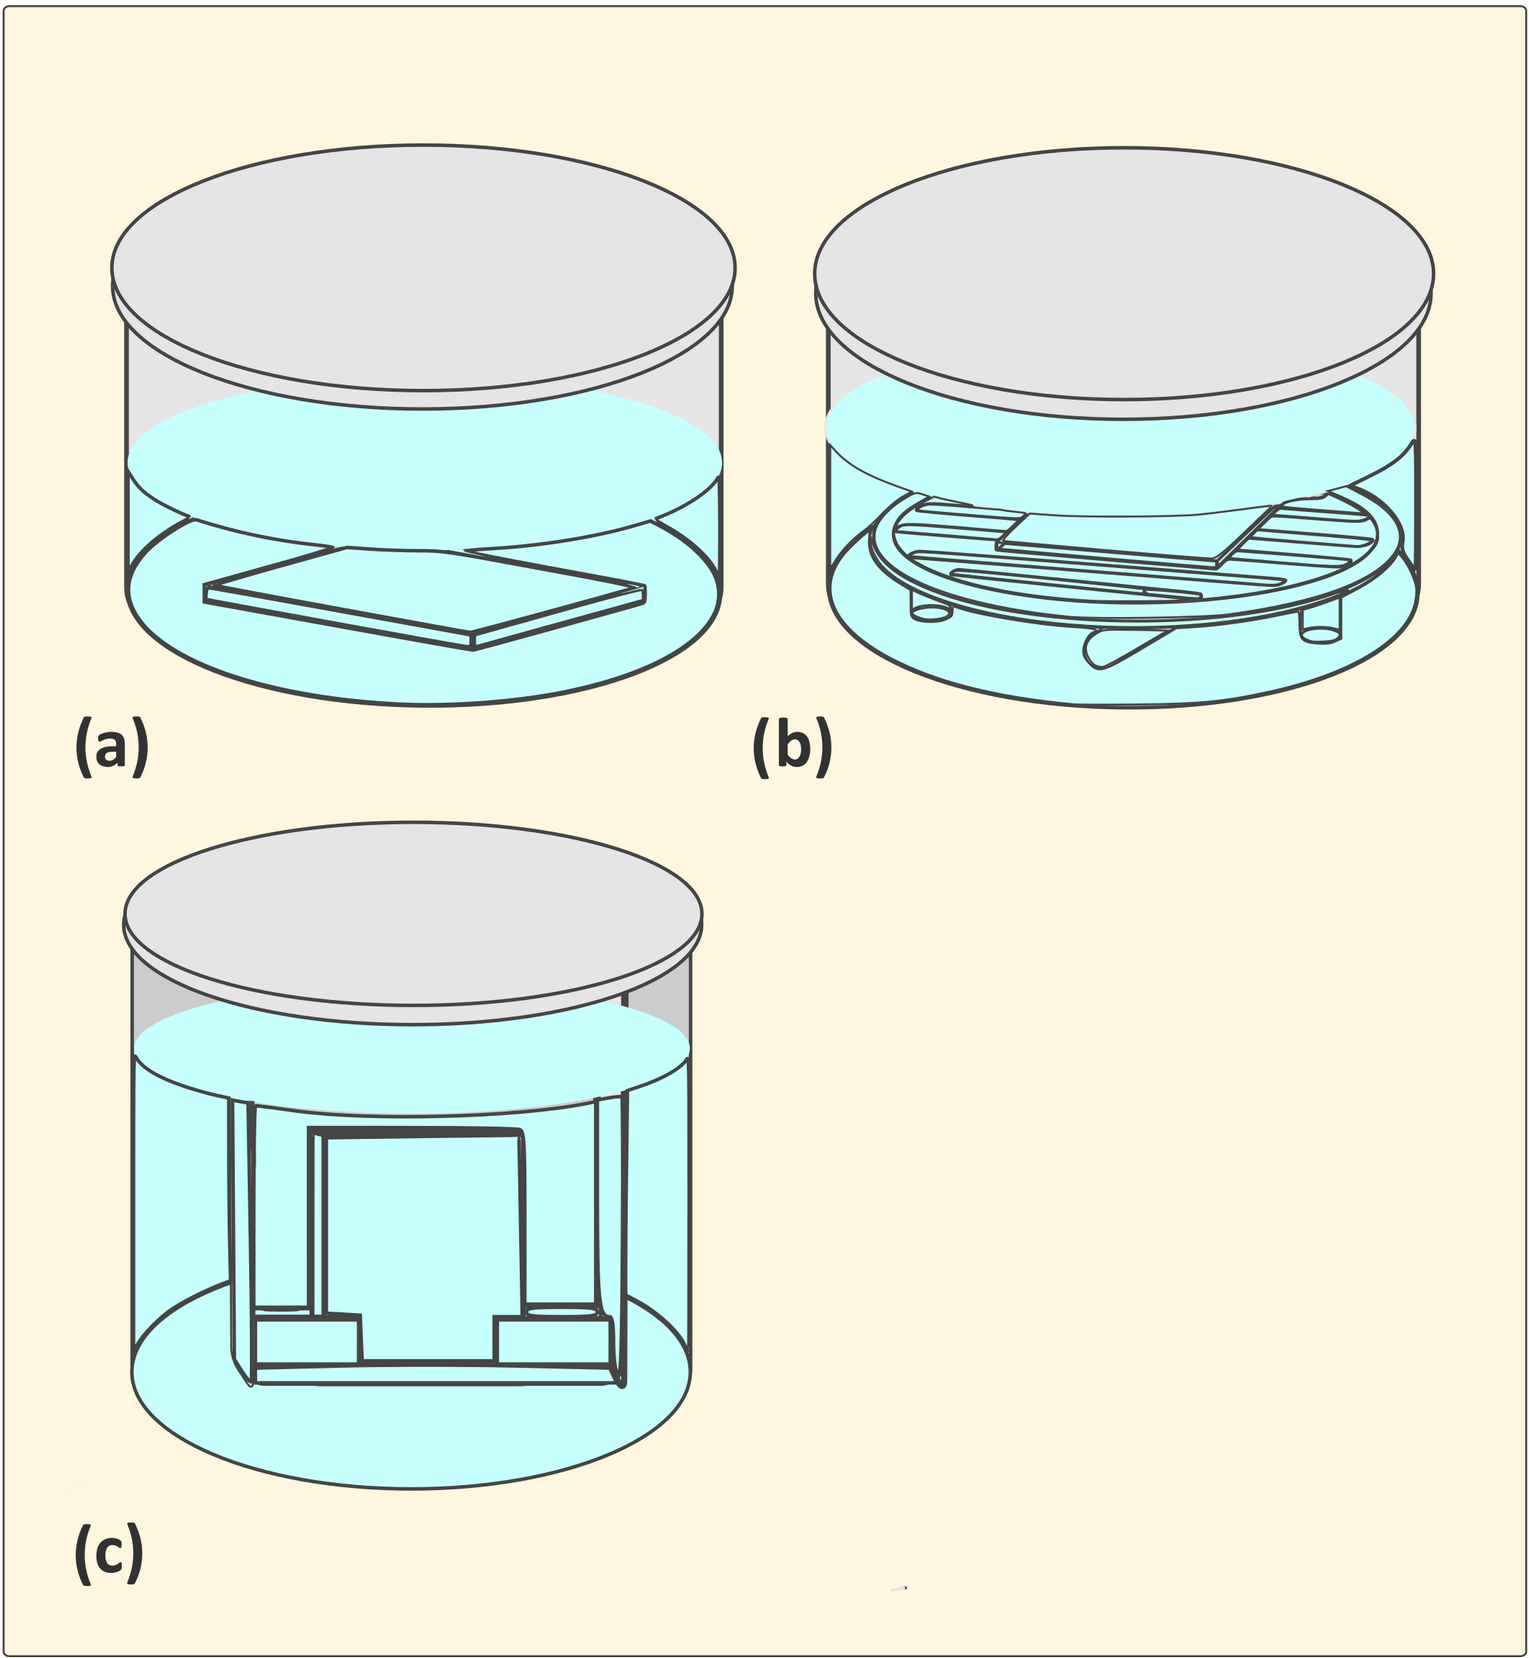
The chemical bath deposition method utilized the same precursor as spin-coating, titanium tetrachloride; however, the concentration of all prepared precursor solutions was 40 mM, which is the standard concentration for the TiO2 blocking layer deposition by the CBD method [23,29]. Substrates were immersed in solutions at 70 °C for varying time periods in the chemical bath. Samples were placed in different orientations, horizontally and vertically, while the homogenization was achieved using a magnetic stirrer. The vertically positioned samples were prepared without homogenization. Figure 19 illustrates the tested sample positions in the solutions. Six TiO2 layers were deposited using the bath-coating method, CB_1-6 (Table 1).
After each type of deposition, samples underwent sintering on the hot plate under identical conditions: 10 min at 120 °C and 30 min at 500 °C.

3.3. Preparation of DSSCs

Solar cells were prepared by sandwiching the TiO2 photoanodes (with various types of deposited blocking layers) and Pt counter electrodes using the hot-melting foil. After preparation of the blocking layers on FTO substrates, TiO2 mesoporous films were screen-printed on them from a paste prepared according to the recipe established by Ito and colleagues [71]. Three TiO2 layers were screen-printed to obtain a thickness of about 12 μm, while the surface of the active area was 0.28 cm2. The mesoporous layers were sintered at 550 °C for 1 h to eliminate the organic binder. The substrates then underwent a post-treatment, which involved immersing the mesoporous films in a 40 mM aqueous TiCl4 solution for 30 min at 70 °C, followed by an additional sintering step at 500 °C for 1 h. Prepared TiO2 anodes were immersed in a 0.5 mM solution of N719 dye in ethanol for 16 h. To eliminate any excess of dye molecules, the sensitized photoanodes were rinsed with ethanol. Counter electrodes for the DSSCs were prepared by drop-casting a 5 mM solution of chloroplatinic acid in ethanol onto an FTO substrate and subsequently annealing at 400 °C for 1 h. The redox electrolyte consisted of 0.05 M I2, 0.5 M LiI, and 0.5 M TBP in acetonitrile. The cells were filled with electrolyte solution through predrilled holes in the counter electrode and sealed using hot-melting foil and a coverslip glass.

3.4. Characterization and Analysis

Optical transmittance measurements covering wavelengths ranging from 250 to 1000 nm have been carried out using a UV-VIS spectrophotometer, Evolution 60—Thermo Scientific (Waltham, MA, USA). For optical characterization, thin films were deposited on microscope slides to minimize the influence of scattering effects from rough FTO substrates. We assumed that the decrease in microscope slide transparency due to the deposited TiO2 layer is approximately equivalent to the decrease in transparency of FTO glass covered with the same thickness of TiO2. Considering that FTO glass (Solaronix) has a transmittance of approximately 80% in the visible wavelength range [32], the presence of deposited blocking layers should not significantly decrease the transparency of microscopic glass.
Electrochemical characterization of samples included two methods, CV and EIS. Electrochemical measurements were conducted using the Ivium Vertex potentiostat (Eindhoven, The Netherlands) in a three-electrode setup, where TiO2 layers on FTO act as a working electrode and a platinum mesh and Ag/AgCl electrodes act as counter and reference electrodes, respectively. The electrolyte used was a 0.1 M KCl water solution containing 0.5 mM K3[Fe(CN)6] and 0.5 mM K4[Fe(CN)6]. Before each measurement, the system was purged with N2 gas to remove dissolved oxygen and other gases that can influence the redox potential of observed redox species. Cyclic voltammograms were acquired within a potential range from −0.1 to 1 V, with a scan rate of 50 mV/s and an equilibrium time of 60 s before measurement. Impedance measurements were conducted by applying an AC potential of 10 mV amplitude with a DC offset of the corresponding open-circuit voltage (0.220 V) to the electrochemical system in a frequency range of 0.1–10.000 Hz. The obtained EIS curves were fitted using IviumSoft software. The Ivium Vertex potentiostat was also used for the photoelectrochemical characterization of fabricated DSSCs. Current-voltage (J-V) curves were recorded using linear sweep voltammetry with a scan rate of 50 mV/s, while illuminating the DSSCs with a solar simulator (Abet Technologies, Milford, CT, USA) of incident power, Pin, of 100 mW/cm2.
The surface morphology of TiO2 layers was evaluated using a scanning electron microscope (SEM), JEOL JSM-7001F (Tokio, Japan), and by AFM with the NT-MTD Ntegra microscope Smena A model 5 (Moscow, Russia), operating in tapping mode. Fiji software, version 2.17.0 was used for consideration of FTO substrate coverage (%) with TiO2 films [72]. The same microscope as for atomic force microscopy (AFM) was used for Kelvin probe force microscopy (KPFM) measurements. Prior to KPFM measurements, all samples were placed in a vacuum chamber at a pressure of 50 mTorr and a temperature of 50 °C for 30 min. The measurements were performed under ambient conditions (40% relative humidity, 25 °C). The tip work function was calibrated by measuring freshly cleaved highly oriented pyrolytic graphite (HOPG, ZYH grade, NT-MDT, Wf = ((4.5 ± 0.2) eV). KPFM measurements were employed to identify variations in the distribution of the surface potential. The presence of a single, uniform surface potential in certain samples indicates complete FTO coverage with TiO2. Conversely, samples exhibiting multiple surface potential values suggest incomplete coverage, likely with areas of bare FTO or partially covered regions. The Raman spectra of the samples were recorded using a DXR Raman microscope (Thermo Scientific, Waltham, MA, USA) equipped with a diode-pumped solid-state laser (λ exc = 532 nm). Measurements were carried out with a laser power of 8.0 mW on the sample, an exposure time of 10 s, and 10 accumulations per spectrum. A grating with 900 lines/mm and a 50 μm spectrograph pinhole aperture was employed. The thickness of the blocking layers was determined using a Rank Taylor Hobson Ltd. profilometer (Leicester, UK).

4. Conclusions

This study has successfully examined TiO2 thin films fabricated via RF sputtering, spin-coating, and chemical bath deposition (CBD) as blocking layers for oxide semiconductor-based solar cells, particularly for dye-sensitized solar cells. We investigated the influence of TiO2 layers deposited via different methods on the main properties of blocking layers utilized in solar cells. Through a combination of optical transmittance measurements, cyclic voltammetry, electrochemical impedance spectroscopy, and Kelvin probe force microscopy, we identified key factors influencing the properties of the blocking layers. A special contribution of KPFM measurements in the final analysis of the TiO2 blocking layers was emphasized. Based on CPD histograms having a multiphase distribution of surface potentials, it is concluded that coverage of FTO with spin-coated and vertical CBD layers is incomplete, resulting in weak electrochemical properties of blocking layers. RF sputtering deposition led to significantly higher charge transfer resistance (SP_23), with a single distribution of surface potential. Samples CB_1 and CB_2 (deposited via the chemical bath method in a horizontal position) demonstrated reduced charge transfer resistance in comparison to SP_23, but with adequate Rct values for effective FTO coverage, also with a single-phase distribution of potential in the CPD histogram. Along with high Rct values, these samples (SP_23, CB_1, and CB_2) showed improved electron lifetimes, making them strong candidates for solar cell applications. The best blocking layers within each method, when considering their electrochemical characteristics, are SP_23, SC_33, and CB_2. They are characterized by wide band gap energies and work functions similar to the bare FTO; hence, the favorable alignment of energy levels in the solar cell is expected. Finally, we have demonstrated the correlation between the observed morphological and electrochemical properties of the TiO2 blocking layers and the performance of the fabricated DSSCs. DSSCs fabricated with the best-performing blocking layers (SP_23, SC_33, and CB_2) showed significantly improved values of short-circuit current and power conversion efficiency compared to the reference cell without a blocking layer. The DSSC with the SP_23 blocking layer shows the best photovoltaic characteristics, followed by the cell prepared with CB_2, and lastly the cell with the SC_33 blocking layer. Establishing this relation, our approach enables an estimation of optimal blocking layers prior to full device fabrication, providing a faster, more resource-efficient pathway for solar cell development.

Supplementary Materials

The following supporting information can be downloaded at https://www.mdpi.com/article/10.3390/inorganics13080270/s1, Figure S1: Transmittance spectra of the first sputtered series SP_11-16; Figure S2: Tauc plots of the TiO2 deposited blocking layers SP_23 (a), SC_33 (b), and CB_2 (c) on the microscopic glass substrates; Figure S3: Bode impedance magnitude (a) and phase (b) diagrams of the second series of sputtered samples SP_21-26. Dotted lines represent experimental data, while the solid lines represent data obtained by fitting using an equivalent circuit presented in Figure 5b; Figure S4: Bode impedance magnitude (a) and phase (b) diagrams of the spin-coated samples SC_11-23 and SC_33. Dotted lines represent experimental data, while the solid lines represent data obtained by fitting using an equivalent circuit presented in Figure 5b; Figure S5: Bode impedance magnitude (a) and phase (b) diagrams of the chemical bath-deposited samples CB_1-6. Dotted lines represent experimental data, while the solid lines represent data obtained by fitting using an equivalent circuit presented in Figure 5b; Figure S6: EDS analysis of sample SP_21; Figure S7: EDS analysis of sample SP_22; Figure S8: EDS analysis of sample SP_24; Figure S9: EDS analysis of sample CB_1; Figure S10: EDS analysis of sample CB_2; Figure S11: EDS analysis of sample CB_3; Figure S12: The average roughness curves for bare FTO (a), and SP_21 sample (b) obtained with AFM; Figure S13: The average roughness curves for SC_11 (a), and SC_33 (b) samples obtained with AFM; Figure S14: The average roughness curves for CB_1 (a), CB_3 (b), and CB_5 (c) samples obtained with AFM; Figure S15. The CPD histogram distributions used for the evaluation of work functions of FTO (a), SP_23 (b), SC_33 (c), and CB_2 (d) samples; Table S1: Values of UV-VIS transmittance spectra at 535 nm; Table S2: Optical absorption edge of TiO2 films estimated from transmittance spectra; Table S3: Elemental percentage analysis of the sample SP_21; Table S4: Elemental percentage analysis of the sample SP_22; Table S5: Elemental percentage analysis of the sample SP_24; Table S6: Elemental percentage analysis of the sample CB_1; Table S7: Elemental percentage analysis of the sample CB_2; Table S8: Elemental percentage analysis of the sample CB_3; Table S9a: Elemental percentage analysis of the sample CB_5 in site 1; Table S9b: Elemental percentage analysis of the sample CB_5 in site 2; Table S10: Images obtained from SEM micrographs by using Fiji software, for determination of the FTO coverage (%) with TiO2 films; Black points correspond to uncovered areas of the FTO substrate; Table S11: Roughness values of the samples presented as average (Ra) and root mean square (RMS) roughness.

Author Contributions

Conceptualization, E.M., K.C. and M.V.B.; investigation, E.M., K.C., M.V.B., N.C. and V.J.; resources, D.V.-R.; writing—original draft preparation, E.M.; writing—review and editing, K.C. and D.S.; supervision, K.C. and D.S. All authors have read and agreed to the published version of the manuscript.

Funding

This work was funded by the Ministry of Science, Technological Development, and Innovation of the Republic of Serbia (grant number 451-03-136/2025-03/200026). The study contributes to UN Sustainable Goal 7 for affordable and clean energy within the 2030 Agenda for Sustainable Development.

Institutional Review Board Statement

Not applicable.

Informed Consent Statement

Not applicable.

Data Availability Statement

All data are contained within this article and the Supplementary Information File. The raw data of this study are available upon request from the corresponding author.

Acknowledgments

We thank Danica Bajuk-Bogdanović for her scientific assistance (Raman spectra acquisition) from the Faculty of Physical Chemistry, University of Belgrade, and her project: the Ministry of Science, Technological Development, and Innovation of the Republic of Serbia (grant number 451-03-136/2025-03/200146).

Conflicts of Interest

The authors declare no conflicts of interest.

References

  1. Wu, Y.; Li, C.; Tian, Z.; Sun, J. Solar-Driven Integrated Energy Systems: State of the Art and Challenges. J. Power Sources 2020, 478, 228762. [Google Scholar] [CrossRef]
  2. Green, M.A. Third Generation Photovoltaics: Solar Cells for 2020 and Beyond. Phys. E Low Dimens. Syst. Nanostruct. 2002, 14, 65–70. [Google Scholar] [CrossRef]
  3. Badawy, W.A. A Review on Solar Cells from Si-Single Crystals to Porous Materials and Quantum Dots. J. Adv. Res. 2015, 6, 123–132. [Google Scholar] [CrossRef]
  4. Sharma, S.; Jain, K.K.; Sharma, A. Solar Cells: In Research and Applications—A Review. MSA 2015, 6, 1145–1155. [Google Scholar] [CrossRef]
  5. Shah, N.; Shah, A.A.; Leung, P.K.; Khan, S.; Sun, K.; Zhu, X.; Liao, Q. A Review of Third Generation Solar Cells. Processes 2023, 11, 1852. [Google Scholar] [CrossRef]
  6. Zhang, D.; Stojanovic, M.; Ren, Y.; Cao, Y.; Eickemeyer, F.T.; Socie, E.; Vlachopoulos, N.; Moser, J.-E.; Zakeeruddin, S.M.; Hagfeldt, A.; et al. A Molecular Photosensitizer Achieves a Voc of 1.24 V Enabling Highly Efficient and Stable Dye-Sensitized Solar Cells with Copper(II/I)-Based Electrolyte. Nat. Commun. 2021, 12, 1777. [Google Scholar] [CrossRef]
  7. Freitag, M.; Teuscher, J.; Saygili, Y.; Zhang, X.; Giordano, F.; Liska, P.; Hua, J.; Zakeeruddin, S.M.; Moser, J.-E.; Grätzel, M.; et al. Dye-Sensitized Solar Cells for Efficient Power Generation under Ambient Lighting. Nat. Photon. 2017, 11, 372–378. [Google Scholar] [CrossRef]
  8. Hagfeldt, A.; Boschloo, G.; Sun, L.; Kloo, L.; Pettersson, H. Dye-Sensitized Solar Cells. Chem. Rev. 2010, 110, 6595–6663. [Google Scholar] [CrossRef]
  9. Omar, A.; Ali, M.S.; Abd Rahim, N. Electron Transport Properties Analysis of Titanium Dioxide Dye-Sensitized Solar Cells (TiO2-DSSCs) Based Natural Dyes Using Electrochemical Impedance Spectroscopy Concept: A Review. Sol. Energy 2020, 207, 1088–1121. [Google Scholar] [CrossRef]
  10. Toyoda, T.; Shen, Q. Quantum-Dot-Sensitized Solar Cells: Effect of Nanostructured TiO2 Morphologies on Photovoltaic Properties. J. Phys. Chem. Lett. 2012, 3, 1885–1893. [Google Scholar] [CrossRef] [PubMed]
  11. Feng, H.-L.; Wu, W.-Q.; Rao, H.-S.; Wan, Q.; Li, L.-B.; Kuang, D.-B.; Su, C.-Y. Three-Dimensional TiO2/ZnO Hybrid Array as a Heterostructured Anode for Efficient Quantum-Dot-Sensitized Solar Cells. ACS Appl. Mater. Interfaces 2015, 7, 5199–5205. [Google Scholar] [CrossRef]
  12. Yao, D.; Hu, Z.; Zheng, L.; Chen, S.; Lü, W.; Xu, H. Laser-Engineered Black Rutile TiO2 Photoanode for CdS/CdSe-Sensitized Quantum Dot Solar Cells with a Significant Power Conversion Efficiency of 9.1%. Appl. Surf. Sci. 2023, 608, 155230. [Google Scholar] [CrossRef]
  13. Schmidt-Mende, L.; Kraner, S.; Fakharuddin, A. Organic and Hybrid Solar Cells, 2nd ed.; De Gruyter: Berlin, Germany, 2022. [Google Scholar]
  14. Yodyingyong, S.; Zhou, X.; Zhang, Q.; Triampo, D.; Xi, J.; Park, K.; Limketkai, B.; Cao, G. Enhanced Photovoltaic Performance of Nanostructured Hybrid Solar Cell Using Highly Oriented TiO2 Nanotubes. J. Phys. Chem. C 2010, 114, 21851–21855. [Google Scholar] [CrossRef]
  15. Lee, J.; Jho, J.Y. Fabrication of Highly Ordered and Vertically Oriented TiO2 Nanotube Arrays for Ordered Heterojunction Polymer/Inorganic Hybrid Solar Cell. Sol. Energy Mater. Sol. Cells 2011, 95, 3152–3156. [Google Scholar] [CrossRef]
  16. Hu, W.; Yang, S.; Yang, S. Surface Modification of TiO2 for Perovskite Solar Cells. Trends Chem. 2020, 2, 148–162. [Google Scholar] [CrossRef]
  17. Ke, W.; Fang, G.; Wang, J.; Qin, P.; Tao, H.; Lei, H.; Liu, Q.; Dai, X.; Zhao, X. Perovskite Solar Cell with an Efficient TiO2 Compact Film. ACS Appl. Mater. Interfaces 2014, 6, 15959–15965. [Google Scholar] [CrossRef] [PubMed]
  18. Tavakoli, M.M.; Yadav, P.; Tavakoli, R.; Kong, J. Surface Engineering of TiO2 ETL for Highly Efficient and Hysteresis-Less Planar Perovskite Solar Cell (21.4%) with Enhanced Open-Circuit Voltage and Stability. Adv. Energy Mater. 2018, 8, 1800794. [Google Scholar] [CrossRef]
  19. Huang, K.-W.; Chen, Y.-H.; Li, M.-H.; Wu, Y.-S.; Chiu, P.-T.; Lin, Y.-P.; Tung, Y.-L.; Tsai, S.-Y.; Chen, P. Low-Temperature Growth of Uniform Ultrathin TiO2 Blocking Layer for Efficient Perovskite Solar Cell. Org. Electron. 2019, 75, 105379. [Google Scholar] [CrossRef]
  20. Shalan, A.E.; Elseman, A.M.; Rashad, M.M. Controlling the Microstructure and Properties of Titanium Dioxide for Efficient Solar Cells. In Titanium Dioxide-Material for a Sustainable Environment, 1st ed.; InTech: London, UK, 2018. [Google Scholar]
  21. Zhang, W.; He, H.; Li, H.; Duan, L.; Zu, L.; Zhai, Y.; Li, W.; Wang, L.; Fu, H.; Zhao, D. Visible-Light Responsive TiO2 -Based Materials for Efficient Solar Energy Utilization. Adv. Energy Mater. 2021, 11, 2003303. [Google Scholar] [CrossRef]
  22. Cameron, P.J.; Peter, L.M. Characterization of Titanium Dioxide Blocking Layers in Dye-Sensitized Nanocrystalline Solar Cells. J. Phys. Chem. B 2003, 107, 14394–14400. [Google Scholar] [CrossRef]
  23. Ito, S.; Liska, P.; Comte, P.; Charvet, R.; Péchy, P.; Bach, U.; Schmidt-Mende, L.; Zakeeruddin, S.M.; Kay, A.; Nazeeruddin, M.K.; et al. Control of Dark Current in Photoelectrochemical (TiO2/I–I3–) and Dye-Sensitized Solar Cells. Chem. Commun. 2005, 34, 4351. [Google Scholar] [CrossRef] [PubMed]
  24. Park, J.; Lee, M. Performance Enhancement of Dye-Sensitized Solar Cell with a TiCl4-Treated TiO2 Compact Layer. Electron. Mater. Lett. 2015, 11, 271–275. [Google Scholar] [CrossRef]
  25. Zhang, S.; Lan, Z.; Wu, J.; Chen, X.; Zhang, C. Preparation of Novel TiO2 Quantum Dot Blocking Layers at Conductive Glass/TiO2 Interfaces for Efficient CdS Quantum Dot Sensitized Solar Cells. J. Alloys Compd. 2016, 656, 253–258. [Google Scholar] [CrossRef]
  26. Su, T.-S.; Hsieh, T.-Y.; Hong, C.-Y.; Wei, T.-C. Electrodeposited Ultrathin TiO2 Blocking Layers for Efficient Perovskite Solar Cells. Sci. Rep. 2015, 5, 16098. [Google Scholar] [CrossRef]
  27. Zatirostami, A. Increasing the Efficiency of TiO2-Based DSSC by Means of a Double Layer RF-Sputtered Thin Film Blocking Layer. Optik 2020, 207, 164419. [Google Scholar] [CrossRef]
  28. Burke, A.; Ito, S.; Snaith, H.; Bach, U.; Kwiatkowski, J.; Grätzel, M. The Function of a TiO2 Compact Layer in Dye-Sensitized Solar Cells Incorporating “Planar” Organic Dyes. Nano Lett. 2008, 8, 977–981. [Google Scholar] [CrossRef] [PubMed]
  29. Kavan, L.; Zukalova, M.; Vik, O.; Havlicek, D. Sol–Gel Titanium Dioxide Blocking Layers for Dye-Sensitized Solar Cells: Electrochemical Characterization. ChemPhysChem 2014, 15, 1056–1061. [Google Scholar] [CrossRef]
  30. Jiang, C.; Koh, W.L.; Leung, M.Y.; Hong, W.; Li, Y.; Zhang, J. Influences of Alcoholic Solvents on Spray Pyrolysis Deposition of TiO2 Blocking Layer Films for Solid-State Dye-Sensitized Solar Cells. J. Solid State Chem. 2013, 198, 197–202. [Google Scholar] [CrossRef]
  31. Lim, S.P.; Huang, N.M.; Lim, H.N.; Mazhar, M. Aerosol Assisted Chemical Vapour Deposited (AACVD) of TiO2 Thin Film as Compact Layer for Dye-Sensitised Solar Cell. Ceram. Int. 2014, 40, 8045–8052. [Google Scholar] [CrossRef]
  32. Sangiorgi, A.; Bendoni, R.; Sangiorgi, N.; Sanson, A.; Ballarin, B. Optimized TiO2 Blocking Layer for Dye-Sensitized Solar Cells. Ceram. Int. 2014, 40, 10727–10735. [Google Scholar] [CrossRef]
  33. Hsu, C.-H.; Chen, K.-T.; Huang, P.-H.; Wu, W.-Y.; Zhang, X.-Y.; Wang, C.; Liang, L.-S.; Gao, P.; Qiu, Y.; Lien, S.-Y.; et al. Effect of Annealing Temperature on Spatial Atomic Layer Deposited Titanium Oxide and Its Application in Perovskite Solar Cells. Nanomaterials 2020, 10, 1322. [Google Scholar] [CrossRef]
  34. Kment, S.; Krysova, H.; Hubicka, Z.; Kmentova, H.; Kavan, L.; Zboril, R. Very Thin Thermally Stable TiO2 Blocking Layers with Enhanced Electron Transfer for Solar Cells. Appl. Mater. Today 2017, 9, 122–129. [Google Scholar] [CrossRef]
  35. Choi, H.; Nahm, C.; Kim, J.; Moon, J.; Nam, S.; Jung, D.-R.; Park, B. The Effect of TiCl4-Treated TiO2 Compact Layer on the Performance of Dye-Sensitized Solar Cell. Curr. Appl. Phys. 2012, 12, 737–741. [Google Scholar] [CrossRef]
  36. Vairale, P.; Sharma, V.; Waghmare, A.; Shinde, P.; Pandharkar, S.; Punde, A.; Doiphode, V.; Hase, Y.; Aher, R.; Nair, S.; et al. Study of Structural, Optical, Morphology and Photoelectrochemical Properties of Melanin Sensitized TiO2 Thin Films Prepared by Chemical Bath Deposition Method. ES Mater. Manuf. 2020, 10, 5–15. [Google Scholar] [CrossRef]
  37. Liu, B.; Aydil, E.S. Growth of Oriented Single-Crystalline Rutile TiO2 Nanorods on Transparent Conducting Substrates for Dye-Sensitized Solar Cells. J. Am. Chem. Soc. 2009, 131, 3985–3990. [Google Scholar] [CrossRef] [PubMed]
  38. Yella, A.; Heiniger, L.-P.; Gao, P.; Nazeeruddin, M.K.; Grätzel, M. Nanocrystalline Rutile Electron Extraction Layer Enables Low-Temperature Solution Processed Perovskite Photovoltaics with 13.7% Efficiency. Nano Lett. 2014, 14, 2591–2596. [Google Scholar] [CrossRef] [PubMed]
  39. Chiu, W.-H.; Lee, K.-M.; Suryanarayanan, V.; Hsu, J.-F.; Wu, M.-C. Controlled Photoanode Properties for Large-Area Efficient and Stable Dye-Sensitized Photovoltaic Modules. Nanomaterials 2021, 11, 2125. [Google Scholar] [CrossRef] [PubMed]
  40. Mishra, A.; Bhatt, N.; Bajpai, A.K. Nanostructured Superhydrophobic Coatings for Solar Panel Applications. In Nanomaterials-Based Coatings; Elsevier: Amsterdam, The Netherlands, 2019; pp. 397–424. [Google Scholar]
  41. Vyas, S.; Tiwary, R.; Shubham, K.; Chakrabarti, P. Study the Target Effect on the Structural, Surface and Optical Properties of TiO2 Thin Film Fabricated by RF Sputtering Method. Superlattices Microstruct. 2015, 80, 215–221. [Google Scholar] [CrossRef]
  42. Güzelçimen, F.; Tanören, B.; Çetinkaya, Ç.; Kaya, M.D.; Efkere, H.İ.; Özen, Y.; Bingöl, D.; Sirkeci, M.; Kınacı, B.; Ünlü, M.B.; et al. The Effect of Thickness on Surface Structure of Rf Sputtered TiO2 Thin Films by XPS, SEM/EDS, AFM and SAM. Vacuum 2020, 182, 109766. [Google Scholar] [CrossRef]
  43. Kavan, L.; Tétreault, N.; Moehl, T.; Grätzel, M. Electrochemical Characterization of TiO2 Blocking Layers for Dye-Sensitized Solar Cells. J. Phys. Chem. C 2014, 118, 16408–16418. [Google Scholar] [CrossRef]
  44. Endrődi, B.; Kecsenovity, E.; Rajeshwar, K.; Janáky, C. One-Step electrodeposition of Nanocrystaline TiO2 Films with Enhanced Photoelectrochemical Performance and Charge Storage. ACS Appl. Energy Mater. 2018, 1, 851–858. [Google Scholar] [CrossRef]
  45. Liu, Y.; Bag, M.; Renna, L.A.; Page, Z.A.; Kim, P.; Emrick, T.; Venkataraman, D.; Russell, T.P. Understanding Interface Engineering for High-Performance Fullerene/Perovskite Planar Heterojunction Solar Cells. Adv. Energy Mater. 2016, 6, 1501606. [Google Scholar] [CrossRef]
  46. Wu, F.; Pathak, R.; Chen, C.; Tong, Y.; Xu, H.; Zhang, T.; Jian, R.; Li, X.; Qiao, Q. Reduced Hysteresis in Perovskite Solar Cells Using Metal Oxide/Organic Hybrid Hole Transport Layer with Generated Interfacial Dipoles. Electrochim. Acta 2020, 354, 136660. [Google Scholar] [CrossRef]
  47. Najm, A.S.; Alwash, S.A.; Sulaiman, N.H.; Chowdhury, M.S.; Techato, K. N719 Dye as a Sensitizer for Dye-sensitized Solar Cells (DSSCs): A Review of Its Functions and Certain Rudimentary Principles. Env. Prog. Sustain. Energy 2023, 42, e13955. [Google Scholar] [CrossRef]
  48. Zheng, W.; Zhang, X. The Improved Performance of Solar Cells Co-Sensitized with CdS/Ag2S Quantum Dots and N719 Dye. J. Alloys Compd. 2021, 886, 161331. [Google Scholar] [CrossRef]
  49. Liu, I.-P.; Lin, W.-H.; Tseng-Shan, C.-M.; Lee, Y.-L. Importance of Compact Blocking Layers to the Performance of Dye-Sensitized Solar Cells under Ambient Light Conditions. ACS Appl. Mater. Interfaces 2018, 10, 38900–38905. [Google Scholar] [CrossRef] [PubMed]
  50. Löbl, P.; Huppertz, M.; Mergel, D. Nucleation and Growth in TiO2 Films Prepared by Sputtering and Evaporation. Thin Solid Films 1994, 251, 72–79. [Google Scholar] [CrossRef]
  51. Balkan, T.; Guler, Z.; Morozova, M.; Dytrych, P.; Solcova, O.; Sarac, A.S. The Effect of Deposition on Electrochemical Impedance Properties of TiO2/FTO Photoanodes. J. Electroceram. 2016, 36, 102–111. [Google Scholar] [CrossRef]
  52. Bredar, A.R.C.; Chown, A.L.; Burton, A.R.; Farnum, B.H. Electrochemical Impedance Spectroscopy of Metal Oxide Electrodes for Energy Applications. ACS Appl. Energy Mater. 2020, 3, 66–98. [Google Scholar] [CrossRef]
  53. Bisquert, J.; Fabregat-Santiago, F.; Mora-Seró, I.; Garcia-Belmonte, G.; Giménez, S. Electron Lifetime in Dye-Sensitized Solar Cells: Theory and Interpretation of Measurements. J. Phys. Chem. C 2009, 113, 17278–17290. [Google Scholar] [CrossRef]
  54. Fabregat-Santiago, F.; Mora-Seró, I.; Garcia-Belmonte, G.; Bisquert, J. Cyclic Voltammetry Studies of Nanoporous Semiconductors. Capacitive and Reactive Properties of Nanocrystalline TiO2 Electrodes in Aqueous Electrolyte. J. Phys. Chem. B 2003, 107, 758–768. [Google Scholar] [CrossRef]
  55. Chen, X.; Tang, Y.; Liu, W. Efficient Dye-Sensitized Solar Cells Based on Nanoflower-like ZnO Photoelectrode. Molecules 2017, 22, 1284. [Google Scholar] [CrossRef] [PubMed]
  56. Córdoba-Torres, P.; Mesquita, T.J.; Nogueira, R.P. Relationship between the Origin of Constant-Phase Element Behavior in Electrochemical Impedance Spectroscopy and Electrode Surface Structure. J. Phys. Chem. C 2015, 119, 4136–4147. [Google Scholar] [CrossRef]
  57. Pajkossy, T. Impedance of Rough Capacitive Electrodes. J. Electroanal. Chem. 1994, 364, 111–125. [Google Scholar] [CrossRef]
  58. Zhang, G.; Roy, B.K.; Allard, L.F.; Cho, J. Titanium Oxide Nanoparticles Precipitated from Low-Temperature Aqueous Solutions: I.; Nucleation, Growth, and Aggregation. J. Am. Ceram. Soc. 2008, 91, 3875–3882. [Google Scholar] [CrossRef]
  59. Pellitero, M.A.; Curtis, S.D.; Arroyo-Currás, N. Interrogation of Electrochemical Aptamer-Based Sensors via Peak-to-Peak Separation in Cyclic Voltammetry Improves the Temporal Stability and Batch-to-Batch Variability in Biological Fluids. ACS Sens. 2021, 6, 1199–1207. [Google Scholar] [CrossRef] [PubMed]
  60. Mansfeldova, V.; Zlamalova, M.; Tarabkova, H.; Janda, P.; Vorokhta, M.; Piliai, L.; Kavan, L. Work Function of TiO2 (Anatase, Rutile, and Brookite) Single Crystals: Effects of the Environment. J. Phys. Chem. C 2021, 125, 1902–1912. [Google Scholar] [CrossRef]
  61. Chen, T.; Hu, W.; Song, J.; Hong Guai, G.; Ming Li, C. Interface Functionalization of Photoelectrodes with Graphene for High Performance Dye-Sensitized Solar Cells. Adv. Funct. Mater. 2012, 22, 5245–5250. [Google Scholar] [CrossRef]
  62. Kavan, L. Electrochemistry and band structure of semiconductors (TiO2, SnO2, ZnO): Avoiding pitfalls and textbook errors. J. Solid State Electr. 2024, 28, 829–845. [Google Scholar] [CrossRef]
  63. Hvojnik, M.; Vida, J.; Homola, T.; Pavlickova, M.; Hatala, M.; Tomanova, K.; Mikula, M.; Gemeiner, P. The effect of rapid atmospheric plasma treatment of FTO substrates on the quality of TiO2 blocking layers for printed perovskite solar cells. Mater. Sci. Semicon. Proc. 2021, 131, 105850. [Google Scholar] [CrossRef]
  64. Frank, O.; Zukalova, M.; Laskova, B.; Kurti, J.; Koltai, J.; Kavan, L. Raman spectra of titanium dioxide (anatase, rutile) with identified oxygen isotopes (16, 17, 18). PCCP 2012, 14, 14567–14572. [Google Scholar] [CrossRef]
  65. Tang, H.; Prasad, K.; Sanjines, R.; Schmid, P.E.; Levy, F. Electrical and optical properties of TiO2 anatase thin films. J. Appl. Phys. 1994, 75, 2042–2047. [Google Scholar] [CrossRef]
  66. Jubu, P.R.; Danladi, E.; Ndeze, U.I.; Adedokun, O.; Landi, S., Jr.; Haider, A.J.; Adepoju, A.T.; Yusof, Y.; Obaseki, O.S.; Yam, F.K. Comment about the use of unconventional Tauc plot for bandgap energy determination of semiconductors using UV-Vis spectroscopy. Results Opt 2024, 14, 100606. [Google Scholar]
  67. Ma’arifah, A.; Sholeha, N.; Pujiarti, H.; Diantoro, M.; Hidayat, A.; Osman, Z. The effect of RF sputtering power variation on blocking layer TiO2 on the performance of DSSC. Result Surf. Interfaces 2025, 18, 100456. [Google Scholar] [CrossRef]
  68. Tian, G.; He, H.; Shao, J. Effect of Microstructure of TiO2 Thin Films on Optical Band Gap Energy. Chin. Phys. Lett. 2005, 22, 1787. [Google Scholar]
  69. Pappas, S.D.; Grammtikopoulos, S.; Poulopoulos, P.; Trachylis, D.; Velgakis, M.J.; Politis, C. Growth and Optical Properites of Thin NiO Films. J. Surf. Interfaces Mater. 2014, 2, 233–237. [Google Scholar] [CrossRef]
  70. Zulkefle, M.A.; Abdul Rahman, R.; Yusof, K.A.; Abdullah, W.F.H.; Rusop, M.; Herman, S.H. Spin Speed and Duration Dependence of TiO2 Thin Films pH Sensing Behavior. J. Sens. 2016, 2016, 9746156. [Google Scholar] [CrossRef]
  71. Ito, S.; Chen, P.; Comte, P.; Nazeeruddin, M.K.; Liska, P.; Péchy, P.; Grätze, M. Fabrication of screen-printing pastes from TiO2 powders for dye-sensitized solar cells. Prog. Photovolt. Res. Appl. 2007, 15, 603–612. [Google Scholar]
  72. Schindelin, J.; Arganda-Carreras, I.; Frise, E.; Kaynig, V.; Longair, M.; Pietzsch, T.; Preibisch, S.; Rueden, C.; Saalfeld, S.; Schmid, B.; et al. Fiji: An open-source platform for biological-image analysis. Nat. Methods 2012, 9, 676–682. [Google Scholar]
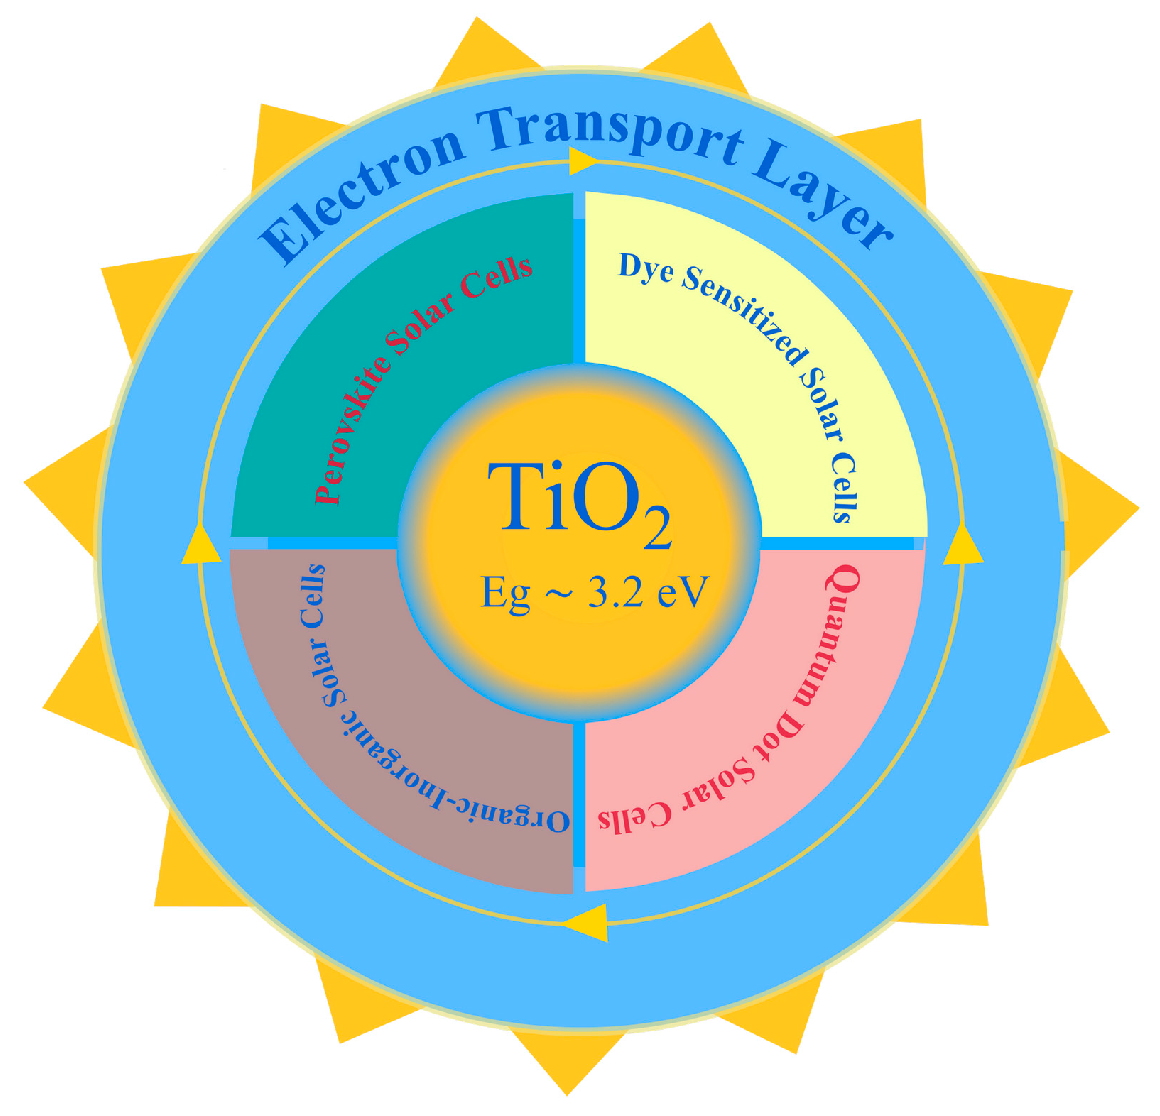
Figure 1. TiO2 as an electron transport layer in different kinds of solar cells.
Inorganics 13 00270 g001
Figure 2. Transmittance spectra (a) and cyclic voltammograms (b) of the second series of samples, SP_21-SP_24, prepared by diode sputtering.
Inorganics 13 00270 g002
Figure 3. The transmittance values (T) at 535 nm and the main electrochemical characteristics of sputtered samples, SP_21-24, observed from CV (Jpa) and EIS (Rct, Qdl, and n).
Inorganics 13 00270 g003
Figure 4. Nyquist’s plots of sputtered samples (SP_21-24) and bare FTO (a), with the equivalent circuit used for fitting EIS data (b).
Inorganics 13 00270 g004
Figure 5. SEM micrographs of sputtered samples SP_21 (a), SP_22 (b), and SP_24 (c) on the FTO substrate at magnifications of 50 k; yellow circles indicate cracks in the surface of the samples SP_22 and SP_24.
Inorganics 13 00270 g005
Figure 6. The CPD histogram distributions obtained with KPFM for bare FTO (a) and SP_24 sample (b).
Inorganics 13 00270 g006
Figure 7. A 3D representation of bare FTO (a) and SP_21 sample (b) obtained with AFM.
Inorganics 13 00270 g007
Figure 8. Transmittance spectra of spin-coated samples SC_11-33 (a); cyclic voltammograms of the spin-coated samples SC_11-33 without SC_31 and SC_32, with the inset of anodic part of CV (b).
Inorganics 13 00270 g008
Figure 9. The transmittance values (T) at 535 nm of spin-coated samples SC_11-33, and the main electrochemical characteristics of the samples SC_11-33 without SC_31 and SC_32, observed from CV (Jpa) and EIS (Rct, Qdl, and n) (a); Nyquist plots of spin-coated samples SC_11-33 without SC_31 and SC_32 (b).
Inorganics 13 00270 g009
Figure 10. The CPD histogram distributions obtained with KPFM for the samples SC_11 (a) and SC_33 (b). The red line represents measured data, while the green and blue lines represent Gaussian fits of the CPD histograms.
Inorganics 13 00270 g010
Figure 11. SEM micrographs of the spin-coated samples SC_11 (at magnifications of 50 k) (a) and SC_21 (at magnifications of 25 k) (b) on the FTO substrate.
Inorganics 13 00270 g011
Figure 12. A 3D representation of the samples SC_11 (a) and SC_33 (b), respectively, obtained with AFM.
Inorganics 13 00270 g012
Figure 13. Transmittance spectra (a) and cyclic voltammograms (b) of the chemical bath-deposited samples CB_1-6.
Inorganics 13 00270 g013
Figure 14. The transmittance values (T) at 535 nm and the main electrochemical characteristics of chemical bath-deposited samples, CB_1-6, observed from CV (Jpa) and EIS (Rct, Qdl, and τ) (a); Nyquist plots of chemical bath-deposited samples, CB_1-6 (b).
Inorganics 13 00270 g014
Figure 15. SEM micrographs of samples CB_1 (a), CB_2 (b), CB_3 (c), and CB_5 (d) on the FTO substrate at magnifications of 50 k.
Inorganics 13 00270 g015aInorganics 13 00270 g015b
Figure 16. The CPD histogram distributions obtained with KPFM for CB_1 (a), CB_2 (b), CB_3 (c), and CB_6 (d). The red line represents measured data, while the green, blue, and turquoise lines represent Gaussian fits of the CPD histograms.
Inorganics 13 00270 g016aInorganics 13 00270 g016b
Figure 17. A 3D representation of the samples deposited for 30 min, horizontally placed CB_1 (a), horizontally with stirring CB_3 (b), and vertically placed CB_5 (c), obtained with AFM.
Inorganics 13 00270 g017
Figure 18. Raman spectra of the best-performing blocking layers on the FTO substrate (a); J-V curves of fabricated DSSCs with those blocking layers (b).
Inorganics 13 00270 g018
Figure 19. Sample positions in TiCl4 aqueous solutions: horizontally without homogenization (a), horizontally with homogenization (b), and vertically (c).
Inorganics 13 00270 g019
Table 1. Prepared samples and deposition conditions.
Deposition MethodSample Name and Conditions
SPUTTERINGSP_11250 W   15 minSP_21200 W   5 min
SP_12350 W   15 minSP_22250 W   5 min
SP_13450 W   15 minSP_23300 W   5 min
SP_14250 W   30 minSP_24200 W   10 min
SP_15350 W   30 min  
SP_16450 W   30 min  
 
 SC_1140 mM 70 °C 20 minSC_21120 mM 70 °C 20 minSC_31240 mM 70°C
20 min
SPIN-COATINGSC_1240 mM 70 °C 40 minSC_22120 mM 70 °C 40 minSC_32240 mM 70 °C
40 min
 SC_1340 mM 70 °C 60 minSC_23120 mM 70 °C 60 minSC_33240 mM 70 °C
60 min
 
CHEMICAL BATH DEPOSITIONCB_1horizontally  30 min
CB_2horizontally  60 min
CB_3horizontally + homogenization  30 min
CB_4horizontally + homogenization  60 min
CB_5vertically  30 min
CB_6vertically  60 min
Table 2. Electrochemical parameters of sputtered samples and bare FTO obtained from the EIS data fitting.
SampleRs (Ω)Rct (Ω)Qdl (sn/Ω)∙10−6nW (s1/2/Ω)∙10−2τ (ms)
Bare FTO30.0763.800.9941.760.16
SP_2144.6149011.700.8460.3158.36
SP_2240.9198017.000.8230.35914.13
SP_2341.9300710.900.8420.23923.89
SP_2457.916308.460.8790.2858.36
Table 3. Electrochemical parameters of spin-coated samples obtained from EIS data fitting.
SampleRs (Ω)Rct (Ω)Qdl (sn/Ω)∙10−6nW (s1/2/Ω)∙10−2τ (ms)
SC_11 44.01276.700.9971.100.75
SC_1244.11716.540.9991.011.30
SC_1347.41406.520.9951.090.75
SC_2151.619512.500.9771.622.25
SC_2237.424211.500.9661.402.25
SC_2344.71257.080.9991.180.75
SC_3337.828810.700.9521.122.25
Table 4. Electrochemical parameters of chemical bath-deposited samples obtained from the EIS data fitting.
SampleRs (Ω)Rct (Ω)Qdl (sn/Ω)∙10−6nW (s1/2/Ω)∙10−2τ (ms)
CB_145.5103011.40.9550.2008.36
CB_241.7125013.00.9550.35414.13
CB_335.862911.60.9640.6857.31
CB_437.063310.90.9580.6297.31
CB_547.030210.80.9780.3952.93
CB_652.647911.00.9580.2824.95
Table 5. Parameters obtained via electrochemical, KPFM, and optical characterization for the best-performing blocking layers, along with their thicknesses.
SampleJpa (mA/cm2)Rct
(Ω)
CPD Distributionφ (eV)Eg (eV)d (nm)
FTO1.31776single4.6//
SP_230.3163007single4.63.8013
SC_330.735288bimodal4.43.3250
CB_20.5061250single4.43.41130
Table 6. Photovoltaic parameters of DSSCs with different blocking layers.
CellJsc (mA/cm2)Voc (V)FFη (%)
without blocking layer5.6010.7040.692.74
SP_238.5620.7090.664.00
SC_336.8050.7300.643.20
CB_28.1660.6970.603.43
Disclaimer/Publisher’s Note: The statements, opinions and data contained in all publications are solely those of the individual author(s) and contributor(s) and not of MDPI and/or the editor(s). MDPI and/or the editor(s) disclaim responsibility for any injury to people or property resulting from any ideas, methods, instructions or products referred to in the content.