Article

Cu@Pt Core–Shell Nanostructures for Ammonia Oxidation: Bridging Electrocatalysis and Electrochemical Sensing

Department of Chemical and Biological Engineering, Gachon University, 1342 Seongnam-daero, Seongnam-si 13120, Gyeonggi-do, Republic of Korea
*
Author to whom correspondence should be addressed.
Inorganics 2025, 13(7), 241; https://doi.org/10.3390/inorganics13070241
Submission received: 17 June 2025 / Revised: 6 July 2025 / Accepted: 10 July 2025 / Published: 11 July 2025

Abstract

Electro-oxidation of ammonia has emerged as a promising route for sustainable energy conversion and pollutant mitigation. In this study, we report the facile fabrication of dendritic Cu@Pt core–shell nanostructures electrodeposited on pencil graphite, forming an efficient electrocatalyst for the ammonia oxidation reaction (AOR). The designed electrocatalyst exhibited high catalytic activity towards AOR, achieving high current density at very low potentials (−0.3 V vs. Ag/AgCl), with a lower Tafel slope of 16.4 mV/dec. The catalyst also demonstrated high electrochemical stability over 1000 potential cycles with a regeneration efficiency of 78%. In addition to catalysis, Cu@Pt/PGE facilitated very sensitive and selective electrochemical detection of ammonia nitrogen by differential pulse voltammetry, providing an extensive linear range (1 μM to 1 mM) and a low detection limit of 0.78 μM. The dual functionality of Cu@Pt highlights its potential in enhancing ammonia-based fuel cells and monitoring ammonia pollution in aquatic environments, thereby contributing to the development of sustainable energy and environmental technologies.

1. Introduction

Ammonia (NH3) was once recognised as a key component of the green revolution due to its role in nitrogen-based fertilisers. However, beyond its utility, ammonia is now increasingly considered a significant threat to environmental sustainability [1]. Despite its essential industrial applications in agriculture, chemical manufacturing, and refrigeration, ammonia has become a widespread and persistent pollutant due to its unregulated release into the environment [2]. Microbial degradation, urea hydrolysis, and industrial waste volatilisation all contribute to the release of large volumes of ammonia into aquatic environments. Elevated ammonia concentrations beyond permitted limits (10–50 μg/L as per WHO regulations) in water can exert severe damage to marine life, cause eutrophication, and alter the nitrogen cycle [3,4]. High concentrations of ammonia in urine are often associated with renal failure, underscoring the importance of regulating the ammonia concentrations in potable water. Among the available strategies, such as chlorination [5], zeolite treatment [6], and bacterial nitrification/denitrification [7], electrochemical oxidation of ammonia, known as the ammonia oxidation reaction (AOR), stands out as a practical approach for ammonia remediation [8,9]. AOR requires no sample pretreatment and offers rapid operation, along with minimal time requirements.
Paradoxically, the same compound of ammonia that is considered a major water pollutant is now being re-envisioned as a carbon-free energy vector, demonstrating significant potential for sustainable energy applications [10]. Ammonia is emerging as a prospective competitor for next-generation energy systems such as ammonia fuel cells, which are viewed as a potential replacement for conventional hydrogen–oxygen fuel cells due to their high hydrogen content (17.6 wt%), facile liquefaction under ambient conditions, and existing supply chain [11]. Therefore, AOR is typically considered an opposite reaction to the Haber–Bosch process for ecological conservancy. In alkaline media, the electrolysis of ammonia to nitrogen and hydrogen necessitates significantly less energy than the electrolysis of water (1.23 V), as evidenced by the thermodynamic equations provided below:
Anode reaction :   2 NH 3 + 6 OH N 2 + 6 H 2 0 + 6 e Eanode = 0.77   V   vs. SHE Cathode   reaction :   6 H 2 0 + 6 e 3 H 2 + 6 O H Eanode = 0.83   V   vs. SHE Net   reaction :   2 N H 3 + 6 H 2 0 N 2 + 3 H 2 Δ E = 0.06   V
Hence, AOR has received significant attention, not only for its role in nitrogen monitoring and wastewater treatment via ammonia valorization, but also as a promising route for sustainable energy generation. However, the electro-oxidation of ammonia is a mechanistically complex, multi-electron process characterised by sluggish kinetics, involving the sequential cleavage of N-H bonds. This often results in catalyst poisoning by adsorbed NHx (X = 1–3) and nitrous oxides NOx species [12]. As a result, significant research efforts are focused on developing high-performance electrocatalysts with enhanced activity, stability, and resistance to poisoning under alkaline conditions. Pt has long been celebrated as the benchmark for AOR, owing to its favourable adsorption characteristics for NHx species and excellent electron transfer properties [13,14,15]. Recent mechanistic insights indicate that Pt(100) facets exhibit enhanced performance owing to advantageous *NH2 stability and enabling high N2 formation, with fewer Tafel slopes [15]. To enhance the activity and reduce poisoning, efforts have focused on developing Pt alloys. For instance, Pt92Rh8 electrodeposited nanostructures showed long stability and low AOR overpotential ~0.41 V vs. RHE due to the shift in the d-band centre [16]. High current density with long cycling stability was achieved with bead-like Pt nanostructures by varying the morphology [17]. Graphene-supported Pt electrocatalysts were also explored towards AOR to reduce the onset potential [18].
While Pt-based systems have outstanding catalytic performance for AOR, their practical application is often hampered by high cost and the need for complex synthesis procedures. To address these challenges, several strategies have been proposed to minimize Pt loading without compromising its activity. In this regard, core–shell nanostructures have emerged as an intriguing material architecture for catalyst design [13]. For example, Cu@Pt core–shell nanostructures, where a thin Pt shell encapsulates the Cu core, have several performance benefits. The presence of a Cu core can significantly alter the electronic structure (d-band centre) of the Pt shell and thereby enhance its adsorption energy toward reactive intermediates. Furthermore, replacing a significant amount of Pt with earth-abundant copper significantly reduces material prices while maintaining catalytic performance.
In the present work, we investigate the catalytic activity of Cu@Pt core–shell nanostructures for the electro-oxidation of ammonia using (NH4)2SO4, NH4OH, and NH4Cl as model compounds to examine the effect of different counterions on AOR reaction kinetics and catalyst performance. While many materials have been studied for ammonia oxidation, their use is often limited by complex synthesis, high noble metal content, and limited activity. In contrast, the fabricated Cu@Pt nanostructures demonstrate a relatively rapid and straightforward fabrication process without compromising their activity. The nanostructures developed in this study not only facilitate effective ammonia dehydrogenation but also serve reliably as a sensitive platform for its electrochemical detection, providing a practical and scalable approach for real-world monitoring applications.

2. Results and Discussion

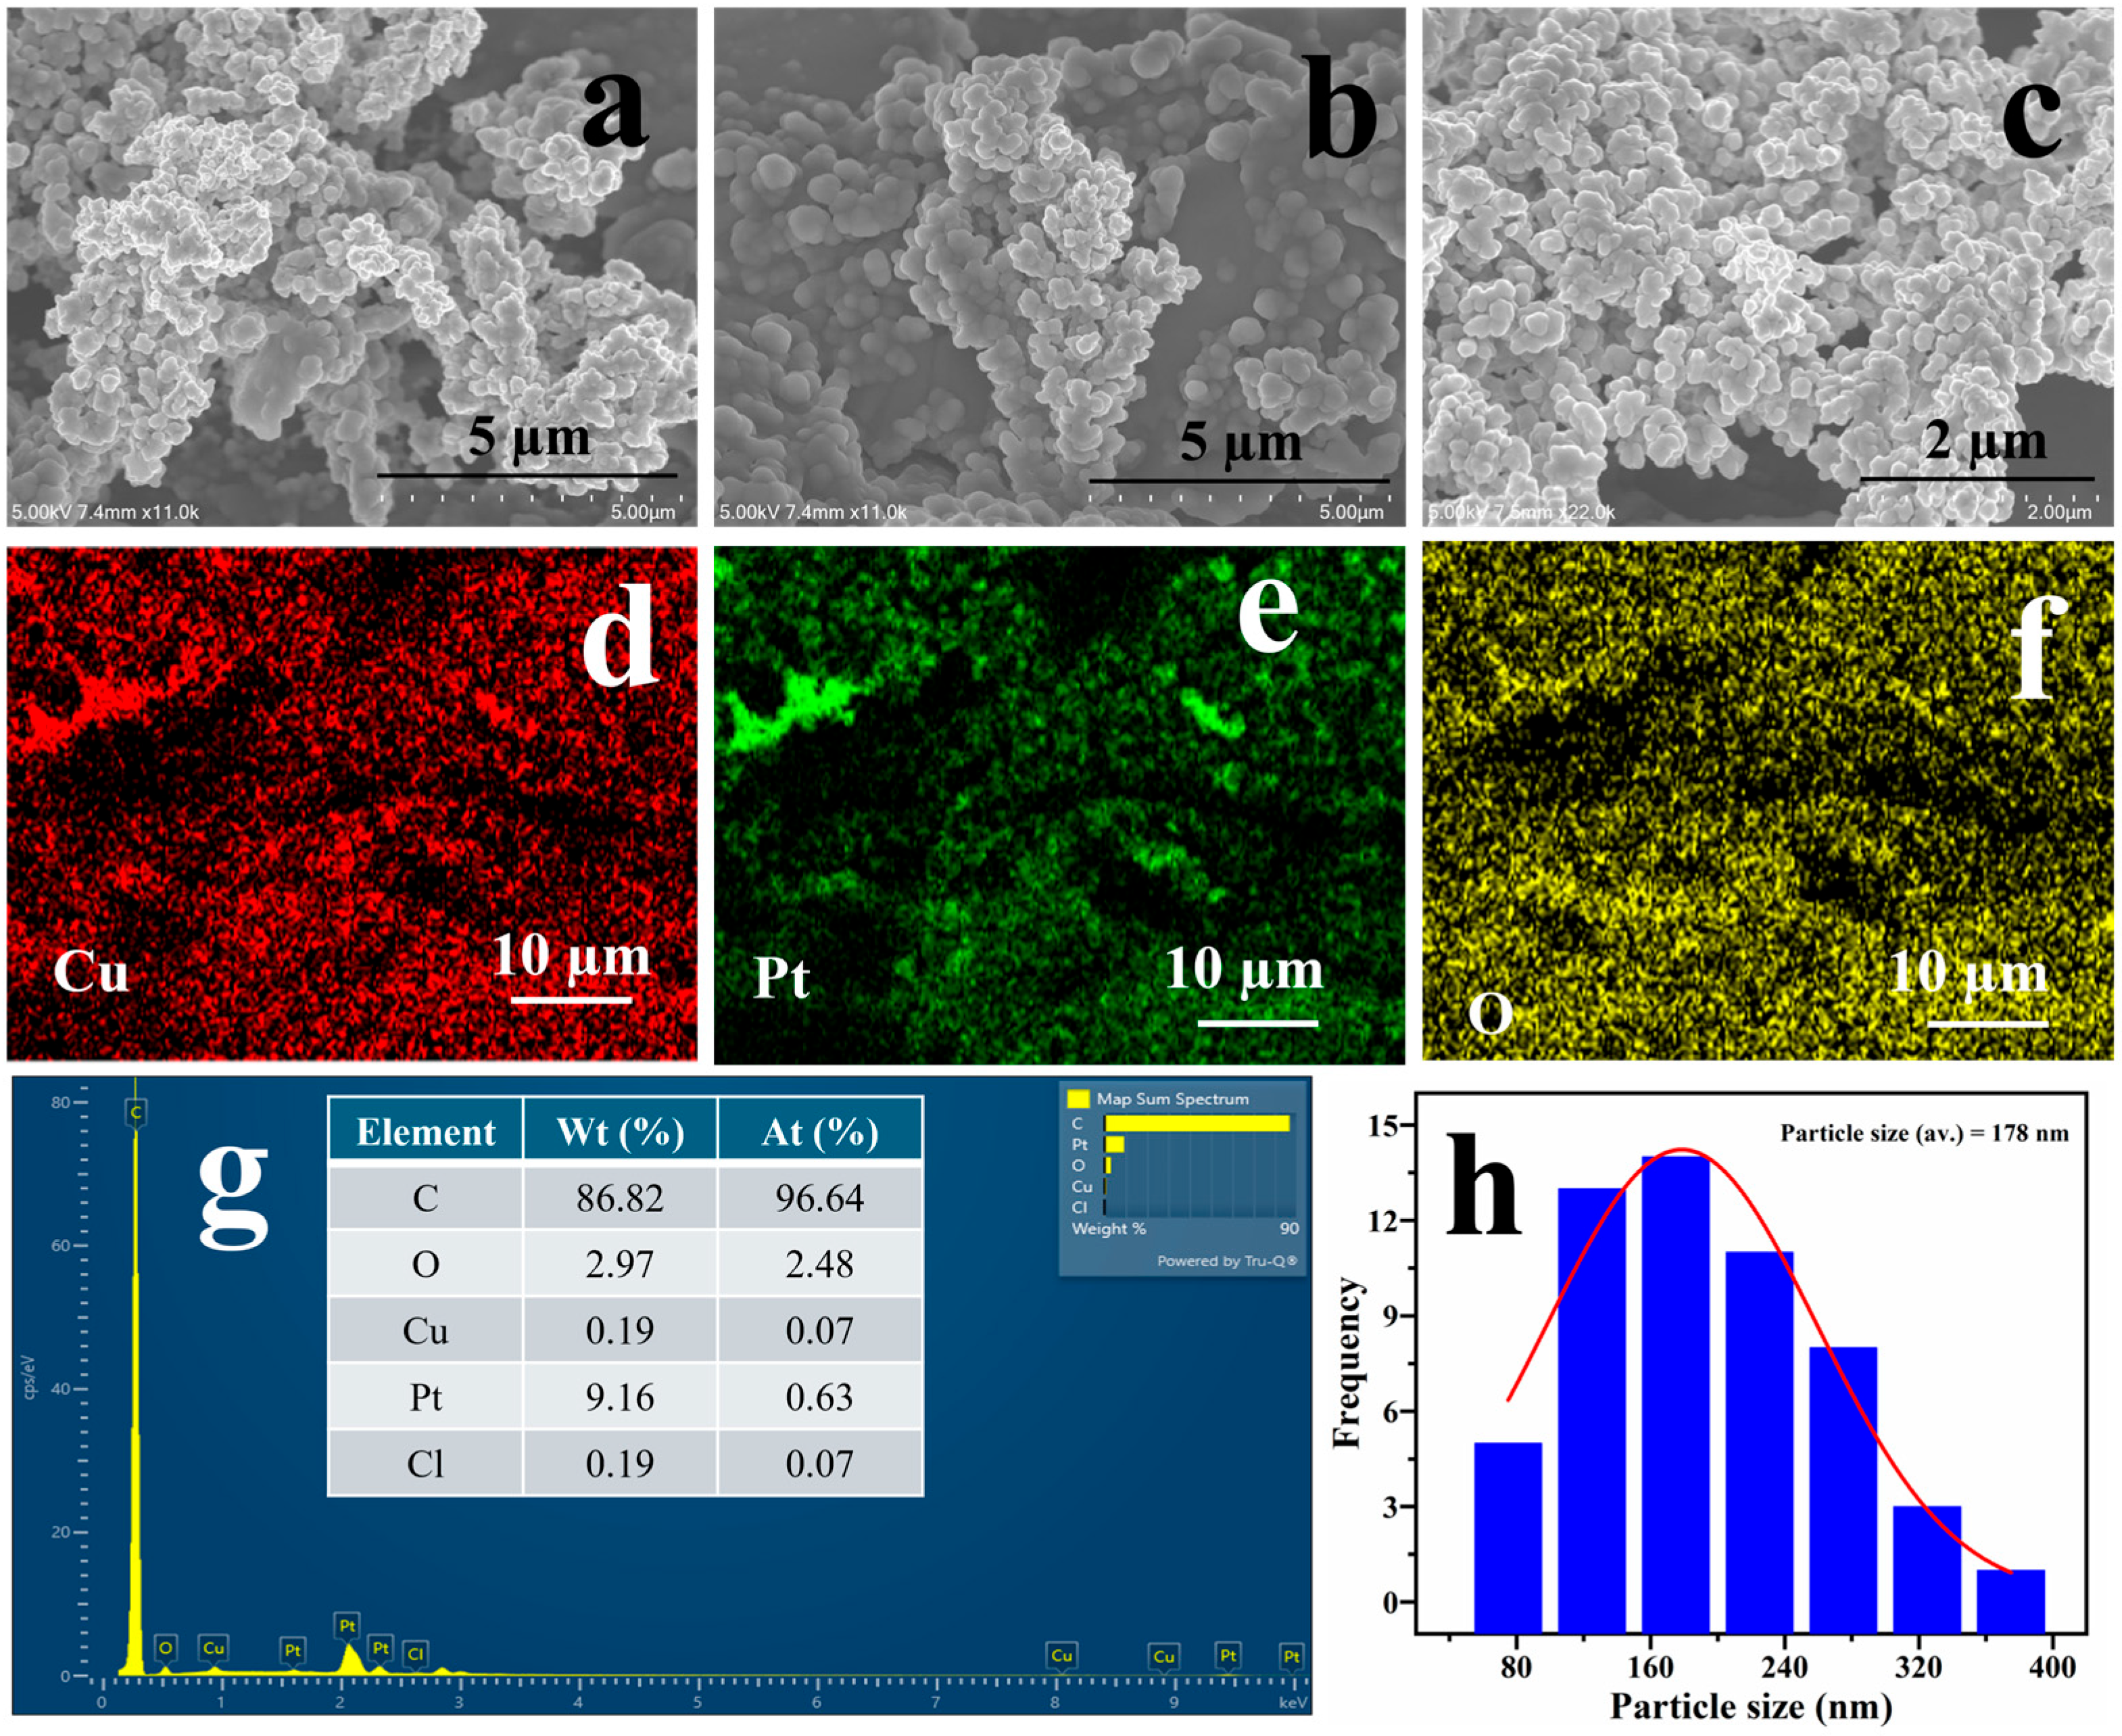
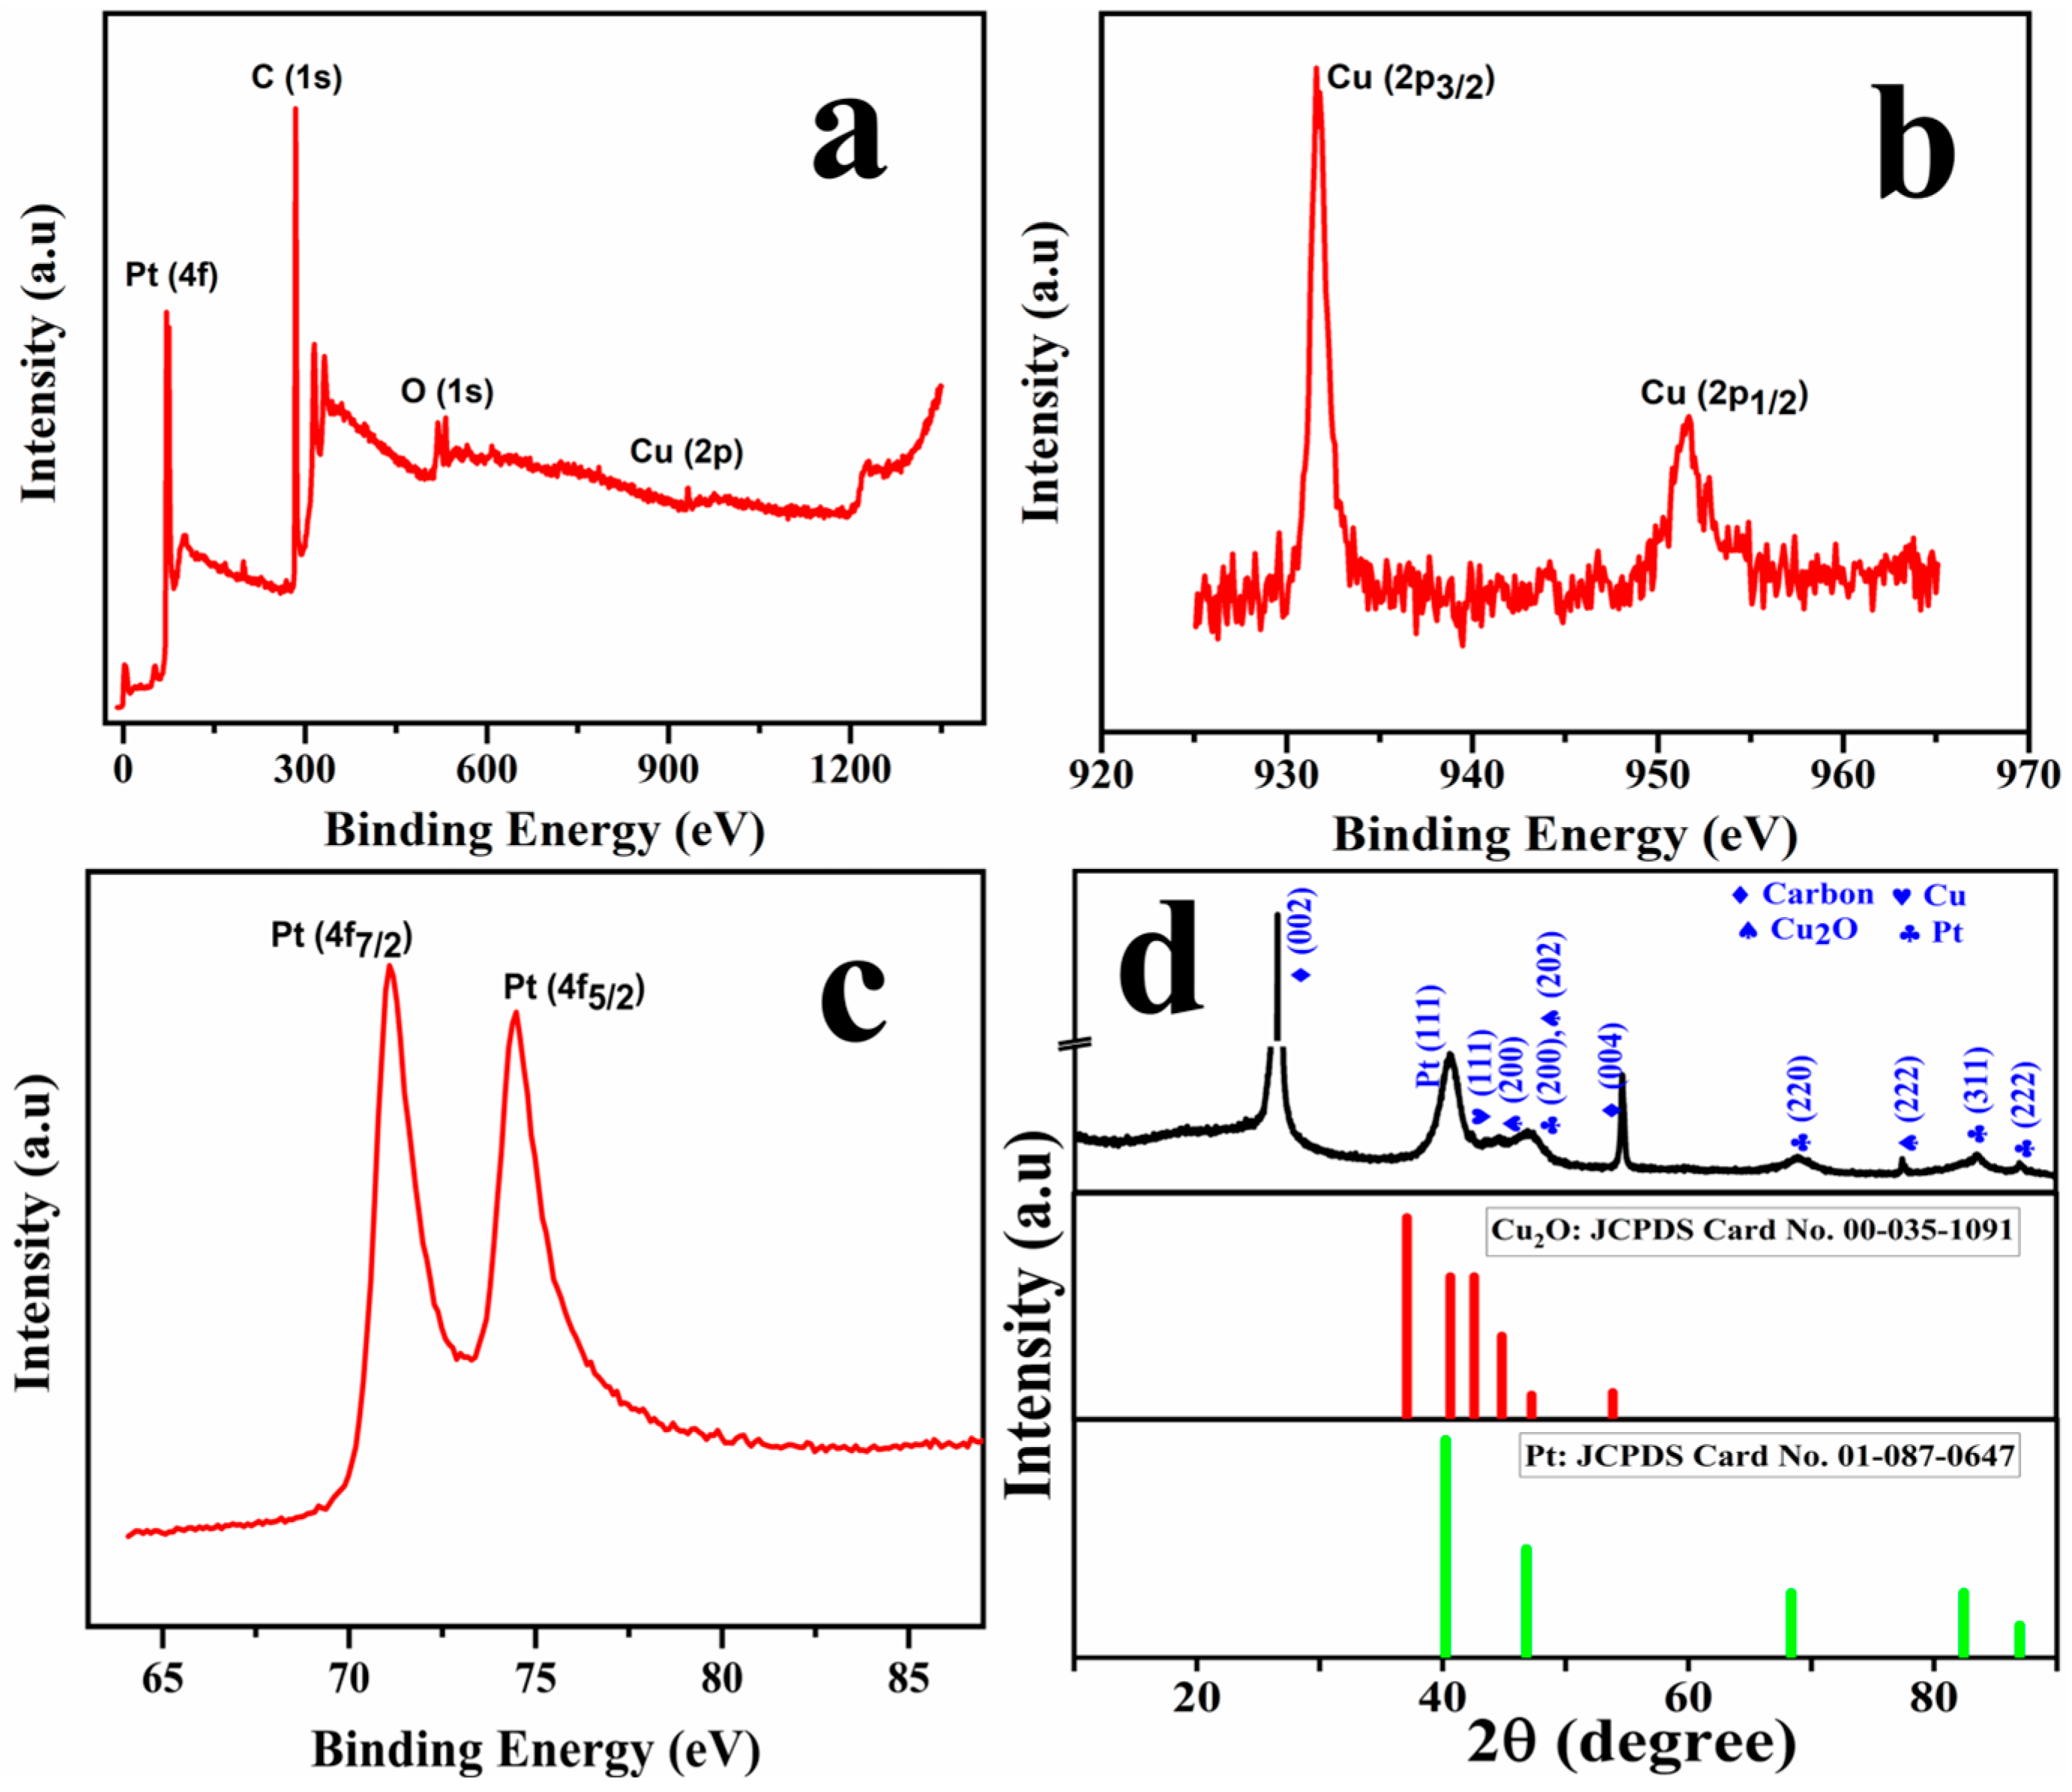
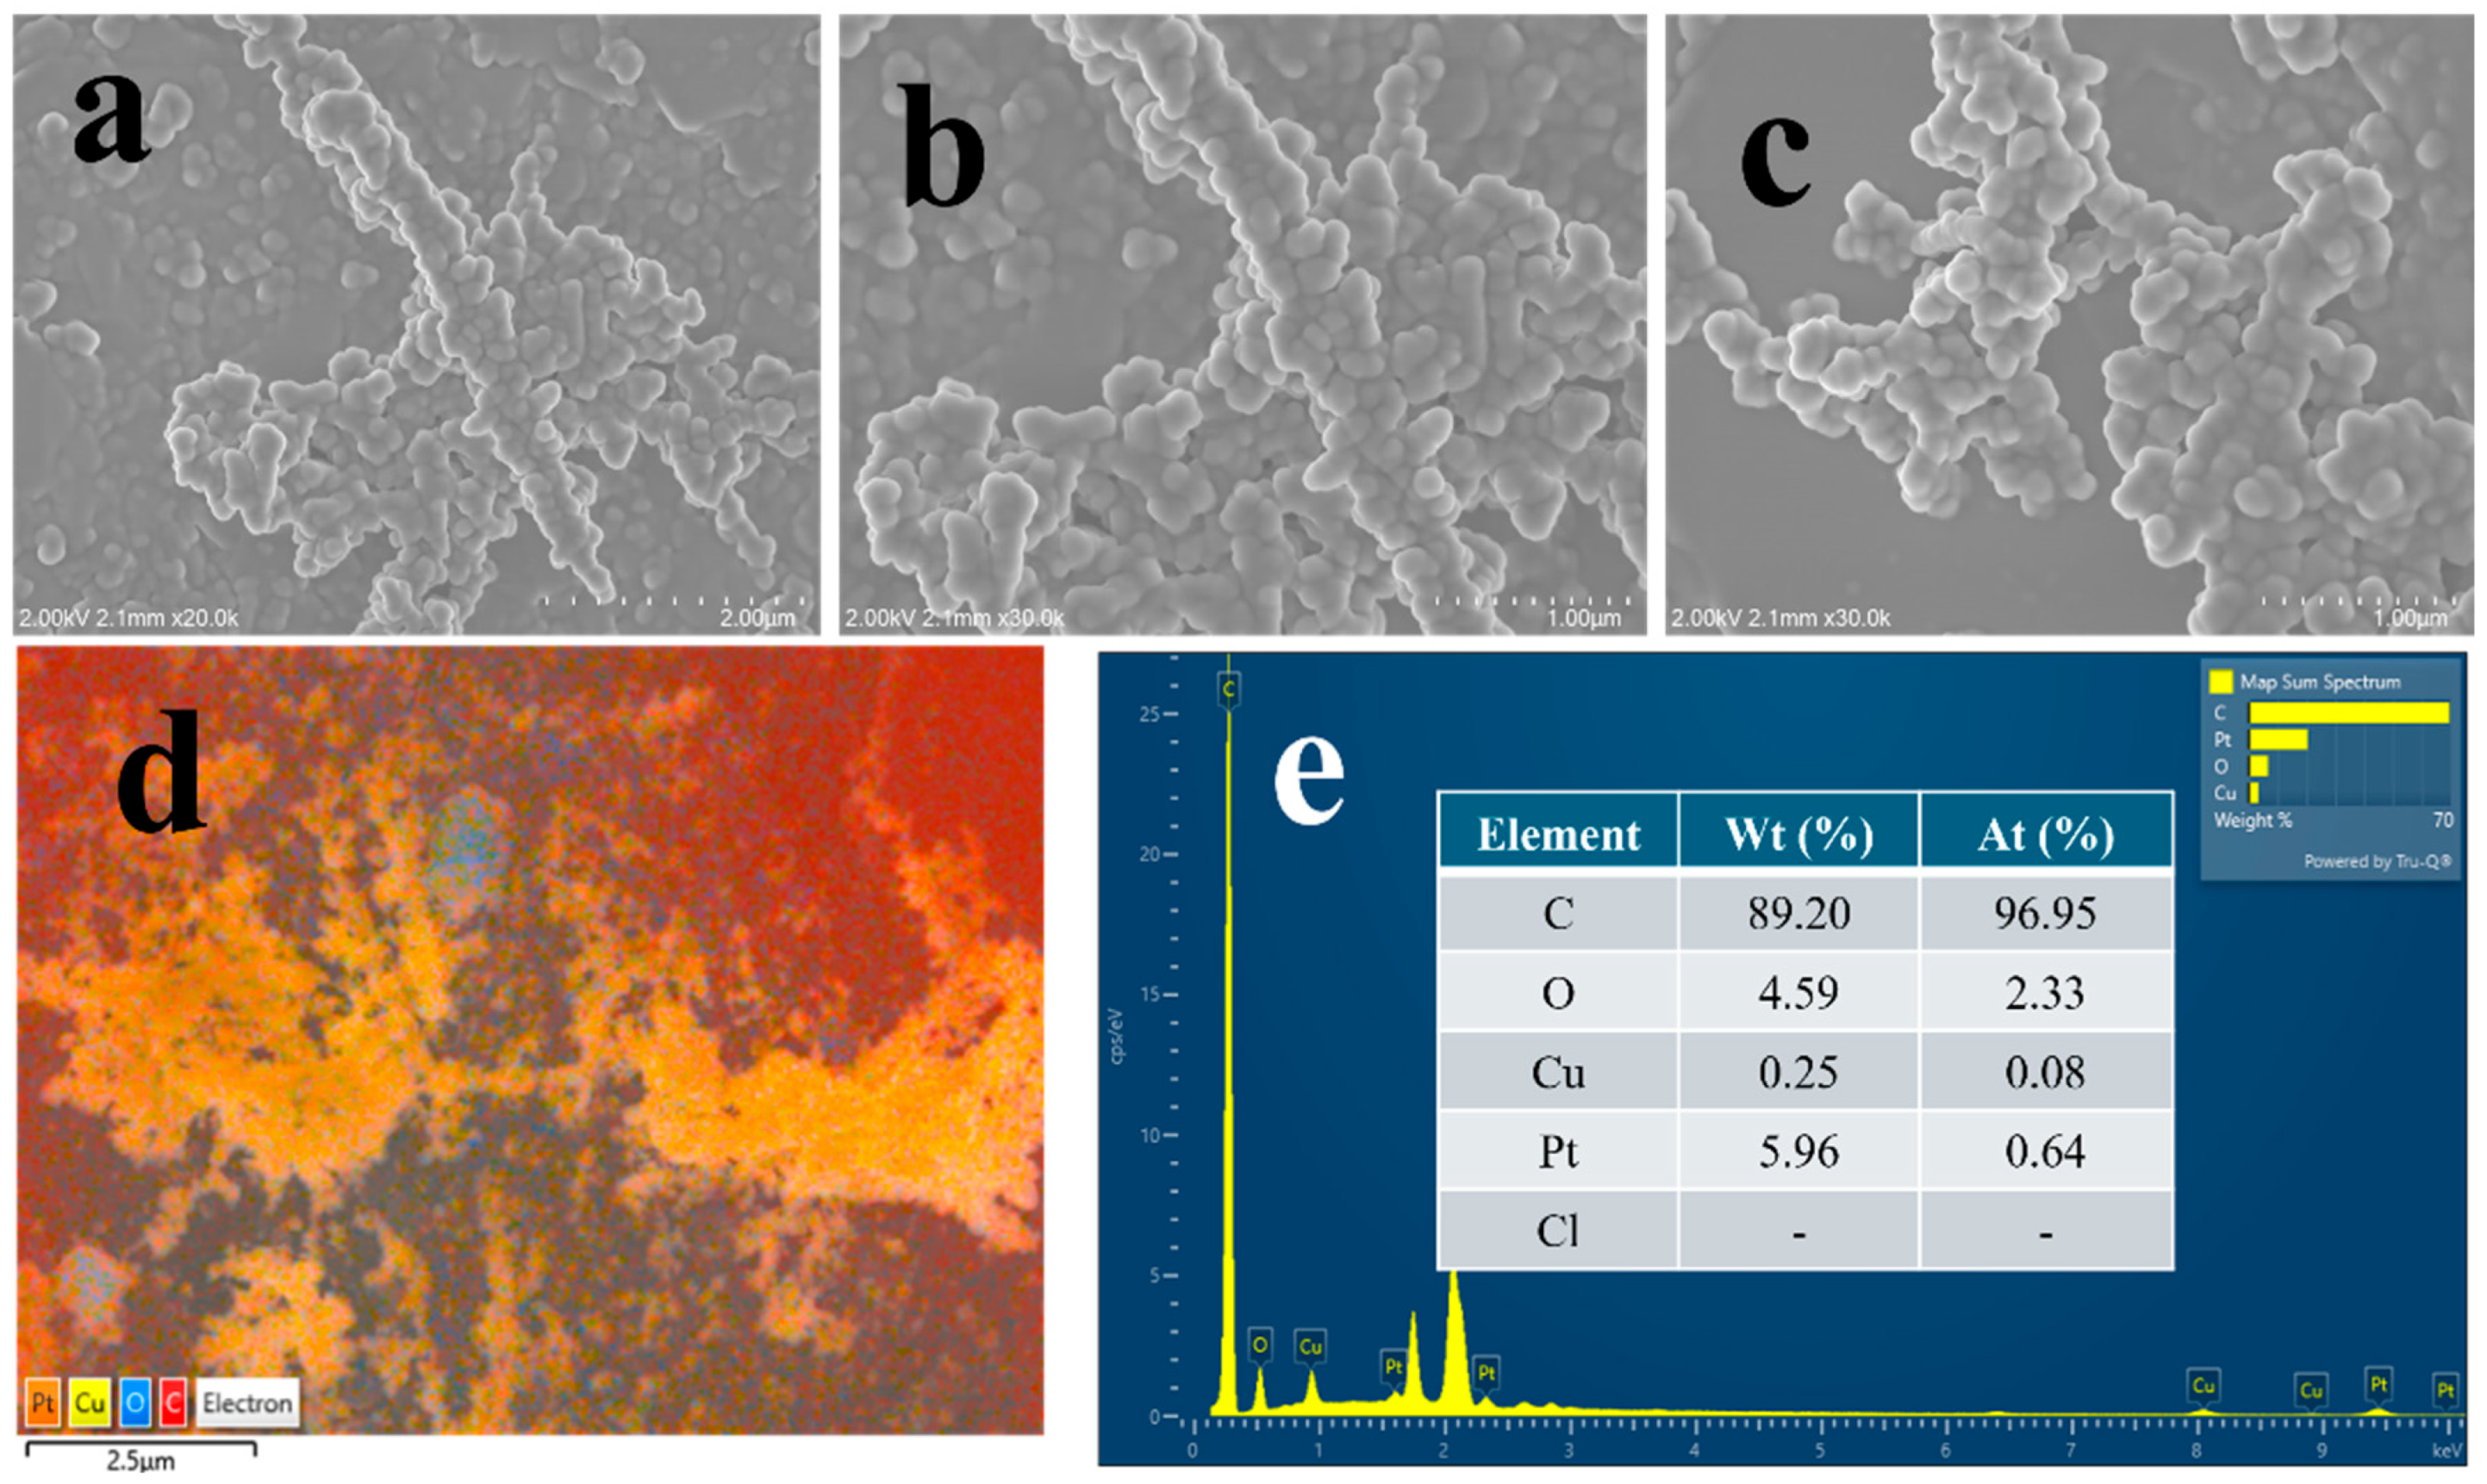
2.1. Physical Characterisation

Copper nanostructures were initially electrodeposited on the pencil graphite electrode (PGE) under amperometric conditions, following our earlier reports [19]. Since the standard reduction potential of copper (Cu2+/Cu0 = 0.34 V) is much lower than that of platinum (Pt4+/Pt0 = 0.73 V), galvanic replacement reaction was selected for Pt modification, as shown in the following equation.
C u s 0 / P G E + P t a q 4 + C u @ P t / P G E + 2 C u a q 2 +
In the course of this replacement reaction, Pt4+ ions are reduced and are subsequently deposited on the Cu/PGE electrode. Nonetheless, once this Pt overlayer has achieved adequate coverage, further replacement is hindered due to the absence of exposed Cu available to interact with the Pt4+ solution. This process is further corroborated by the open-circuit potential (OCP) measurements recorded during the GRR, as shown in Figure S1. Initially, the OCP value is observed at approximately +0.1 V, subsequently increasing over time and ultimately stabilizing at +0.75 V. An in-depth examination of the OCP profile reveals the involvement of multiple steps during the GRR. The gradual increase in potential is associated with the formation of random nucleation sites of Pt on the Cu surface. In contrast, the sharp rise near +0.2 V likely corresponds to the lateral growth of platinum nuclei, resulting in the filling of surface voids. The ultimate plateau in OCP indicates complete and uniform coverage, suggesting that the Cu surface has been passivated and no further reaction will take place.
Figure S2 depicts the surface morphology of electrodeposited copper nanostructures on the PGE surface. As evidenced from the Figure, Cu/PGE displayed homogeneous copper deposition with dendritic morphology and high porosity, consistent with our previous reports [19]. Figure 1 illustrates the surface morphology and elemental analysis after the platinum modification. A uniform Pt coverage with retention of the copper adatom morphology was observed, as presented in the SEM images of Figure 1a–c. The retention of the Cu adatom morphology indicates that a very thin layer of Pt is formed, as bulk replacement leads to significant alterations in the surface morphology. Figure 1d–f illustrate the elemental mapping analysis, indicating that both Cu and Pt exhibit a uniform distribution. Additionally, the presence of oxygen could be ascertained due to the formation of copper oxides during the electrodeposition process. The quantitative estimation of Cu and Pt was conducted through EDX analysis, with the results presented in Figure 1g. According to the EDX profile, the amount of Pt in the fabricated electrode is 9.16% by weight and 0.63% by atomic ratio. This suggests that a minimal amount of platinum is present on the modified Cu/PGE surface. Trace chlorine signals detected in the EDX spectrum can be ascribed to the residual hexachloroplatinic acid, the precursor used in the galvanic replacement process.
The electronic structure and crystallinity of the prepared Cu@Pt core–shell nanostructures were investigated using XPS and XRD analysis, as depicted in Figure 2. As illustrated in the survey scan spectra as shown in Figure 2a, characteristic peaks are revealed corresponding to C (1s), O (1s), Cu (2p), and Pt (4f), with the carbon signal arising from the underlying graphite. The elemental spectra of Cu, as shown in Figure 2b, exhibit two prominent peaks at binding energies 931.6 eV and 951.6 eV that could be attributed to Cu 2p3/2 and Cu 2p1/2 orbitals, respectively. The difference in the binding energy (Δ = 20 eV) between these orbitals is in agreement with the reported values of metallic copper [20,21]. Two well-defined peaks at 71.2 eV and 74.5 eV (Δ = 3.3 eV) could be attributed to Pt0 4f7/2 and Pt2+ 4f5/2, respectively, as evidenced from the platinum elemental spectra shown in Figure 2c, confirming the presence of the Pt shell [22,23]. The atomic ratio of Cu:Pt:O:C was estimated using the peak areas obtained from high-resolution XPS spectra and was calculated approximately as 1:8.23:2.93:60.09.
Figure 2d represents the diffraction spectra of the Cu@Pt core–shell nanostructures. The XRD pattern exhibits distinct diffraction peaks corresponding to carbon (C), copper (Cu), cuprous oxide (Cu2O), and platinum (Pt) associated with their characteristic crystallographic planes. The sharp peak with high intensity of 26.5° and 54.71° corresponds to carbon (002) (004) diffraction planes. Characteristic diffraction planes for Pt could be clearly evidenced at 2θ values of 40.67°, 46.97°, 69.12°, 83.63°, and 87.09, and could be assigned to the FCC cubic plane of Pt (111), (200), (220), (311), and (222) planes, respectively [24]. While the peaks at 44.56° and 47.05° could be assigned to Cu2O, the peak at 42.51° could be attributed to Cu (111). Based on these observations, it can be concluded that Pt0, Pt2+, Cu+, and Cu2+ are present over the Cu@Pt/PGE surface.
Figure S3a displays the CV curves of the Cu@Pt/PGE recorded in 0.5 M H2SO4 solution at various scan rates. The capacitance value of the catalyst could be determined from the slope of the current density versus the scan rate plot, as shown in Figure S3b, and was found to be 730 μF. In comparison to a standard value of 20 μF.cm−2 for the Pt surface, the roughness factor was estimated to be 36.7.

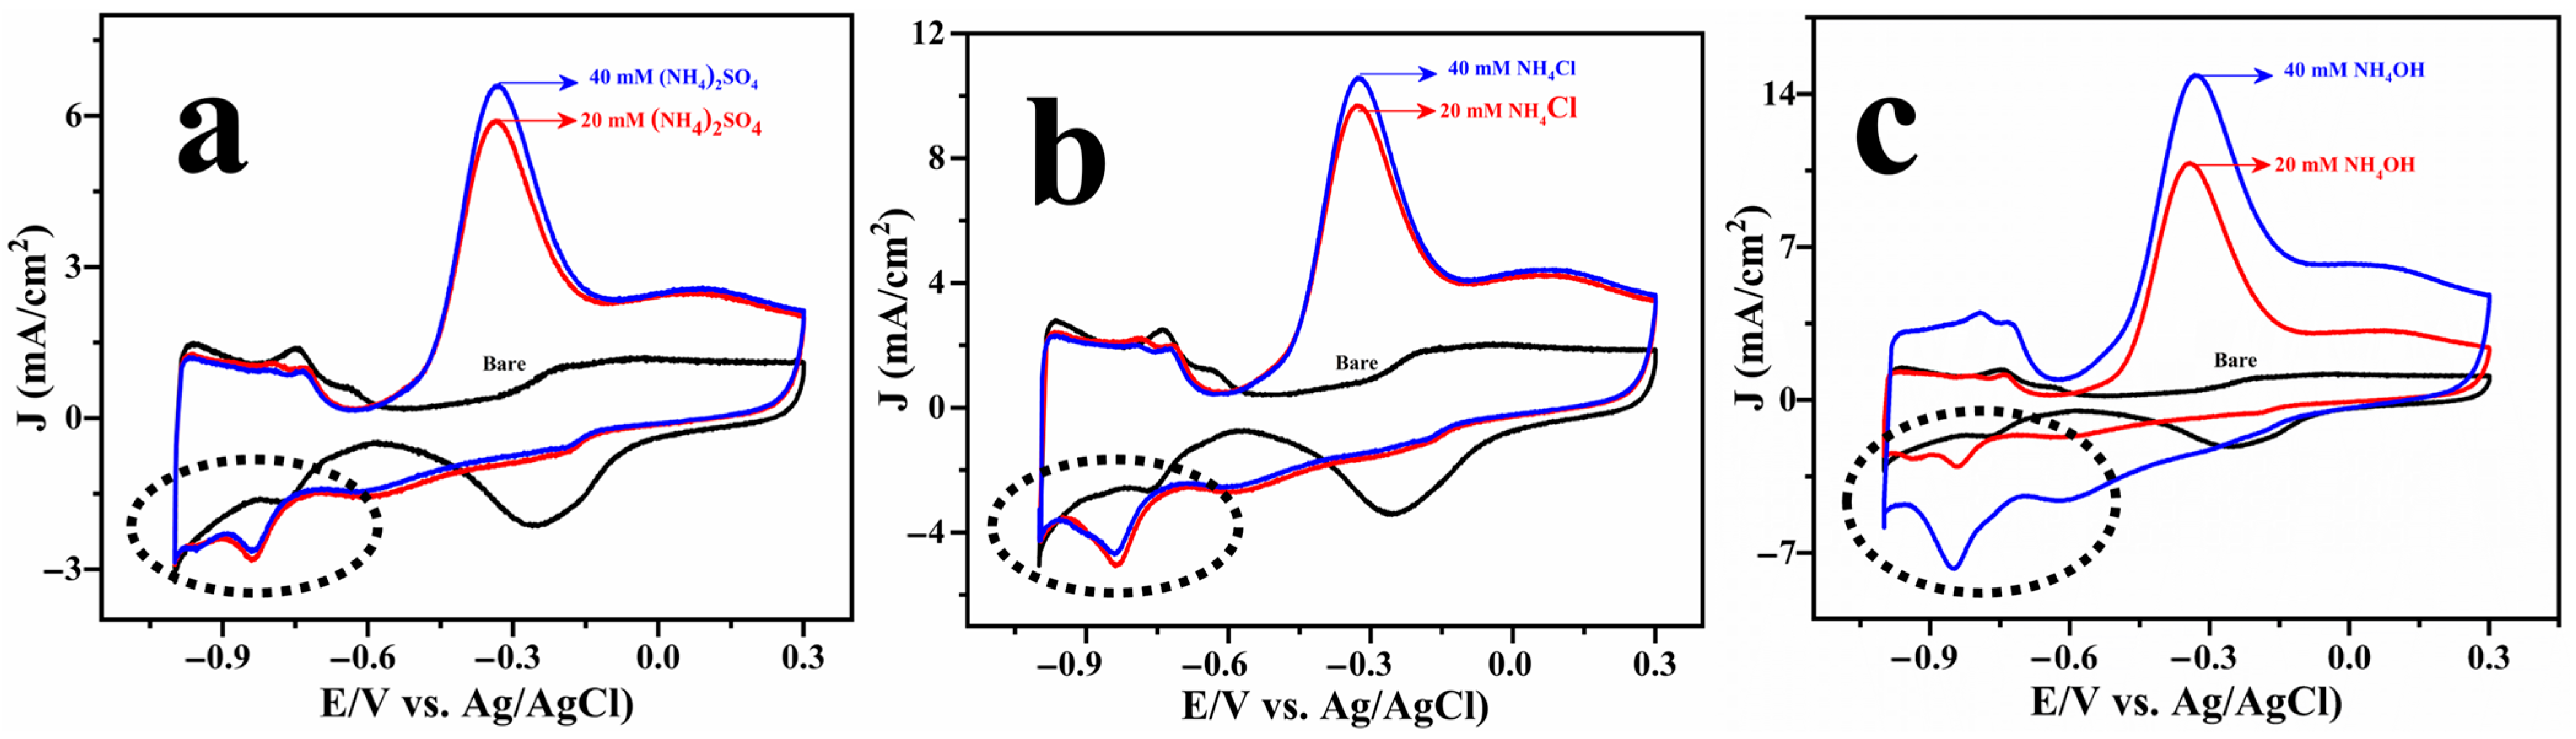
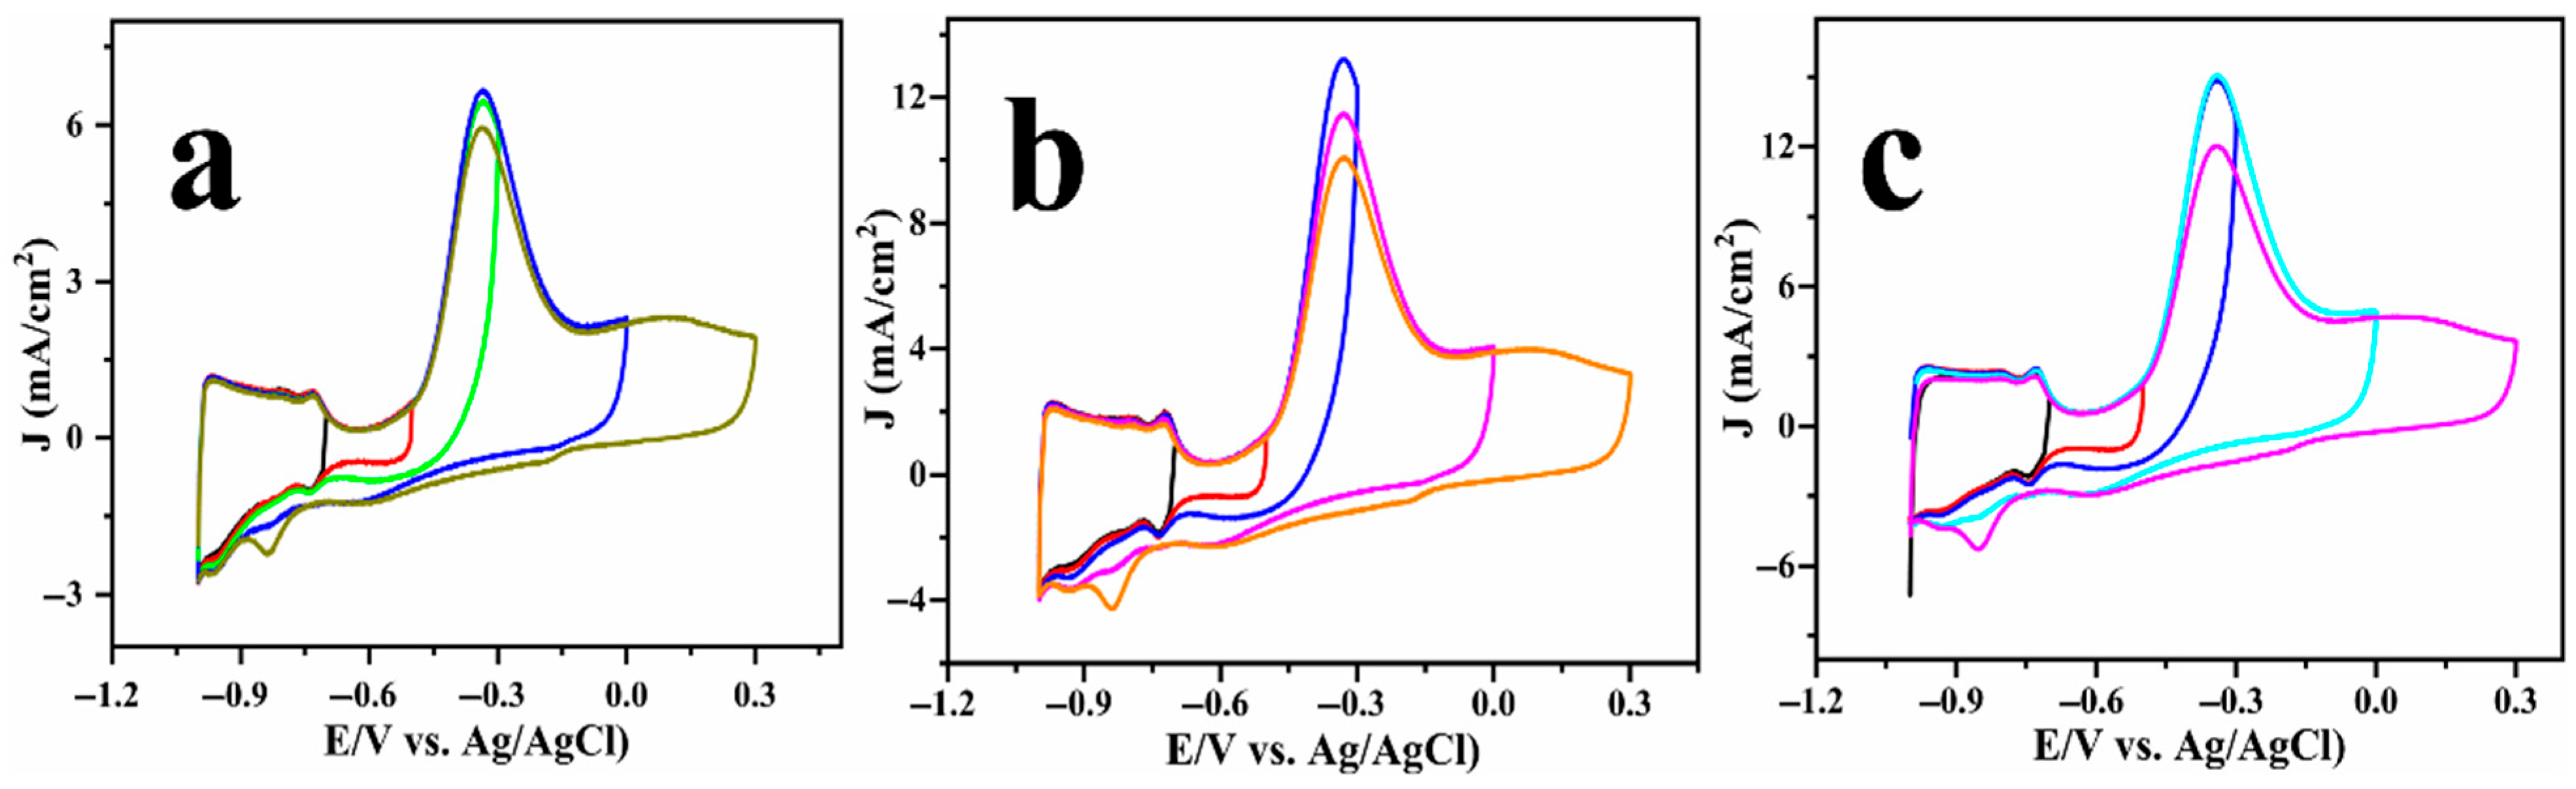
2.2. Electrocatalysis of Ammonia

Alkaline media are particularly advantageous towards AOR on Pt electrodes due to both mechanistic and electrochemical factors that can enhance reaction efficiency. Alkaline media provide an efficient electrolyte system with improved conductivity, allowing for typical alkaline fuel cell assemblies and minimal contamination effects from competing reactions [25]. Oswin and Salmon conducted early investigations in the kinetics of the ammonia oxidation over platinum black, examining the Tafel slopes with Langmuir and Temkin adsorption isotherms. They proposed a sequential dehydrogenation mechanism in which N H 3 undergoes consecutive dehydrogenation to yield N a d s and N 2 formed by the dimerisation of two N a d s atoms [26]. A different mechanism was presented by Maurer and Gerischer, in which ammonia (deprotonated by hydroxyl ions) and O H radicals simultaneously adsorbed over the surface, leading to the formation of N H x (x = 1, 2) radicals, N H y (y = 2, 4), or N 2 H 3 radicals [27]. The deprotonation of ammonia is facilitated by the abundant hydroxide ions ( O H ) in alkaline environments, encouraging the formation of adsorbed intermediates such as * N H 2 and *NH. These surface-bound radicals recombine and create N 2 H x or N 2 which eventually desorb from the surface. Surface-enhanced Raman spectroscopy (SERS), rotating ring-disk electrode (RRDE) studies, and differential electrochemical mass spectrometry (DEMS) have confirmed the brief presence of N 2 H x species [28,29,30]. Alkaline media also facilitate the reduction of catalyst poisoning by enhancing the removal of strongly adsorbed nitrogen species. O H ions facilitate the oxidation of these species to soluble forms, including nitrate ( N O 3 ) and nitrite ( N O 2 ), hence regenerating active sites on the Pt surface. Conversely, under acidic circumstances, a deficiency of O H ions may elevate the presence of poisonous species and diminish catalytic efficacy.
Figure S4 displays the cyclic voltammogram of the Cu@Pt/PGE electrode and, in general, exhibits characteristic redox peaks. Notably, the peaks observed around −0.78 V (marked as a, f, and g) could be ascribed to the reversible hydrogen underpotential deposition over the Pt surface (HUPD). In addition, a composite peak (b) corresponds to hydrogen adsorption and/or oxide desorption, while the strong irreversible cathodic peak at −0.3 V could be attributed to the oxide desorption (c). During the positive scan, oxygen adsorption (e) and the oxide layer formation over the electrode surface (d) occur at closely related potentials. Additionally, diffusional desorption of hydrogen (h) was observed at −0.95 V. These electrochemical features align with the characteristic hydrogen and oxygen adsorption–desorption behavior typically seen on platinum surfaces, as reported in previous studies [31].
The electrochemical oxidation of ammonia was systematically investigated using Cu@Pt core–shell nanostructures in three different ammonia-containing electrolytes: ammonium sulphate, ammonium chloride, and ammonium hydroxide. The results are displayed in Figure 3. The CV profiles revealed that complete ammonia oxidation occurs at ~−0.32 V vs. Ag/AgCl across all systems. Figure S4b depicts a cyclic voltammogram of a Pt disc electrode (2 mm diameter) recorded in the absence and presence of ammonia. The voltammetric features associated with ammonia oxidation were observed to be very similar for both Cu@Pt/PGE and commercial Pt disc electrodes. However, the current density measured for the Pt disc was much lower than that of the Cu@Pt nanostructures. This discrepancy could be due to the low surface area of the Pt disc electrode, as well as morphological differences in the intrinsic catalytic activity.
As illustrated in Figure S5, peak current at −0.32 V increases linearly with the square root of the scan rate, suggesting a simple diffusion-controlled reaction in accordance with the Randles–Sevick equation across all the systems [32]. However, significant differences could be noticed in the onset potentials and current densities among the various electrolytes. Specifically, the onset potential for AOR in ammonium hydroxide was marginally more negative (−0.63 V vs. Ag/AgCl) than that in ammonium chloride and ammonium sulphate (−0.60 V vs. Ag/AgCl), suggesting an earlier activation of the process in the hydroxide medium. Furthermore, the maximum current density was attained in the hydroxide electrolyte (−15 mA.cm−2), significantly exceeding those observed in the sulphate and chloride systems, as shown in Figure 3.
Although all ammonia sources were equilibrated in 1 M KOH to achieve a 40 mM ammonia concentration, the AOR activity varied significantly depending on the precursor used. Ammonium hydroxide demonstrated a more negative onset potential with high current density compared to ammonium sulphate and ammonium chloride. While the alkaline environment ensures the thermodynamic conversion of N H 4 + to N H 3 in all cases, ammonium hydroxide introduces pre-dissolved N H 3 without accompanying buffering ions, potentially facilitating more efficient N H 3 transport to the catalyst surface. In contrast, N H 4 + salts necessitate interfacial deprotonation and could be affected by anion-specific effects (e.g., Cl or S O 4 2 ) that modify the local double-layer environment or compete for active sites.
A close examination of the cyclic voltammograms reveals a small cathodic peak at −0.8 V (highlighted by the dashed circle in Figure 3), which is consistently observed across all ammonia systems. To probe the origin of this feature, a series of CV scans were recorded using a fixed lower potential and a varying upper potential, and the results are displayed in Figure 4. Notably, the cathodic peak is not observed when the upper potential is limited to −0.3 V, but becomes increasingly evident as the anodic sweep extends to 0 V and further to +0.3 V. It is obvious that the surface state of platinum significantly affects the AOR pathway and product distribution. At anodic potentials exceeding 0.3 V, the platinum surface experiences oxidative adsorption of oxygen-containing species (e.g., O H , O*), ultimately resulting in the formation of platinum oxides (Pt-OH and Pt-O, as observed in Figure S4). These oxides act as active species, promoting the oxidation of intermediate species, such as *NH2 or *NO, which consequently alters the product distribution to form nitrate, which agrees with previous reports [13,24,33,34,35]. Conversely, when the anodic potential is constrained and the surface is primarily metallic or partially oxidised, the anodic oxidation reaction (AOR) typically concludes at dinitrogen (N2) as the final product, which is thermodynamically favourable yet kinetically slow.
The kinetic parameters corresponding to the AOR can be obtained through Tafel slope analysis and electrochemical impedance spectroscopy (EIS); the data are presented in Figure 5. The Tafel plots, as shown in Figure 5a–c, for the three ammonia sources display three distinct linear regions, each with varying Tafel slope values, reflecting differences in reaction kinetics throughout the potential range. The initial Tafel slope observed at more negative potentials (region-a), spanning from −0.49 to −0.38 V, is typically associated with the desorption of oxides from the Pt surface. The subsequent lower-slope region (region-b) extending from −0.38 to −0.29 V indicates facile electron transfer for AOR. At more positive potentials, region-c (−0.29 to −0.2 V) indicates an increase in the slope, which is likely attributed to the accumulation of adsorbed intermediates that impede the reaction progress. Notably, ammonium hydroxide (Figure 5c) exhibits the lowest Tafel slope in the kinetic region, indicating more favourable reaction kinetics. The presence of multiple linear ranges in Tafel slopes is well reported in the literature, specifically for intricate electrocatalytic processes such as AOR, where variations in surface coverage and reaction intermediates can induce transitions between distinct kinetic regimes [36,37].
Complementary EIS measurements were conducted at different DC potentials as shown in Figure 5d–f. The data were fitted using the LR(CR(QR)) circuit, commonly employed in fuel cell studies [38,39], to determine the charge-transfer resistance (Rct) as shown in Table S1. It is noted that the Rct value decreased with the DC potential and achieved a minimum value of 77.12 Ω when the potential reached a value corresponding to ammonia oxidation (close to −0.3 V). As the potential was further increased to 0 V, the Rct increased again, which could be attributed to the formation of Pt surface oxides, as evidenced by the CV profiles in Figure S4. A significantly lower charge-transfer resistance and a low Tafel slope illustrate the facile kinetics of the reaction towards ammonia oxidation.
From the studies, it has been demonstrated that the formation of surface oxides and hydroxyl group adsorption occurs near ammonia oxidation, suggesting a complex interplay between surface oxidation and catalytic activity, since AOR proceeds via successive dehydrogenation steps, where adsorbed O H species facilitate the catalytic reaction with a variety of intermediates governing the product distribution. Under these competing surface reactions, achieving the long-term stability of the catalyst is a significant challenge. As exhibited in Figure S6a–c, the stability of the catalyst deteriorates with potential cycling (1000 potential cycles) in all the electrolyte solutions; this is attributed to the accumulation of reaction intermediates/products and surface-oxides [40]. These surface oxides inhibit the reaction kinetics and impede the N-N bond formation, particularly in the AOR region spanning −0.4 V to +0.1 V vs. Ag/AgCl.
After 1000 potential cycles, a post-analysis was performed using SEM to assess the integrity of the catalyst ; however, the structural dendritic features were largely retained, as illustrated in Figure 6a–c. EDX mapping analysis further indicated that a significant amount of Pt has been washed off during potential cycling, as shown in Figure 6d,e. However, a 78% catalyst regeneration was observed after subjecting the electrode to an applied potential of −1.0 V vs. Ag/AgCl for 5 min. Figure S6d demonstrates that this brief treatment has effectively helped in removing the excess oxide on the catalyst surface, thereby enhancing catalytic activity.
Table 1 shows the performance comparison of different electrode materials toward ammonia electro-oxidation. The copper–platinum core–shell nanostructures evaluated in the present work exhibit an excellent catalytic performance that is significantly higher than the reported values. For instance, the onset potential observed in this study was −0.63 V, representing one of the lowest values documented for the electro-oxidation of ammonia. The current densities observed in this study are among the highest for a given concentration of ammonia.

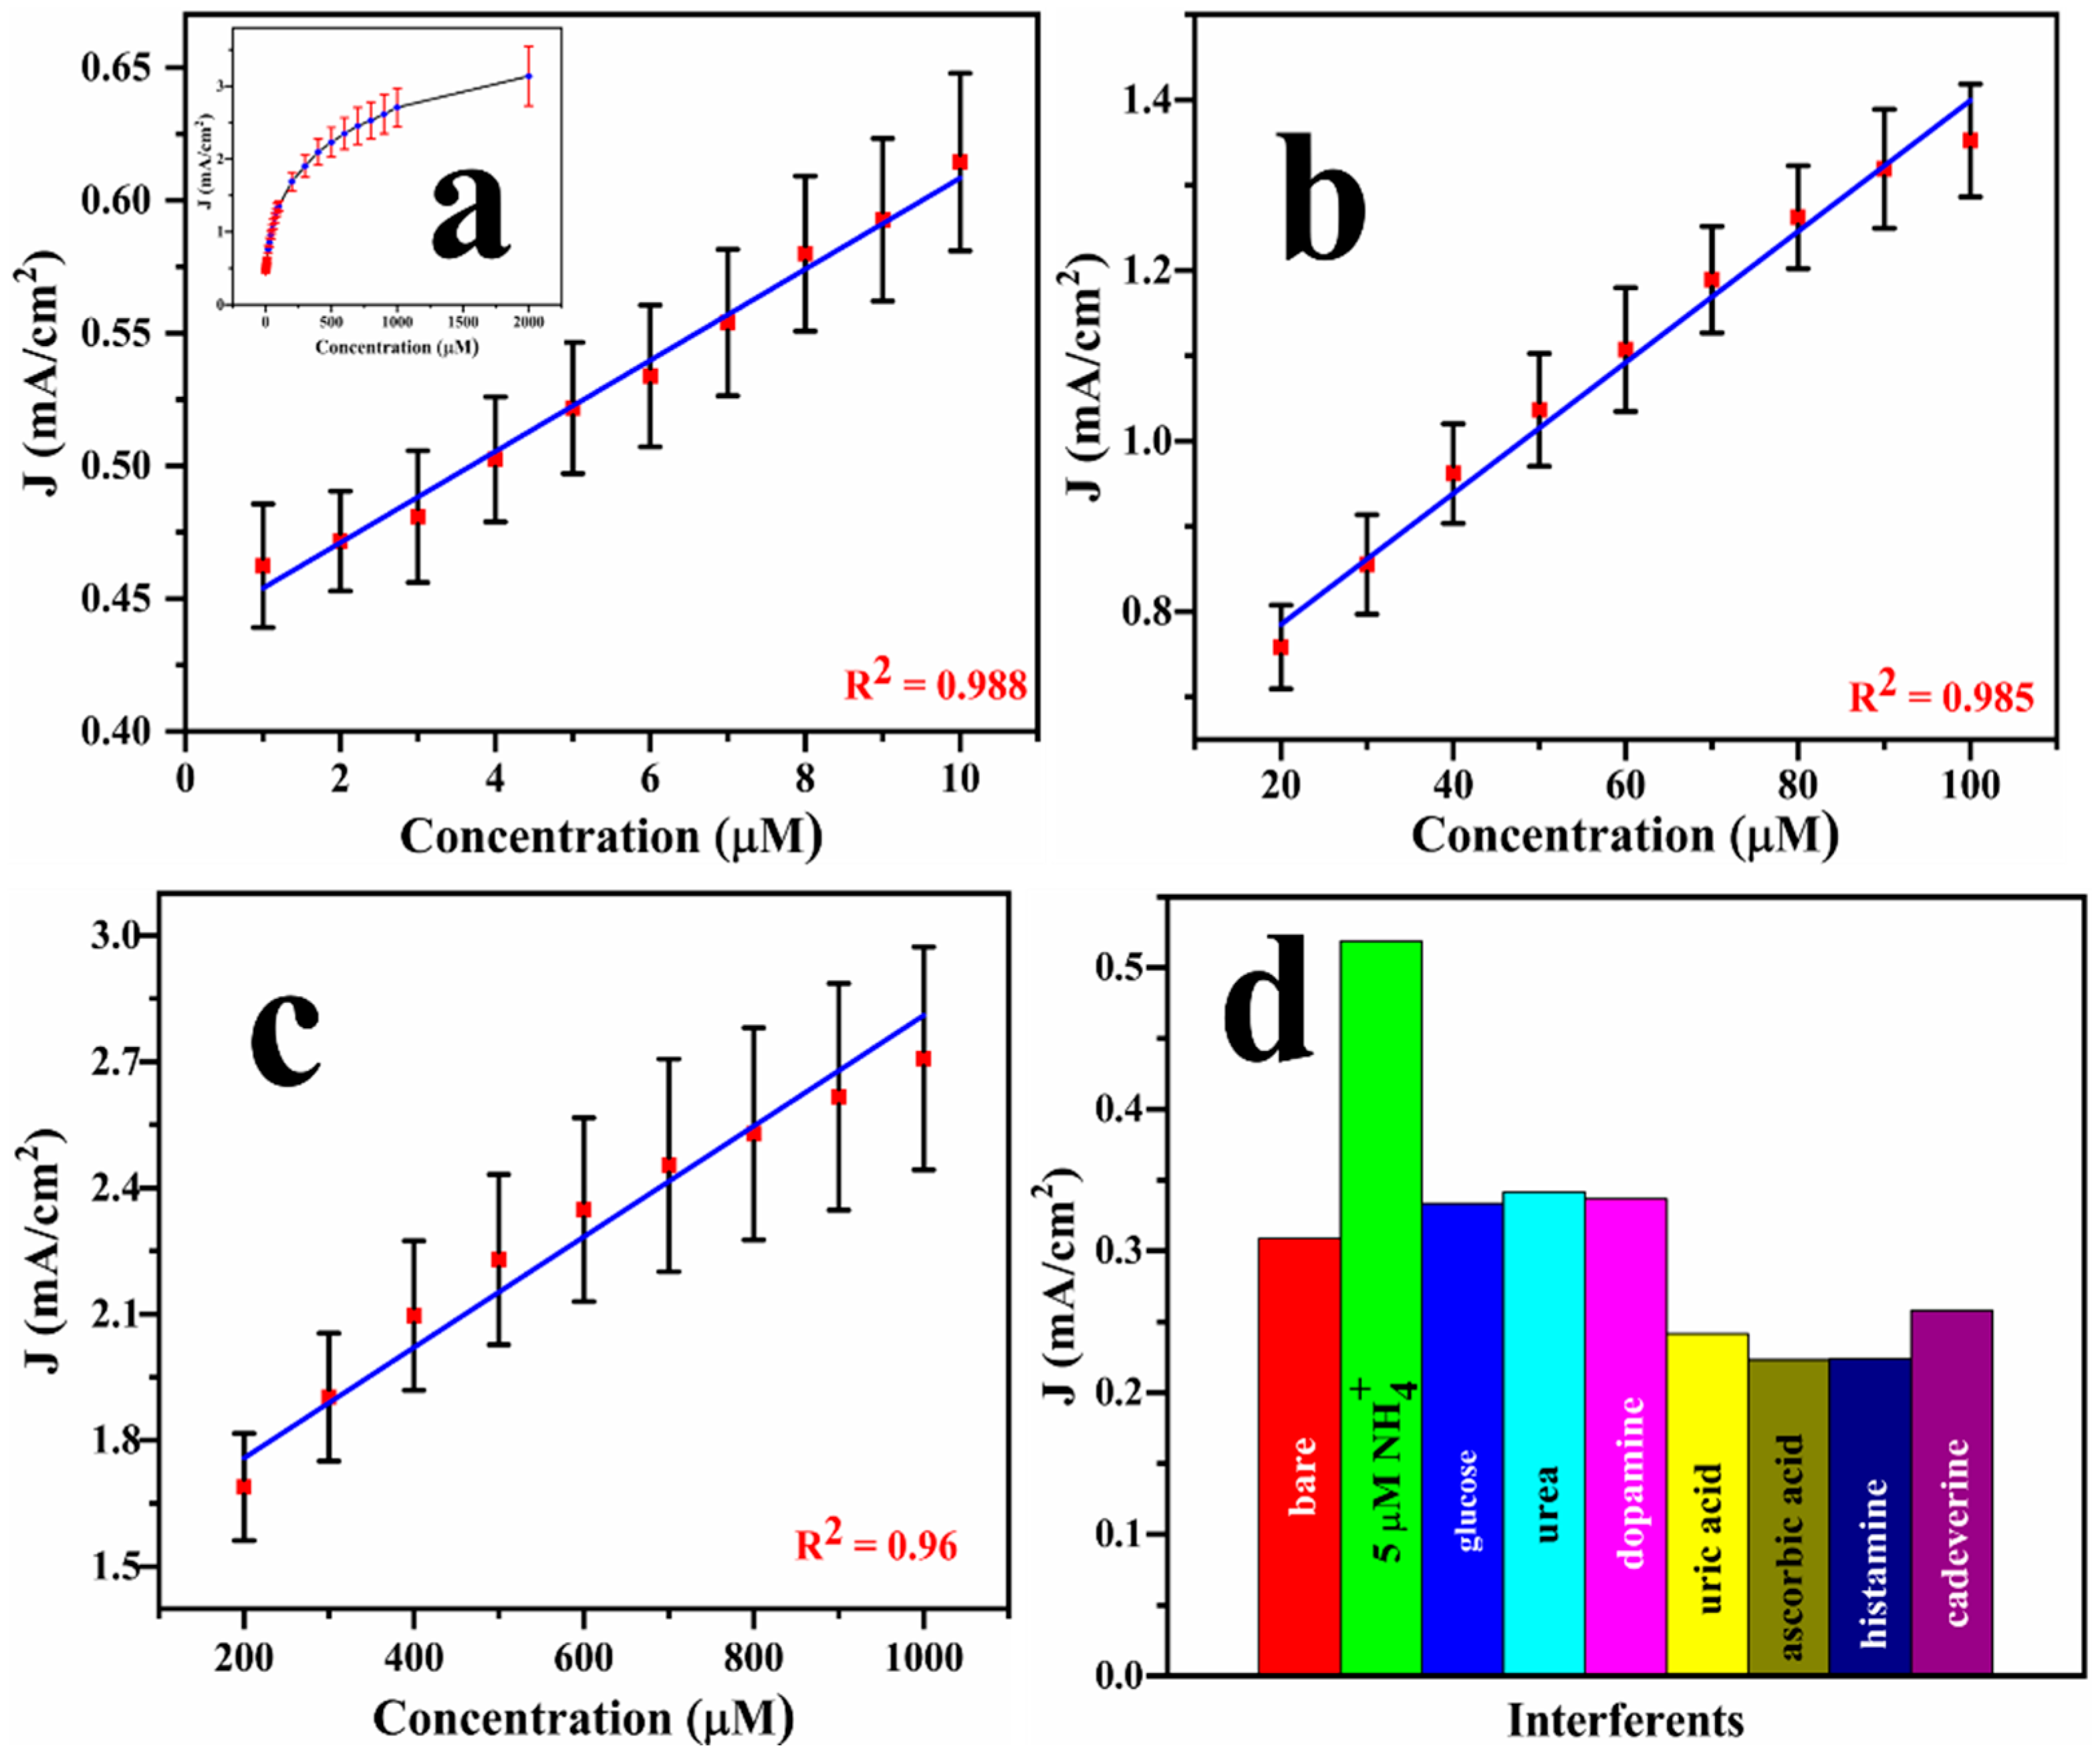
2.3. Electroanalysis of Ammonia

The prepared Cu@Pt core–shell nanostructures were also investigated for their performance in the electrochemical detection of ammonia. From the CV studies discussed earlier, ammonia undergoes electrochemical oxidation at −0.3 V, potentially leading to several products according to the Gerischer and Mauerer mechanism [27]. Differential pulse voltammetry (DPV) was performed to quantitatively evaluate the correlation between the concentration of the ammonia and oxidation current, as displayed in Figure S7. A pronounced peak with elevated current density at a potential near 0.0 V vs. Ag/AgCl results from oxide formation on the catalyst, exhibiting minimal dependence on electrolyte composition. The oxidation peak associated with ammonia oxidation increased with its concentration.
A calibration graph can be extracted from the DPV results, as exhibited in the inset in Figure 7a. However, instead of getting a linear response, the DPV data shows three different linear ranges within three distinct concentrations: 1–10 μM (R2 = 0.988), 20–100 μM (R2 = 0.985), and 200–1000 μM (R2 = 0.96), as displayed in Figure 7a–c. From the DPV results, the maximum sensitivity of the sensor was calculated to be 1.65 mA/μM.cm2 with the lower limit of detection (LOD = 3σ/S, σ represents standard deviation and S = sensitivity) of 0.78 μM. These parameters were benchmarked against the existing literature (Table 2), underscoring the excellent detection performance of Cu@Pt/PGE nanostructures in terms of both selectivity and detection limit. To evaluate the selectivity of the designed sensor, several potentially interfering species, such as urea, glucose, cadaverine, dopamine, and uric acid, were spiked (each at 500 μM) into a solution containing 5 μM of ammonia, and the DPV response was recorded. As shown in Figure 7d, the addition of ammonia resulted in a significantly higher current compared to the bare electrolyte. In contrast, the addition of interfering species did not provide any changes in the ammonia response, demonstrating the high selectivity of the developed sensor towards ammonia.
In recent studies, a variety of electrocatalysts have been investigated for electrocatalysis/electroanalysis of ammonia; however, their broader application is often limited by complex fabrication processes, high noble metal content, and low catalytic activity. In contrast, the Cu@Pt/PGE developed in this study could be fabricated rapidly without compromising the activity. The catalyst not only exhibits superior catalytic activity, enabling efficient dehydrogenation, but also functions effectively as a sensor for the quantitative detection of ammonia.

3. Materials and Methods

Copper chloride (CuCl2), sodium chloride (NaCl), sodium dodecyl sulphate (SDS), potassium hydroxide (KOH), chloroplatinic acid hexahydrate (H2PtCl6.6H2O), ammonium sulfate (NH4)2SO4, urea (NH2CONH2), dopamine (C8H11NO2), histamine (C5H9N3), cadaverine (C5H14N2), glucose (C6H12O6), uric acid (C5H4NO3), and ascorbic acid (C6H8O6) were procured from Sigma-Aldrich (St. Louis, MO, USA) . Ammonium hydroxide (NH4OH, 25–28%), ammonium chloride (NH4Cl), and sulphuric acid (H2SO4) were purchased from Dae-Jung Chemicals (Gyeonggi-do, South Korea). Deionized water was used for the preparation of aqueous solutions. Commercially available pencil graphite lead (PGE, Faber-Castell polymer lead, 0.7 mm HB) with an exposed area of 1 cm2 was used as the electrode substrate.
Cu@Pt core–shell nanostructures were prepared on PGE substrate in two steps. Initially, copper nanostructures on PGE (Cu/PGE) were created using electrodeposition, as previously reported [19,55]. In brief, the copper deposition process involved 15 mM CuCl2 precursor, 0.1 M NaCl electrolyte, and 14 mM SDS template under amperometric conditions at −0.7 V vs. SCE for 300 s. Before proceeding, the Cu/PGE electrodes were cleaned and dried with deionized water. Platinum was deposited on Cu/PGE using the galvanic replacement reaction (GRR) in 1 mM H2PtCl6 and 0.1 M HClO4 as a supporting electrolyte. The replacement reaction was monitored using the open-circuit potential (OCP). The modified electrodes (Cu@Pt/PGE) were cleaned and dried at room temperature and then used for further studies. The electrodeposited copper acted as a sacrificial template for the platinum modification, since the direct deposition of platinum was not possible due to the less adhesive nature of Pt on the electrode surface.
The electrochemical measurements were performed using a Zive SP1 (Seoul, South Korea) electrochemical workstation, configured with a conventional three-electrode setup. The working electrode consisted of either the bare pyrolytic graphite electrode (PGE) or a modified PGE, while the reference electrode was a saturated calomel electrode (SCE, satd. KCl) or Ag/AgCl (satd. KCl), and a platinum wire served as the counter electrode. The electro-oxidation of ammonia was performed in 20 mL of electrolyte containing 1 M KOH and mM ammonium solution. For the quantitative electroanalysis of ammonia, differential pulse voltammetry (DPV) was conducted within a potential range of −0.7 V to +0.3 V vs. Ag/AgCl reference electrode, with varying concentrations of ammonium chloride. DPV measurements were performed at a scan rate of 50 mV/s with a step potential of 5 mV, a pulse width of 50 ms, and a pulse amplitude of 50 mV. Electrochemical impedance analysis was conducted across a frequency spectrum ranging from 1 Hz to 100 kHz, utilizing a perturbation amplitude of 5 mV at various applied potentials. The morphology of the catalysts was characterised using a Hitachi SU-8600 (Hitachi High-Tech corporation, Seoul, South Korea) field-emission scanning electron microscope (FESEM) at the Smart Materials Research Centre for IoT at Gachon University (Seongnam-si, Republic of Korea). To assess the surface composition and electronic states, X-ray photoelectron spectroscopy (XPS) was conducted using a Thermo Scientific (Thermo Fisher Scientific, Seoul, South Korea) K-alpha device. An X-ray diffractometer (XRD) with a D8 focus, manufactured by Bruker, Germany, equipped with a Cu Kα source (λ = 1.54060 Å) and a step size of 0.05°, was used to evaluate the crystalline nature of the sample.
Cyclic voltammetry was employed to determine the electrochemical surface area (ECSA) from the double-layer capacitance (Cdl) in the non-faradaic regions in a 0.5 M H2SO4 solution at various scan rates. The ECSA was calculated using the formula Cdl/Cs, where the Cs value of 20 μF/cm2 is the standard capacitance value for the Pt metal surface [56,57].

4. Conclusions

In this study, Cu@Pt core–shell nanostructures were successfully electrodeposited on a cost-effective pencil graphite electrode, enabling a bifunctional platform for both the electrocatalysis and electroanalysis of ammonia. The core–shell architecture efficiently reduced noble metal consumption while preserving superior catalytic efficacy. The catalyst exhibited exceptional stability over 1000 potential cycles, achieving 78% regeneration through electrochemical treatment. Quantitative detection of ammonia was performed using Cu@Pt/PGE enabling sensitive and selective detection of ammonia. Owing to its rapid synthesis, dual functionality, and cost-effectiveness, Cu@Pt/PGE offers great potential for the simultaneous monitoring and remediation of ammonia, particularly in industrial effluents and denitrification systems, making it highly relevant for both environmental and energy-related applications.

Supplementary Materials

The following supporting information can be downloaded at: https://www.mdpi.com/article/10.3390/inorganics13070241/s1, Figure S1: Variation in the open circuit potential during galvanic replacement reaction of Pt over Cu/PGE. Figure S2: FESEM images of Cu/PGE at different magnifications (a–c). Figure S3: Double layer capacitance (a) and capacitive currents as a functional of scan rate (b) for Cu@Pt/PGE. Figure S4: CV of Cu@Pt/PGE electrode in 1 M KOH electrolyte with 50 mV/s scan rate exhibiting characteristic redox peaks (a) and CV of Pt disc electrode in the absence and presence of ammonium sulphate (b). Figure S5: Typical voltammogram showing AOR in 1 M KOH electrolyte at various scan rates and the corresponding linearity for ip vs ν1/2 using Cu@Pt/PGE in the presence of ammonium sulphate (a,b), ammonium chloride (c,d), and ammonium hydroxide (e,f). Figure S6: Cycle life stability of Cu@Pt/PGE in 1 M KOH and 40 mM of ammonia solution (a–c) and regeneration of the catalyst after 1000 cycles in ammonium hydroxide solution (d); a-Ammonium sulphate, b-Ammonium chloride and c-ammonium hydroxide. Figure S7: Differential pulse voltammetric response of Cu@Pt core-shell nanostructures for lower (a) and higher (b) concentrations of ammonium chloride in 1 M KOH solution with a scan rate of 50 mV/s; Table S1: Equivalent circuit elements measured using LR(CR(QR)) for Cu@Pt/PGE during ammonia oxidation in 1 M KOH.

Author Contributions

B.N. prepared the catalyst and carried out the electrochemical experiments; B.N. carried out the characterization of the samples. S.-W.L. and B.N. analysed the results and wrote the paper. All authors have read and agreed to the published version of the manuscript.

Funding

This research was supported by the Basic Science Research Program through the National Research Foundation of Korea (NRF), funded by the Ministry of Education (No. RS-2021-NR060117).

Institutional Review Board Statement

Not applicable.

Informed Consent Statement

Not applicable.

Data Availability Statement

All the data will be available on request by the corresponding authors.

Acknowledgments

B.N. thanks Gachon University for financial assistance and providing research facilities.

Conflicts of Interest

The authors declare no conflicts of interest.

References

  1. Shi, Z.; Xi, L.; Wang, Y.; Zhao, X. Chronic Exposure to Environmental Pollutant Ammonia Causes Damage to the Olfactory System and Behavioral Abnormalities in Mice. Environ. Sci. Technol. 2023, 57, 15412–15421. [Google Scholar] [CrossRef] [PubMed]
  2. Nayak-Luke, R.M.; Hatton, L.; Cesaro, Z.; Banares-Alcantara, R. Assessing the Viability of Decarbonising India’s Nitrogenous Fertiliser Consumption. J. Clean. Prod. 2022, 366, 132462. [Google Scholar] [CrossRef]
  3. Li, M.; Beko, G.; Wargocki, P.; Lucic, G.; Williams, J. Human Ammonia Emission Rates under Various Indoor Environmental Conditions. Environ. Sci. Technol. 2020, 54, 5419–5428. [Google Scholar] [CrossRef]
  4. Zhang, T.-X.; Li, M.-R.; Liu, C.; Wang, S.-P.; Yan, Z.-G. A Review of the Toxic Effects of Ammonia on Invertebrates in Aquatic Environments. Environ. Pollut. 2023, 336, 122374. [Google Scholar] [CrossRef] [PubMed]
  5. Li, Q.; Liu, G.; Qi, L.; Wang, H.; Xian, G. Chlorine-Mediated Electrochemical Advanced Oxidation Process for Ammonia Removal: Mechanisms, Characteristics and Expectation. Sci. Total Environ. 2023, 896, 165169. [Google Scholar] [CrossRef]
  6. Munir, N.; Javaid, A.; Abideen, Z.; Jarar, H.; El-Keblawy, A.; Sheteiwy, M.S. The Potential of Zeolite Nanocomposites in Removing Microplastics, Ammonia, and Trace Metals from Wastewater and Their Role in Phytoremediation. Environ. Sci. Pollut. Res. 2023, 31, 1695–1718. [Google Scholar] [CrossRef]
  7. Cao, Q.; Li, X.; Li, N.; Li, Z.; Liu, X.; Li, D. Ammonia Removal through Combined Methane Oxidation and Nitrification-Denitrification and the Interactions among Functional Microorganisms. Water Res. 2021, 188, 116555. [Google Scholar] [CrossRef]
  8. Hassan, N.S.; Jalil, A.A.; Saravanan, R.; Izzuddin, N.M.; Bahari, M.B.; Prasetyoko, D.; Nugraha, R.E. Recent Progress on Electrocatalysts in Ammonia Electrooxidation Reaction for Clean Hydrogen Production. J. Mater. Chem. A 2024, 12, 23202–23217. [Google Scholar] [CrossRef]
  9. Cechanaviciute, I.A.; Schuhmann, W. Electrocatalytic Ammonia Oxidation Reaction: Selective Formation of Nitrite and Nitrate as Value-Added Products. ChemSusChem 2025, 18, e202402516. [Google Scholar] [CrossRef]
  10. Kostopoulos, N.; Robert, M.; Sekretareva, A. The Potential of Molecular Electrocatalysis for Ammonia-to-Dinitrogen Conversion. ChemElectroChem 2024, 11, e202300462. [Google Scholar] [CrossRef]
  11. Shi, H.; Tang, J.; Yu, W.; Tadé, M.O.; Shao, Z. Advances in Power Generation from Ammonia via Electrocatalytic Oxidation in Direct Ammonia Fuel Cells. Chem. Eng. J. 2024, 488, 150896. [Google Scholar] [CrossRef]
  12. Liu, H.; Yang, C.; Shao, Z.; Huang, Z. Electrocatalytic Ammonia Oxidation to Nitrite and Nitrate with NiOOH-Ni. Adv. Energy Mater. 2024, 14, 2401675. [Google Scholar] [CrossRef]
  13. Naveen, B.; Reddy, B.P.; Palathedath, S.K. Dual Performing Copper–Platinum Core–Shell Nanozyme for Environmental Electrochemistry–Electrocatalytic Oxidation and Electroanalysis of Ammonia. Environ. Sci. Nano 2021, 8, 3603–3612. [Google Scholar] [CrossRef]
  14. Johnston, S.; Suryanto, B.H.R.; MacFarlane, D.R. Electro-Oxidation of Ammonia on Electrochemically Roughened Platinum Electrodes. Electrochim. Acta 2019, 297, 778–783. [Google Scholar] [CrossRef]
  15. Wallace, S.W.; McCrum, I.T.; Janik, M.J. Ammonia Electro-Oxidation Mechanism on the Platinum (100) Surface. Catal. Today 2021, 371, 50–57. [Google Scholar] [CrossRef]
  16. Paliwal, A.; Assaf, L.; Long, H.; Haasch, R.T.; Gupta, J.K.; Reynolds, M.A.; Son, Y.J.; Zhang, K.; Kenis, P.J.A.; Gewirth, A.A. Mechanistic Insights into the Enhanced Ammonia Oxidation Activity of PtRh Electrodeposits. ACS Appl. Mater. Interfaces 2025, 17, 3383–3392. [Google Scholar] [CrossRef]
  17. Tang, H.; Gu, Y.; Luo, J.; Zhang, W.; Zhang, J.; Zhou, Y. Controlled Synthesis of Bead-like Pt as an Efficient Electrocatalyst for Electrocatalytic Ammonia Oxidation. ChemistrySelect 2024, 9, e202400482. [Google Scholar] [CrossRef]
  18. Pillai, H.S.; Li, Y.; Wang, S.-H.; Omidvar, N.; Mu, Q.; Achenie, L.E.K.; Abild-Pedersen, F.; Yang, J.; Wu, G.; Xin, H. Author Correction: Interpretable Design of Ir-Free Trimetallic Electrocatalysts for Ammonia Oxidation with Graph Neural Networks. Nat. Commun. 2023, 14, 950. [Google Scholar] [CrossRef]
  19. Naveen, B.; Lee, S.-W. Template-Assisted Electrodeposited Copper Nanostructres for Selective Detection of Hydrogen Peroxide. Molecules 2024, 29, 4571. [Google Scholar] [CrossRef]
  20. Shen, Z.; Liu, D.; Peng, G.; Peng, J.; Ding, L. Electrocatalytic Reduction of Nitrate in Water Using Cu/Pd Modified Ni Foam Cathode: High Nitrate Removal Efficiency and N2-Selectivity. Sep. Purif. Technol. 2020, 241, 116743. [Google Scholar] [CrossRef]
  21. Pinon-Espitia, M.; Lardizabal-Gutierrez, D.; Camacho-Rios, M.L.; Herrera-Perez, G.; Ochoa-Lara, M.T. Electronic Structure Comparison of Cu 2p and O 1s X-Ray Photoelectron Spectra for CuxO Nanofibers (x = 1, 2, i). Mater. Chem. Phys. 2021, 272, 124981. [Google Scholar] [CrossRef]
  22. Liu, X.; Song, X.; Jiang, G.; He, Y.; Dong, F. Pt Single-Atom Collaborate with Pt Atom-Clusters by an In-Situ Confined Strategy for Accelerating Electrocatalytic Hydrogen Evolution. Chem. Eng. J. 2024, 481, 148430. [Google Scholar] [CrossRef]
  23. Chen, L.; Kang, L.; Song, S.; Jia, H.; Wang, Y. Rational Design of Ultrafine Pt Nanoparticles with Strong Metal-Support Interaction for Efficient Hydrogen Evolution. Adv. Funct. Mater. 2024, 34, 2403467. [Google Scholar] [CrossRef]
  24. Matsui, T.; Suzuki, S.; Katayama, Y.; Yamauchi, K.; Okanishi, T.; Muroyama, H.; Eguchi, K. In Situ Attenuated Total Reflection Infrared Spectroscopy on Electrochemical Ammonia Oxidation over Pt Electrode in Alkaline Aqueous Solutions. Langmuir 2015, 31, 11717–11723. [Google Scholar] [CrossRef]
  25. Li, Y.; Pillai, H.S.; Wang, T.; Hwang, S.; Su, D.; Xin, H.; Yan, Y.; Wu, G. High-Performance Ammonia Oxidation Catalysts for Anion-Exchange Membrane Direct Ammonia Fuel Cells. Energy Environ. Sci. 2021, 14, 1449–1460. [Google Scholar] [CrossRef]
  26. Oswin, H.G.; Salomon, M. The Anodic Oxidation of Ammonia at Platinum Black Electrodes in Aqueous Koh Electrolyte. Can. J. Chem. 1963, 41, 1686–1694. [Google Scholar] [CrossRef]
  27. Gerischer, H.; Mauerer, A. Untersuchungen Zur Anodischen Oxidation von Ammoniak an Platin-Elektroden. J. Electroanal. Chem. Interfacial Electrochem. 1970, 25, 421–433. [Google Scholar] [CrossRef]
  28. Wang, H.; Dekel, D.R.; Abruña, H.D. Unraveling the Mechanism of Ammonia Electrooxidation by Coupled Differential Electrochemical Mass Spectrometry and Surface-Enhanced Infrared Absorption Spectroscopic Studies. J. Am. Chem. Soc. 2024, 146, 15926–15940. [Google Scholar] [CrossRef]
  29. Endo, K.; Katayama, Y.; Miura, T. A Rotating Disk Electrode Study on the Ammonia Oxidation. Electrochim. Acta 2005, 50, 2181–2185. [Google Scholar] [CrossRef]
  30. Vidal-Iglesias, F.J.; Solla-Gullón, J.; Pérez, J.M.; Aldaz, A. Evidence by SERS of Azide Anion Participation in Ammonia Electrooxidation in Alkaline Medium on Nanostructured Pt Electrodes. Electrochem. Commun. 2006, 8, 102–106. [Google Scholar] [CrossRef]
  31. Jaksic, M.; Johansen, B.; Tunold, R. Electrochemical Behaviour of Platinum in Alkaline and Acidic Solutions of Heavy and Regular Water. Int. J. Hydrogen Energy 1993, 18, 817–837. [Google Scholar] [CrossRef]
  32. Bard, A.J.; Faulkner, L.R. Electrochemical Methods Fundamentals and Applications, 2nd ed.; John Wiley and Sons: Noida, India, 2004. [Google Scholar]
  33. Nakata, K.; Okubo, A.; Shimazu, K.; Yamakata, A.; Ye, S.; Osawa, M. Surface-Enhanced Infrared Absorption Spectroscopic Studies of Adsorbed Nitrate, Nitric Oxide, and Related Compounds 1: Reduction of Adsorbed NO on a Platinum Electrode. Langmuir 2008, 24, 4352–4357. [Google Scholar] [CrossRef]
  34. Nakata, K.; Kayama, Y.; Shimazu, K.; Yamakata, A.; Ye, S.; Osawa, M. Surface-Enhanced Infrared Absorption Spectroscopic Studies of Adsorbed Nitrate, Nitric Oxide, and Related Compounds 2: Nitrate Ion Adsorption at a Platinum Electrode. Langmuir 2008, 24, 4358–4363. [Google Scholar] [CrossRef] [PubMed]
  35. Rima, F.R.; Nakata, K.; Shimazu, K.; Osawa, M. Surface-Enhanced Infrared Absorption Spectroscopic Studies of Adsorbed Nitrate, Nitric Oxide, and Related Compounds. 3. Formation and Reduction of Adsorbed Nitrite at a Platinum Electrode. J. Phys. Chem. C 2010, 114, 6011–6018. [Google Scholar] [CrossRef]
  36. Shinagawa, T.; Garcia-Esparza, A.T.; Takanabe, K. Insight on Tafel Slopes from a Microkinetic Analysis of Aqueous Electrocatalysis for Energy Conversion. Sci. Rep. 2015, 5, 13801. [Google Scholar] [CrossRef]
  37. van der Heijden, O.; Park, S.; Vos, R.E.; Eggebeen, J.J.J.; Koper, M.T.M. Tafel Slope Plot as a Tool to Analyze Electrocatalytic Reactions. ACS Energy Lett. 2024, 9, 1871–1879. [Google Scholar] [CrossRef]
  38. Asghari, S.; Mokmeli, A.; Samavati, M. Study of PEM Fuel Cell Performance by Electrochemical Impedance Spectroscopy. Int. J. Hydrogen Energy 2010, 35, 9283–9290. [Google Scholar] [CrossRef]
  39. Shen, J.; Wang, J. Analysis of Dc Link Oscillations in a Hybrid Fuel Cell Powertrain Brought by in Situ Converter Based Electrochemical Impedance Spectroscopy. Int. J. Hydrogen Energy 2020, 45, 31080–31090. [Google Scholar] [CrossRef]
  40. Adli, N.M.; Zhang, H.; Mukherjee, S.; Wu, G. Review—Ammonia Oxidation Electrocatalysis for Hydrogen Generation and Fuel Cells. J. Electrochem. Soc. 2018, 165, J3130–J3147. [Google Scholar] [CrossRef]
  41. Li, Y.; Pillai, H.S.; Lattimer, J.; Mohd Adli, N.; Karakalos, S.; Xin, H.; Wu, G. Ternary PtIrNi Catalysts for Efficient Electrochemical Ammonia Oxidation. ACS Catal. 2020, 10, 3945–3957. [Google Scholar] [CrossRef]
  42. Xu, W.; Walker, M.; Wu, Z.; Wang, H.; Tao, S. Directly Growing Hierarchical Nickel-Copper Hydroxide Nanowires on Carbon Fibre Cloth for Efficient Electrooxidation of Ammonia. Appl. Catal. B Environ. 2017, 218, 470–479. [Google Scholar] [CrossRef]
  43. Xu, W.; Du, D.; Lan, R.; Wu, Z.; Irvine, J.T.S.; Tao, S. Electrodeposited NiCu Bimetal on Carbon Paper as Stable Non-Noble Anode for Efficient Electrooxidation of Ammonia. Appl. Catal. B Environ. 2018, 237, 1101–1109. [Google Scholar] [CrossRef]
  44. Almomani, F.; Bhosale, R.; Khraisheh, M.; Kumar, A.; Tawalbeh, M. Electrochemical Oxidation of Ammonia on Nickel Oxide Nanoparticles. Int. J. Hydrogen Energy 2020, 45, 10398–10408. [Google Scholar] [CrossRef]
  45. Chan, Y.T.; Siddharth, K.; Shao, M. Investigation of Cubic Pt Alloys for Ammonia Oxidation Reaction. Nano Res. 2020, 13, 1920–1927. [Google Scholar] [CrossRef]
  46. Matin, M.A.; Kim, S.; Byun, S.; Kim, H.-C. PtZn Alloy Nanoparticles with Enhanced Activity and Stability Synthesized by a Simplified Polyol Process for Electro-Oxidation of Ammonia. J. Power Sources 2024, 591, 233885. [Google Scholar] [CrossRef]
  47. Xue, Q.; Zhao, Y.; Zhu, J.; Ding, Y.; Jin, P.; Yin, S.; Chen, Y. PtRu Nanocubes as Bifunctional Electrocatalysts for Ammonia Electrolysis. J. Mater. Chem. A 2021, 9, 8444–8451. [Google Scholar] [CrossRef]
  48. Karakuş, S.; Baytemir, G.; Özeroğlu, C.; Taşaltın, N. An Ultra-Sensitive Smartphone-Integrated Digital Colorimetric and Electrochemical Camellia Sinensis Polyphenols Encapsulated CuO Nanoparticles-Based Ammonia Biosensor. Inorg. Chem. Commun. 2022, 143, 109733. [Google Scholar] [CrossRef]
  49. Yang, S.; Zang, G.; Zhang, G.; Zhao, Y.; Li, H.; Zhang, Y. In-Situ Growth of 3D Rosette-like Copper Nanoparticles on Carbon Cloth for Enhanced Sensing of Ammonia Based on Copper Electrodissolution. Anal. Chim. Acta 2020, 1104, 60–68. [Google Scholar] [CrossRef]
  50. Zhang, L.; Wei, L.; Liu, J.; Gu, J.; Suo, H.; Zhao, C. One Step and in Situ Synthesis of Ni Foam-Supported Pt-Ni(OH)2 Nanosheets as Electrochemical Sensor for Ammonia–Nitrogen Detection. Mater. Lett. 2022, 318, 132197. [Google Scholar] [CrossRef]
  51. Lu, H.; Hu, J.; Zhang, S.; Long, M.; Tang, A. Cuprous Oxide and Ag Modified Titanium Dioxide Electrode for Ultra-Sensitive Detection of Ammonia Nitrogen. J. Electroanal. Chem. 2023, 949, 117842. [Google Scholar] [CrossRef]
  52. Zhao, H.; Li, Y.; Cong, A.; Tong, J.; Bian, C. Ultramicro Interdigitated Array Electrode Chip with Optimized Construction for Detection of Ammonia Nitrogen in Water. Micromachines 2023, 14, 629. [Google Scholar] [CrossRef] [PubMed]
  53. Zhang, C.; Zhang, L.; Wei, L.; Cai, H.; Gu, J.; Wang, X. Anchoring Platinum Nanofibers on Nickel Hydroxide Nanosheets for Electrochemical Detection of Ammonia-Nitrogen in the Aqueous Environment. Mater. Lett. 2023, 336, 133868. [Google Scholar] [CrossRef]
  54. Zhang, L.; Liu, J.; Peng, X.; Cui, Q.; He, D.; Zhao, C.; Suo, H. Fabrication of a Ni Foam-Supported Platinum Nanoparticles-Silver/Polypyrrole Electrode for Aqueous Ammonia Sensing. Synth. Met. 2020, 259, 116257. [Google Scholar] [CrossRef]
  55. Naveen, B.; Lee, S.-W. Surfactant Mediated Electrodeposition of Cu-Ag Nanostructures on Pencil Graphite Electrodes for Amperometric Detection of Nitrate. Microchem. J. 2025, 214, 114090. [Google Scholar] [CrossRef]
  56. Sharma, R.; Gyergyek, S.; Andersen, S.M. Critical Thinking on Baseline Corrections for Electrochemical Surface Area (ECSA) Determination of Pt/C through H-Adsorption/H-Desorption Regions of a Cyclic Voltammogram. Appl. Catal. B Environ. 2022, 311, 121351. [Google Scholar] [CrossRef]
  57. Shao, M.; Odell, J.H.; Choi, S.-I.; Xia, Y. Electrochemical Surface Area Measurements of Platinum- and Palladium-Based Nanoparticles. Electrochem. Commun. 2013, 31, 46–48. [Google Scholar] [CrossRef]
Figure 1. FE-SEM (ac) images of Cu@Pt nanostructures at varying magnifications. Elemental maps of Cu@Pt/PGE (df) along with the EDX analysis (g) and the particle size distribution (h).
Inorganics 13 00241 g001
Figure 2. XPS survey spectra of fabricated Cu@Pt/PGE (a); elemental spectra of Cu (b); elemental spectra for Pt (c); and the diffraction spectra of Cu@Pt/PGE (d).
Inorganics 13 00241 g002
Figure 3. Cyclic voltammogram of Cu@Pt/PGE electrode tested in 1 M KOH solution with different concentrations of ammonia: (NH4)2SO4 (a), NH4Cl (b), and NH4OH (c).
Inorganics 13 00241 g003
Figure 4. Cyclic voltammogram of Cu@Pt/PGE electrode tested in 1 M KOH solution with a constant lower potential limit of −1 V and varying upper potential limit: (NH4)2SO4 (a), NH4Cl (b), and NH4OH (c).
Inorganics 13 00241 g004
Figure 5. Tafel slopes (ac) and Nyquist plots (df) for Cu@Pt/PGE in 1 M KOH containing 20 mM of ammonium sulphate (a,d), ammonium chloride (b,e), and ammonium hydroxide (c,f).
Inorganics 13 00241 g005
Figure 6. FE-SEM images (ac), EDX analysis (d,e) of Cu@Pt/PGE nanostructures at different magnifications after electrocatalysis of ammonia.
Inorganics 13 00241 g006
Figure 7. Calibration graphs for the designed sensor using DPV for the successive addition of ammonium chloride at various concentrations from 1 to 2000 μM (inset) and from 1 to 10 μM (a), 20–100 μM (b), and 200–1000 μM (c), and interference analysis performed using Cu@Pt/PGE in different functional groups of analytes (d).
Inorganics 13 00241 g007
Table 1. Performance comparison of different electrocatalysts towards AOR.
Electrode
Material
Ammonia
Concentration (mM)
Onset
Potential (V) *
J (max)
mA/cm2
Ref.
PtIrNi1000.20-[41]
Ni0.8Cu0.2 LHs550.4335[42]
NiCu/CP550.47-[43]
NiO-TiO25001.223.7[44]
Pt-Zn nanocube100−0.19-[45]
PtZn20−0.627.5[46]
PtxRu nanocube100−0.19-[47]
Cu@Pt/PGE20−0.6311.2Present work
* V vs. Ag/AgCl (sat. KCl).
Table 2. Performance comparison of various electrochemical sensors for the detection of ammonia.
Electrode
Material
MethodLinear Range (μM)Sensitivity
(μA·μM−1)
LODRef.
PPS-CuO NPsCV12.5–1008.4840.6 nM[48]
Cu NPs/CCi-t5–94250.00621.25 μM[49]
Pt-Ni(OH)2DPV0.05–6000.19139.2 nM[50]
Ag/Cu2O/TNTsi-t0.1–1014.94074 nM[51]
UME/MWCNTi-t10–600.0498.69 μM[52]
Pt-Ni(OH)2-NFDPV5–50012.272.74 μM[53]
Pt-Ag/PPYCV0.05–508.937 nM[54]
Cu@Pt/PGEDPV200–1000
20–100
1–10
1.65780 nMPresent work
Disclaimer/Publisher’s Note: The statements, opinions and data contained in all publications are solely those of the individual author(s) and contributor(s) and not of MDPI and/or the editor(s). MDPI and/or the editor(s) disclaim responsibility for any injury to people or property resulting from any ideas, methods, instructions or products referred to in the content.

