Article

Uncooled Microbolometers Based on Nitrogen-Doped Hydrogenated Amorphous Silicon-Germanium (a-SiGe:H,N)

1
Electronics Coordination, Instituto Nacional de Astrofísica, Óptica y Electrónica, Tonantzintla, Puebla 72840, Mexico
2
Centro de Investigaciones en Dispositivos Semiconductores (CIDS-ICUAP), Benemérita Universidad Autónoma de Puebla (BUAP), Col. San Manuel, Cd. Universitaria, Av. San Claudio y 14 Sur, Edificios IC5 y IC6, Puebla 72570, Mexico
3
Ingeniería Mecánica, Tecnológico Nacional de México/I.T. Puebla, Av. Tecnológico #420 Col. Maravillas, Puebla 72220, Mexico
4
Área de Ingeniería, Benemérita Universidad Autónoma de Puebla, Ciudad Universitaria, Blvd. Valsequillo y Esquina Av. San Claudio s/n, Col. San Manuel, Puebla 72570, Mexico
*
Author to whom correspondence should be addressed.
Inorganics 2025, 13(4), 126; https://doi.org/10.3390/inorganics13040126
Submission received: 26 February 2025 / Revised: 15 April 2025 / Accepted: 15 April 2025 / Published: 20 April 2025
(This article belongs to the Special Issue Recent Research and Application of Amorphous Materials)

Abstract

:
An uncooled microbolometer is a thermal sensor consisting of a membrane suspended from the substrate to provide thermal insulation. Typically, the membrane is composed of a stack of three films integrated by a supporting film, an IR sensing film, and an IR absorbing film. However, the above increases the thickness of the device and affects its mechanical stability and thermal mass, thereby reducing its performance. One solution is to use a single film as a membrane with both IR sensing and IR absorbing properties. In this regard, this work presents the fabrication and evaluation of uncooled microbolometers using nitrogen-doped hydrogenated amorphous silicon-germanium (a-SiGe:H,N) as a single IR-absorber/IR sensing membrane. The films were deposited via low frequency Plasma Enhanced Chemical Vapor Deposition (PECVD) at 200 °C. Three microbolometer configurations were fabricated using a-SiGe:H,N films deposited from a SiH4, GeH4, N2, and H2 gas mixture with different SiH4 and GeH4 flow rates and, consequently, with different properties, such as temperature coefficient of resistance (TCR) and conductivity at room temperature. The microbolometer that exhibited the best performance achieved a voltage responsivity of 7.26 × 10⁵ V/W and a NETD of 22.35 mK at 140 Hz, which is comparable to state-of-the-art uncooled infrared (IR) sensors. These results confirm that the optimization of the deposition parameters of the a-SiGe:H,N films significantly affects the microbolometers final performance, enabling an optimal balance between thermal sensitivity (TCR) and conductivity.

1. Introduction

Uncooled microbolometers have proven to be a crucial technology for thermal detection systems due to their ability to detect infrared radiation without the necessity of cryogenic cooling systems, reducing costs and facilitating their integration into compact and portable devices. These sensors are essential in applications such as surveillance [1], medical diagnostics [2], industrial inspection [3], automotive systems [4], firefighting [5], and agriculture [6]. Their importance continues growing thanks to their capability to operate under adverse conditions and provide efficient portable solutions [7].
An uncooled microbolometer is a thermal sensor used as a pixel in large infrared (IR) focal plane arrays (IRFPAs). This device is a temperature-dependent resistor, where the absorption of IR radiation causes an increment in its temperature, and consequently it experiences a change in its electrical resistance. The temperature coefficient of resistance (TCR) indicates the percentage of the microbolometer electrical resistance that changes per degree Kelvin in temperature (%/K).
An uncooled microbolometer consists of a suspended membrane from the substrate to provide thermal isolation. Basically, the membrane is composed of a film stack integrated by a supporting film, typically of silicon nitride (SiNx) [8], an IR sensing film, typically of hydrogenated amorphous silicon (a-Si:H) [9], and an IR absorbing film, also of SiNx, which is an excellent IR absorber [10]. However, the above increases the steps in the sensor fabrication process, increases the device thickness, and affects its mechanical stability and thermal mass, thereby reducing its performance. One solution is the use of just one film as a membrane, with both properties of IR sensing and IR absorbing.
Vanadium oxide (VOx) was the first IR sensing element used in uncooled microbolometers [11] with a TCR in the range of −2.0%/K to −2.7%/K, and more recently intrinsic a-Si:H has been adopted due to its very large TCR values (up to −9%/K). However, a-Si:H also has a very large electrical resistance, which implies incompatibility with the input impedance of the readout integrated circuits (ROICs) [8]. Therefore, boron has been employed to dope a-Si:H (a-Si:H,B) to reduce its electrical resistance, but also a reduction in TCR to −3%/K is obtained [12].
In our previous work we have studied intrinsic hydrogenated amorphous silicon-germanium (a-SiGe:H) alloys, which present high values of TCR (above −4%/K) and moderate electrical resistance, depending on the silicon and germanium content in the alloy [13]. In this context, nitrogen-doped hydrogenated amorphous silicon-germanium (a-SiGe:H,N) is a promising material for being used as an IR sensing/IR absorbing membrane due to its high IR absorption, high TCR, good electrical performance, and compatibility with silicon Complementary Metal-Oxide-Semiconductor (CMOS) transistor technology. The above enables the production of simpler, low-cost, and high-performance thermal sensors [14].
The Plasma Enhanced Chemical Vapor Deposition (PECVD) technique is essential for depositing a-SiGe:H,N films, as it allows precise control over the material properties by adjusting the deposition conditions, such as gas flow rates, RF power, chamber pressure, and substrate temperature. These adjustments directly impact the device TCR, responsivity, and conductivity, which are essential factors for improving thermal sensitivity and reducing noise levels. Additionally, the ability to fine-tune the material structure through PECVD enables the films to absorb efficiently in the LWIR range (8–14 µm), making them ideal for thermal imaging applications [15,16]. This study aims to optimize the properties of the microbolometer by evaluating three configurations of a-SiGe:H,N films, selected based on their optical and electrical performance. The results provide clear guidelines for developing advanced uncooled infrared sensors compatible with the silicon CMOS technology and facilitating their integration into advanced industrial IRFPAs.

2. Results and Discussion

2.1. Characterization of the Thermo-Sensing Films

In this section, the main characteristics of the thermos-sensing films are presented. Figure 1 shows the absorption coefficient spectra of the a-SiGe:H,N films, obtained by Fourier transform infrared (FTIR) spectroscopy. For this characterization, the a-SiGe:H,N thin films were deposited on 1 square inch crystalline silicon (c-Si) substrates, specifically designed for optical characterization, using a FTIR spectrometer Nicolet iS50 (Thermo Scientific, Waltham, MA, USA). The thicknesses of the a-SiGe:H,N films studied in this work are the following: film #1 has a thickness of 327 nm, film #2 has a thickness of 361 nm, and film #3 has a thickness of 392 nm, according to measurements performed with a mechanical profiler.
It can be observed in the spectra in the range of 800 cm−1 to 1000 cm−1 (corresponding to a wavelength of 10 µm to 12.5 µm) that film #1 has the largest absorption coefficient, while film #3 has the lowest. That region is of interest because the microbolometers are designed to detect radiation at 10 µm, which is the wavelength at which the human body emits IR radiation. Therefore, we would expect the microbolometer to present a better performance with film #1.
Atomic force microscopy (AFM) was used to characterize the surface average roughness of the three a-SiGe:H,N films. Figure 2 shows 3-D images of the surface of the films measured in areas of 4 µm × 4 µm employing an AFM (EasyScan, Nanosurf, Liestal, Switzerland) where it can be observed that film #1 has a sharper surface, while film #3 has the roughest one. Table 1 shows the average roughness for the three films, where effectively it is shown that film #1 has the lower average roughness. This is of importance for the fabrication of microbolometers, where a sharp thermos-sensing film is required to have suitable electrical contact with the metal electrodes.

2.2. Characterization of Micro-Bolometers

In this section, the results obtained during the characterization of the microbolometer are presented. Key parameters such as responsivity of both voltage and current ( R V ,   i ), power spectral density (PSD), noise equivalent power (NEP), normalized detectivity (D*), and noise equivalent temperature difference (NETD) were evaluated. These parameters are essential for determining the device sensitivity and efficiency, which are crucial for its performance in infrared detection applications. Tests were conducted under controlled conditions of temperature, vacuum, and radiation power, using specialized equipment to ensure accuracy in the results, which are detailed in the following sections. The data obtained provides valuable insights for optimizing future designs and enhancing device performance in various infrared detection applications.

2.3. Responsivity ( R V ,   R i )

Responsivity indicates the microbolometers ability to convert infrared radiation into an electrical signal. It is calculated both in terms of voltage ( R V ) and current ( R i ) using the following equations:
R V = Δ V o u t P I R   ( V / W )
R i = Δ I o u t P I R   ( A / W )
where V o u t and I o u t represent the measured output voltage and current, respectively, and P I R is the incident infrared radiation power [17,18]. Responsivity is a critical indicator in the characterization of thermal sensors, as it defines the efficiency with which the device can detect and convert radiation [10].
To measure these parameters, the microbolometer was placed in a cryostat (MMR Technologies, San Jose, CA, USA) in a vacuum environment of 40 mTorr that allows the characterization at room temperature conditions and IR illumination for current-voltage I(V) characterization, connected via microprobes. The I(V) measurements were conducted at 300 K, controlled and monitored with a Model 331 cryogenic temperature controller (Lake Shore, Westerville, OH, USA).
Temperature stabilization is necessary for the responsivity characterization to ensure that the change in electrical resistance is due to the IR radiation absorption and not to variations in the sensor temperature due to the environment. Also, this characterization is performed in a vacuum to eliminate undesired heat transference mechanisms, mainly to reduce heat transfer by convection.
The I(V) curve was obtained both in the dark and under IR illumination to evaluate the devices performance. Electrical characterization was performed using a 6517A electrometer (Keithley, Solon, OH, USA), controlled by a computer through LabView software. The voltage was applied from 0 to 1.5 V in the dark and under IR radiation. A higher excitation voltage can increase the responsivity; however, it was limited to 1.5 V to avoid damaging the sensors, such as a membrane breakdown.
The infrared radiation source was provided by a Kanthal Globar silicon carbide bar, whose radiation passes through a zinc selenide (ZnSe) window with 70% transmittance in the range of 0.6 to 20 µm. This radiation is further filtered by a 260 µm thick silicon wafer, restricting the spectrum to a region of approximately 1–15 µm. The incident radiation, measuring 220.5 nW, was directed toward the microbolometer using a mirror placed 20 cm away. The IR radiation was measured with an Oriel 71968 thermopile (Newport Corporation, Irvine, CA, USA), Figure 3 shows the experimental setup [19].
During the experiments, IR radiation was modulated using an optical chopper (Stanford Research Systems, Sunnyvale, CA, USA). Specifically for the responsivity measurements, the chopper frequency was fixed to 5 Hz to ensure maximum microbolometer response.
Also, to characterize the thermal response time of the microbolometer, the cutoff frequency was analyzed, defined as the point at which the output signal decreases by −3 dB from its maximum value. This 3 dB attenuation corresponds to a reduction to 70.7% of the maximum detected signal amplitude [20]. The cutoff frequency was found at 70 Hz, corresponding to a thermal response time of approximately 14 milliseconds.
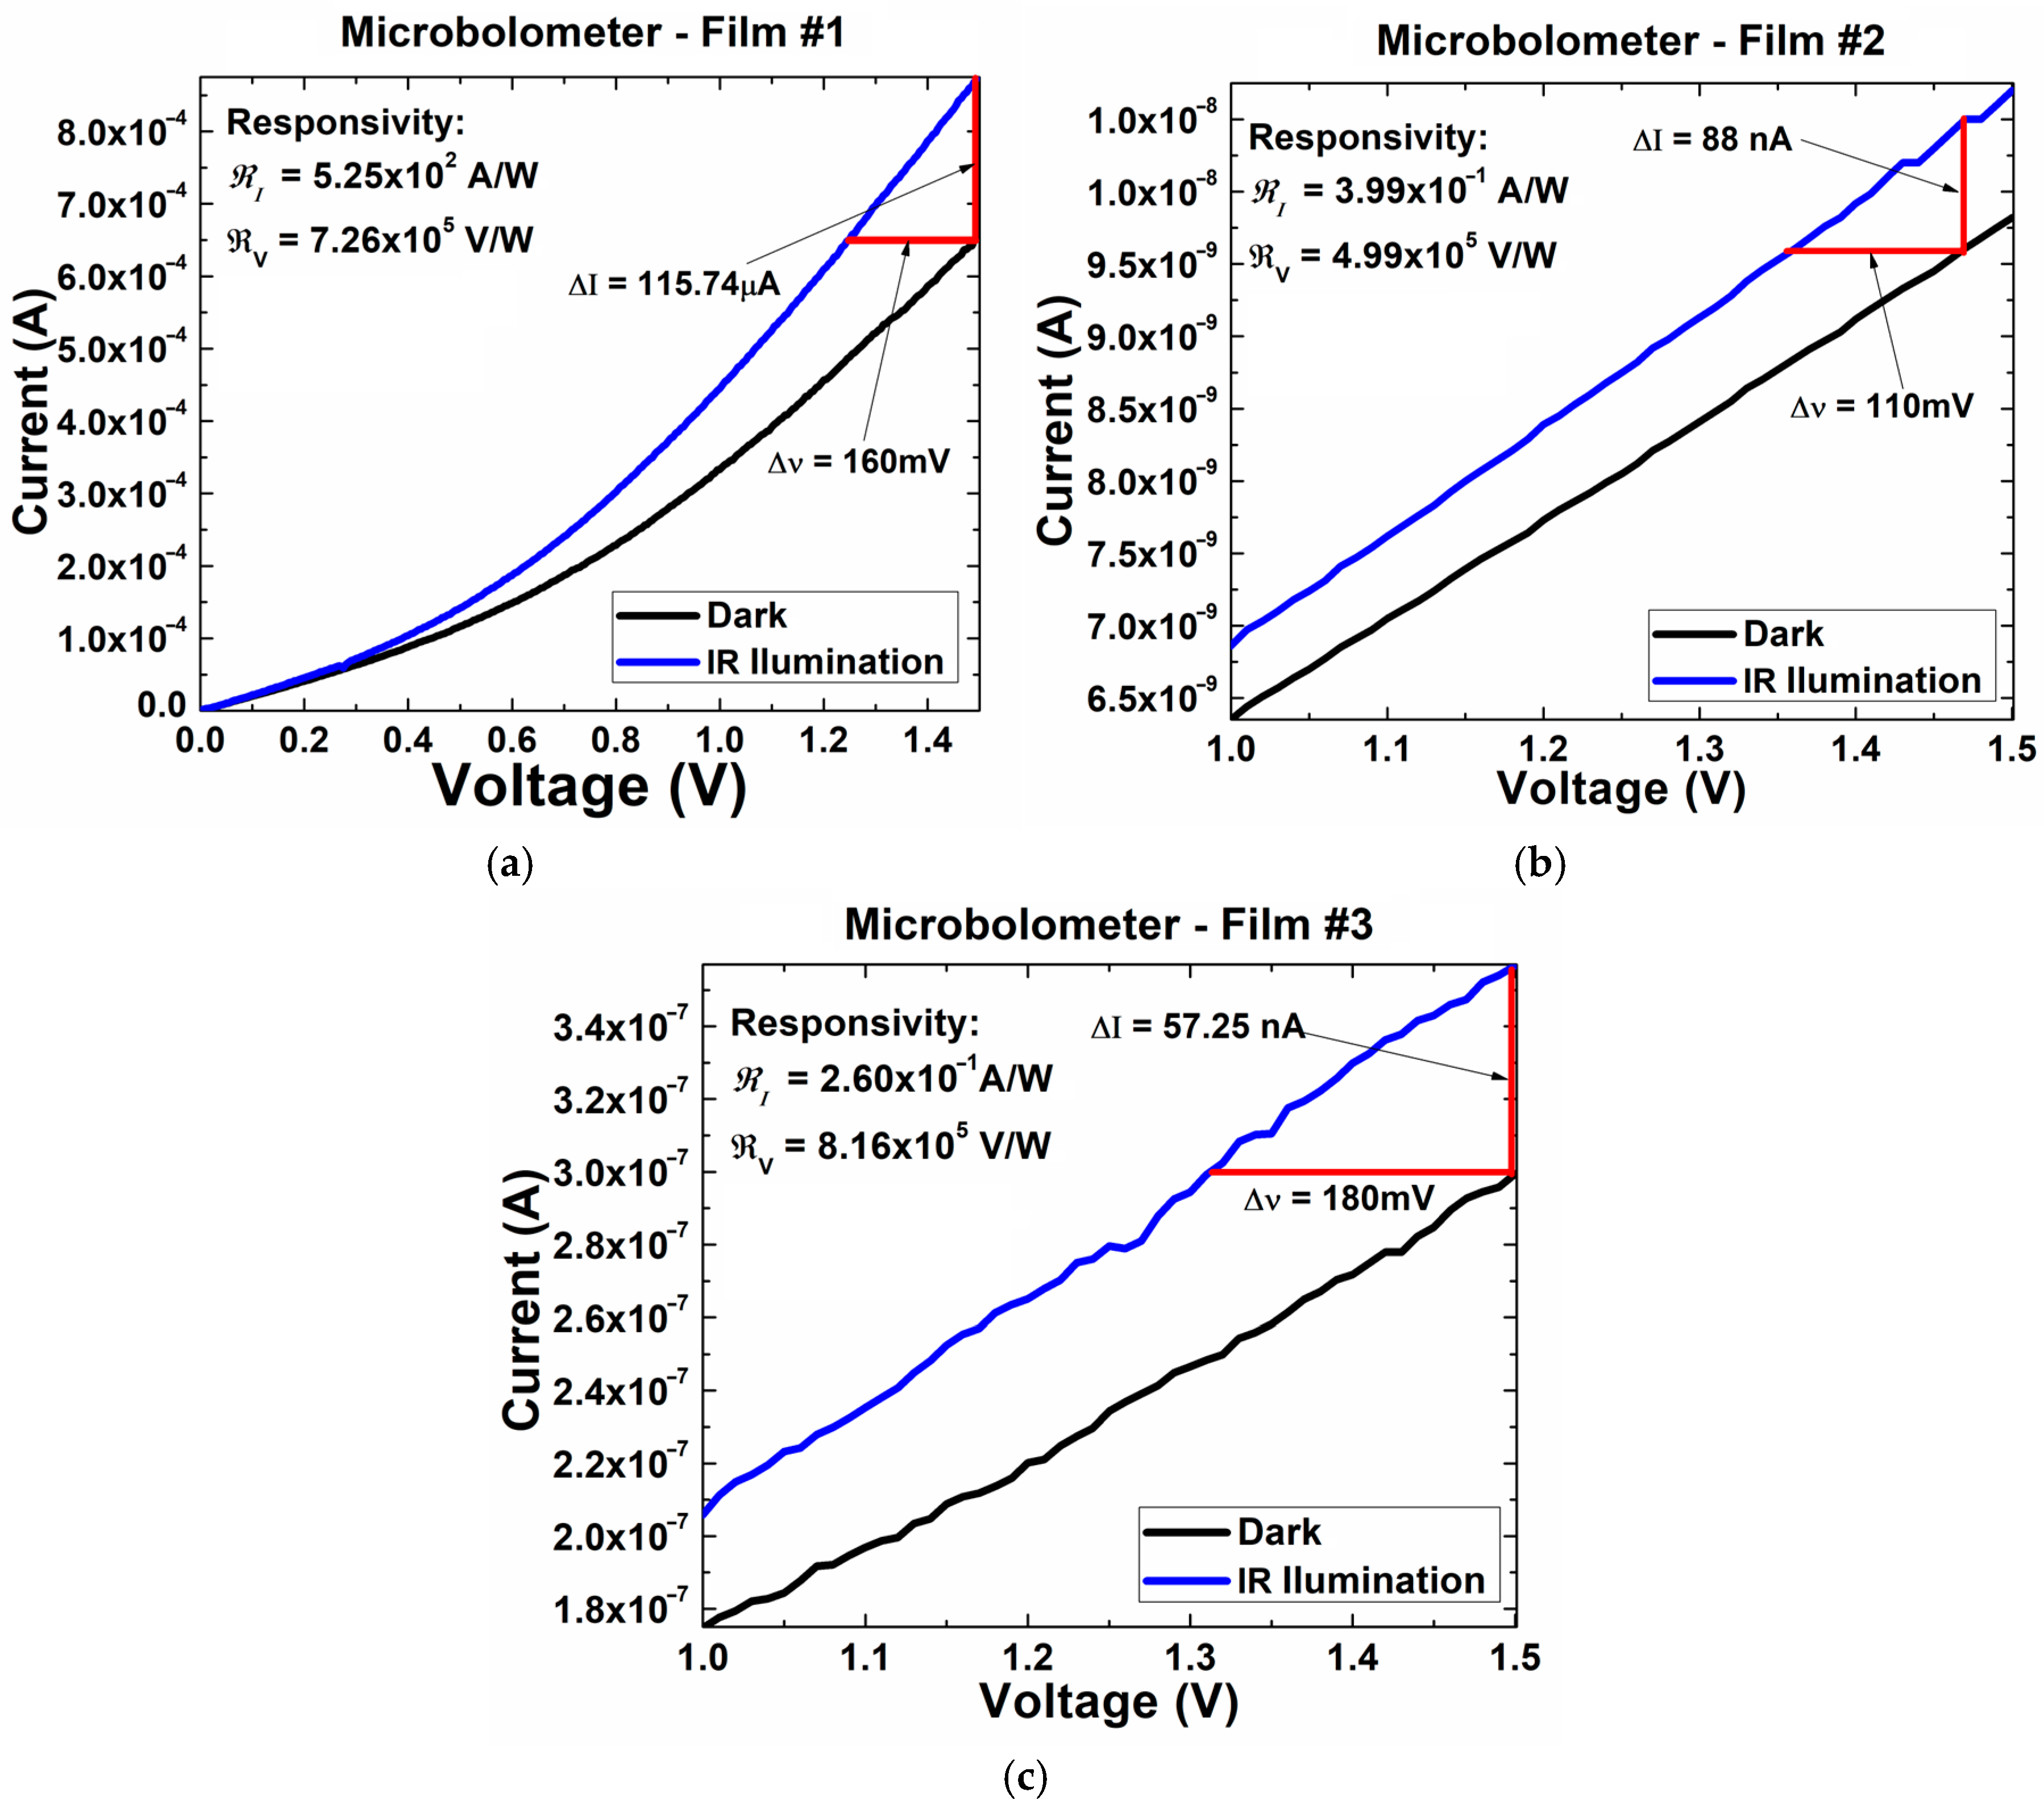
Figure 4 shows the current-voltage curves obtained from three microbolometers with different thermo-sensing films deposited under different gas flow conditions, as was previously discussed. To evaluate the materials IR response, measurements were performed under two main conditions: in the dark and under IR illumination. In graphs (a), (b), and (c) of Figure 4, the variation in current as a function of the applied voltage is observed, comparing the microbolometers response under both dark and IR conditions.
The difference in current (ΔI) and voltage (ΔV) between dark and IR illumination allows the calculation of the device responsivity, expressed in A/W and V/W, which is an indicator of the device efficiency in converting incident radiation into an electrical signal. In addition to responsivity, relevant parameters such as the devices room temperature resistance are presented. Responsivity varies depending on the thermo-sensing films deposited with different SiH4/GeH4 gas flow rates, providing insights into how these factors affect the sensor sensitivity.
Table 1 shows the electrical parameters of three microbolometers with different a-SiGe:H,N thermo-sensing films deposited with different gas flow rates (see Table 1), which affects their responsivity and room temperature resistance. Voltage responsivity (V/W) and current responsivity (A/W) indicate the sensors ability to convert IR radiation into electrical signals of voltage and current, respectively, with higher values being indicative of greater sensitivity. The room temperature electrical resistance (Ω), measured for each type of microbolometer, provides information on the sensor compatibility with the input impedance of the silicon CMOS ROIC [21].
The microbolometer with film #3 had a voltage responsivity of 8.16 × 10⁵ V/W and a current responsivity of 2.6 × 10⁻¹ A/W, along with a resistance of 5.72 × 10⁶ Ω. This configuration shows the highest voltage responsivity but also the highest electrical resistance. The above can be related to the very high roughness of the thermo-sensing film and an unsuitable metal-semiconductor contact with the metal electrode.
On the other hand, the microbolometer with film #1 shows the highest current responsivity of 5.25 × 10² A/W and also high voltage responsivity of 7.26 × 10⁵ V/W, but with the lowest resistance of 2.76 × 10³. The low microbolometer resistance also contributes to a good balance between sensitivity and compatibility with the input impedance of the silicon CMOS ROIC. These data are essential for understanding how variations in the gas flow rates for the a-SiGe:H,N film deposition affect the microbolometer responsivity and electrical resistance properties.

2.4. Power Spectral Density (PSD)

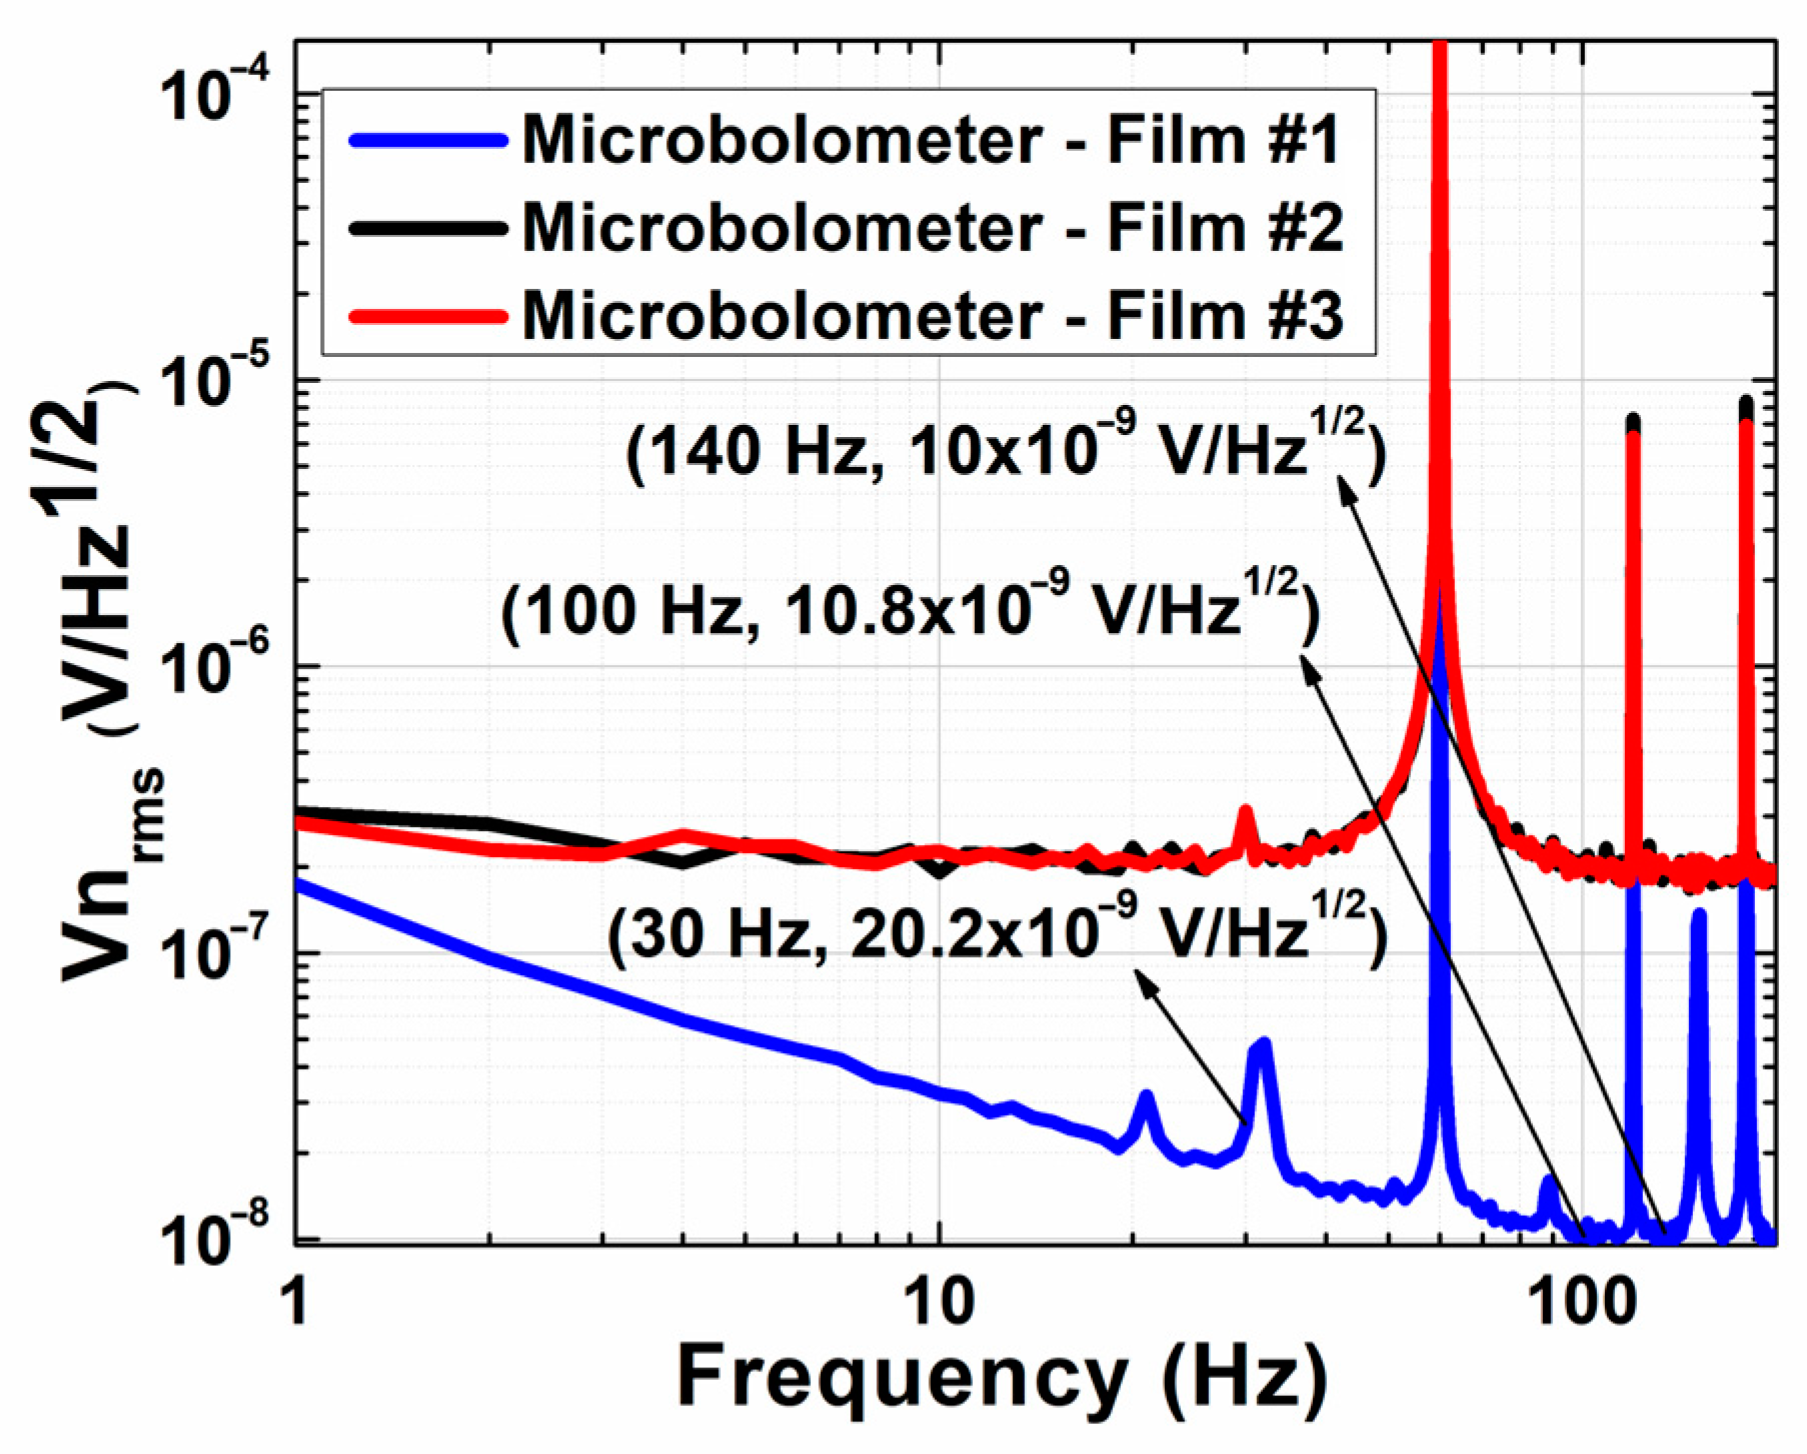
Measurements were conducted using an SR780 spectrum analyzer, manufactured by Stanford Research Systems (SRS), under controlled conditions in a vacuum cryostat (40 mTorr) at a temperature of 300 K. This device is widely used for signal analysis in the frequency domain, allowing for precise power spectral density (PSD) measurements in units of Vrms/√Hz.
The equation used to describe the noise voltage of an open-circuit resistor is:
V n = 4 k T R Δ f   ( v r m s H z )
where k is the Boltzmann constant (1.38 × 10⁻²³ J/K), T is the temperature in Kelvin (300 K in this case), R is the resistance in ohms, and Δf is the bandwidth in Hz, set in this experiment to 1 Hz (typically the FFT line width).
Figure 5 shows the PSD distribution and noise contributions in the 3 microbolometers with different a-SiGe:H,N thermo-sensing films, where it is observed that the microbolometer with film #1 has the lowest Vn value. The results also show that 1/f noise predominates at low frequencies, while thermal noise becomes more significant at higher frequencies. Table 2 presents the noise voltage ( Δ v ) in terms of the square root of frequency, which provides information on the sensor thermal noise level. A lower Δv indicates less noise in the sensor, which is generally desirable as it implies a cleaner signal [22]. Also, Table 2 shows the room temperature resistance R (Ω) which was experimentally measured.

2.5. Noise Equivalent Power (NEP)

The NEP represents the minimum detectable power of the microbolometer, where the signal is equal to the noise level, the equation used is
N E P = v n R v   ( W H z )
where v n is the measured noise voltage and R v is the voltage responsivity.
Table 2 shows the NEP values of the three different microbolometers with different a-SiGe:H,N thermos-sensing films for three different values of frequency. The tests yielded NEP values in the range of 1 × 10⁻¹⁴  (W/√Hz), demonstrating the high sensitivity of the device [23].
In the evaluation of the microbolometers with the three different thermos-sensing films, film #1 has proven to be the most efficient option in terms of sensitivity and stability. This configuration presents an optimal balance between low noise levels and high responsivity, resulting in an improved NEP. Additionally, the resistance values in this film are moderate, ensuring effective thermal response without compromising operational stability. These factors make this combination ideal for high-precision infrared detection applications, maximizing the signal-to-noise ratio and optimizing the overall performance of the device [24].

2.6. Detectivity (D*)

The normalized detectivity (D*) indicates the ability of the microbolometer to detect weak signals in the presence of noise. The equation used is
D * = R V A Δ f V n [ c m H z W ]
where A is the detector area in cm2, Δf is the bandwidth, R V is the voltage responsivity, and Vn is the noise voltage, previously calculated [25].
For the detectivity calculation, tests were performed under controlled temperature and frequency conditions. Equation (5) was used, considering the microbolometer area of 50 μm × 50 μm. The results are shown in Table 2, indicating that the highest detectivity corresponds to the microbolometer with film #1. As the frequency increased to 30 Hz, 100 Hz, and 140 Hz, the detectivity values were still high, suggesting that this microbolometer maintains high sensitivity across the frequency spectrum. This highlights the microbolometers ability to differentiate between incident radiation signals and background noise. The higher the detectivity, the greater the detector sensitivity, enabling it to detect weaker signals above the noise level [26]. A detectivity of the order of 109 cm√Hz/W was obtained, which is suitable for high-precision thermal imaging applications.

2.7. Noise Equivalent Temperature Difference (NETD)

The NETD represents the minimum temperature difference that the microbolometer can detect, indicating its thermal sensitivity. The equation used to calculate the NETD is
N E T D = 4 F 2 V n τ 0 A R V ( P T ) λ 1 λ 2
where ( P T ) λ 1 λ 2 is the power emitted by a blackbody per unit of temperature within the spectral range, A is the area of the microbolometer, τ 0 is the transmittance of the optical system, F is the f-number of the lens, V n is the measured noise voltage, and R V is the responsivity of the device [27].
The NETD tests were conducted using an F/1 optical system with a transmittance τ 0 = 0.5 , along with a temperature contrast in the 8–12 µm spectral band at 300 K of ( P T ) 8 12 = 1.972 W/m2K. Table 2, shows the NETD values calculated at three different frequencies.
The microbolometer demonstrated a NETD below 50 mK, ensuring its ability to detect very subtle temperature changes in the range of 8 to 12 µm of the infrared spectrum. The obtained NETD values confirm the high thermal sensitivity of the microbolometer, with film #1 being the most suitable for high-precision thermal imaging applications.

2.8. Resistance Versus Temperature (R(T))

Finally, we performed measurement of the microbolometer resistance as a function of temperature R(T) to demonstrate its operational range. For this characterization, the microbolometer was placed in a vacuum cryostat (MMR Technologies, San Jose, CA, USA) at 40 mTorr and current-voltage I(V) characteristics were obtained at different temperatures, in a range of 300 K to 430 K, with steps of 10 K.
Figure 6a shows the voltage bias plotted as a function of current from the microbolometer with the a-SiGe:H,N film #1. For clarity, the selected curves are shown at temperatures of 300 K, 350 K, 370 K, 410 K, and 430 K. In each curve, in the linear region, the slope was extracted, corresponding to the electrical resistance.
From these measurements, the temperature dependence of the electrical resistance R(T) was obtained and is presented in Figure 6b. The resulting curve reveals a clear negative temperature coefficient of resistance (TCR), characteristic of amorphous semiconductors. This behavior confirms that the film remains sensitive throughout the measured range, making it suitable for uncooled infrared detection applications.

3. Materials and Methods

3.1. Thermo-Sensing Film Deposition Conditions

Three different a-SiGe:H,N films were used as thermos-sensing films in microbolometers, based on our previous work, where these kinds of films were studied [28]. The films were deposited from an SiH4, GeH4, N2, and H2 gas mixture in a low frequency (110 KHz) capacitively coupled PECVD reactor (Applied Materials, Inc., Santa Clara, CA, USA) at 200 °C, with an RF power of 300 W (corresponding to a power density of 87 mW/cm2). Film #1 was deposited with flow rates of SiH4 = 40 sccm/GeH4 = 10 sccm/N2 = 100 sccm/H2 = 1000 sccm. This film exhibits an activation energy (Ea) of 0.36 eV, a TCR of 4.65%/K, and conductivity of 7.56 × 10⁻⁶ (Ω·cm)−1. Film #2 was deposited with flow rates of SiH4 = 30 sccm/GeH4 = 20 sccm/N2 = 100 sccm/H2 = 1000 sccm, with an Ea of 0.24 eV, a TCR of 3.15%/K, and conductivity of 1.47 × 10⁻³ (Ω·cm)−1. Finally, film #3 was deposited with flow rates of SiH4 = 10 sccm/GeH4 = 40 sccm/N2 = 100 sccm/H2 = 1000 sccm. This film has an Ea of 0.17 eV and a low TCR of 2.23%/K but a high conductivity (3.24 × 10⁻² (Ω·cm)−1), which facilitates its integration with the read-out integrated circuit (ROIC) based on the silicon CMOS technology [29].

3.2. Microbolometers Fabrication

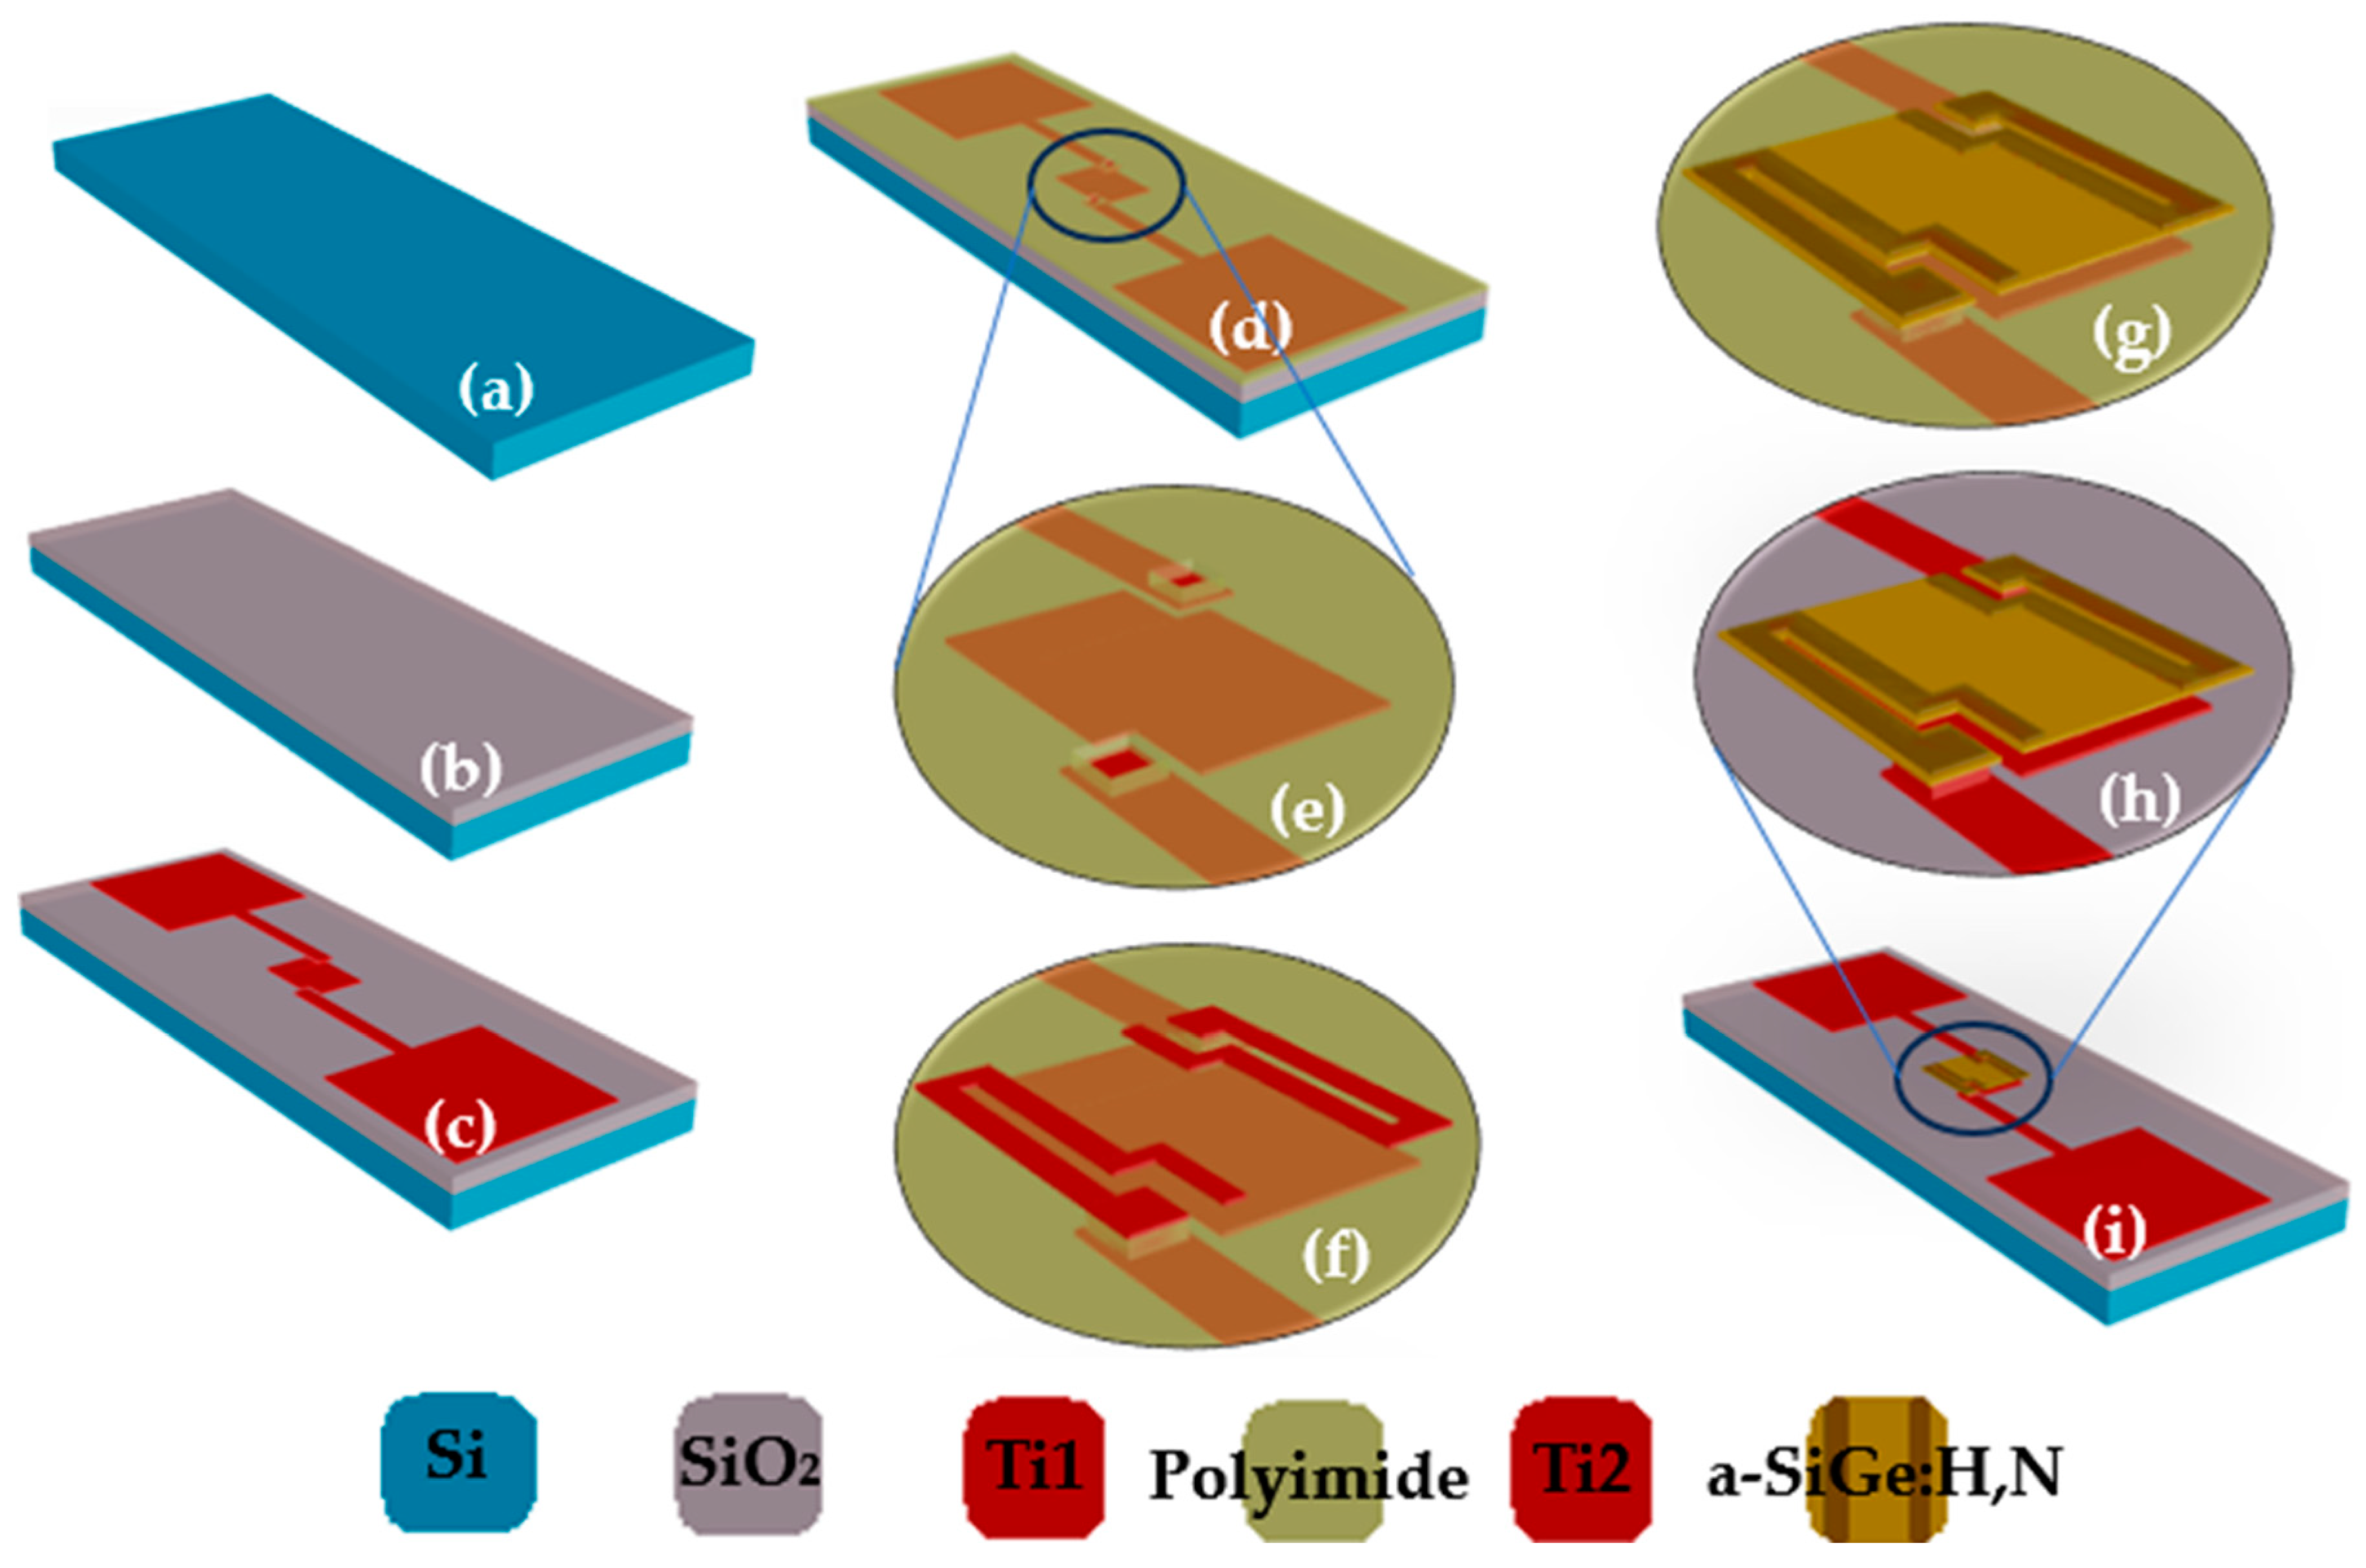
The fabrication of microbolometers was carried out using silicon technology on a two-inch silicon wafer. The microbolometer fabrication process began with the initial silicon wafer surface cleaning using the standard RCA process: RCA I composed of deionized water/ammonium hydroxide/hydrogen peroxide and RCA II composed of deionized water/hydrogen chloride/hydrogen peroxide (J.T. Baker, Easton, PA, USA). The above cleaning process is used to remove organic and metallic contaminants. The native oxide of the wafer was removed using a solution of deionized (DI) water and hydrofluoric acid (J.T. Baker, Easton, PA, USA), preparing the wafer for subsequent stages (Figure 7a). A 1 µm thick layer of silicon dioxide (SiO2) was then grown across the wafer, providing thermal and electrical insulation between the microbolometer and the substrate (Figure 7b) [30]. A 0.6 µm titanium layer was deposited using electron beam evaporation (e-beam). The lift-off technique was used to define the metallic contacts and reflective mirrors [31]. These mirrors redirect unabsorbed infrared radiation back toward the sensing film, maximizing detection efficiency (Figure 7c).
To form the microbolometer, the goal is to thermally insulate a sensor film by suspending it from the surface. A sacrificial polyimide 2610 Kapton film (DuPont corporation, Wilmington, DE, USA), with a thickness of 2.5 µm, was applied across the surface using the spin coating technique at 2500 rpm. This creates a Fabry-Perot resonant cavity at a quarter wavelength of 10 µm, corresponding to 300 K, enhancing absorption and sensitivity (Figure 7d) [32]. Windows were etched in the polyimide layer to expose the underlying metal contacts. For this step, a 120 nm-thick aluminum film was used as a hard mask, patterned by the lift-off process. A photomask with a dark-field layout and positive photoresist AZ1505 (MicroChemicals GmbH, Ulm, Germany) was employed. The pattern was transferred to the polyimide using anisotropic etching via a Reactive Ion etching, RIE AME-8110 tool (Applied Materials, Inc., Santa Clara, CA, USA). The etching process was carried out using an oxygen plasma at a pressure of 100 mTorr, RF power of 250 W, and gas flow rate of 80 sccm, with a total etching time of 20 min. These parameters were optimized to ensure clean and accurate pattern transfer, enabling proper electrical continuity through the exposed contacts. (Figure 7e).
Subsequently, an additional 0.4 µm titanium layer was deposited to form the connection electrodes between the metal pads and the sensor film. These electrode patterns were defined using lithography and a lift-off process (Figure 7f). Over the electrodes, a 0.5 µm thick a-SiGe:H,N was deposited, acting as the infrared-absorbing film (Figure 7g). The addition of N2 to the film enhances the infrared absorption, as was reported in our previous work [28]. The films deposition was performed via low frequency PECVD (Applied Materials, Inc., Santa Clara, CA, USA) working at 110 KHz, with an RF power of 300 W (corresponding to a power density of 87 mW/cm2) and a substrate temperature of 200 °C. After deposition, thermal treatment was conducted in the chamber without breaking the vacuum, allowing a nitrogen flow of 20 sccm, a pressure of 1200 mTorr, and a temperature of 200 °C. This process improves the films residual stress and optimizes its conductivity [33]. The treatment lasted for 4 continuous hours.
The process concluded with the removal of the sacrificial polyimide film using oxygen plasma with a barrel asher L2101 (Branson/IPC, Hayward, CA, USA) for isotropic etching. The above allows the release of the suspended membrane, providing thermal insulation to the sensing film and improving the response to rapid temperature variations induced by infrared (IR) radiation (Figure 7h). The device, with dimensions of 50 × 50 µm2, has low thermal capacity, ensuring superior performance in infrared detection applications by minimizing heat loss and enhancing sensitivity (Figure 7i). Figure 8 shows images of the fabricated microbolometer obtained with a scanning electron microscope (SEM) SU3500 (Hitachi, Tokyo, Japan).

4. Conclusions

The research carried out in this work demonstrated that microbolometers fabricated with nitrogen-doped hydrogenated silicon-germanium films (a-SiGe:H,N), using LF-PECVD, achieved excellent thermal sensitivity and operational stability. Particularly the device configuration with the a-SiGe:H,N film deposited with a ratio of SiH4/GeH4 = 40/10 (highly diluted in H2 and N2), reached a voltage responsivity of 7.26 × 10⁵ V/W and a NETD of 22.35 mK at 140 Hz. These characteristics and a significant reduction in 1/f noise above 100 Hz highlight the devices potential for high-precision uncooled thermal imaging applications, making it compatible with silicon CMOS technology and suitable for integration into portable and low-power systems.

Author Contributions

Conceptualization, O.V., A.T., R.J. and M.M.; methodology, O.V., A.T., L.H. and M.M.; validation, O.V., R.J., A.M., L.H., A.L. and K.M.; resources, A.L., J.F. and G.M.M.; writing—original draft preparation, O.V., R.J., A.T., L.H., M.M. and A.M.; writing—review and editing, O.V., A.L., K.M., M.M., J.F. and G.M.M.; visualization, O.V., A.M. and M.M.; supervision, R.J., A.T., A.M., A.L. and M.M.; project administration, O.V., L.H., K.M., J.F. and G.M.M.; funding acquisition, M.M., A.L., J.F. and G.M.M. All authors have read and agreed to the published version of the manuscript.

Funding

This research received no external funding.

Data Availability Statement

The original contributions presented in this study are included in the article. Further inquiries can be directed to the corresponding author (Any inquiry can be directed to mmoreno@inaoep.mx).

Acknowledgments

O. Velandia acknowledges SECIHTI for the scholarship 2020-000026-02NACF-07348 granted during the Ph.D. program at INAOE. M. Moreno acknowledges SECIHTI for the sabbatical stay support.

Conflicts of Interest

The authors declare no conflicts of interest.

References

  1. Hornberger, C. Application of Military Uncooled Infrared Sensors to Homeland Defense. Proc. SPIE 2002, 4708, 201–211. [Google Scholar] [CrossRef]
  2. Lahiri, B.B.; Bagavathiappan, S.; Jayakumar, T.; Philip, J. Medical Applications of Infrared Thermography: A Review. Infrared Phys. Technol. 2012, 55, 221–235. [Google Scholar] [CrossRef]
  3. Tissot, J.-L.; Trouilleau, C.; Fieque, B.; Crastes, A.; Legras, O. Uncooled Microbolometer Detector: Recent Developments at ULIS. Opto-Electron. Rev. 2006, 14, 25–32. [Google Scholar] [CrossRef]
  4. Yon, J.J.; Mottin, E.; Biancardini, L.; Letellier, L.; Tissot, J.L. Infrared Microbolometer Sensors and Their Application in Automotive Safety. Adv. Microsyst. Automot. Appl. 2003, 13, 137–157. [Google Scholar] [CrossRef]
  5. Dufour, D.; Le Noc, L.; Tremblay, B.; Tremblay, M.N.; Généreux, F.; Terroux, M.; Vachon, C.; Wheatley, M.J.; Johnston, J.M.; Wotton, M.; et al. A Bi-Spectral Microbolometer Sensor for Wildfire Measurement. Sensors 2021, 21, 3690. [Google Scholar] [CrossRef] [PubMed]
  6. Kusnierek, K.; Korsaeth, A. Challenges in Using an Analog Uncooled Microbolometer Thermal Camera to Measure Crop Temperature. Int. J. Agric. Biol. Eng. 2014, 7, 60–74. [Google Scholar] [CrossRef]
  7. Yu, L.; Guo, Y.; Zhu, H.; Luo, M.; Han, P.; Ji, X. Low-cost microbolometer type infrared detectors. Micromachines 2020, 11, 800. [Google Scholar] [CrossRef]
  8. Shin, C.; Kim, J.-K.; Oh, J.; Park, J.; Shin, H.-S. Noise Improvement of a-Si Microbolometers by the Post-Metal Annealing Process. Sensors 2021, 21, 7103. [Google Scholar] [CrossRef]
  9. Almasri, M.; Xu, B.; Castracane, J. Amorphous Silicon Two-Color Microbolometer for Uncooled IR Detection. IEEE Sens. J. 2006, 6, 293–300. [Google Scholar] [CrossRef]
  10. Piller, M.; Hiesberger, J.; Wistrela, E.; Martini, P.; Luhmann, N.; Schmid, S. Thermal IR Detection With Nanoelectromechanical Silicon Nitride Trampoline Resonators. IEEE Sens. J. 2023, 23, 1066–1071. [Google Scholar] [CrossRef]
  11. Hu, Y.; Lin, C.H.; Min, S.; Smith, R.L.; Roberts, S. Bolometric Arrays and Infrared Sensitivity of VO2 Films with Varying Stoichiometry. J. Optoelectron. Mater. Eng. 2017, 8, 345–353. [Google Scholar]
  12. Shin, C.; Pham, D.P.; Park, J.; Kim, S.; Lee, Y.-J.; Yi, J. Structure and Electrical Properties of Boron Doped Hydrogenated Mixed-Phase Silicon Films for Uncooled Microbolometer. Infrared Phys. Technol. 2018, 94, 103–111. [Google Scholar] [CrossRef]
  13. Kolahdouz, M.; Salemi, A.; Moeen, M.; Östling, M.; Radamson, H.H. Kinetic Modeling of Low Temperature Epitaxy Growth of SiGe Using Disilane and Digermane. J. Electrochem. Soc. 2012, 159, H478–H481. [Google Scholar] [CrossRef]
  14. Jung, J.; Kim, M.; Kim, C.-H.; Kim, T.H.; Park, S.H.; Kim, K.; Cho, H.J.; Kim, Y.; Kim, H.Y.; Oh, J.S. Improved responsivity of an a-Si-based micro-bolometer focal plane array with a SiNx membrane layer. J. Sens. Sci. Technol. 2022, 31, 366–370. [Google Scholar] [CrossRef]
  15. Forsberg, F.; Lapadatu, A.; Kittilsland, G.; Martinsen, S.; Roxhed, N.; Fischer, A.C.; Stemme, G.; Samel, B.; Ericsson, P.; Høivik, N.; et al. CMOS-integrated Si/SiGe quantum-well infrared microbolometer focal plane arrays manufactured with very large-scale heterogeneous 3-D integration. IEEE J. Sel. Top. Quantum Electron. 2015, 21, 2700111. [Google Scholar] [CrossRef]
  16. Moreno, M.; Jiménez, R.; Torres, A.; Ambrosio, R. Microbolometers based on amorphous silicon–germanium films with embedded nanocrystals. IEEE Trans. Electron Devices 2015, 62, 2120–2127. [Google Scholar] [CrossRef]
  17. Rogalski, A. Infrared Detectors; Gordon and Breach Science Publishers: Amsterdam, The Netherlands, 2000. [Google Scholar]
  18. Budzier, H.; Gerlach, G. Thermal Infrared Sensors: Theory, Optimisation and Practice; Wiley-VCH: Weinheim, Germany, 2011. [Google Scholar]
  19. Jimenez, R.; Moreno, M.; Torres, A.; Morales, A.; Ponce, A.; Ferrusca, D.; Rangel-Magdaleno, J.; Castro-Ramos, J.; Hernandez-Perez, J.; Cano, E. Fabrication of Microbolometer Arrays Based on Polymorphous Silicon–Germanium. Sensors 2020, 20, 2716. [Google Scholar] [CrossRef]
  20. Xu, Q.; Zhou, Z.; Tan, C.; Pan, X.; Wen, Z.; Zhang, J.; Zhou, D.; Sun, Y.; Chen, X.; Zhou, L.; et al. A Spectrally Selective Visible Microbolometer Based on Planar Subwavelength Thin Films. Nanoscale Adv. 2023, 5, 2054–2060. [Google Scholar] [CrossRef]
  21. Hai, M.L.; Cheng, Q.; Hesan, M.; Qu, C.; Kinzel, E.C.; Almasri, M. Amorphous SixGeyO1−x−y Thin Films for Uncooled Infrared Microbolometers. Infrared Phys. Technol. 2018, 95, 227–235. [Google Scholar] [CrossRef]
  22. Gao, Y.; Chen, H.; Xu, Y.; Sun, X.; Chang, B. Noise Research of Micro-Bolometer Array under Temperature Environment. Proc. SPIE Int. Symp. Photoelectron. Detect. Imaging 2011, 8193, 81930S. [Google Scholar] [CrossRef]
  23. Bartmann, M.G.; Sistani, M.; Luhmann, N.; Schmid, S.; Bertagnolli, E.; Lugstein, A.; Smoliner, J. Germanium Nanowire Microbolometer. Nanotechnology 2022, 33, 245201. [Google Scholar] [CrossRef] [PubMed]
  24. Cosme Bolaños, I. Experimental Study of Noise in Thermo-Sensing Films Based on Silicon-Germanium Deposited by Plasma for Application in Microbolometers. Master’s Thesis, National Institute of Astrophysics, Optics and Electronics (INAOE), Tonantzintla, Puebla, Mexico, 2008. [Google Scholar]
  25. Abdullah, A.; Koppula, A.; Alkorjia, O.; Almasri, M. Uncooled Two-Microbolometer Stack for Long Wavelength Infrared Detection. Sci. Rep. 2023, 13, 3470. [Google Scholar] [CrossRef] [PubMed]
  26. Adiyan, U.; Larsen, T.; Zárate, J.J.; Villanueva, L.G.; Shea, H. Shape Memory Polymer Resonators as Highly Sensitive Uncooled Infrared Detectors. Nat. Commun. 2019, 10, 4518. [Google Scholar] [CrossRef] [PubMed]
  27. Perić, D.; Livada, B.; Perić, M.; Vujić, S. Thermal Imager Range: Predictions, Expectations, and Reality. Sensors 2019, 19, 3313. [Google Scholar] [CrossRef]
  28. Velandia, O.; Moreno, M.; Zavala, R. Optimization of the Electrical Conductivity and Thermal Coefficient of Resistance (TCR) on Hydrogenated Amorphous Silicon–Germanium Films Doped with Nitrogen (a-SiGe:H,N) for Applications on High-Performance Infrared Detectors. In Proceedings of the 2023 IEEE Latin American Electron Devices Conference (LAEDC), Puebla, Mexico, 3–5 July 2023. [Google Scholar] [CrossRef]
  29. Chu, P.S.; Chen, H.L.; Ding, R.J. A Novel Linear-Logarithmic Readout Integrated Circuit with High Dynamic Range. Infrared Phys. Technol. 2019, 102, 103158. [Google Scholar] [CrossRef]
  30. Calleja Gómez, C.M. Fabrication and Characterization of UV Radiation Detectors Based on Silicon. Master’s Thesis, National Institute of Astrophysics, Optics and Electronics (INAOE), Tonantzintla, Puebla, Mexico, 2011. [Google Scholar]
  31. Alanís, A.; Díaz, D.; Reyes, C.; Zúñiga, C.; Torres, A.; Rosales, P.; Molina, J.; Hidalga, J.; Linares, M.; Aceves, M.; et al. PolyMEMS INAOE, a Surface Micromachining Fabrication Module and the Development of Microstructures for Residual Stress Analysis. In Proceedings of the 6th Ibero-American Congress on Sensor, IBERSENSORS, Sao Paulo, Brazil, 24–28 November 2008; Available online: https://www.researchgate.net/publication/312498987_PolyMEMS_INAOE_a_Surface_Micromachining_Fabrication_Module_and_the_Development_of_Microstructures_for_Residual_Stress_Analysis (accessed on 1 September 2024).
  32. Yan, W.; Shrestha, V.R.; Jeangros, Q.; Sefidmooye Azar, N.; Balendhran, S.; Ballif, C.; Crozier, K.B.; Bullock, J. Spectrally Selective Mid-Wave Infrared Detection Using Fabry–Pérot Cavity Enhanced Black Phosphorus 2D Photodiodes. ACS Nano 2020, 14, 13547–13556. [Google Scholar] [CrossRef]
  33. Abdel-Rahman, M.; Zia, M.; Alduraibi, M. Temperature-Dependent Resistive Properties of Vanadium Pentoxide/Vanadium Multi-Layer Thin Films for Microbolometer & Antenna-Coupled Microbolometer Applications. Sensors 2019, 19, 1320. [Google Scholar] [CrossRef]
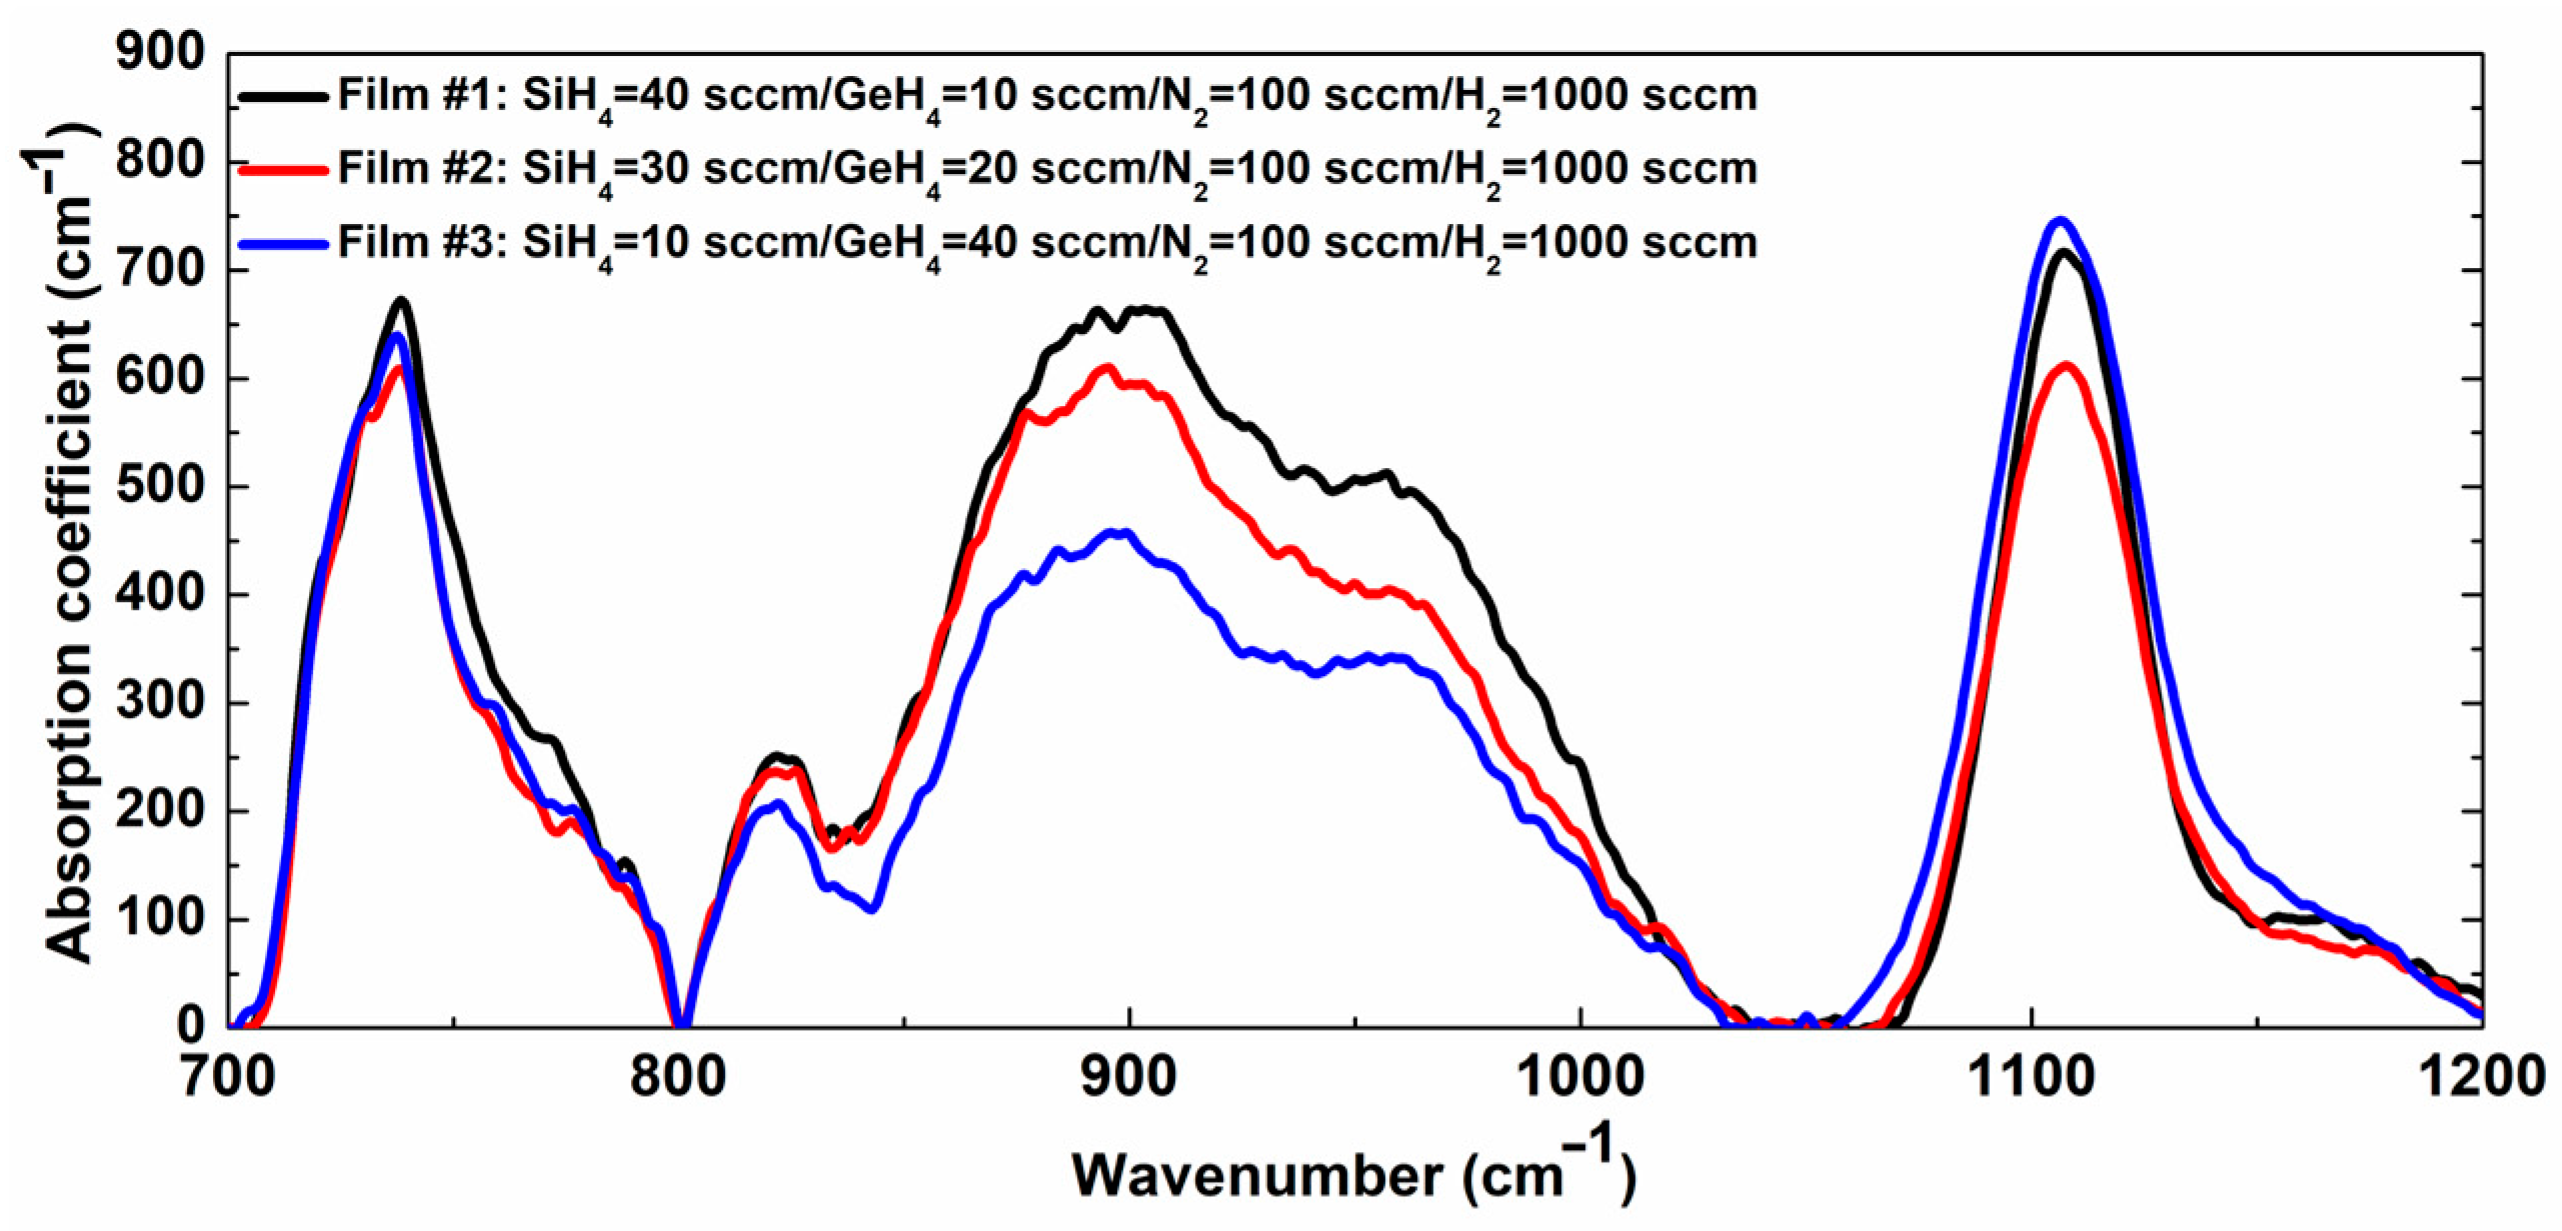
Figure 1. Absorption coefficient spectra of the a-SiGe:H,N films deposited with different flow rates of SiH4 and GeH4, maintaining constant the N2 and H2 flow rates.
Inorganics 13 00126 g001
Figure 2. Atomic force microscopy (AFM) images of the a-SiGe:H,N films: (a) Film #1, (b) Film #2, (c) Film #3.
Inorganics 13 00126 g002
Figure 3. Experimental setup for microbolometer characterization under infrared radiation.
Inorganics 13 00126 g003
Figure 4. Current-voltage curves of three microbolometers with different a-SiGe:H,N thermo-sensing films under dark conditions and IR illumination: (a) microbolometer with film #1, (b) microbolometer with film #2, and (c) microbolometer with film #3.
Inorganics 13 00126 g004
Figure 5. Power Spectral Density (PSD) distribution and noise contributions in 3 microbolometers with different a-SiGe:H,N thermo-sensing films.
Inorganics 13 00126 g005
Figure 6. (a) Current-voltage I(V) characteristics of the microbolometer with a-SiGe:H,N film #1 at different temperatures ranging from 300 K to 430 K. (b) Temperature dependence of the electrical resistance R(T) of the microbolometer with a-SiGe:H,N film #1.
Inorganics 13 00126 g006
Figure 7. Fabrication process scheme of the microbolometer: (a) Cleaning of the silicon wafer, (b) SiO2 deposition for thermal insulation, (c) titanium deposition and patterning for contacts and reflective mirrors, (d) Application of the sacrificial polyimide layer, (e) Etching to expose the contacts, (f) Titanium deposition and patterning for sensor film contact electrodes, (g) Deposition and definition of the a-SiGe:H,N film, (h) Complete removal of the polyimide sacrificial film, (i) final fabricated microbolometer.
Inorganics 13 00126 g007
Figure 8. SEM images of the fabricated microbolometer of an area of 50 µm × 50 µm: (a) top view and (b) view at a 60 degree inclination.
Inorganics 13 00126 g008
Table 1. Average roughness of the three a-SiGe:H,N thermo-sensing films measured with AFM (Atomic Force Microscopy). The voltage responsivity, current responsivity, and room temperature resistance of the microbolometers are also shown with the three different films.
Microbolometer
Films
Gases Flow Rates
Used for Deposition
(sccm)
Average
Roughness
(nm)
Voltage
Responsivity
R V
(V/W)
Current
Responsivity
R I
(A/W)
Room
Temperature
Resistance
(Ω)
Film #1SiH4 = 40 sccm/GeH4 = 10 sccm/
N2 = 100 sccm/H2 = 1000 sccm
4.51 7.26 × 1055.25 × 1022.76 × 103
Film #2SiH4 = 30 sccm/GeH4 = 20 sccm/
N2 = 100 sccm/H2 = 1000 sccm
5.68 4.99 × 1053.99 × 10−11.57 × 10⁸
Film #3SiH4 = 10 sccm/GeH4 = 40 sccm/
N2 = 100 sccm/H2 = 1000 sccm
8.408.16 × 1052.60 × 10−15.72 × 10⁶
Table 2. Noise, room temperature resistance, NEP, detectivity and NETD values of microbolometers with three different a-SiGe:H,N thermo-sensing films.
Microbolometer
Film
Frequency ( H z ) v n
( V r m s H z )
Room Temperature
Resistance
(Ω)
NEP
( W H z )
Detectivity
D * ( c m H z W )
NETD
(mK)
Film #13020.2 × 10−9 2.78 × 10−141.80 × 10945.15
10010.8 × 10−92.76 × 1031.49 × 10−143.36 × 10924.14
14010.0 × 10−9 1.38 × 10−143.63 × 10922.35
Film #230313 × 10−9 6.28 × 10−137.96 × 1071018
100196 × 10−915.7 × 1093.92 × 10−131.28 × 108637.38
140198 × 10−9 3.96 × 10−131.26 × 108643.88
Film #330314 × 10−9 3.84 × 10−131.30 × 108624.43
100194 × 10−95.72 × 1062.38 × 10−132.10 × 108186.93
140180 × 10−9 2.20 × 10−132.27 × 108357.95
Disclaimer/Publisher’s Note: The statements, opinions and data contained in all publications are solely those of the individual author(s) and contributor(s) and not of MDPI and/or the editor(s). MDPI and/or the editor(s) disclaim responsibility for any injury to people or property resulting from any ideas, methods, instructions or products referred to in the content.