Article

Lanthanide Exposure In Vitro Differentially Diminishes MTT Cell Viability in Axenic Neuronal or Glial Cell Model Systems

Department of Chemistry, Illinois State University, Normal, IL 61790, USA
*
Author to whom correspondence should be addressed.
Inorganics 2025, 13(4), 127; https://doi.org/10.3390/inorganics13040127
Submission received: 16 January 2025 / Revised: 3 April 2025 / Accepted: 15 April 2025 / Published: 20 April 2025
(This article belongs to the Section Bioinorganic Chemistry)

Abstract

:
Applications of lanthanide chemistry have been successful in metallics and the petroleum industry. In the medical realm, lanthanides have shown utility in radiotherapy agents, photodynamic therapy agents, and magnetic resonance imaging (MRI) contrast agents. The lanthanide group elements have a few known biological roles, notably among some bacteria and the yeast Saccharomyces cerevisiae, which have been used as models for changes in gene expression. However, the systematic effects of lanthanide nitrates on eukaryotic cell model systems have not yet been reported. This study presents the first documented effects on cell viability, after acute incubations of various lanthanide nitrate salts, using axenic C6 glial or PC12 neuronal cells in vitro. Cultures were exposed to a 1 mM concentration of lanthanide nitrate salts for 24 h. In comparison to the saline control, several cultures demonstrated significantly lower cell viability, as measured by the MTT viability assay. Data were analyzed as an average absorbance of n = 4 replicate samples, corrected for the average absorbance of cell-free blanks. The reported results were normalized to the average of the saline control cells. Among the 13 lanthanides tested, Praseodymium, Holmium, Erbium, Thulium, and Ytterbium nitrates exhibited the most pronounced inhibitory effects, resulting in over 40% reduction in cell viability at 1 mM for either or both cell types. Recovery after lanthanide exposure also was cell-type-dependent as well as lanthanide-type-dependent, with Lutetium having the greatest effect on both cell types. PC12 cells displayed greater sensitivity for inhibition than the C6 cells with some of the lanthanides but not all. Furthermore, the controls of sodium nitrate and calcium nitrate showed only modest discernible impacts on cell viability for PC12 and C6 cells, highlighting the role of the lanthanides in influencing cell viability.

1. Introduction

The 15 ‘4f Block’ elements, elements 57 to 71, in the Periodic Table are generally referred to the as the lanthanides and are dominated by their 3+ oxidation states, although other oxidation states are also known [1]. Lanthanides are becoming of increasing interest due to their many industrial and medical uses, such as catalysts, semiconductors, permanent magnets, lasers, and MRI contrast agents. Some 15,000 ton per year is mined [2,3].
Since 2000, publications reporting both toxic and protective effects of lanthanides in humans, animals, and plants, such as algae, have been reported [4,5]. In 2014, there was no consensus as to whether the lanthanides show a predictable pattern of toxicity, except perhaps in the case of aquatic organisms [6]. In addition, it is now well established that there are some ‘lanthanide-loving’ bacteria that require specific lanthanides to survive. The classic example is the use of a lanthanide ion required by the methanol dehydrogenase of Methylacidiphilum fumariolicum SolV, a microbe that converts methanol to formaldehyde [7]. A recent example demonstrates hyperaccumulation of gadolinium by a genetic variant of the model methylotrophic bacterium Methylorubrum extorquens AM1 to a concentration sufficient to produce magnetic resonance imaging (MRI) contrast in whole cells [8]. There are several recently reported bacteria that use lanthanides, and this active field of study has been dubbed the lanthanome (reviewed by [9]). Cotruvo (2019) and Featherson et al. (2021) have nicely reviewed the chemistry of lanthanides, indicating that the biological use of lanthanides (selectivity of uptake, storage, usage, and elimination) is very logical from the chemical perspective of their coordination chemistry, large ionic radii, and Lewis acidity [10,11]. The early lanthanides (La through Nd) are fairly abundant in the Earth’s crust (10–70 ppm), while the subsequent lanthanides are about 10–100 times less abundant [10]. The author notes that bacteria appear to strongly prefer the early lanthanides while plants seem to accumulate these in relative proportion to their soil concentrations. Cotruvo speculates that there is a likely relationship between soil bacteria and plants that grow in that soil [10]. As a result, some lanthanides have been used as fertilizers since they accumulate in plants and increase crop yields, notably in rice [12]. Additionally, it has been found that zebrafish exposed to variable concentrations of La(III), Ce(III), and Nd(III) nitrates showed acute toxicity (LC50) between 2 and 3 mg/L of lanthanide [13].
The ability of various lanthanides to substitute for Ca2+ in biological systems has been an important area of research. This is of interest due to the various biological roles of calcium ions in signal transduction, blood clotting pathways, enzyme regulation, muscle contraction, and formation of bone and teeth. Edington et al. (2018) report that lanthanide ions can bind to and distort the conformation of the pivotal calcium binding protein calmodulin. This is important since calmodulin controls many of the functions of calcium [14]. Vikolova et al. (2023) offered a systematic investigation into the ability of the entire lanthanide series to substitute for Ca2+ ions in calcium binding proteins using DFT/PCM calculations. They reported that the interaction is likely to be determined by a balance between the electronic effects (favoring heavier lanthanides) and solvation (generally favoring the lighter lanthanides) [15].
In an elegant series of experiments and publications, Pallares et al. [16,17,18,19], using the yeast Saccharomyces cerevisiae as a model organism, assessed the potential toxicity mechanisms of lanthanides. Since this yeast shares many cellular pathways and functions with humans, their data have important implications. They found three distinct trends involving gene ontology (GO) enrichment analysis. These trends discriminate overrepresented gene groups based on their functional characteristics involving biological processes, cellular components, and molecular functions. Within the lanthanide series, the authors correlated the GO with the early lanthanides (La to Eu), middle lanthanides (from Gd to Dy), and late lanthanides (from Ho to Lu). This correlation revealed a low GO enrichment number for the early lanthanides, a high GO enrichment number for the middle, and a high number of resistant GO groups for the late lanthanides. This transition from low to high numbers of enriched GO terms occurred at Gd, consistent with the ‘gadolinium break’ discontinuity in the lanthanide series observed for multiple properties such as ionic radii and solvent extraction equilibria. These authors also reported that some key enzymes such as transferases and glucosidases are dysregulated by the early lanthanides, thus inducing cytotoxicity. They also hypothesized that Yb(III) and Lu(III) were able to bind to a wide range of ‘SH3-domain’-containing proteins, thereby disrupting their function [16,17,18,19].
Interestingly, while larger effects have generally been observed for the larger, early lanthanides, Sweeney et al. (2023) identified lanthanide-using ribozymes, but observed only the heaviest (smallest) lanthanides were active triphosphorylation cofactors. Ribozyme activity was maximal with Lu(III) and Yb(III), half-maximal for Tm(III), weak with Er(III), and barely detectable with Ho(III) [20].
Patasz et al. (2019) extensively reviewed the literature involving the molecular neurochemistry of the lanthanides published over the last 19 years and indicated that the lanthanide ions uniquely modulate several important neurochemical functions [21]. These involved effects on ion channels, modulation of ionotropic receptors, and promotion of reactive oxygen species production in human and animal models. The authors indicated that since most people may be exposed to lanthanide-containing materials, both at home and in the workforce, the risks of potential effects (positive or negative) have increased. Nevertheless, the biochemistry of the lanthanides remains poorly understood, partially due to the variety of experimental designs used, including different lanthanide salts, concentrations, oxidation states, ways to monitor the effects, and organisms and cells tested [21].
Thus, we have now expanded this work on the effects of lanthanides on living things with a systematic study of nitrate salts of the trivalent lanthanides in culture with axenic PC12 cells (a model for neurons) or axenic C6 cells (a model for glial cells). We have measured cell viability as a function of concentration of exposure, time of lanthanide exposure, and recovery from exposure. The 13 trivalent lanthanides tested were incubated as nitrate hexahydrate salts dissolved in saline (7 g NaCl per liter water; 120 mM). Control cell incubations included the addition of saline only, sodium nitrate, or calcium nitrate, as non-lanthanide controls to test for the effects of the nitrate anion and sodium or calcium cation on cell function.

2. Results

2.1. Saline/Sodium Nitrate/Calcium Nitrate

Experiments were conducted with either C6 or PC12 cells using saline, sodium nitrate, or calcium nitrate to assess any non-lanthanide effects on cells. Cells were incubated for 24 hr following additions, and then cell viability was determined with the MTT assay. Saline performed statistically the same with either the C6 or the PC12 cells and thus response was set as 100% for each cell type. The two cell types, however, reacted differently to the calcium nitrate or sodium nitrate addition with the Percent of Average Saline Control for the C6 cells being 84% (p < 0.05) with calcium nitrate and 112% (p > 0.05) for the PC12 with sodium nitrate cells, as shown in Figure 1.

2.2. Concentration Variation Experiments

Experiments were conducted on both C6 and PC12 cells using three different final concentrations of lanthanides (0.01 mM, 0.1 mM, and 1 mM). Nine lanthanides (La, Ce, Pr, Sm, Eu, Ho, Er, Tm, and Yb) were tested at concentrations of 0.01 mM and 0.1 mM, while 13 lanthanides (La, Ce, Pr, Nd, Sm, Eu, Gd, Tb, Ho, Er, Tm, Yb, and Lu) were tested at a concentration of 1 mM. Cells were incubated for 24 hr and then cell viability was determined with the MTT assay.

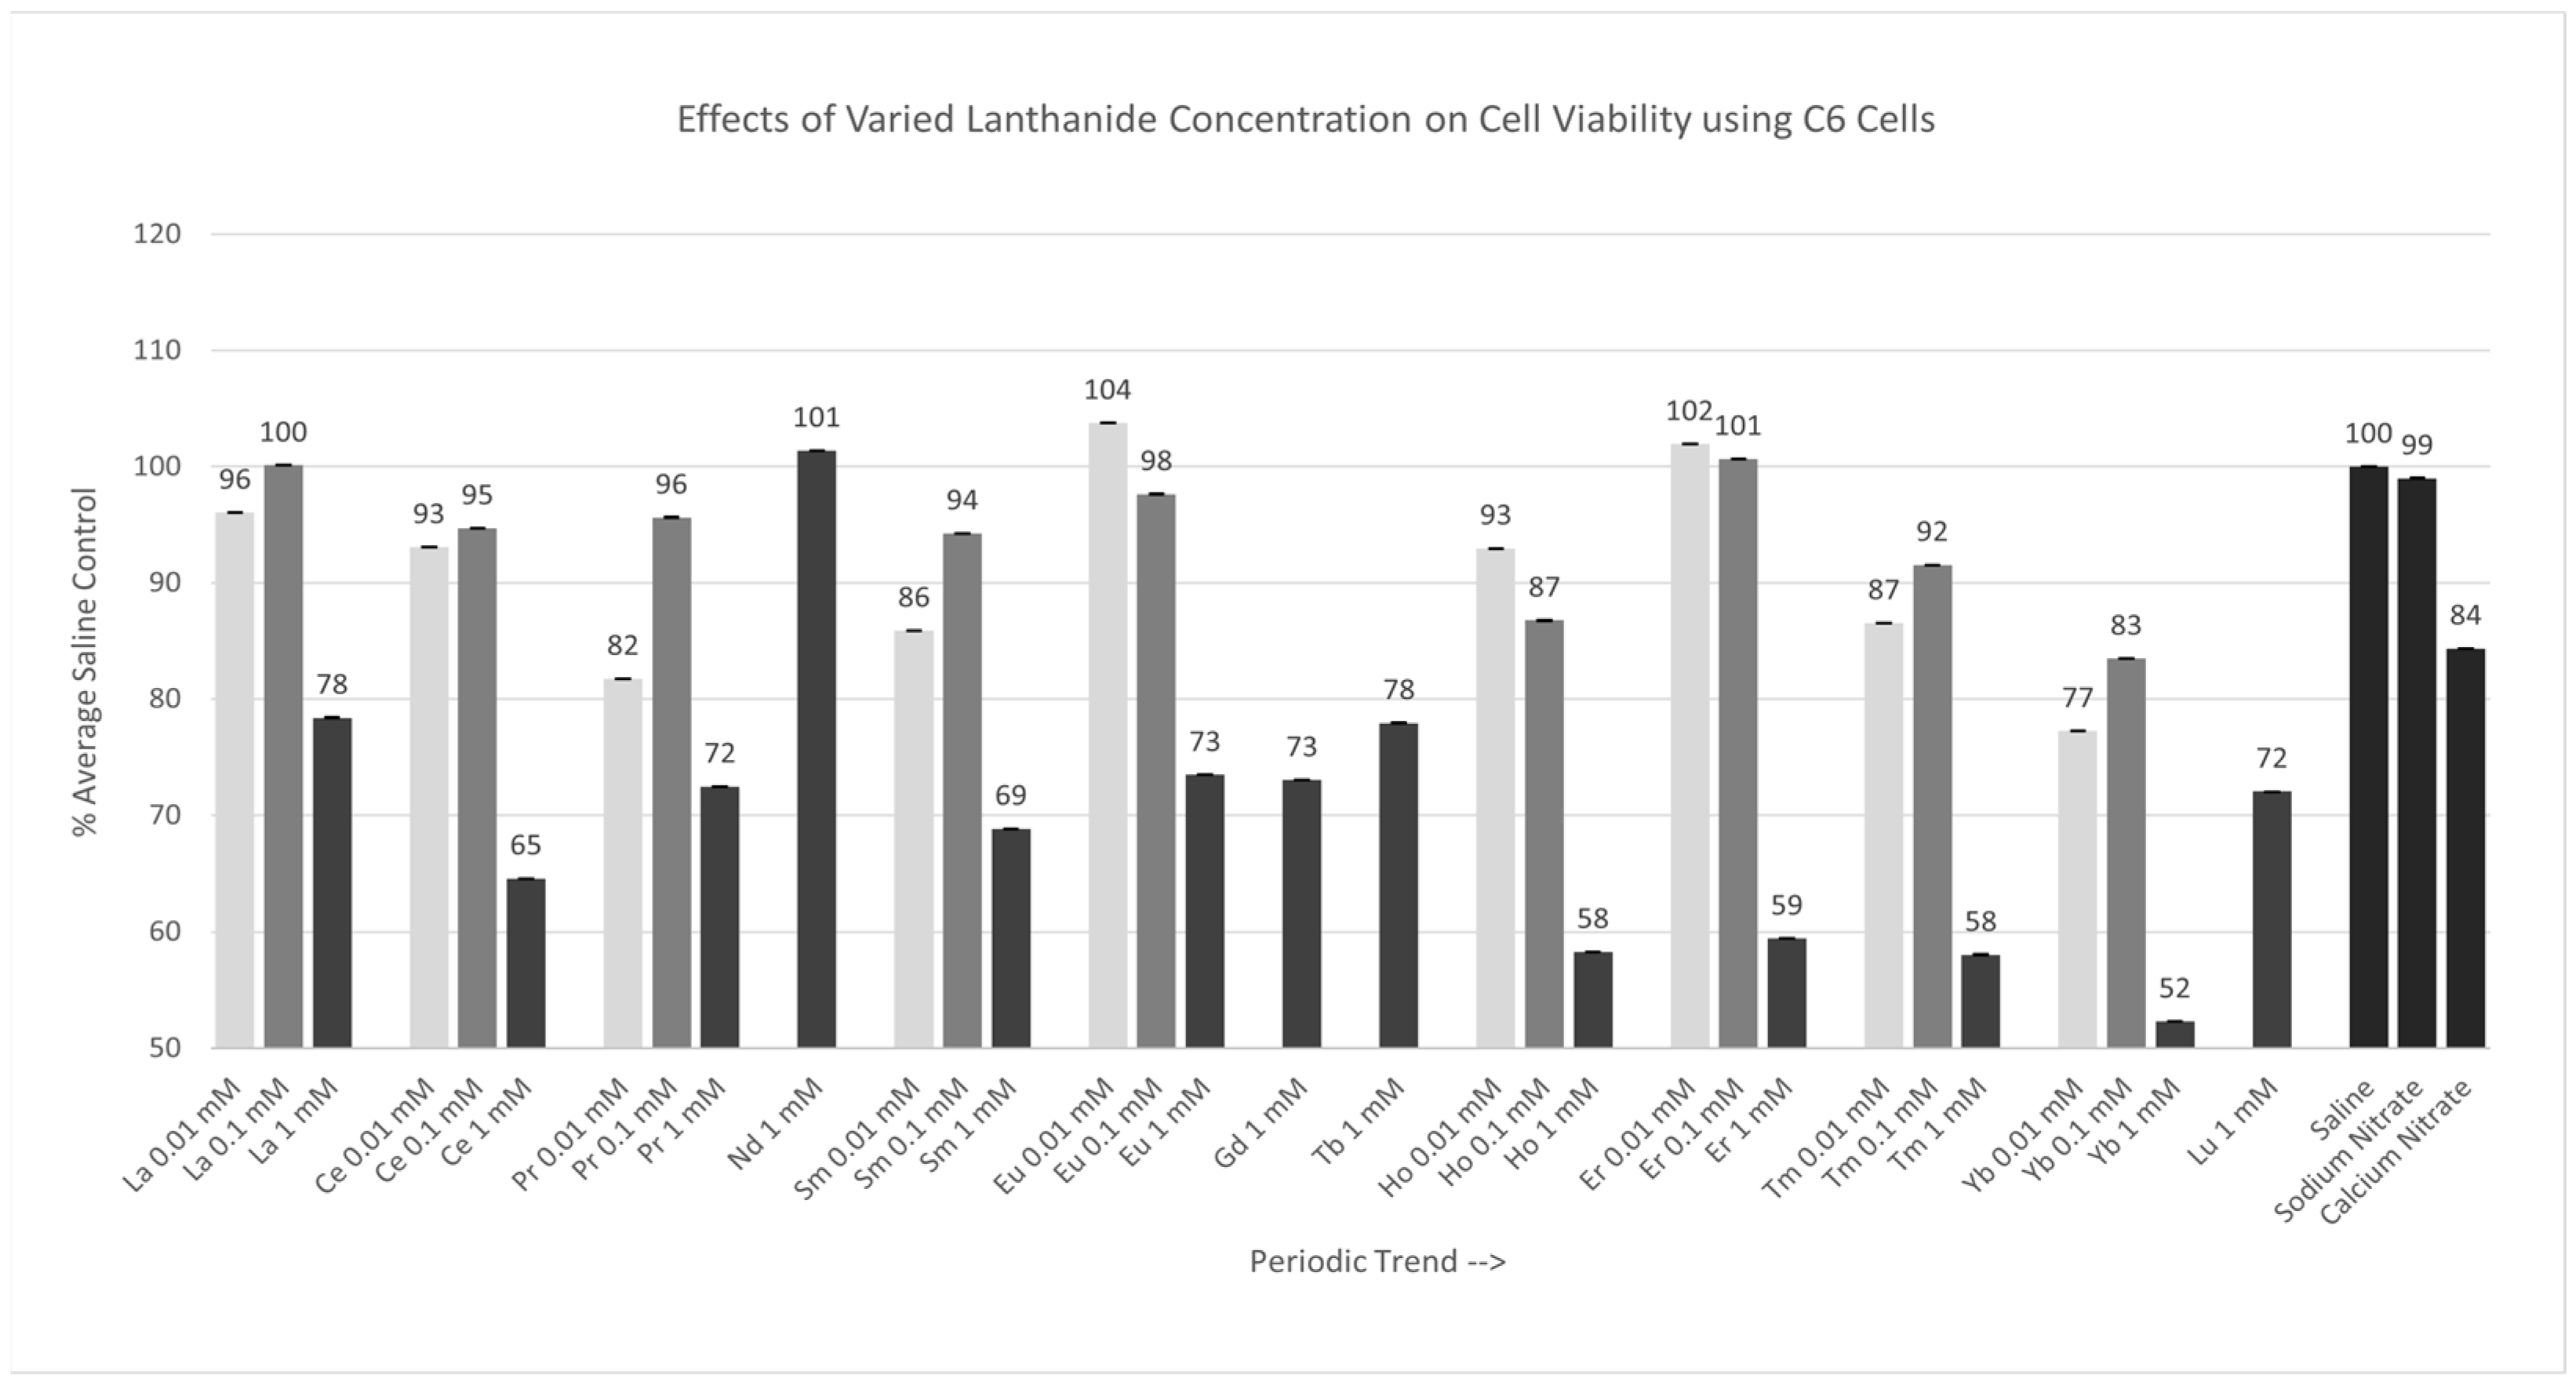
2.2.1. C6 Cells [0.01 mM, 0.1 mM, 1 mM]

Of the nine lanthanides tested at 0.01 mM, the cell responses to only Pr, Sm, Eu, Tm, and Yb were significantly different (p < 0.05) from those of saline, as shown in Figure 2. The Percent of Average Saline Control values for these lanthanides were 82, 86, 104, 87, and 77%, respectively. The results for La, Ce, Ho, and Er were similar to (p > 0.05) saline, with Percent of Average Saline Control values of 96, 93, 93, and 102%, respectively. Of the nine lanthanides test at 0.1 mM, only Ho and Yb were significantly different (p < 0.05) from the saline control cells. The Percent of Average Saline Control values for these lanthanides were 87 and 83%, respectively. The results for La, Ce, Pr, Sm, Eu, Er, and Tm were not significantly different from (p > 0.05) the saline control cells, with Percent of Average Saline Control values of 100, 95, 96, 94, 98, 101, and 92%, respectively. Of the 13 lanthanides tested at 1 mM, all lanthanides, except Nd, were significantly different (p < 0.05) from the saline control cells. The Percent of Average Saline Control values for these lanthanides were 78, 65, 72, 69, 73, 73, 78, 58, 59, 58, 52, and 72%, with the 1 mM Yb having the largest negative effect on cell viability under these conditions.

2.2.2. PC12 Cells [0.01 mM, 0.1 mM, 1 mM]

Of the nine lanthanides tested at 0.01 mM or 0.1 mM, none were significantly different (p < 0.05) from the saline control cells. Of the 13 lanthanides tested at 1 mM, Ce, Pr, Sm, Eu, Gd, Tb, Ho, Er, Tm, and Yb were significantly different (p < 0.05) relative to the saline control cells, as shown in Figure 3, with Ho having the largest negative effect on cell viability. The Percent of Average Saline Control values for these lanthanides were 73, 60, 66, 73, 80, 68, 54, 67, 78, and 62%, respectively. The results for La, Nd, and Lu were not significantly different relative to (p > 0.05) the saline control cells, with Percent of Average Saline Control values of 87, 111, and 87%.

2.3. Incubation Time Experiments

Experiments were conducted with both C6 and PC12 cells with the various lanthanides using two different incubation times: 1 hr and 24 hr, as shown in Figure 4 and Figure 5. Thirteen lanthanides, with a final concentration of 1 mM, were used in these trials.

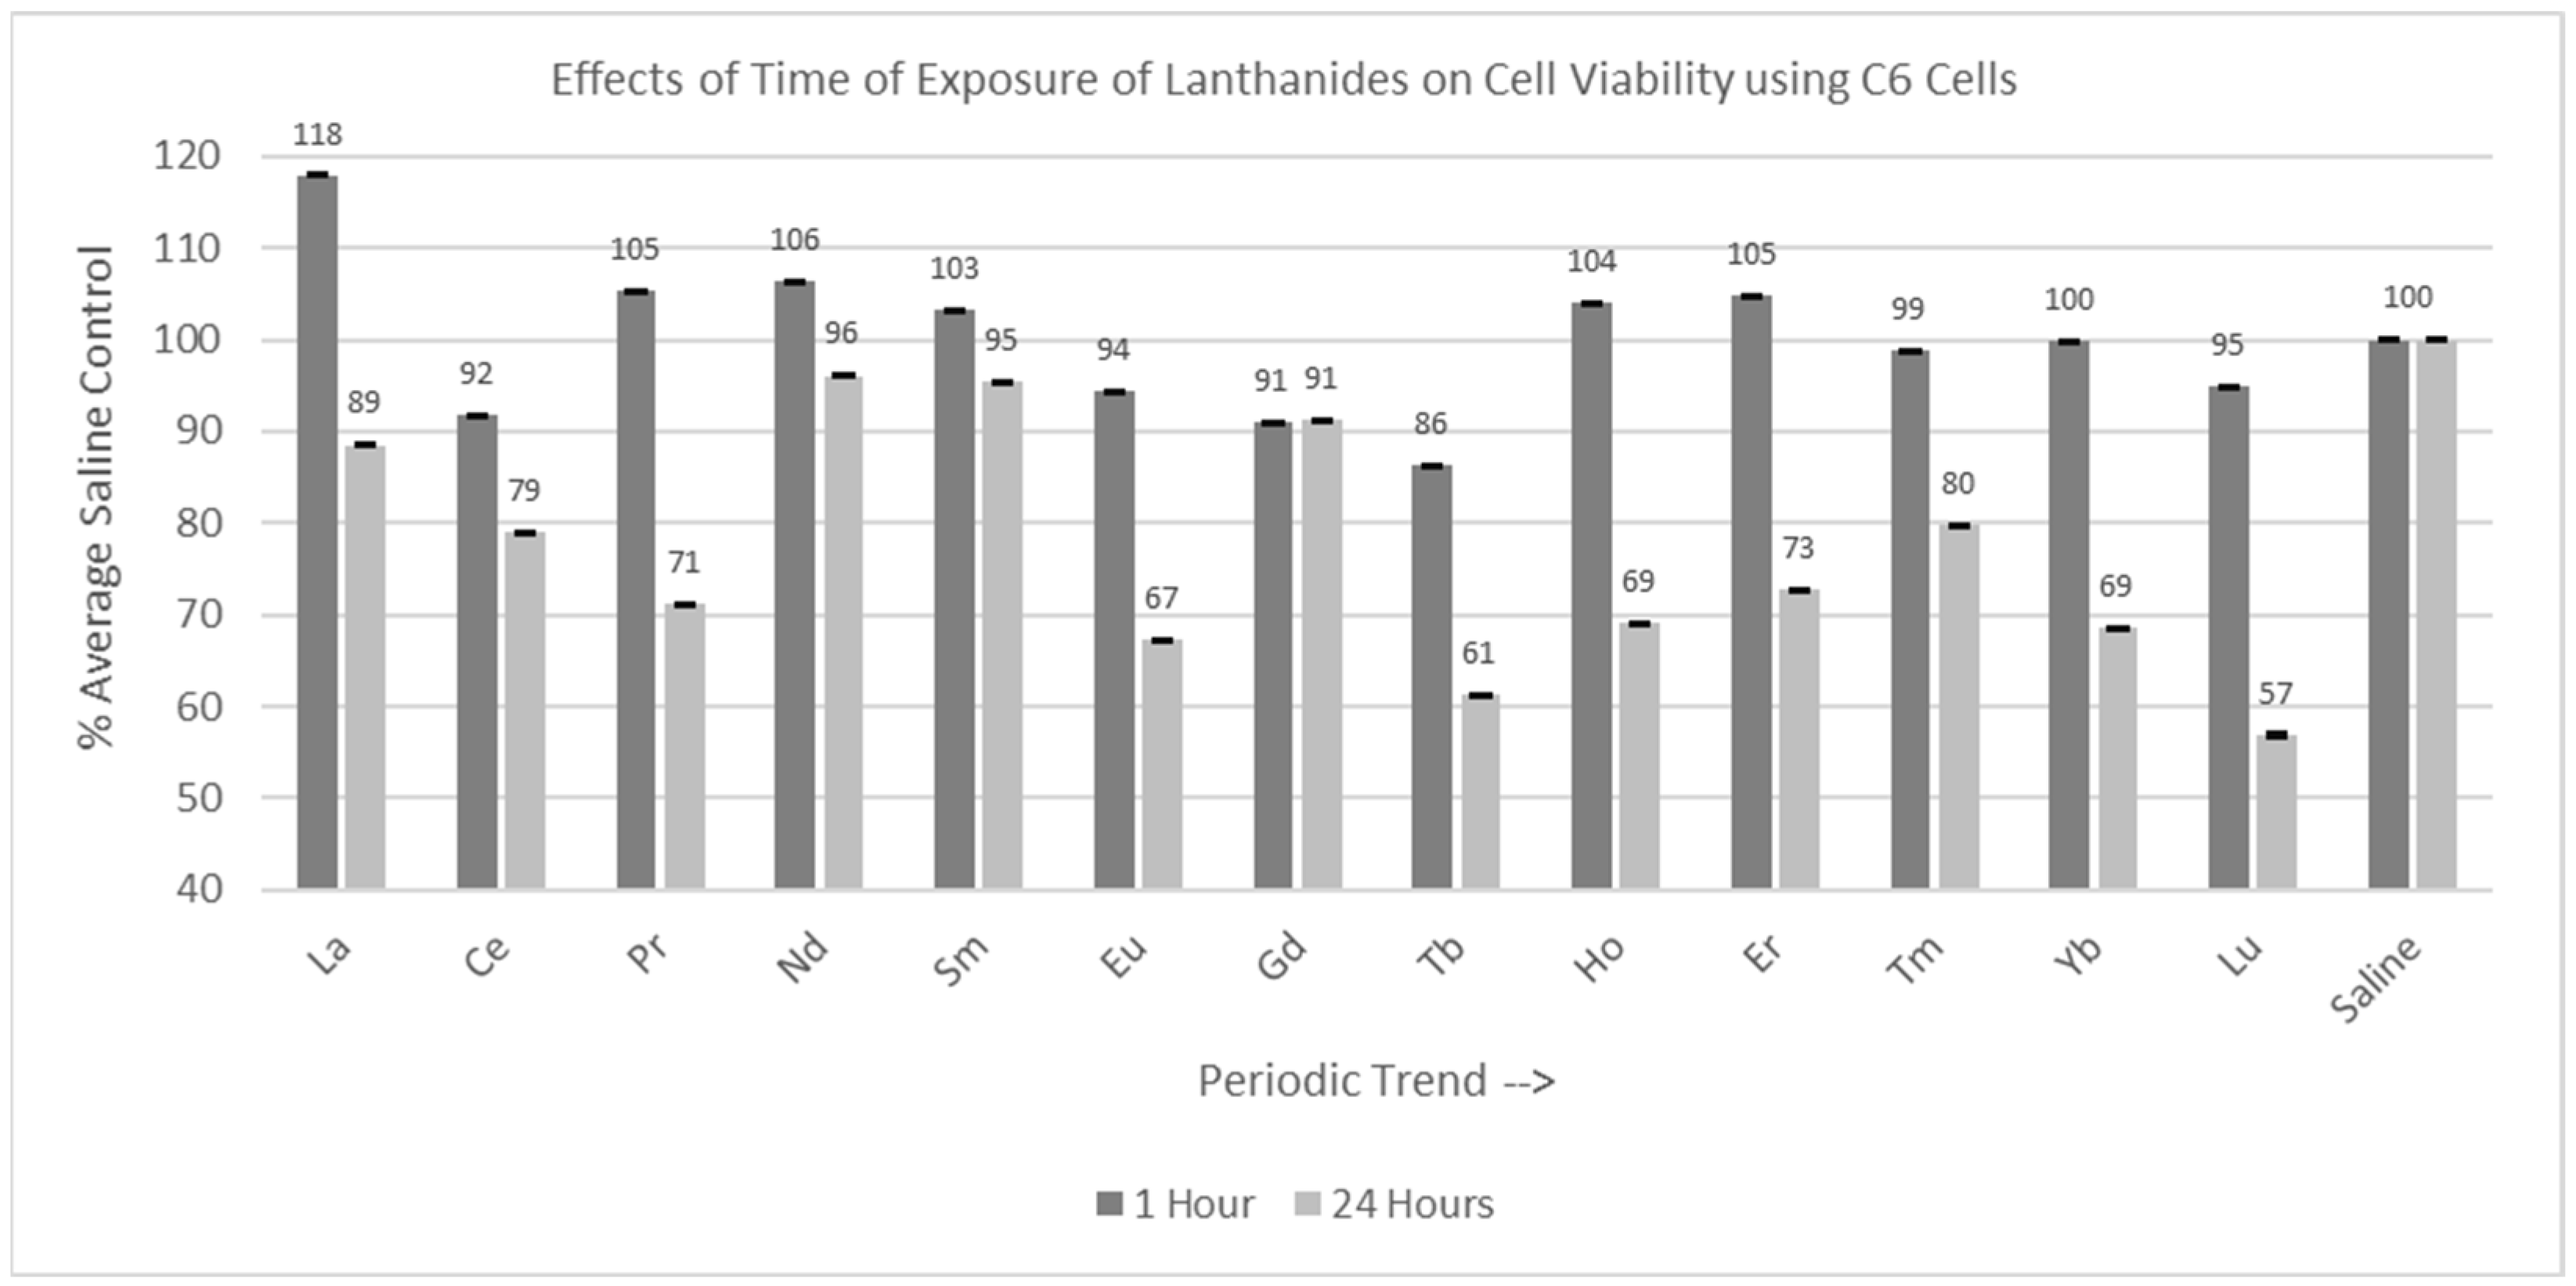
2.3.1. C6 Cells (1 hr and 24 hr Incubation)

Of the 13 lanthanides tested for the one-hour incubation period, all were significantly different (p < 0.05) from the saline control cells, as shown in Figure 4. However, many of the Percent of Average Saline Control values were greater than or close to 100%. The Percent of Average Saline Control values were 118, 92, 105, 106, 103, 94, 91, 86, 104, 105, 99, 100, and 95%, respectively. Of the 13 lanthanides tested for the 24 hr incubation period, 11 lanthanides (La, Ce, Pr, Eu, Gd, Tb, Ho, Er, Tm, Yb, and Lu) were significantly decreased (p < 0.05) relative to the saline control cells, with Lu having the most negative effect on cell viability. The Percent of Average Saline Control values for these lanthanides were 89, 79, 71, 67, 91, 61, 69, 73, 80, 69, and 57%, respectively. Nd and Sm were not significantly different from (p > 0.05) the saline control cells, with Percent of Average Saline Control values of 96 and 95%, respectively.

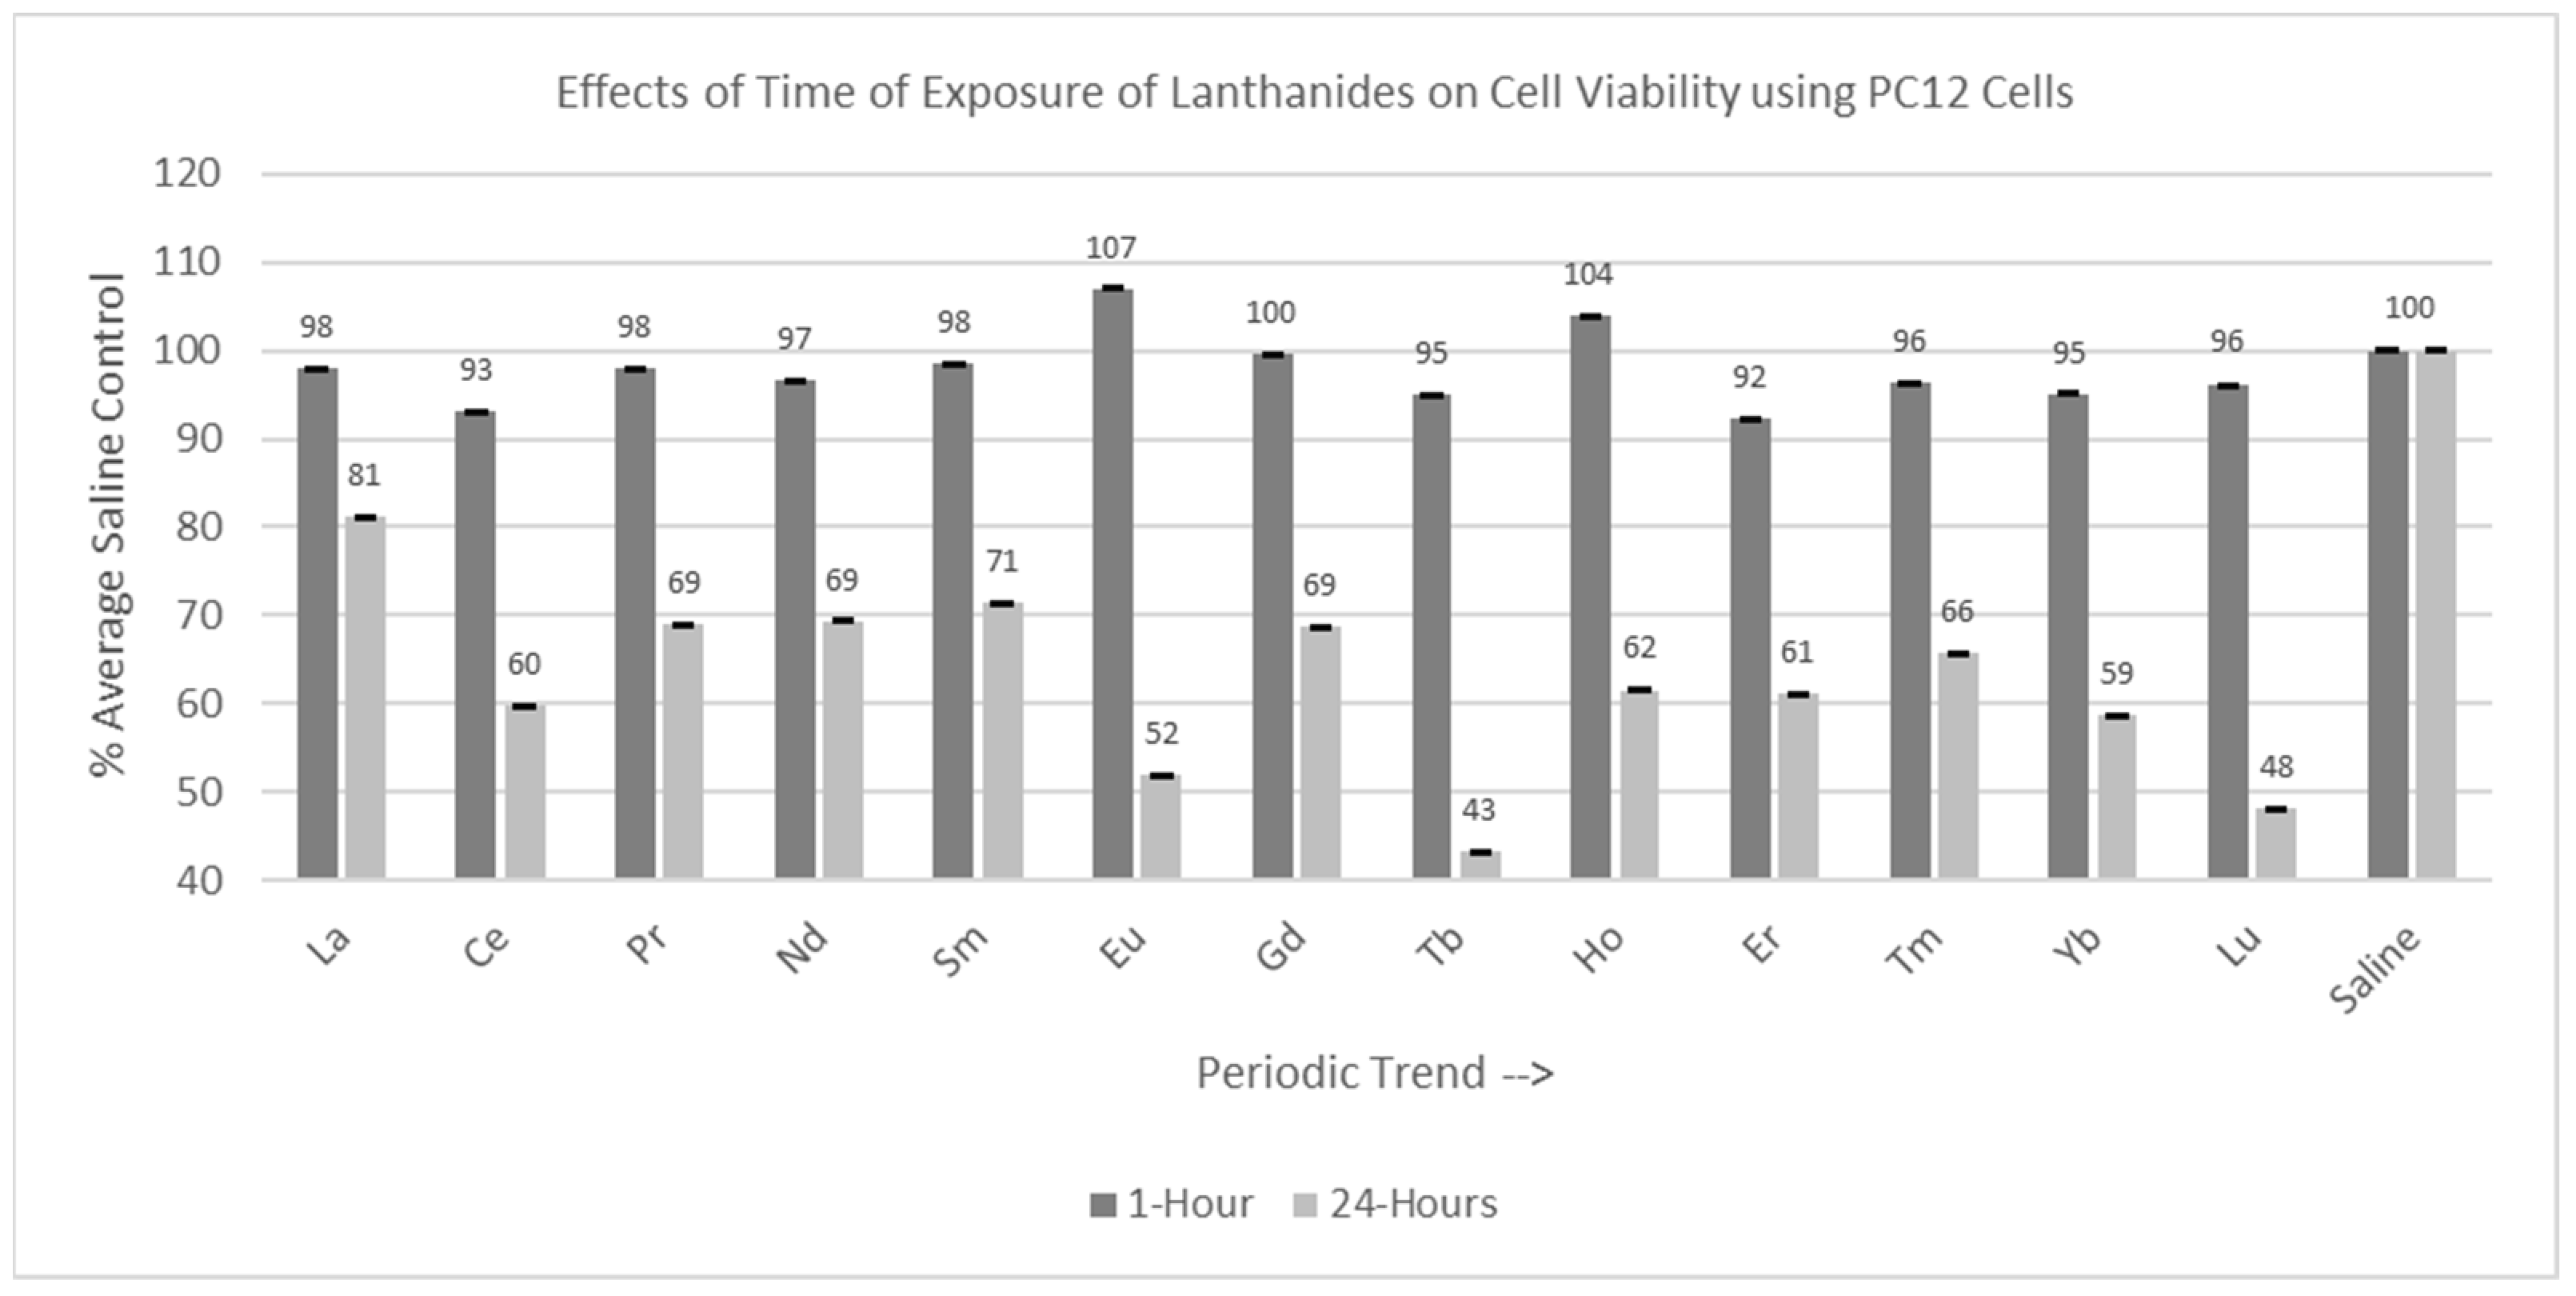
2.3.2. PC12 Cells (1 hr and 24 hr Incubation)

Of the 13 lanthanides tested for the one-hour incubation period, none were statistically different from (p > 0.05) the saline control cells, as shown in Figure 5. Of the 13 lanthanides tested for the 24 hr incubation period, all were significantly decreased (p < 0.05) compared to the saline control cells, with Tb having the most negative effect on cell viability.

2.4. Recovery After Lanthanide Removal Experiments

Experiments were conducted with both C6 and PC12 cells using the same 13 lanthanides at a final concentration of 1 mM. Cells were incubated with the lanthanide for 24 hr. Then, lanthanide was removed by removing 90 μL of the supernatant and replaced with 90 μL of fresh complete DMEM. The cells were allowed to recover for an additional 24 hr. Cell viability was then determined with the MTT assay.

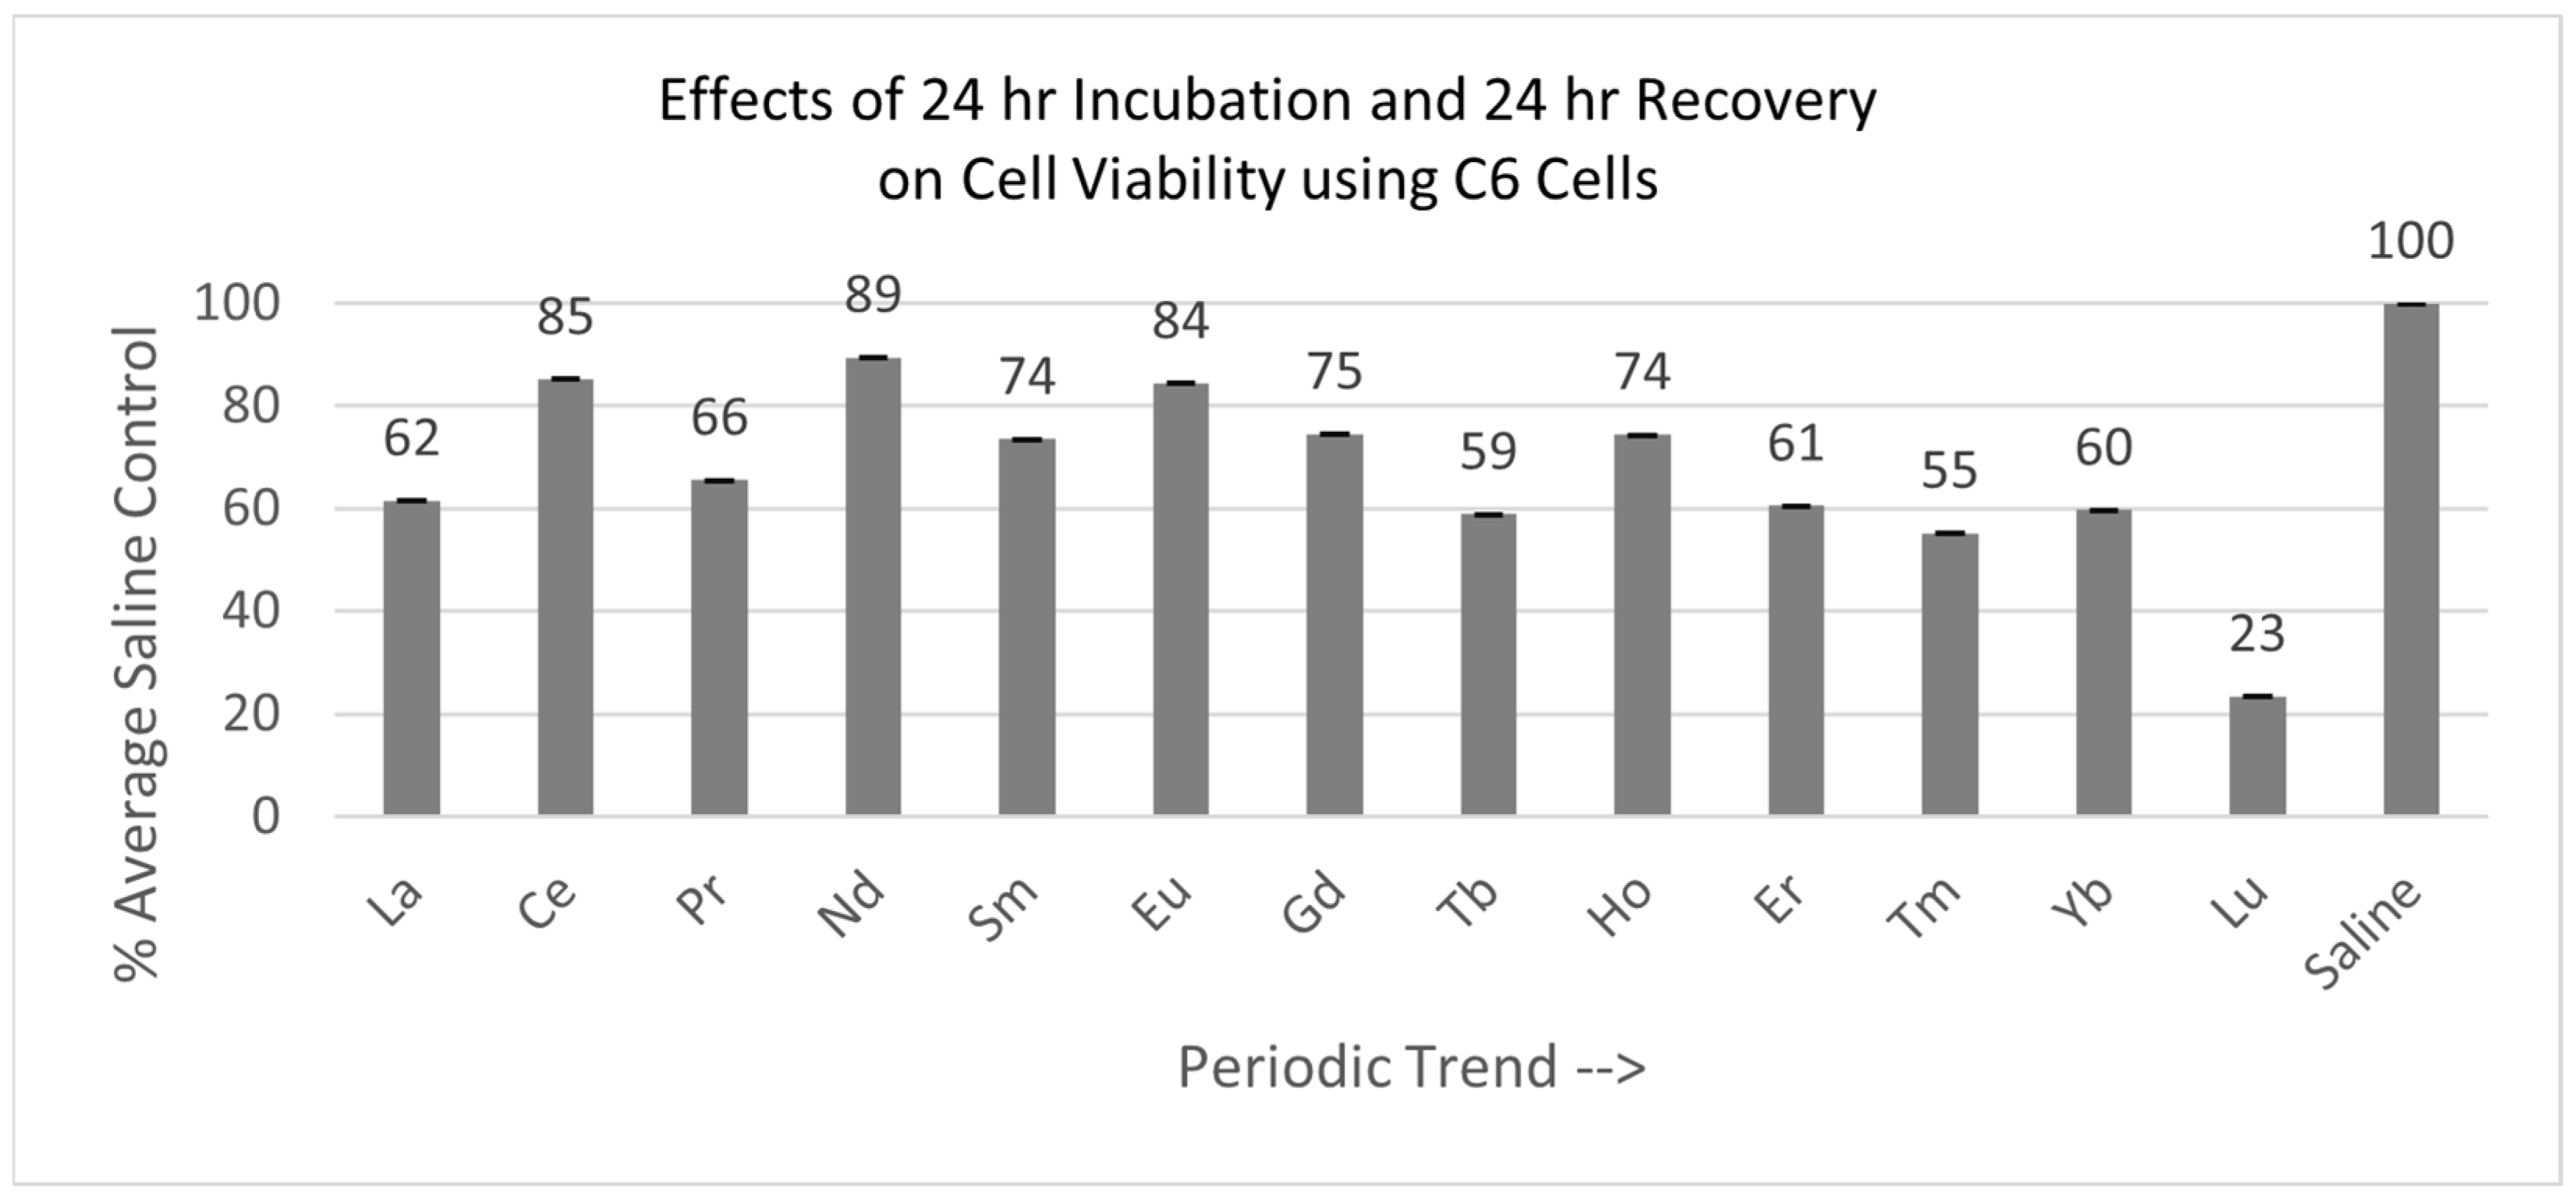
2.4.1. C6 Cells (24 hr Incubation with 24 hr Recovery)

Of the 13 lanthanides tested with the C6 cells, all were significantly decreased after the total of 48 hr, relative to the saline control cells, as shown in Figure 6. Cells exposed to Lu were the most negatively affected.

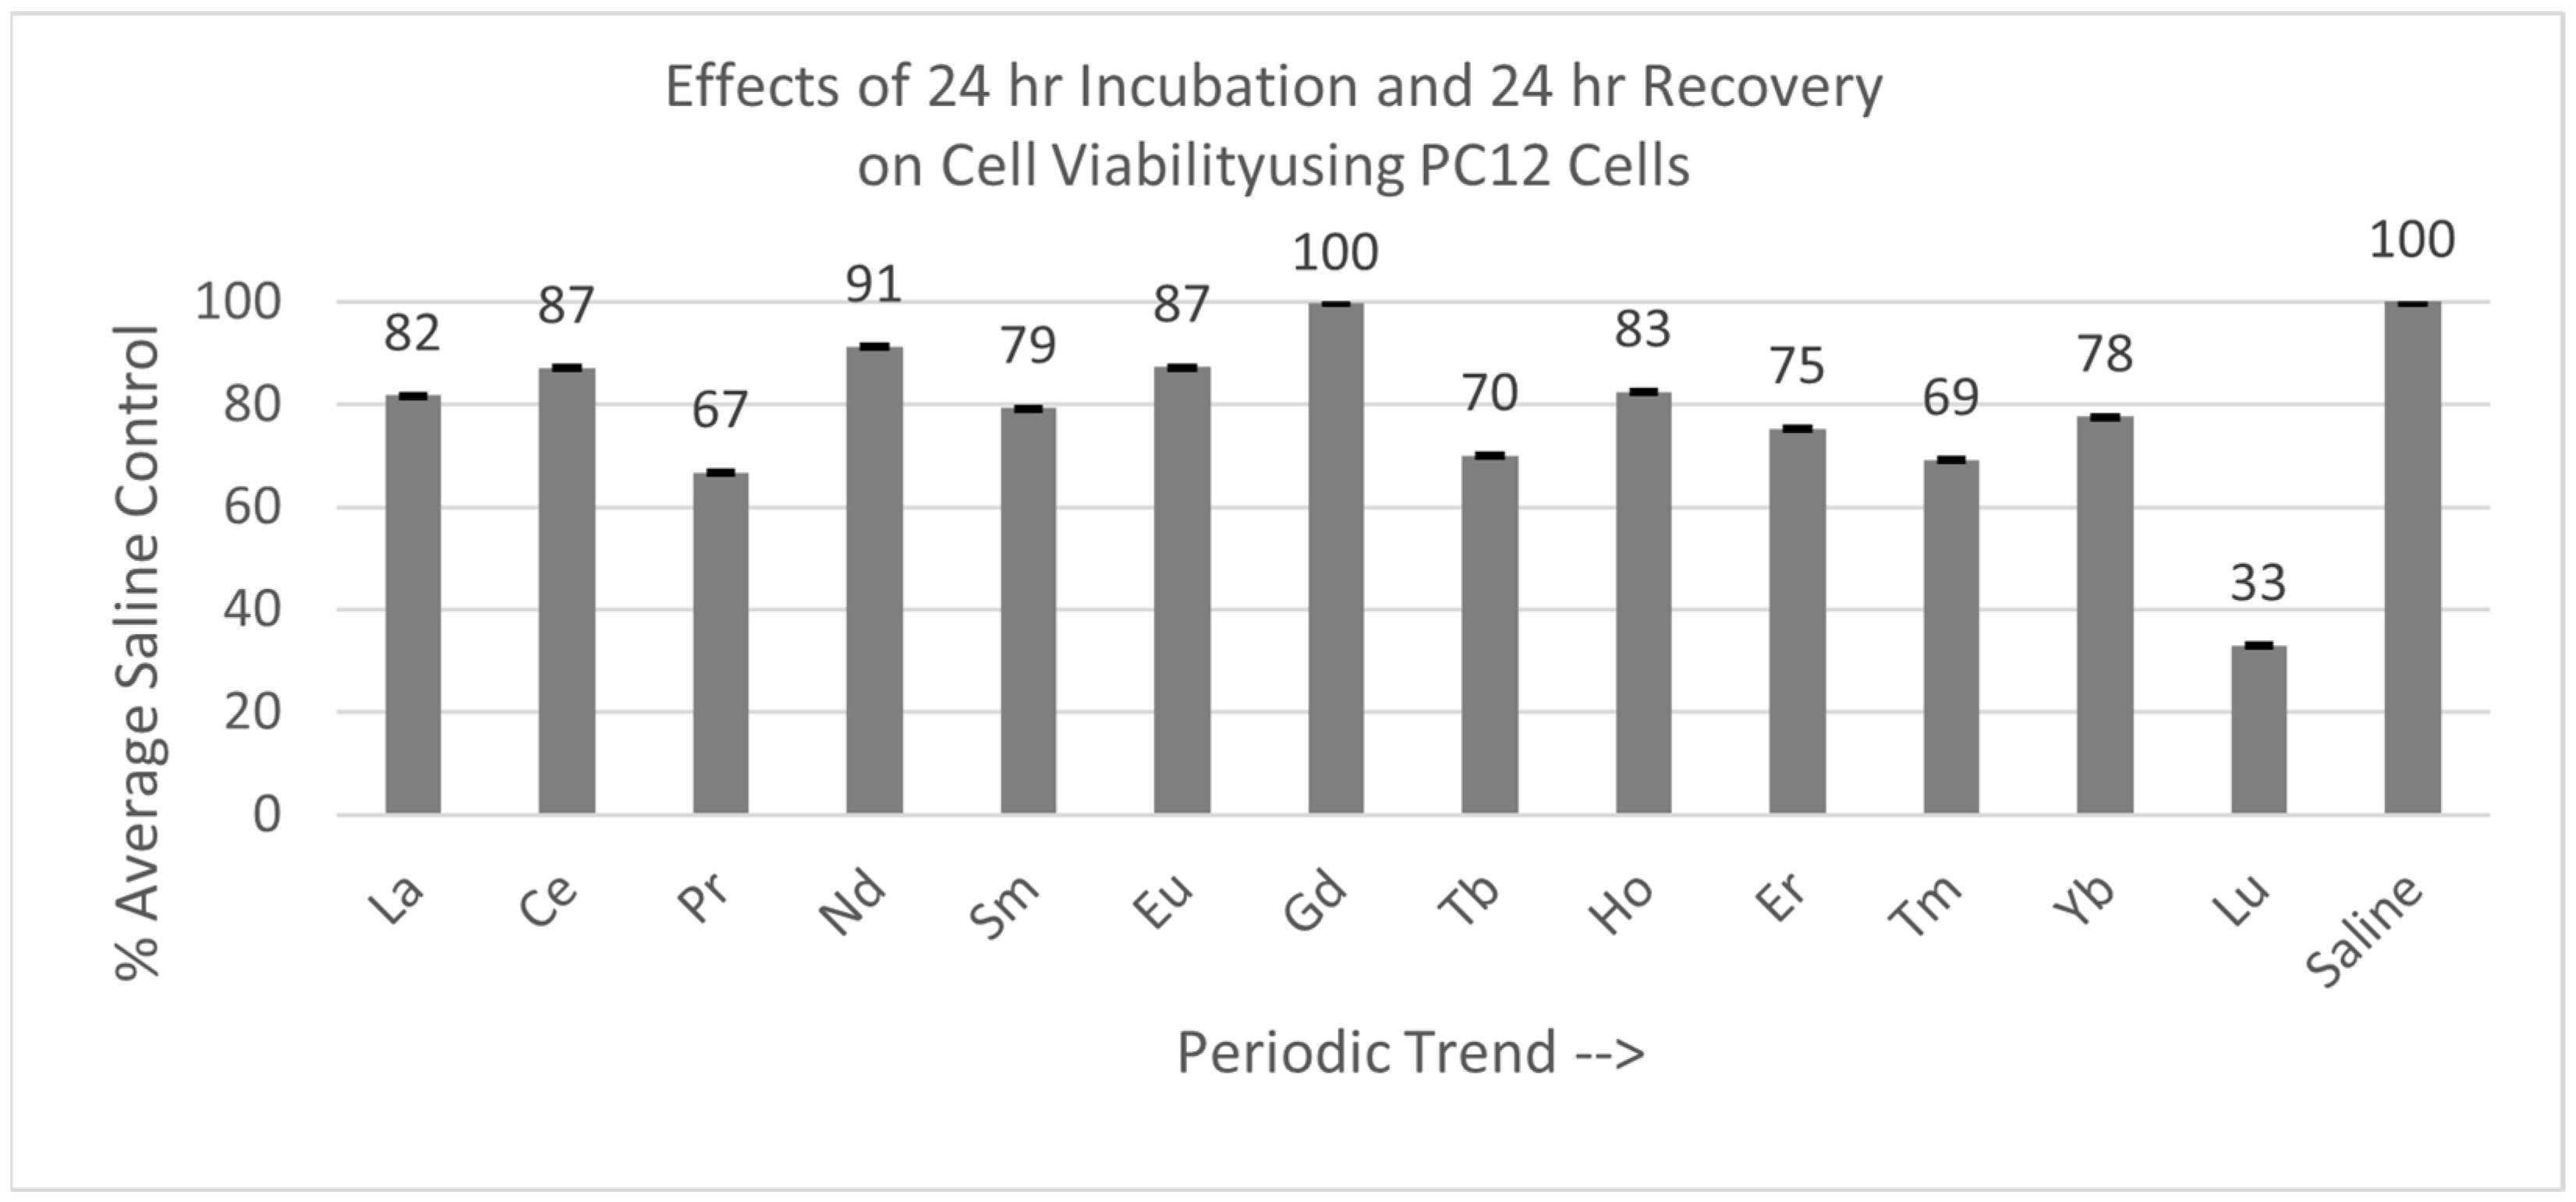
2.4.2. PC12 Cells (24 hr Incubation with 24 hr Recovery)

As shown in Figure 7, of the 13 lanthanides tested with the PC12 cells, only Gd was not statistically different from the saline control cells, with a Percent of Average Saline Control value of 100%. The other 12 lanthanides were significantly different (p < 0.05) to the saline control cells. The PC12 cells were also the most negatively affected by Lu exposure.

3. Discussion

This study explored the effects of lanthanide type, concentration, time of exposure, and recovery on the cell viability of axenic C6 or PC12 cells. Although there was a modest negative effect of addition of the calcium nitrate, but not sodium nitrate, on the cell viability of C6 cells, but not the PC12 cells, under our experimental conditions, we were able to demonstrate that with some of the lanthanides there were even larger inhibitory effects on cell viability that could not be attributed only to this nitrate anion. There was an interesting concentration dependency on the decrease in C6 cell viability for a variety of the lanthanides at which 1 mM final concentrations have a generally negative effect, with the exception of incubation with Nd. The PC12 cells were, in general, less inhibited by 0.01 mM and 0.1 mM lanthanides and three lanthanides did not affect cell viability at the 1 mM final concentration. Thus, the two cell types did not exhibit the same sensitivity to all lanthanides although the ‘late’ lanthanides appeared to be more detrimental to cell viability in general. As shown in Figure 4 and Figure 5, the Lu and Tb lanthanide incubations with either C6 or PC12 cells, at 24 hr, resulted in the largest decrease in cell viability. In addition, as shown in Figure 6 and Figure 7, the PC12 or C6 cells did not recover post exposure to Lu to the same extent as the cell recovery from the other lanthanides. It is of interest that the Lu lanthanide was one of the most effective inhibitory lanthanides reported by Pallares et al. [16,17,18,19] when considering the ability to inhibit ‘SH3-domain’-containing proteins. Among the 13 lanthanides tested, Praseodymium, Holmium, Erbium, Thulium, and Ytterbium nitrates exhibited the most pronounced inhibitory effects, resulting in over 40% reduction in cell viability at 1 mM for either or both cell types.
An advantage of our study is that these C6 and PC12 cells now provide a model system to test for the activities of these important proteins suggested by others. The data presented here have interesting implications for environmental impact as they demonstrate another example of lanthanide ions being biochemically active and, in this case, generally detrimental. With the widespread use of lanthanides in modern technology, increased mining and processing of these elements may lead to greater and hitherto unknown impact on living things. Future work should explore the molecular mechanisms of the toxicity of the most potent lanthanides as well as probe the ability of the two cell types to take up the lanthanides. Also, the direct and indirect effects of the potent lanthanides on cellular functions are important considerations in future experiments. Extending the lanthanide concentrations of the most potent ones should also be carried out to estimate the IC50 values for comparison with other inhibitors.

4. Materials and Methods

4.1. Cells

Cells were cultured as previously reported [22]. Briefly, while maintaining a sterile cell culture technique, axenic Rattus norvegicus C6 glioma cells were obtained from the American Type Culture Collection, Manassas, VA, USA (ATCC CCL-107), and cultured in sterile 6-well plates (GIBCO; Waltham, MA, USA) using Dulbecco’s Modified Eagle’s medium with low glucose, sodium pyruvate, and without phenol red or L-glutamine (DMEM REF:11054-020; GIBCO; Waltham, MA, USA), and supplemented with 1.5% (v/v) heat-inactivated fetal bovine serum (GIBCO; Waltham, MA, USA), 10% (v/v), sterile filtered horse serum (Sigma-Aldrich, St. Louis, MO, USA), and 4% sterile L-glutamine (Sigma-Aldrich; St. Louis, MO, USA). Medium supplemented with sera was referred to as “complete medium”, while non-supplemented medium was designated as “incomplete”.
Adherent Rattus norvegicus pheochromocytoma cells (PC-12; ATCC-CCL 1721.1), also sourced from ATCC, were cultured in complete medium. PC-12 cells were grown in sterile 6-well plates pre-coated with sterile Poly-L-lysine (Sigma-Aldrich; St. Louis, MO, USA) as received following the manufacturer’s recommendations to aid the cell adherence.
All cells were grown in an incubator at 37 °C, maintaining an atmosphere of 5% CO2 and 95% humidity. To transfer the cells, complete medium was removed and sterile trypsin (GIBCO; Waltham, MA, USA) was added, following the instructions provided by the manufacturer. After the cells were in suspension, trypsin was then promptly neutralized by the addition of complete medium and transferred to a sterile centrifuge tube. Resultant cell preparations were then centrifuged (Labnet Hermle Z 400K, Edison, NJ, USA) at 1000 rpm for 10 min at 7 °C. The supernatant was discarded before resuspending the cell pellet in complete medium and plated as required.
For experimental procedures, both cell types were grown to confluency before being trypsinized as previously described, resuspended in 1 mL of complete medium per confluent well of 6-well plate, diluted ten-fold, and then counted with a Scepter 2.0 Handheld Automated Cell Counter (Millipore, Burlington, MA, USA) affixed with a 60 µm sensor. Cells were subsequently seeded (adding 100 μL per well, thus adding an average of 6.4 × 10³ cells per well) into poly-L-lysine-coated flat-bottomed 96-well plates using separate plates for each cell type. Lanthanide or control solutions were introduced 24 hr after cell plating and incubated a further 24 hr unless otherwise indicated. To assess the effects of time, cell viability 1 hr post lanthanide addition was also evaluated. Replicate wells (n = 4) were set up for each experimental variation. No-cell controls were also set up containing the lanthanide additions so that potential spectral signals could be blanked out for the spectrophotometric viability assay as described below.

4.2. Viability Assays

To assess the viability of the cells with and without additions, cell viability tests were performed using the 3-[4,5-dimethylthiazol-2-yl]-2,5-diphenyltetrazoliumbromide (MTT) assay following the procedure of Mosmann [23] with the following variations: Before adding the MTT reagent (5 mg/mL water), 90 μL of the complete medium was removed from each well and 90 μL of incomplete medium was added. Then, 10 μL of MTT reagent was added per well, gently mixed, and incubated at 37 C in 5% CO2 for one hour. The reactions were stopped by the addition of 100 μL per well of the stopping reagent (10% v/v Triton X-100, 1 mM HCl in isopropanol) to lyse the cells and dissolve the formed formazan crystals. The absorbance values were recorded using the Bio-Rad® Microplate Reader Benchmark (Bio-Rad Laboratories, Tokyo, Japan) at A 595 nm. All MTT data were normalized to saline controls by calculating Average Percent Saline Control with the following formula: average (MTT − average blank MTT) ÷ (average (saline MTT − average saline blank MTT) × 60 ÷ time × 100. Data were obtained from 4 replicates and reported as mean ± standard deviation (SD). Statistical significance was assessed using one-way Analysis of Variance (ANOVA) and the Tukey post hoc test with a significant level of α < 0.05.

4.3. Stock Lanthanide Preparation

All lanthanide salts (hexahydrate, trinitrate) were purchased from Strem Chemical Company (Newburyport, MA, USA) and used without further purification. The lanthanides tested were Lanthanum (La), Cerium (Ce), Praseodymium (Pr), Neodymium (Nd), Samarium (Sm), Europium (Eu), Gadolinium (Gd), Terbium (Tb), Holmium (Ho), Erbium (Er), Thulium (Tm), Ytterbium (Yb), and Lutetium (Lu). To maintain sterility due to the sensitivity of PC12 and C6 cells, stock solutions were prepared under sterile conditions. Using 2 mL sterile polypropylene microcentrifuge tubes, each hexahydrate lanthanide trinitrate was weighed and diluted to 10 mM using sterile saline (0.7% (w/v) NaCl). Also, NaNO3 and Ca(NO3)2 were weighed and prepared as 100 mM stock solutions. These stock solutions were then diluted to 10 mM to serve as controls to determine any cell viability effect due to the nitrates in our test compounds. To correct for the potential effects of saline, wells containing only sterile saline served as an additional control.
The major experimental parameters tested in this series of experiments were type of cell studied, the type of control added (saline, Ca(NO3)2, Na(NO3), the type of lanthanide added, the effect of lanthanide concentration on cells, the effect of time of exposure to the lanthanide on cells, and the potential recovery of cells from lanthanide exposure. Values are mean ± standard deviation (SD) for n number of replicates.

5. Conclusions

The work presented here is the first report showing that some, but not all of the lanthanide series, can negatively affect either axenic neuronal cells or glial cell viability in vitro. The extent of cell inhibition was dependent on lanthanide type as well as concentration. The controls of sodium nitrate and calcium nitrate showed only modest discernible impacts on cell viability for PC12 and C6 cells, highlighting the role of the lanthanides in influencing cell viability. Clearly more work is now needed to assess the molecular mechanisms involved in the loss of cell viability to give more insight into the potential biohazards of these elements.

Limitations of the Study

Since the number and age of cells in culture can vary between experiments, results were always compared to saline control cells from the same stock culture as the experimental cells receiving the lanthanide additions.

Author Contributions

Conceptualization, D.C.P., L.M.F., G.M.F. and M.A.J.; methodology, D.C.P., L.M.F., F.B., K.T., G.M.F. and M.A.J.; formal analysis, D.C.P., L.M.F., F.B., K.T., G.M.F. and M.A.J.; resources, G.M.F. and M.A.J.; original draft preparation, D.C.P., L.M.F., F.B., K.T., G.M.F. and M.A.J. All authors have read and agreed to the published version of the manuscript.

Funding

This research received no external funding.

Institutional Review Board Statement

Not applicable.

Informed Consent Statement

Not applicable.

Data Availability Statement

Data are all presented in this manuscript.

Conflicts of Interest

The authors declare no conflicts of interest.

References

  1. McGill, I. Rare Earth Elements. In Ullmann’s Encyclopedia of Industrial Chemistry; Wiley-VCH: Weinheim, Germany, 2005. [Google Scholar] [CrossRef]
  2. Aspinall, H.C. Chemistry of the f-Block Elements; CRC Press: Boca Raton, FL, USA, 2001; p. 8. ISBN 978-90-5699-333-7. [Google Scholar]
  3. Haxel, G.; Hedrick, J.; Orris, J. Rare Earth Elements Critical Resources for High Technology (PDF); United States Geological Survey: Reston, VA, USA, 2006; USGS Fact Sheet: 087-02. Archived (PDF) from the original on 14 December 2010. Retrieved 19 April 2008. [Google Scholar]
  4. Palasz, A.; Czeka, P. Toxicological and cytophysiological aspects of lanthanides action. Acta Biochim Pol. 2000, 47, 1107–1114. [Google Scholar] [CrossRef] [PubMed]
  5. Tai, P.; Zhao, Q.; Su, D.; Li, P.; Stagnitti, F. Biological toxicity of lanthanide elements on algae. Chemosphere 2010, 80, 1031–1035. [Google Scholar] [CrossRef] [PubMed]
  6. Gonzalez, V.; Vignati, D.A.; Leyval, C.; Giamberini, L. Environmental fate and ecotoxicity of lanthanides: Are they a uniform group beyond chemistry? Environ. Int. 2014, 71, 148–157. [Google Scholar] [CrossRef] [PubMed]
  7. Pol, A.; Barends, T.R.M.; Dietl, A.; Khadem, A.F.; Eygensteyn, J.; Jetten, M.S.M.; Op den Camp, H.J.M. Rare earth metals are essential for methanotrophic life in volcanic mudpots. Environ. Microbiol. 2014, 16, 255–264. [Google Scholar] [CrossRef] [PubMed]
  8. Good, N.M.; Lee, H.D.; Hawker, E.R.; Su, M.Z.; Gilad, A.A.; Martinez-Gomez, N.C. Hyperaccumulation of gadolinium by Methylorubrum extorquens AM1 reveals impacts of lanthanides on cellular processes beyond methylotrophy. Front. Microbiol. 2022, 13, 820327. [Google Scholar] [CrossRef] [PubMed]
  9. Peplow, M. Unlocking the lanthanome. Chemical and Engineering News, 7 February 2022. [Google Scholar]
  10. Cotruvo, J.A. The chemistry of lanthanides in biology: recent discoveries, emerging principles, and technological applications. ACS Cent. Sci. 2019, 5, 1496–1506. [Google Scholar] [CrossRef] [PubMed]
  11. Featherson, E.R.; Cortruvo, J.A., Jr. The biochemistry of lanthanide acquisition, trafficking, and utilization. BBA-Mol. Cell Res. 2021, 1868, 118864. [Google Scholar]
  12. Ramirez-Olvera, S.; Trejo-Tellez, L.I.; Garcia-Morales, S.; Perez-Sate, J.A.; Gomez-Merino, F.C. Cerium enhances germination and shoot growth and alters mineral nutrient concentration in rice. PLoS ONE 2018, 13, e0194691. [Google Scholar] [CrossRef] [PubMed]
  13. Huang, Z.; Gao, N.; Zhang, S.; Xing, J.; Hou, J. Investigating the toxically homogenous effects of three lanthanides on zebrafish. Comp. Biochem. Physiol. Part C 2022, 253, 109251. [Google Scholar] [CrossRef] [PubMed]
  14. Edington, S.C.; Gonzalez, A.; Middendort, T.R.; Halling, D.B.; Aldrich, R.W.; Baiz, C.R. Coordination of lanthanide ions distorts binding site conformation in calmodulin. Proc. Natl. Acad. Sci. USA 2018, 115, E3126–E3134. [Google Scholar] [CrossRef] [PubMed]
  15. Vikolova, V.; Kircheva, N.; Dobrev, S.; Angelova, S.; Dudev, T. Lanthanides as calcium mimetic species in calcium-signaling/buffering proteins: The effect of lanthanide type on the Ca2+/Ln3+ competition. Int. J. Mol. Sci. 2023, 24, 6297. [Google Scholar] [CrossRef] [PubMed]
  16. Pallares, R.M.; Faulkner, D.; An, D.D.; Hebert, S.; Loguinov, A.; Proctor, M.; Villalobos, J.A.; Bjornstad, K.A.; Rosen, C.J.; Vulpe, C.; et al. Genome-wide toxicologenomic study of the lanthanides sheds light on the selective toxicity mechanisms associated with critical materials. Proc. Natl. Acad. Sci. USA 2021, 118, e2025952118. [Google Scholar] [CrossRef] [PubMed]
  17. Pallares, R.M.; An, D.D.; Hebert, S.; Loguinov, A.; Proctor, M.; Villalobos, J.A.; Bjornstad, K.A.; Rosen, C.J.; Vulpe, C.; Abergel, R.J. Identifying toxicity mechanisms associated with early lanthanide exposure through multidimensional genome-wide screening. ACS Omega 2022, 7, 34412–34419. [Google Scholar] [CrossRef] [PubMed]
  18. Pallares, R.M.; Li, Y.; Abergel, R.J. Understanding the biological behavior of lanthanides and actinides through omics approaches. Trends Anal. Chem. 2023, 67, 117251. [Google Scholar] [CrossRef]
  19. Pallares, R.M.; An, D.D.; Hebert, S.; Loguinov, A.; Proctor, M.; Villalobos, J.A.; Bjornstad, K.A.; Rosen, C.J.; Vulpe, C.; Abergel, R.J. Screening the complex biological behavior of late lanthanides through genome-wide interactions. Metallomics 2023, 15, mfad039. [Google Scholar] [CrossRef] [PubMed]
  20. Sweeney, K.J.; Han, X.; Müller, U.F. A ribozyme that uses lanthanides as cofactor. Nucleic Acids Res. 2023, 51, 7163–7173. [Google Scholar] [CrossRef] [PubMed]
  21. Patasz, A.; Segovia, Y.; Skowronek, R.; Worthington, J.J. Molecular neurochemistry of the lanthanides. Synapse 2019. [Google Scholar] [CrossRef]
  22. Platt, D.C.; Apuzzo, C.F.; Jones, M.A.; Cedeño, D.L.; Vallejo, R. Development of a C6 glioma cell model system to assess effects of cathodic passively balanced electrical stimulation on responses to neurotransmitters: Implications for modulation of intracellular nitric oxide, chloride, and calcium ions. Brain Sci. 2022, 12, 1504. [Google Scholar] [CrossRef] [PubMed]
  23. Mosmann, T. Rapid colorimetric assay for cellular growth and survival: application to proliferation and cytotoxicity assays. J. Immunol. Methods 1983, 65, 55–63. [Google Scholar] [CrossRef] [PubMed]
Figure 1. Cell viability (MTT) results of incubation of C6 and PC12 cells in saline, sodium nitrate, or calcium nitrate. Values are mean ± SD for n = 4 replicates; error bars with small SD may not be visible on this graph.
Inorganics 13 00127 g001
Figure 2. Cell viability (MTT) results of incubation of C6 cells in various lanthanide concentrations. Values are mean ± SD for n = 4 replicates; error bars with small SD may not be visible on this graph.
Inorganics 13 00127 g002
Figure 3. Cell viability (MTT) results of incubation of PC12 cells in various lanthanide concentrations. Values are mean ± SD for n = 4 replicates; error bars with small SD may not be visible on this graph.
Inorganics 13 00127 g003
Figure 4. Cell viability (MTT) results of incubation of C6 cells for 1 hr and 24 hr in various lanthanides at 1 mM. Values are mean ± SD for n = 4 replicates; error bars with small SD may not be visible on this graph.
Inorganics 13 00127 g004
Figure 5. Cell viability (MTT) results of incubation of PC12 cells for 1 hr and 24 hr in various lanthanides at 1 mM. Values are mean ± SD for n = 4 replicates; error bars with small SD may not be visible on this graph.
Inorganics 13 00127 g005
Figure 6. Cell viability (MTT) results of incubation of C6 cells for 24 hr lanthanide exposure with 24 hr medium change to remove lanthanides to test for recovery from lanthanide exposure. Values are mean ± SD for n = 4 replicates; error bars with small SD may not be visible on this graph.
Inorganics 13 00127 g006
Figure 7. Cell viability (MTT) results of incubation of PC12 cells for 24 hr lanthanide exposure with 24 hr medium change to remove lanthanide to test for recovery from lanthanide exposure. Values are mean ± SD for n = 4 replicates; error bars with small SD may not be visible on this graph.
Inorganics 13 00127 g007
Disclaimer/Publisher’s Note: The statements, opinions and data contained in all publications are solely those of the individual author(s) and contributor(s) and not of MDPI and/or the editor(s). MDPI and/or the editor(s) disclaim responsibility for any injury to people or property resulting from any ideas, methods, instructions or products referred to in the content.

