Article

Optical Frequency Combs Generated in Silica Microspheres in the Telecommunication C-, U-, and E-Bands

1
Institute of Applied Physics of the Russian Academy of Sciences, 46 Ul’yanov Street, 603950 Nizhny Novgorod, Russia
2
Advanced School of General and Applied Physics, Lobachevsky State University of Nizhny Novgorod, 23 Gagarin Ave., 603950 Nizhny Novgorod, Russia
3
Institute of Telecommunications of Riga Technical University, 12 Azenes Street 1, 1048 Riga, Latvia
4
Institute of Atomic Physics and Spectroscopy, University of Latvia, 3 Jelgavas Street, 1004 Riga, Latvia
5
Max Planck Institute for the Science of Light, Staudtstr. 2, D-91058 Erlangen, Germany
*
Author to whom correspondence should be addressed.
Photonics 2021, 8(9), 345; https://doi.org/10.3390/photonics8090345
Submission received: 15 July 2021 / Revised: 17 August 2021 / Accepted: 19 August 2021 / Published: 25 August 2021
(This article belongs to the Special Issue Optical Solitons: Current Status)

Abstract

:
Optical frequency combs (OFCs) generated in microresonators with whispering gallery modes are demanded for different applications including telecommunications. Extending operating spectral ranges is an important problem for wavelength-division multiplexing systems based on microresonators. We demonstrate experimentally three spectrally separated OFCs in the C-, U-, and E-bands in silica microspheres which, in principle, can be used for telecommunication applications. For qualitative explanation of the OFC generation in the sidebands, we calculated gain coefficients and gain bandwidths for degenerate four-wave mixing (FWM) processes. We also attained a regime when the pump frequency was in the normal dispersion range and only two OFCs were generated. The first OFC was near the pump frequency and the second Raman-assisted OFC with a soliton-like spectrum was in the U-band. Numerical simulation based on the Lugiato–Lefever equation was performed to support this result and demonstrate that the Raman-assisted OFC may be a soliton.

1. Introduction

Microresonators with whispering gallery modes (WGMs) are attractive for various applications, including classical and non-classical ones [1,2]. Sensing [3,4,5] and biosensing [6,7], optical filtering and switching [8,9,10], frequency stabilization, and linewidth narrowing [11,12] are just a few of them. A possibility of developing a new class of optical sources with a controllable number of robust soliton pulses operating in self-starting regimes based on coupled resonators is discussed in [13], where stabilization is implemented by linear coupling without saturable absorption. The OFC generation in microresonators, demonstrated for the first time in 2007 [14], has greatly expanded the application range of such photonic devices [1]. They are used in coherent communication [15,16], dual-comb spectroscopy [17], optical atomic clock [18], ultrafast optical ranging [19], and in many more areas.
Although on-chip microresonators belong to one of the most actively developing areas [20], silica microresonators are also of great interest, since they are a very convenient platform for the development of micro-photonic devices. For example, a four-port microdevice based on an SNAP (surface nanoscale axial photonics) microresonator produced on the surface of a silica fiber was demonstrated in [21]. The silica microresonator technologies are easier and cheaper compared to the technologies of on-chip crystalline microresonators. The commonly used method of pump coupling into a microresonator through a tapered fiber also allows system parameters to be controlled in a wide range by varying the relative position between the resonator and the tapered fiber (while a similar adjustment is impossible for on-chip microresonators). To protect silica microresonators from air flows, dust, and high humidity, they are portably and robustly packaged [22].
Silica microresonators made of a standard optical fiber are suitable for application in the telecommunication range, since they can be pumped by narrow-linewidth C-band telecom lasers, and the corresponding experimental schemes are based on standard telecom components. Recently, we studied theoretically [23,24] and demonstrated experimentally [25] the implementation of wavelength division multiplexed-passive optical network (WDM-PON) in the C-band using an OFC generator based on a silica microsphere as a multiple light source. When several lasers (laser array) are replaced by a single OFC source, it improves the energy efficiency of the WDM fiber optical communication system, at the same time providing stable frequency spacing and strong phase relation between generated carriers (modes) [24,25,26]. Extending OFCs to the L-band is also a straightforward solution for WDM-PONs, when the use of the C-band is insufficient for satisfying the bandwidth demand. Particularly, it is of interest for next-generation passive optical network 2 (NG-PON2) or currently developing Super-PON networks, where frequencies of L-band are allocated for the downstream transmission [27]. U-band laser sources are mainly used for network monitoring purposes, so their development and investigation is also required.
It is known that, for Kerr OFC generation, the main mechanism is FWM, which can be readily applied for explanation of experiments. However, frequently, when generating OFCs, Raman nonlinearity plays an important role in silica microresonators. A Raman microsphere laser was demonstrated for the first time in [28]. Since then, Raman processes have been widely investigated. Many works were also devoted to study of Kerr–Raman OFCs (for example, [22,29,30,31]). However, the nonlinear dynamics of intracavity radiation can be so complex and diverse that it is still possible to discover new features or interesting regimes of nonlinear conversion of radiation.
Here, we demonstrate three experimental series on the generation of spectrally separated OFCs in silica microspheres. In the first series we obtained the first OFC near the pump frequency in the C-band, the second Stokes OFC in the U-band and beyond, and the third anti-Stokes OFC in the E-band. To give a qualitative explanation of OFC generation in the sidebands, we estimated gain coefficients and gain bandwidths for degenerate four-wave mixing (FWM) processes under the strong intracavity CW field approximation. To understand the opportunities for OFC generation in sidebands due to the degenerate FWM process within such an approximation, we analyzed in detail a pump frequency varying in the 190–198 THz range. In the second experimental series, by simple tuning of the pump frequency we attained frequency tunable Raman OFCs and E-band OFCs, as well as a C-band OFC. In the third experimental series, the pump frequency was in the normal dispersion range and we attained a Raman soliton-like spectrum without symmetric high-frequency sideband. To support this result, we performed numerical simulation based on the Lugiato–Lefever equation. We theoretically demonstrated Raman soliton generation in the anomalous dispersion range with the pump in the normal dispersion range, for the first time, to the best of our knowledge. Note that a Stokes (Raman-assisted) soliton co-existing with a fundamental dissipative Kerr soliton in the anomalous dispersion range was discovered in a silica on silicon microcavity [32], but this regime differs from ours.

2. Methods

2.1. Fabrication of Microspheres

Samples of silica microresonators were made of standard ITU-T G.652.D telecommunication fiber Corning SMF28e using the technology described in detail in [24]. In brief, it is based on repeated melting of a thinned fiber end with a fiber splicer. This fabrication process allows producing microspheres with reproducible and controllable diameters and similar Q-factors. Within a few hours after manufacturing, the Q-factors, regardless of the microsphere diameter, exceeded 5 × 10⁷ on average. Within a couple of days, the Q-factors dropped on the average to a value of 4 × 10⁷, and then this value remained unchanged for a long time. Two months after the preparation of the samples, the Q-factors were about 2 × 10⁷. Note that the record large value is Q = 8 × 10⁹ measured at 633 nm ~1 min after fabrication for a silica 750-μm microsphere [33]. However, typical Q-factors for silica microspheres at 1.55 μm used for OFC generation or Raman lasing are 107–108 [28,29,34,35], which agrees with our results. The reasons limiting Q-factors are discussed in [33].
We used microspheres with diameters d ≈ 165 μm and FSRs of about 400 GHz in all experiments and the corresponding numerical simulations. Note that the mode spacing 400 GHz = M × 100 GHz (M = 4) satisfies the ITU-T recommendation G.694.1 [36], which specifies the spectral grid for WDM systems. To excite WGMs in a microsphere, we used tapered fibers made of Corning SMF28e with gas burners [24,25,37].

2.2. Numerical

2.2.1. Calculation of Dispersion and Nonlinear Coefficient

To find a free spectral range (FSR) and to calculate dispersion of a microsphere, we numerically solved the characteristic equation for a fundamental TE mode family [38]:
n [ ( k d / 2 ) 1 / 2 J l + 1 / 2 ( k d / 2 ) ] ( k d / 2 ) 1 / 2 J l + 1 / 2 ( k d / 2 ) = [ ( k 0 d / 2 ) 1 / 2 H l + 1 / 2 ( 1 ) ( k 0 d / 2 ) ] ( k 0 d / 2 ) 1 / 2 H l + 1 / 2 ( 1 ) ( k 0 d / 2 ) ,
where the prime is the derivative with respect to the argument in parenthesis; Jl+1/2 and Hl+1/2(1) are the Bessel function and the Hankel function of the 1st kind of order l + 1/2, respectively; l is the azimuthal index; k0 = 2∙π∙ν/c is the light propagation constant in vacuum; ν is the frequency; k = n(ν)·k0; n(ν) is the linear refractive index of the silica glass (calculated using the Sellmeier formula given in [39]). We selected the first roots of Equation (1) for the fundamental mode family. The roots were localized using a well-known approximation formula for the eigenfrequencies presented, for example, in [38]. These approximate eigenfrequencies were used as the initial values for finding the roots of Equation (1). The iterative algorithm was implemented with the dispersion of the silica glass taken into account [39]. After finding eigenfrequencies for the fundamental TE mode family, we calculated the 2nd-order dispersion [40]:
β 2 = 1 2 π 2 d Δ ( Δ ν l ) ( Δ ν l ) 3 ,
where
Δ ν l = ν l + 1 ν l 1 2 ; Δ ( Δ ν l ) = ν l + 1 2 ν l + ν l 1 .
The electric field (r) of the fundamental TE WGM was found as in [38], and after that, the effective WGM volume Veff and nonlinear Kerr coefficient γ were calculated
V e f f = n 2 | E ˜ | 2 d 3 r max ( n 2 | E ˜ | 2 ) ,
γ = 2 π λ n 2 V e f f / ( π d ) ,
where n2 = 2.2·10−20 m2/W is the nonlinear refractive index of the silica glass [39]. We found γ = 6.2 (W∙km)−1 for ν ≈ 193 THz and neglected its frequency dependence in the simulations below.

2.2.2. Calculation of Intracavity CW Power

Nonlinear dynamics of the intracavity radiation neglecting Raman contribution can be described by the Lugiato–Lefever equation in the following form [1]:
t R E ( t , τ ) t = [ α i δ 0 + i π d k 2 β k k ! ( i τ ) k + i γ π d | E ( t , τ ) | 2 ] E ( t , τ ) + θ E i n
where Ε(t, τ) is the intracavity field; tR is the round trip time; t and τ are slow and fast times, respectively; α is the loss coefficient including intrinsic and coupling losses; βk is the dispersion of the k-th order; θ is the coupling coefficient; and δ0 is the frequency detuning of the pump field Εin from the exact resonance.
Further, to find the intracavity CW power, we applied the commonly used approach [39,41]. For the CW solution, Equation (6) is reduced to the following algebraic equation in the standard dimensionless form [41]:
Y 3 2 Δ Y 2 + ( Δ 2 + 1 ) Y = X .
Here, X and Y are the normalized pump and intracavity powers, respectively; Δ is the normalized detuning (X = |Ein|2(π∙d∙γθ/α3); Y = |E|2(π∙d∙γ/α); and Δ = δ0/α). We found Y(Δ) from Equation (7), and in the case when this equation had three roots, we took the maximum value corresponding to the upper stable branch.

2.2.3. Calculation of Gain Coefficients for the Degenerate FWM Processes under the Strong Intracavity CW Field Approximation

To estimate the possibility of generating sidebands via degenerate FWM under the strong intracavity field approximation, we followed the approach developed in [35,42] (which can be extended taking into account the dispersion of finesse [43]). We assumed that the total intracavity field can be approximated as the sum of a strong CW field E0 found from Equation (7) and two small-amplitude sidebands (|a±| << |E0|) symmetrically shifted by ±Ω from the pump frequency
E ( t , τ ) E 0 + a + exp ( i Ω τ ) + a exp ( i Ω τ ) .
Next, we rewrote Equation (6), taking into account the expression (8), and linearized this equation. After algebraic transforms, the following system of equations was obtained
t R d d t ( a + a ) = ( α + i B i π d D o ( Ω ) i π d γ ( E 0 ) 2 i π d γ ( E 0 ) 2 α i B i π d D o ( Ω ) ) ( a + a ) ,
where B = −δ0 + πd∙De(Ω) + 2πdγ|E0|2, Do(Ω), and De(Ω) are odd and even dispersion, respectively
D o ( Ω ) = k = 1 4 β 2 k + 1 Ω 2 k + 1 / ( 2 k + 1 ) ! .
D e ( Ω ) = k = 1 4 β 2 k Ω 2 k / ( 2 k ) ! .
The eigenvalues of Equation (9) are
λ ± ( Ω ) t R = α + i π d D o ( Ω ) ± 4 π d γ P ( δ 0 π d D e ( Ω ) ) ( δ 0 π d D e ( Ω ) ) 2 3 π 2 d 2 γ 2 P 2
Here, P = |E0|2 is the intracavity power.
The instability (exponential increase of a±) is observed if Re(λ±(Ω) > 0). For this case, the gain coefficient is Re(λ±(Ω)).

2.2.4. Numerical Simulation Based on Lugiato–Lefever Equation with the Raman Nonlinearity Taken into Account

To analyze the dynamics of the optical intracavity field taking the Raman nonlinearity into consideration, we used the generalized Lugiato–Lefever equation
t R E ( t , τ ) t = [ α i δ 0 + i π d k 2 β k k ! ( i τ ) k ] E ( t , τ ) + i γ π d E ( t , τ ) R ( s ) | E ( t , τ s ) | 2 d s + θ E i n .
with the added Raman response function R(t) [39]:
R ( t ) = ( 1 f R ) δ ( t ) + f R ( T 1 2 + T 2 2 ) T 1 exp ( t / T 2 ) sin ( t / T 1 ) ,
where δ(t) is the Dirac delta function; fR = 0.18 is the fraction of Raman contribution to the total nonlinear response; T1 = 12.2 fs, and T2 = 32 fs.
We used a home-made software based on the common symmetrized split-step Fourier method (SSFM) [39] for modeling intracavity light field dynamics.

3. Results

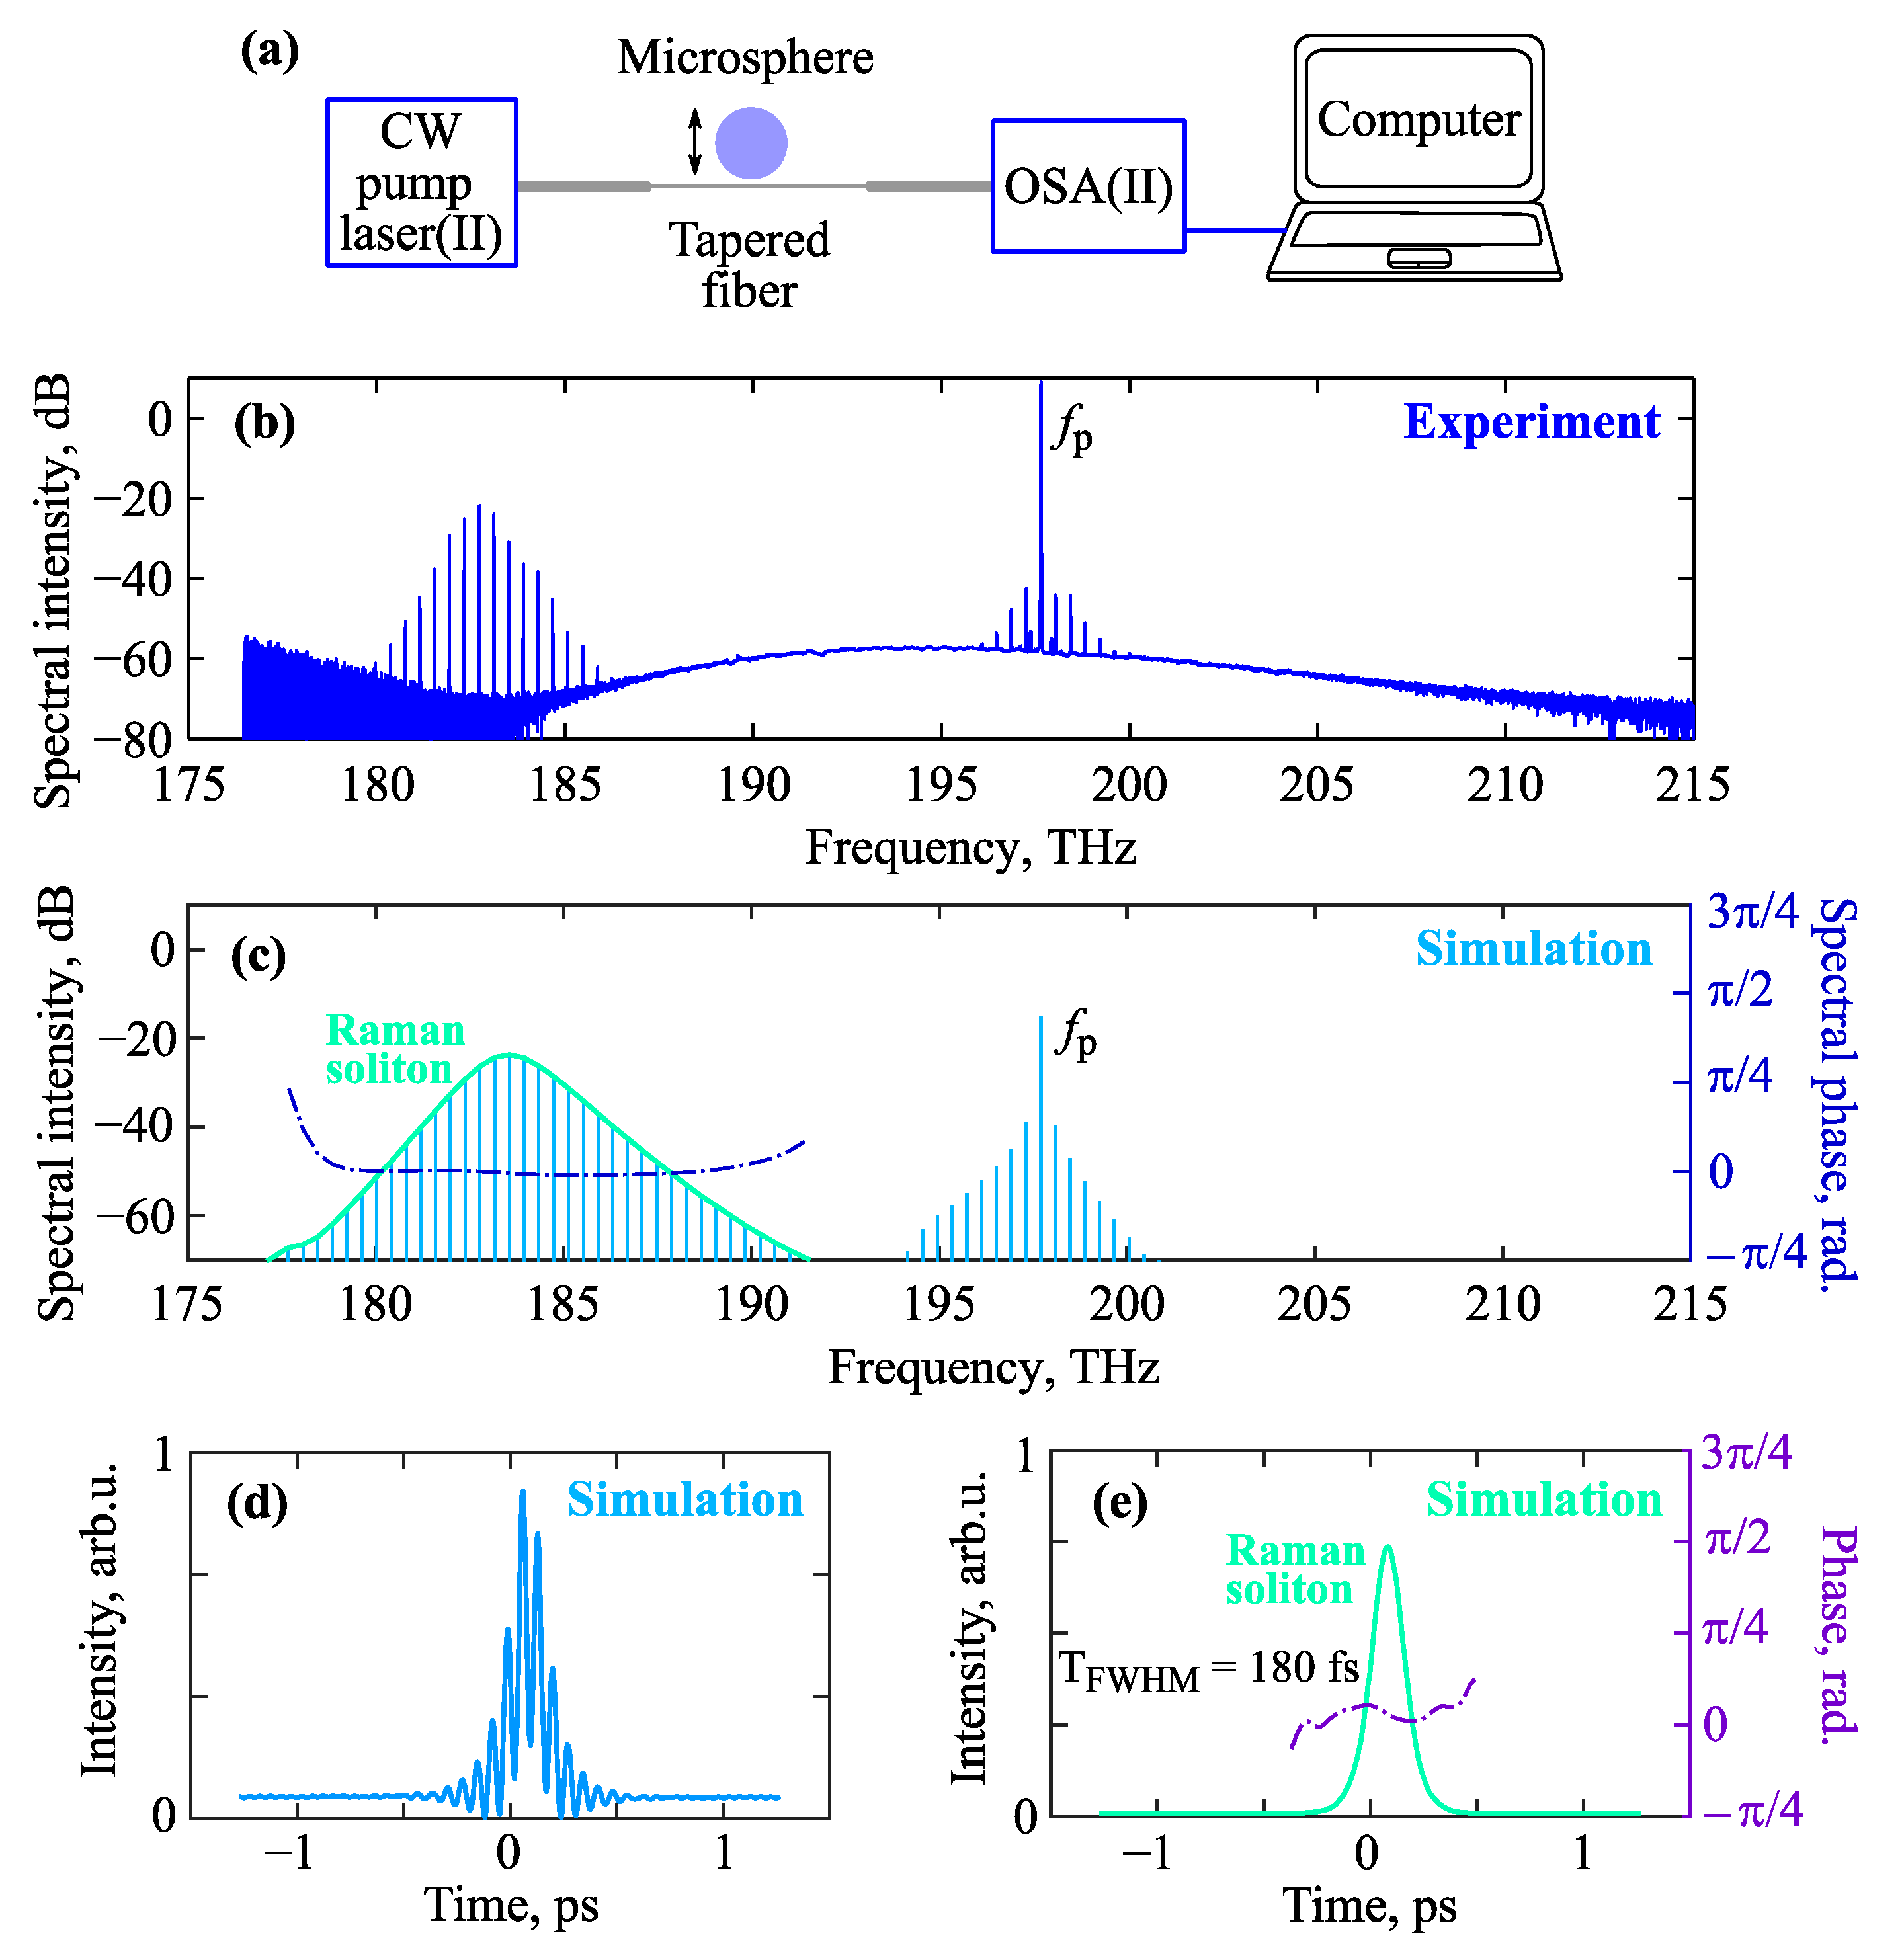
3.1. The 1st Experimental Series

In the 1st experimental series, we used the scheme shown in Figure 1a. The radiation from the output of a C-band tunable laser ‘CW pump laser (I)’ with a 4 mW power and a 100 kHz linewidth was amplified up to 220 mW using an erbium-doped fiber amplifier (EDFA). Next, the amplified signal passed a Faraday isolator (ISO), a polarization controller (PC), and was then coupled through a tapered fiber to a microsphere. Two CCD cameras were used for a rough control of the relative position between the tapered fiber and the microsphere and a piezo micro-positioner was used for precise control. We used a telecom Optical Spectrum Analyzer ‘OSA(I)’, which operates up to 1700 nm to record the output spectra. We varied the distance between the microsphere and the tapered fiber, thereby varying the effective coupling coefficient and the pump detuning from exact resonance (due to thermal mode pulling effect). It is well known that detuning is a very important parameter strongly affecting the nonlinear dynamics of intracavity radiation [44,45]. By changing the relative position between the tapered fiber and the microsphere, it is possible to obtain OFC in different regimes. Note that a similar scheme was previously used to generate a long-term stable OFC with 2∙FSR mode spacing [46]. Here, in the 1st experimental series, we pumped the microsphere at 193.4 THz near the zero dispersion frequency of about 193.3 THz. The calculated dispersion of the microsphere is shown in Figure 1b. We attained the first relatively weak OFC near the pump frequency and two spectrally separated OFCs in the sidebands (Figure 1c). The second low-frequency OFC was near 180 THz and the third high-frequency OFC is located symmetrically to the second OFC.
To qualitatively explain the OFC generation in the sidebands (Figure 1c), we estimated gain coefficients and gain bandwidths as described in Section 2.2.3. We took the pump power before the microsphere |Ein|2 = 50 mW, assumed α = θ/2, and set the finesse π/α = 5 × 10⁴. Since detuning was not known for sure, we considered various values presented in Figure 1d. We found that the experimental sidebands shown in Figure 1c correspond to the gain bands for reasonable values of detuning. In addition, the Raman scattering may also affect the low-frequency OFC, but here we did not consider it for qualitative understanding of the FWM process.

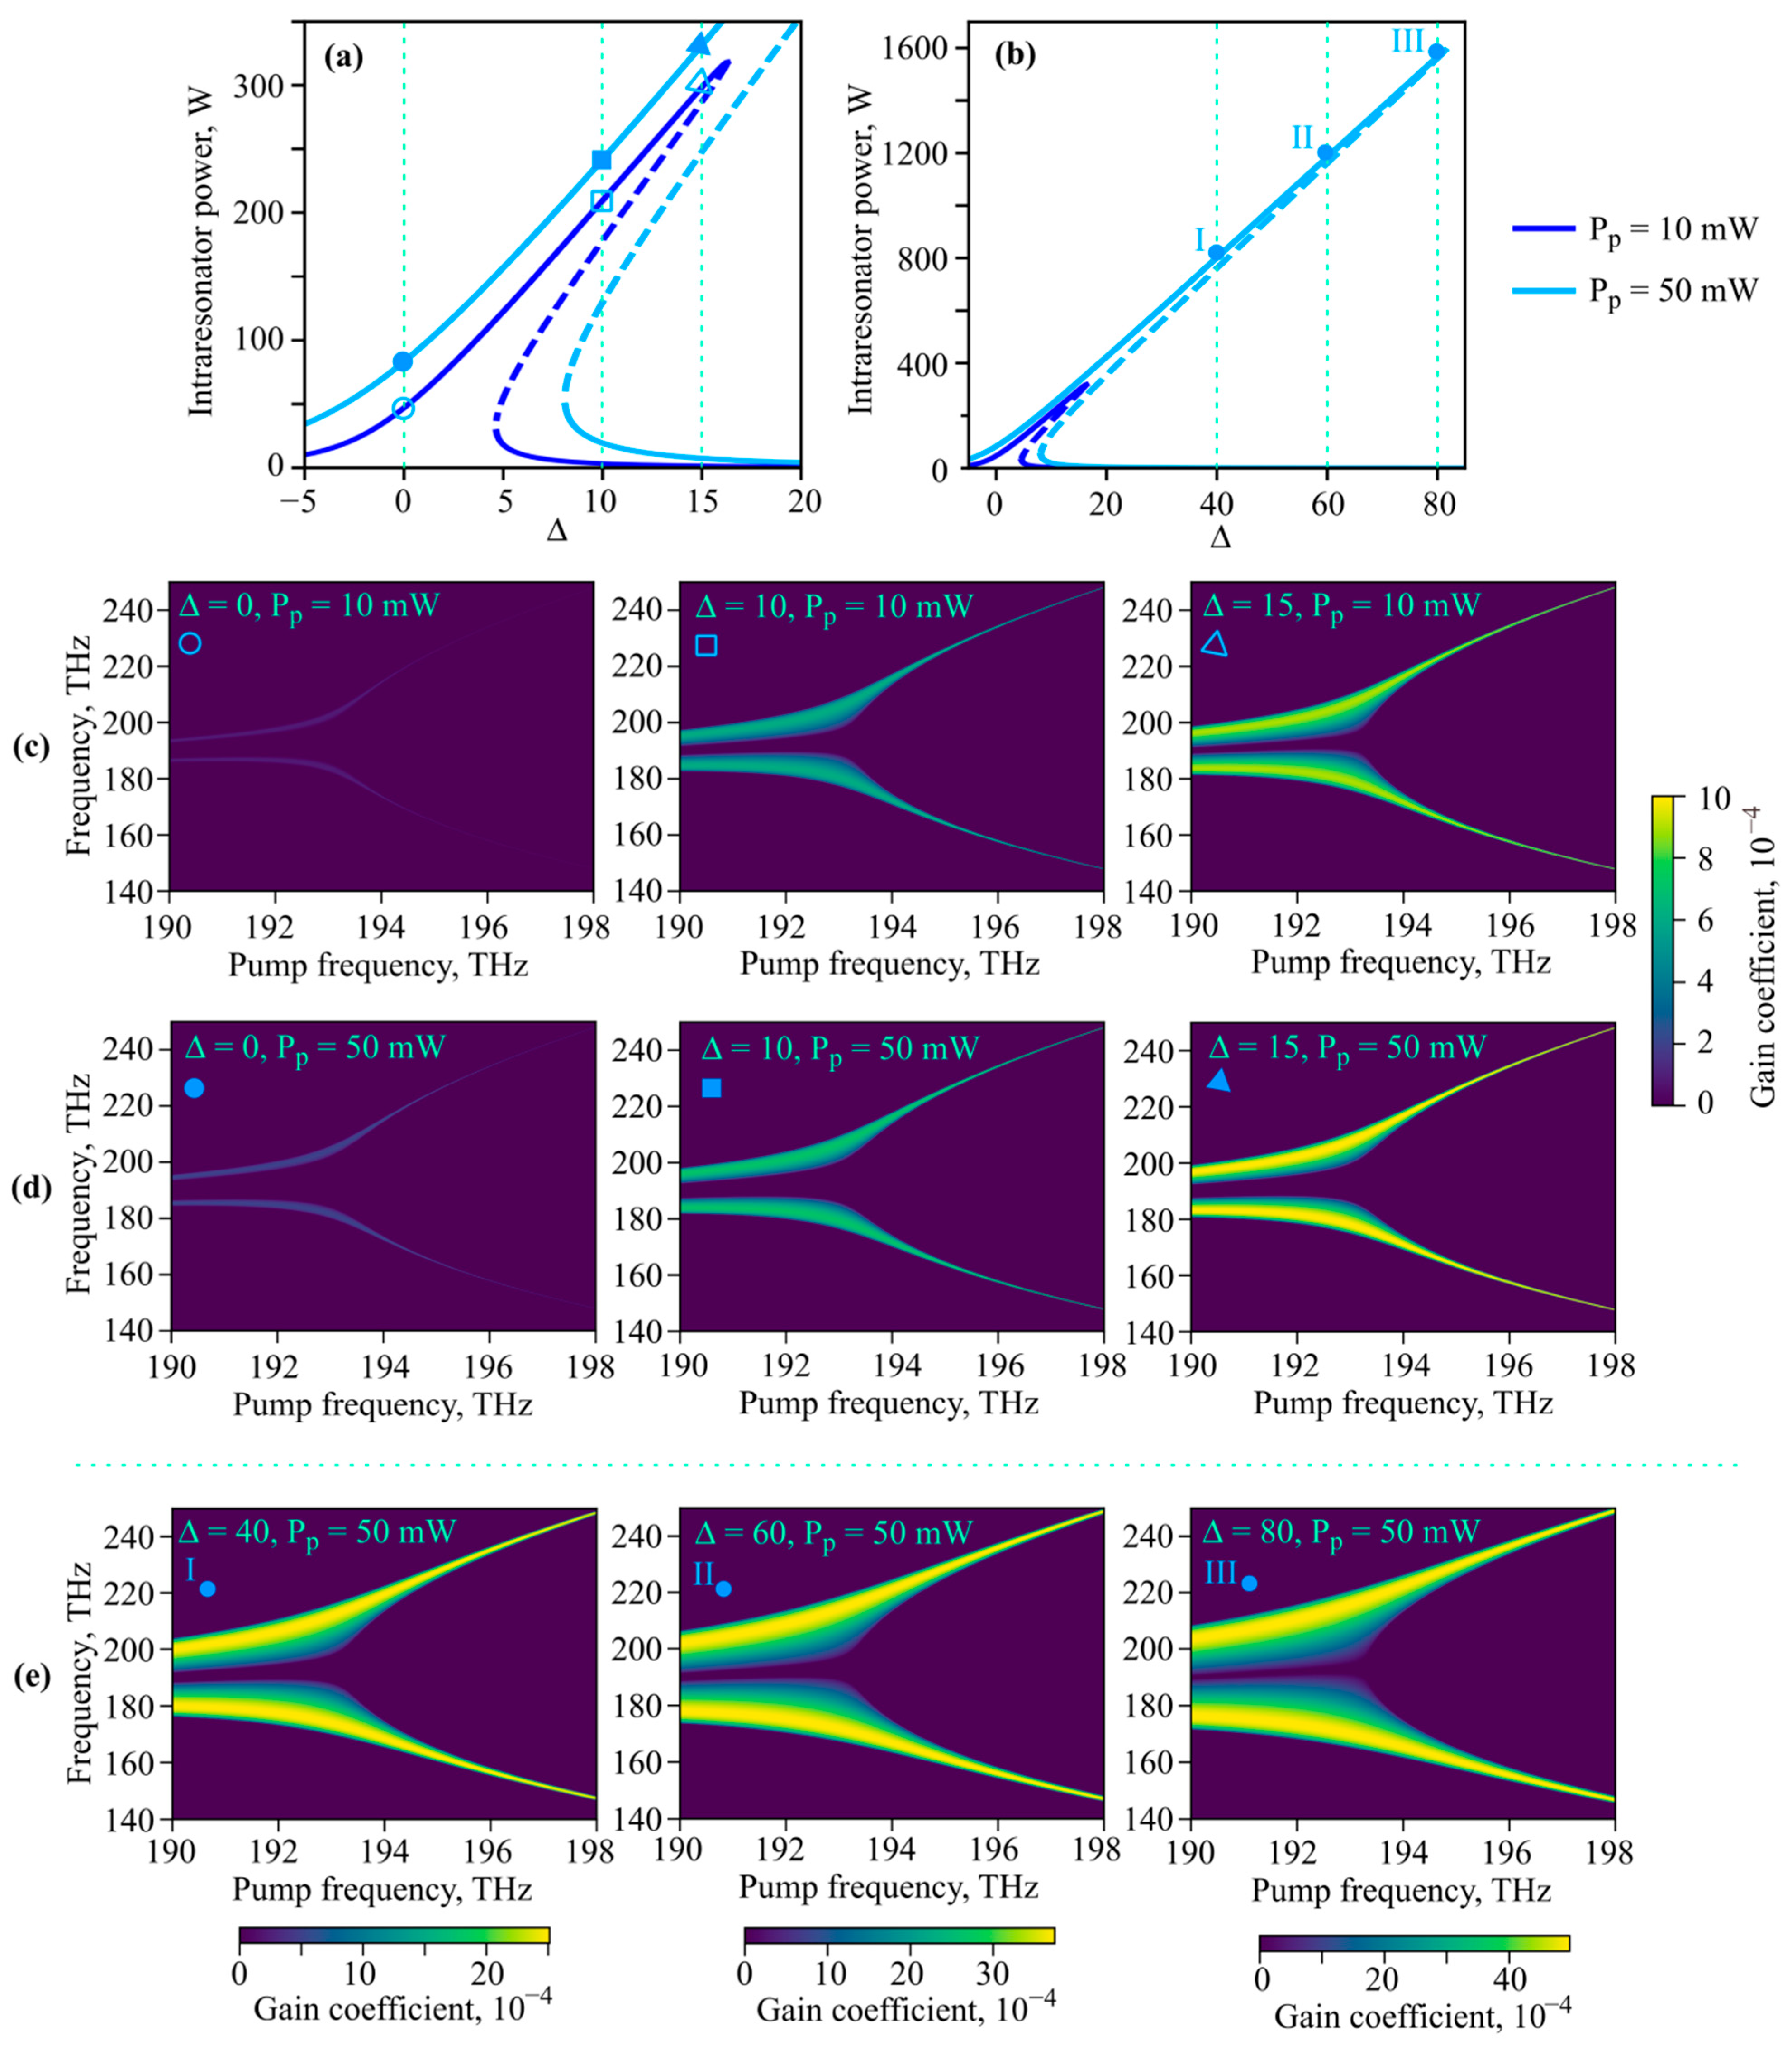
3.2. Theoretical Study of FWM

To understand the potential of OFC generation in sidebands due to the degenerate FWM process for a strong intracavity pump field, we analyzed the pump frequency varying in the 190–198 THz range. This frequency range can be obtained with commercially available tunable narrow-linewidth lasers. We considered pump powers Pp = 10 mW and Pp = 50 mW. We used the approach described in Section 2.2.2 for finding intracavity CW powers and the approach described in Section 2.2.3 for finding gain coefficients for a FWM process.
The calculated intracavity CW powers are shown in Figure 2a,b. For the marked points we calculated the gain coefficients as functions of the pump frequency and sideband frequencies. The numerical results are demonstrated in Figure 2c,d for pump powers of 10 mW and 50 mW, respectively, for dimensionless detuning Δ = 0, 10, 15 (see also the corresponding marked points in Figure 2a). Figure 2c,d are drawn for the same colormap scale. The sidebands are wider and located closer to the pump frequency when it is in the anomalous dispersion range. When the pump frequency is in the normal dispersion range, the sideband frequencies are shifted significantly from the pump frequency (which agrees with the results of the paper [35]). For the same detuning, maximum gain coefficients are slightly higher for Pp = 50 mW than for Pp = 10 mW due to a higher intracavity power (see Figure 1a). We also analyzed large values of detuning Δ = 40, 60, 80 for Pp = 50 mW (see also the corresponding marked points in Figure 2b). The calculated gain coefficients are given in Figure 2e (here, individual colormap scales are used for each value of detuning). The broadest gain-bands are obtained for the pump frequencies close to the zero dispersion frequency. Their spectral widths exceed 20 THz. The larger the detuning, the higher the gain coefficient.

3.3. The 2nd Experimental Series

The 2nd experimental series was performed according to the schematic presented in Figure 3a. The microsphere was pumped by a CW laser ‘CW pump laser(II)’ tunable in the 190.3–197.9 THz range with a maximum power of 60 mW and a 10 kHz linewidth. A bandpass filter was placed before the tapered fiber for removing the background emission of the pump laser. Two CCD cameras and a piezo micro-positioner were also used for a rough and precise control of the relative position between the tapered fiber and the microsphere. The output spectra were measured with the Optical Spectrum Analyzer ‘OSA(II)’ which also operates up to 1700 nm. To obtain OFC generation, the regime of sweeping the CW laser frequency near a certain value was tuned on as in our previous works [31,37,46]. After a few sweeping periods, this regime was turned off (after that, the laser frequency was constant) and steady-state OFCs were generated due to thermal frequency pulling. Note that a similar scheme was previously used to generate Raman-assisted nested OFCs with soliton-like spectra belonging to two different mode families [31].
By adjusting the relative position between the microsphere and the tapered fiber, we attained three OFCs for the pump frequency of 192.9 THz (Figure 3b). The Raman-assisted OFC had a soliton-like shape (Figure 3b). Its low-frequency spectral wing extended beyond the OSA operating range. The E-band OFC contained more than 20 spectral lines with a relatively high intensity. For pump frequencies of 193.7 THz and 191.4 THz, the Raman-assisted OFCs in the U-band also had soliton-like shapes, while the E-band OFCs were very weak (Figure 3c,d). In these cases, the Raman OFCs were not weak in comparison with the pump, so the simple method of calculating gain coefficients for the FWM process described in Section 2.2.3 and applied in Section 3.1 and Section 3.2 could not be used.
It should be noted that in this experimental series, by simple tuning of the pump frequency we attained frequency tunable Raman soliton-like OFCs, which may be useful for applications.

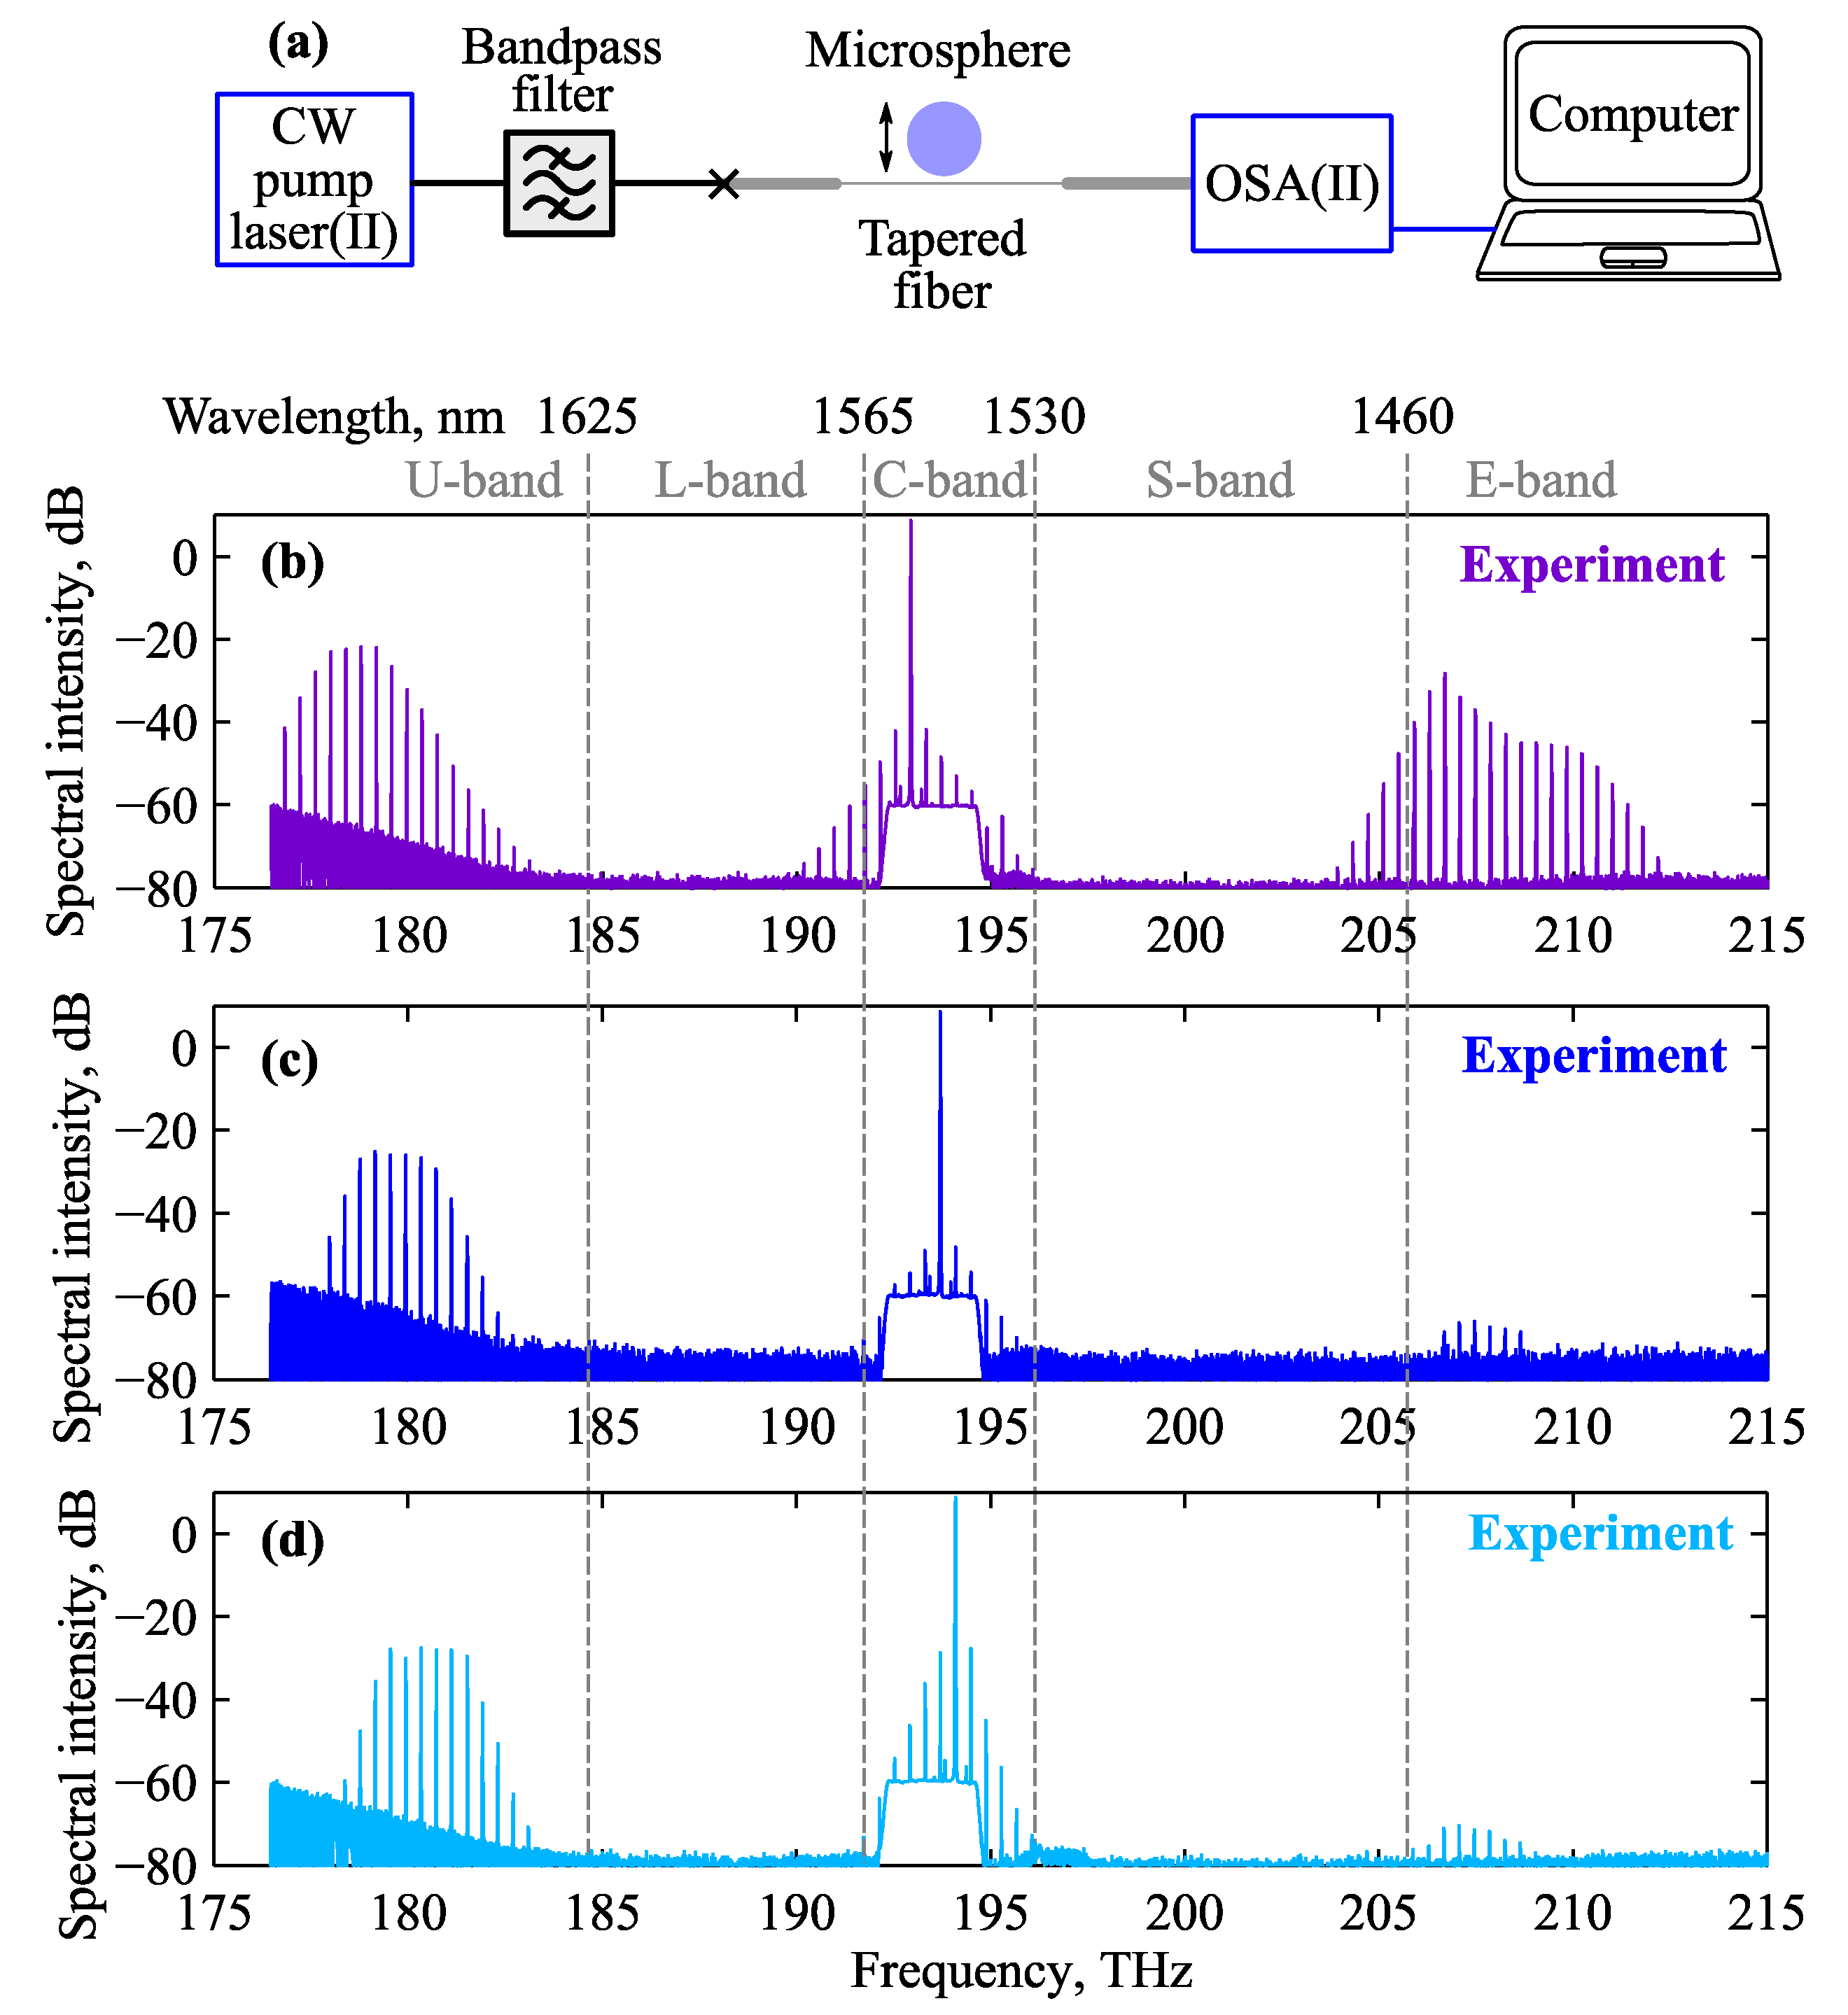
3.4. The 3rd Experimental Series and Its Interpretation

Next, we removed the bandpass filter from the scheme plotted in Figure 3a and operated with the scheme shown in Figure 4a. We set the pump frequency fp = 197.7 THz and attained only two OFCs: the first one was near the pump frequency, and the second was the Raman-assisted OFC (Figure 4b). In this case, the pump frequency was in the normal dispersion range, while the soliton-like Raman-assisted OFC was in the anomalous dispersion range.
To demonstrate that the observed Raman OFC with a soliton-like spectrum may correspond to a “true” soliton (with localized unchangeable temporal profile), we performed numerical simulation in the framework of the Lugiato–Lefever equation with the Raman nonlinearity taken into account as described in Section 2.2.4. We considered 29 modes. The numerically modeled stable spectrum and spectral phase of the Raman-assisted OFC are plotted in Figure 4c. Here, we set Δ = 6 and X = 25 to attain a sufficiently good agreement between the experimental and the simulated spectra (compare Figure 4b,c). The measured spectral intensity at the pump frequency fp is higher than the calculated spectral intensity at fp because in the experiment the transmitted unconverted pump is also measured. The slight difference in the shape of the experimental and measured spectra is explained by the fact that we did not exactly know several experimental parameters (for example, detuning and coupling coefficient). The simulated intensity distribution in the time domain is shown in Figure 4d. Next, we filtered out the Raman-assisted OFC in the spectral domain (using the super-Gaussian filter for the complex spectral envelope: exp(-(fp + ΔfR)6f6), ΔfR = 15 THz, δf = 7 THz) and found its field distribution in the time domain. The temporal intensity and phase of the Raman soliton are plotted in Figure 4e. We indeed obtained the sech2-shape soliton demonstrated in Figure 4e. This soliton has almost flat spectral and temporal phases. Its duration is 180 fs (full width at half maximum, FWHM) and TBP = 0.315 (time-bandwidth product, TBP). Note that for the sech2-shape Fourier transform limited pulses, TBP is also 0.315.

4. Discussion

We have demonstrated three experimental series of spectrally separated OFC generation in different telecommunication bands in silica microspheres, with a diameter of about 165 μm and an FSR of about 400 GHz.
In the first series, we have obtained the first OFC near the pump frequency in the C-band, the second Stokes OFC in the U-band and beyond, and the third anti-Stokes OFC in the E-band. The qualitative explanation of OFC generation in the sidebands is based on degenerate four-wave mixing (FWM) processes under the strong intracavity CW field approximation. Note that similar spectra were previously demonstrated in different microresonators (for example, in [40,42,47]). We have also investigated the pump frequency varying in the 190–198 THz range. The sidebands are wider and are located closer to the pump frequency when the pump frequency is in the anomalous dispersion range. When the pump frequency is in the normal dispersion range, the sidebands’ frequencies are shifted significantly from the pump frequency (which agrees with the results of the paper [35]). For the same detuning, maximum gain coefficients are slightly higher for a higher pump power due to a higher intracavity power. The broadest gainbands are obtained for pump frequencies close to the zero dispersion frequency. Their spectral widths exceed 20 THz. The larger the detuning, the higher the gain coefficient.
In the second experimental series, by simple tuning of the pump frequency, we have attained frequency tunable Raman OFCs in the U-band and anti-Stokes OFCs in the E-band, and also OFCs in the C-band. In these cases, the Raman OFCs are not weak in comparison with the pump, so the simple method of calculating gain coefficients for the FWM process applied for the first series cannot be used here.
In the third experimental series, the pump frequency was in the normal dispersion range and we have attained a Raman soliton-like spectrum without symmetric high-frequency sideband. To demonstrate that the observed Raman OFC with a soliton-like spectrum can indeed correspond to a soliton with a localized unchangeable temporal profile, we have performed numerical simulation in the framework of the Lugiato–Lefever equation, with the Raman nonlinearity taken into account. Note that experimental and theoretical studies of the generation of Raman OFCs with bell-shaped spectra from a silica rod microresonator with controlled center frequency via detuning and coupling optimization were presented in [30]. However, the possibility of Raman soliton formation was not investigated in the work [30]. A Stokes soliton co-existing with a fundamental dissipative Kerr soliton in the anomalous dispersion range was discovered in a silica on silicon microcavity [32]. However, we could not find works reporting a Raman soliton in microresonators (in the anomalous dispersion range) when the pump with a weak OFC nearby was in the normal dispersion range (as in Figure 4). Thereforw, we believe that this found regime of the Raman soliton generation is novel.

Author Contributions

Conceptualization, E.A.A. and A.V.A.; methodology, E.A.A., M.P.M., T.S., G.L.,V.B. and A.V.A.; software, E.A.A., M.P.M., I.L. and A.V.A.; validation, E.A.A., M.P.M., T.S., J.A., V.B. and A.V.A.; formal analysis, E.A.A., M.P.M., T.S., J.A., S.S.; investigation, E.A.A., M.P.M., T.S., J.A. and A.V.A.; resources, I.L., S.S., V.B. and A.V.A.; data curation, E.A.A., M.P.M., T.S.; writing—original draft preparation, E.A.A.; writing—review and editing, M.P.M., T.S., I.L., S.S. and A.V.A.; visualization, E.A.A. and M.P.M.; supervision, E.A.A., S.S., V.B. and A.V.A.; project administration, E.A.A., G.L., V.B. and A.V.A.; funding acquisition, E.A.A., I.L., G.L., V.B. and A.V.A. All authors have read and agreed to the published version of the manuscript.

Funding

The 3rd experimental series presented in Section 3.4 and all theoretical studies are supported by the Russian Science Foundation, Grant No. 20-72-10188. The 2nd experimental series presented in Section 3.3 is supported by the Mega-grant of the Ministry of Science and Higher Education of the Russian Federation, contract No. 075-15-2021-633. The 1st experimental series presented in Section 3.1 is supported by the European Regional Development Fund (ERDF) postdoctoral research project, contract No. 1.1.1.2/VIAA/4/20/659 (COMBSYS).

Conflicts of Interest

The authors declare no conflict of interest.

References

  1. Pasquazi, A.; Peccianti, M.; Razzari, L.; Moss, D.J.; Coen, S.; Erkintalo, M.; Chembo, Y.K.; Hansson, T.; Wabnitz, S.; Del’Haye, P.; et al. Micro-combs: A novel generation of optical sources. Phys. Rep. 2018, 729, 1–81. [Google Scholar] [CrossRef]
  2. Strekalov, D.V.; Marquardt, C.; Matsko, A.B.; Schwefel, H.G.L.; Leuchs, G. Nonlinear and quantum optics with whispering gallery resonators. J. Opt. 2016, 18, 123002. [Google Scholar] [CrossRef] [Green Version]
  3. Reynolds, T.; Riesen, N.; Meldrum, A.; Fan, X.; Hall, J.M.; Monro, T.M.; François, A. Fluorescent and lasing whispering gallery mode microresonators for sensing applications. Laser Photonics Rev. 2017, 11, 1600265. [Google Scholar] [CrossRef]
  4. Brice, I.; Grundsteins, K.; Atvars, A.; Alnis, J.; Viter, R.; Ramanavicius, A. Whispering gallery mode resonator and glucose oxidase based glucose biosensor. Sens. Actuators B Chem. 2020, 318, 128004. [Google Scholar] [CrossRef]
  5. Zhivotkov, D.; Ristić, D.; Romanova, E.; Ivanda, M. Refractometric gas sensing using a whispering gallery mode microresonator coated with a supra-micron sol-gel layer. Opt. Mater. 2021, 118, 111286. [Google Scholar] [CrossRef]
  6. Soria, S.; Berneschi, S.; Brenci, M.; Cosi, F.; Nunzi Conti, G.; Pelli, S.; Righini, G.C. Optical Microspherical Resonators for Biomedical Sensing. Sensors 2011, 11, 785–805. [Google Scholar] [CrossRef] [PubMed]
  7. Toropov, N.; Cabello, G.; Serrano, M.P.; Gutha, R.R.; Rafti, M.; Vollmer, F. Review of biosensing with whispering-gallery mode lasers. Light Sci. Appl. 2021, 10, 42. [Google Scholar] [CrossRef]
  8. Peccianti, M.; Pasquazi, A.; Park, Y.; Little, B.E.; Chu, S.T.; Moss, D.J.; Morandotti, R. Demonstration of a stable ultrafast laser based on a nonlinear microcavity. Nat. Commun. 2012, 3, 765. [Google Scholar] [CrossRef] [Green Version]
  9. Xu, Q.; Soref, R. Reconfigurable optical directed-logic circuits using microresonator-based optical switches. Opt. Express 2011, 19, 5244–5259. [Google Scholar] [CrossRef]
  10. Han, Z.; Fast, S.S.; Klotz, E.; Vatnik, I.D.; Churkin, D.V. Optical filtering with axial whispering gallery modes on the surface of tapered optical fibers. Laser Phys. Lett. 2020, 17, 066201. [Google Scholar] [CrossRef]
  11. Liang, W.; Ilchenko, V.S.; Savchenkov, A.A.; Matsko, A.B.; Seidel, D.; Maleki, L. Whispering-gallery-mode-resonator-based ultranarrow linewidth external-cavity semiconductor laser. Opt. Lett. 2010, 35, 2822–2824. [Google Scholar] [CrossRef] [Green Version]
  12. Kondratiev, N.M.; Lobanov, V.E.; Cherenkov, A.V.; Voloshin, A.S.; Pavlov, N.G.; Koptyaev, S.; Gorodetsky, M.L. Self-injection locking of a laser diode to a high-Q WGM microresonator. Opt. Express 2017, 25, 28167–28178. [Google Scholar] [CrossRef]
  13. Cutrona, A.; Hanzard, P.-H.; Rowley, M.; Totero-Gongora, J.S.; Peccianti, M.; Malomed, B.A.; Oppo, G.-L.; Pasquazi, A. Temporal cavity solitons in a laser-based microcomb: A path to a self-starting pulsed laser without saturable absorption. Opt. Express 2021, 29, 6629–6646. [Google Scholar] [CrossRef]
  14. Del’Haye, P.; Schliesser, A.; Arcizet, O.; Wilken, T.; Holzwarth, R.; Kippenberg, T.J. Optical frequency comb generation from a monolithic microresonator. Nature 2007, 450, 1214–1217. [Google Scholar] [CrossRef] [Green Version]
  15. Pfeifle, J.; Brasch, V.; Lauermann, M.; Yu, Y.; Wegner, D.; Herr, T.; Hartinger, K.; Schindler, P.; Li, J.; Hillerkuss, D.; et al. Coherent terabit communications with microresonator Kerr frequency combs. Nat. Photon. 2014, 8, 375–380. [Google Scholar] [CrossRef] [Green Version]
  16. Fülöp, A.; Mazur, M.; Lorences-Riesgo, A.; Helgason, Ó.B.; Wang, P.-H.; Xuan, Y.; Leaird, D.E.; Qi, M.; Andrekson, P.A.; Weiner, A.M.; et al. High-order coherent communications using mode-locked dark-pulse Kerr combs from microresonators. Nat. Commun. 2018, 9, 1598. [Google Scholar] [CrossRef] [PubMed] [Green Version]
  17. Yu, M.; Okawachi, Y.; Griffith, A.G.; Picqué, N.; Lipson, M.; Gaeta, A.L. Silicon-chip-based mid-infrared dual-comb spectroscopy. Nat. Commun. 2018, 9, 1869. [Google Scholar] [CrossRef] [PubMed] [Green Version]
  18. Newman, Z.L.; Maurice, V.; Drake, T.; Stone, J.R.; Briles, T.C.; Spencer, D.T.; Fredrick, C.; Li, Q.; Westly, D.; Ilic, B.R.; et al. Architecture for the photonic integration of an optical atomic clock. Optica 2019, 6, 680–685. [Google Scholar] [CrossRef] [Green Version]
  19. Trocha, P.; Karpov, M.; Ganin, D.; Pfeiffer, M.H.P.; Kordts, A.; Wolf, S.; Krockenberger, J.; Marin-Palomo, P.; Weimann, C.; Randel, S.; et al. Ultrafast optical ranging using microresonator soliton frequency combs. Science 2018, 359, 887–891. [Google Scholar] [CrossRef] [PubMed] [Green Version]
  20. Gaeta, A.L.; Lipson, M.; Kippenberg, T.J. Photonic-chip-based frequency combs. Nat. Photonics 2019, 13, 158–169. [Google Scholar] [CrossRef]
  21. Crespo-Ballesteros, M.; Yang, Y.; Toropov, N.; Sumetsky, M. Four-port SNAP microresonator device. Opt. Lett. 2019, 44, 3498–3501. [Google Scholar] [CrossRef] [PubMed]
  22. Wang, M.; Yang, Y.; Lu, Z.; Wang, W.; Zhang, W.; Xie, C.; Zhong, H.; Wu, L.; Wu, T.; Tan, Q.; et al. Experimental demonstration of nonlinear scattering processes in a microbottle resonator based on a robust packaged platform. J. Lightwave Technol. 2021. [Google Scholar] [CrossRef]
  23. Anashkina, E.A.; Marisova, M.P.; Andrianov, A.V.; Akhmedzhanov, R.A.; Murnieks, R.; Tokman, M.D.; Skladova, L.; Oladyshkin, I.V.; Salgals, T.; Lyashuk, I.; et al. Microsphere-based optical frequency comb generator for 200 GHz spaced WDM data transmission system. Photonics 2020, 7, 72. [Google Scholar] [CrossRef]
  24. Spolitis, S.; Murnieks, R.; Skladova, L.; Salgals, T.; Andrianov, A.V.; Marisova, M.P.; Leuchs, G.; Anashkina, E.A.; Bobrovs, V. IM/DD WDM-PON communication system based on optical frequency comb generated in silica whispering gallery mode resonator. IEEE Access 2021, 9, 66335–66345. [Google Scholar] [CrossRef]
  25. Salgals, T.; Alnis, J.; Murnieks, R.; Brice, I.; Porins, J.; Andrianov, A.V.; Anashkina, E.A.; Spolitis, S.; Bobrovs, V. Demonstration of a fiber optical communication system employing a silica microsphere-based OFC source. Opt. Express 2021, 29, 10903–10913. [Google Scholar] [CrossRef]
  26. Hu, H.; Oxenløwe, L.K. Chip-based optical frequency combs for high-capacity optical communications. Nanophotonics 2021, 10, 1367–1385. [Google Scholar] [CrossRef]
  27. Spolitis, S.; Kurbatska, I.; Bobrovs, V. Comparison of C-band and L-band WDM-PON systems performance with PAM-4 modulation format. In Proceedings of the 2017 International Workshop on Fiber Optics in Access Network (FOAN), Munich, Germany, 6–8 November 2017; pp. 1–6. [Google Scholar] [CrossRef]
  28. Spillane, S.M.; Kippenberg, T.J.; Vahala, K.J. Ultralow-threshold Raman laser using a spherical dielectric microcavity. Nature 2002, 415, 621–623. [Google Scholar] [CrossRef]
  29. Zhu, S.; Shi, L.; Ren, L.; Zhao, Y.; Jiang, B.; Xiao, B.; Zhang, X. Controllable Kerr and Raman-Kerr frequency combs in functionalized microsphere resonators. Nanophotonics 2019, 8, 2321–2329. [Google Scholar] [CrossRef] [Green Version]
  30. Suzuki, R.; Kubota, A.; Hori, A.; Fujii, S.; Tanabe, T. Broadband gain induced Raman comb formation in a silica microresonator. J. Opt. Soc. Am. B 2018, 35, 933–938. [Google Scholar] [CrossRef] [Green Version]
  31. Andrianov, A.V.; Anashkina, E.A. Raman-assisted optical frequency combs generated in a silica microsphere in two whispering gallery mode families. Laser Phys. Lett. 2021, 18, 025403. [Google Scholar] [CrossRef]
  32. Yang, Q.-F.; Yi, X.; Yang, K.Y.; Vahala, K. Stokes solitons in optical microcavities. Nat. Phys. 2017, 13, 53–57. [Google Scholar] [CrossRef] [Green Version]
  33. Gorodetsky, M.L.; Savchenkov, A.A.; Ilchenko, V.S. Ultimate Q of optical microsphere resonators. Opt. Lett. 1996, 21, 453–455. [Google Scholar] [CrossRef]
  34. Webb, K.E.; Erkintalo, M.; Coen, S.; Murdoch, S.G. Experimental observation of coherent cavity soliton frequency combs in silica microspheres. Opt. Lett. 2016, 41, 4613–4616. [Google Scholar] [CrossRef] [Green Version]
  35. Sayson, N.L.B.; Webb, K.E.; Coen, S.; Erkintalo, M.; Murdoch, S.G. Widely tunable optical parametric oscillation in a Kerr microresonator. Opt. Lett. 2017, 42, 5190–5193. [Google Scholar] [CrossRef] [Green Version]
  36. ITU-T Recommendation G.694.1, Spectral Grids for WDM Applications: DWDM Frequency Grid; Telecommunication Standardization Sector of ITU; International Telecommunication Union: Geneva, Switzerland, 2012; pp. 1–7.
  37. Andrianov, A.V.; Anashkina, E.A. Single-mode silica microsphere Raman laser tunable in the U-band and beyond. Results Phys. 2020, 17, 103084. [Google Scholar] [CrossRef]
  38. Oraevsky, A.N. Whispering-gallery waves. Quantum Electron. 2002, 32, 377–400. [Google Scholar] [CrossRef]
  39. Agrawal, G.P. Nonlinear Fiber Optics, 6th ed.; Elsevier: London, UK, 2019. [Google Scholar]
  40. Fujii, S.; Tanabe, T. Dispersion engineering and measurement of whispering gallery mode microresonator for Kerr frequency comb generation. Nanophotonics 2020, 9, 1087–1104. [Google Scholar] [CrossRef] [Green Version]
  41. Coen, S.; Erkintalo, M. Universal scaling laws of Kerr frequency combs. Opt. Lett. 2013, 38, 1790–1792. [Google Scholar] [CrossRef] [PubMed] [Green Version]
  42. Sayson, N.L.B.; Pham, H.; Webb, K.E.; Ng, V.; Trainor, L.S.; Schwefel, H.G.L.; Coen, S.; Erkintalo, M.; Murdoch, S.G. Origins of clustered frequency combs in Kerr microresonators. Opt. Lett. 2018, 43, 4180–4183. [Google Scholar] [CrossRef] [PubMed]
  43. Puzyrev, D.N.; Skryabin, D.V. Finesse and four-wave mixing in microresonators. Phys. Rev. A 2021, 103, 013508. [Google Scholar] [CrossRef]
  44. Godey, C.; Balakireva, I.V.; Coillet, A.; Chembo, Y.K. Stability analysis of the spatiotemporal Lugiato-Lefever model for Kerr optical frequency combs in the anomalous and normal dispersion regimes. Phys. Rev. A 2014, 89, 063814. [Google Scholar] [CrossRef] [Green Version]
  45. Guo, H.; Karpov, M.; Lucas, E.; Kordts, A.; Pfeiffer, M.H.P.; Brasch, V.; Lihachev, G.; Lobanov, V.E.; Gorodetsky, M.L.; Kippenberg, T.J. Universal dynamics and deterministic switching of dissipative Kerr solitons in optical microresonators. Nat. Phys. 2017, 13, 94–102. [Google Scholar] [CrossRef]
  46. Anashkina, E.A.; Bobrovs, V.; Salgals, T.; Brice, I.; Alnis, J.; Andrianov, A.V. Kerr optical frequency combs with multi-FSR mode spacing in silica microspheres. IEEE Photonics Technol. Lett. 2021, 33, 453–456. [Google Scholar] [CrossRef]
  47. Jung, H.; Gong, Z.; Liu, X.; Guo, X.; Zou, C.; Tang, H.X. Stokes and anti-Stokes Raman scatterings from frequency comb lines in poly-crystalline aluminum nitride microring resonators. Opt. Express 2019, 27, 22246–22253. [Google Scholar] [CrossRef] [PubMed]
Figure 1. (a) Simplified experimental scheme for the 1st series. (b) Numerically calculated dispersion for a silica microsphere with a diameter of 165 μm. (c) Experimental spectrum demonstrating three OFCs: near the pump and in two frequency-separated sidebands. (d) Numerically calculated gain coefficient under the strong pump approximation for a pump power of 50 mW. The dashed vertical line through (bd) indicates zero dispersion.
Photonics 08 00345 g001
Figure 2. (a,b) Intracavity CW power versus normalized detuning calculated for pump powers of 10 and 50 mW ((a) is on a magnified scale). Numerically calculated gain coefficients under the strong pump approximation as functions of pump frequency and sideband frequency for pump powers Pp = 10 mW (c) and Pp = 50 mW (d,e). For (c,d) the same colormap scale is used. For (e) colormap scales are individual for each subplot.
Photonics 08 00345 g002
Figure 3. (a) Simplified experimental scheme for the second series. (bd) The experimental spectra demonstrating frequency-tunable Raman-assisted soliton-like OFCs in the U-band as well as OFCs near the pump frequency in the C-band (and partially in the L-band in (b)) and OFCs due to four-wave mixing in the E-band (and partially in the S-band in (b)). The plateau in (bd) between ~192 and 195 THz is due to using a bandpass filter before the tapered fiber.
Photonics 08 00345 g003
Figure 4. (a) A simplified experimental scheme for the 3rd series. (b) The experimental spectrum demonstrating Raman-assisted soliton-like OFC and (c) the corresponding numerically simulated spectrum (vertical light blue lines, left axis), the spectral envelope of the Raman-assisted soliton (solid line, left axis), and the spectral phase of the Raman-assisted soliton (dash-dotted line, right axis). (d) Numerically simulated intensity distribution in the time domain. (e) Numerically simulated intensity distribution of the filtered out Raman-assisted soliton-like OFC in the time domain (solid line, left axis) and its phase (dash-dotted line, right axis). Broadband low intensity background in (b) is due to spontaneous emission from the pump laser.
Photonics 08 00345 g004
Publisher’s Note: MDPI stays neutral with regard to jurisdictional claims in published maps and institutional affiliations.

